This is a cross-post that summarises a new working paper from the Happier Lives Institute, The impact of cash transfers on subjective well-being and mental health in low- and middle-income countries: A systematic review and meta-analysis, by Joel McGuire, Anders Malthe Bach-Mortensen and Caspar Kaiser.
We know cash transfers reduce poverty, improve health and enhance education but what impact do they have on how people feel and think about their lives? Or, to ask a familiar question: does money make people happy? The literature on the link between income and subjective well-being has long lacked causal evidence - there is lots of correlational research. Luckily, there has been recent research using cash transfers in low and middle-income countries. We reviewed this evidence in a meta-analysis. We find, in short, that cash transfers have a small, positive effect on subjective well-being, one that lasts for several years.
At HLI, we search for the most cost-effective ways to improve global well-being. Cash transfers to those in low-income settings are a natural place to look: they are a simple and scalable intervention and (in part because of this) one of the most extensively studied and implemented interventions in low- and middle-income countries. This makes them a useful benchmark to compare the effectiveness of other well-being increasing opportunities against.
In this working paper, we systematically reviewed all the available literature on the effect of cash transfers on subjective well-being[1] in low- and middle-income countries.[2] We included various types of cash transfers, such as unconditional or conditional transfers, and transfers paid out in one go or monthly.
In order to assess cost-effectiveness, we need to estimate the total effect on subjective well-being. In the following summary, we briefly describe the main results in the paper that enable this analysis, and include an estimate of the total effect in terms of Well-being Adjusted Life-Years, or WELLBYs, which are explained further below.
Our search method revealed 1,147 potentially relevant studies; 38 of these were deemed relevant for our investigations and included in the analysis. We collected their results, standardized the effects and took their weighted average. The average effect was 0.10 standard deviations (95% confidence interval: 0.08-0.12), measured after an average of two years. This is shown as the black diamond at the bottom of the plot below. By the standards of social science, this is a small effect size,[3] but it's worth noting that this result is found after two years, which is an unusually long follow up period. This suggests cash transfers do make people happier and do so for a substantial length of time. The predicted interval, represented by the dashed line on either side of the black diamond, shows that 95% of future studies are expected to find cash transfers have a positive effect on subjective well-being.
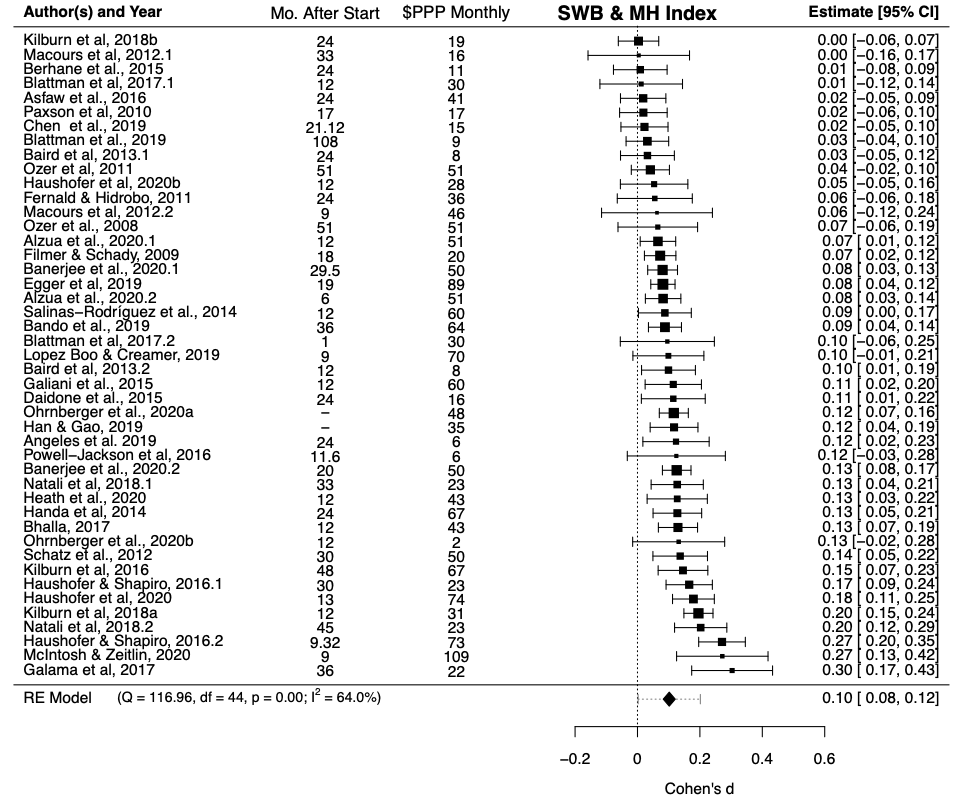
Note: ‘Mo. after start’ is the average number of months since the cash transfer began. ‘$PPP monthly’ is the average monthly value of a CT in purchasing power parity adjusted US 2010 dollars. Lump sum cash transfers were converted to monthly value by dividing the mean follow-up time by 24 months.
The cash transfers vary in several ways, including their size and whether they were paid out in one go (lump sum) or at regular intervals (stream). We attempted to control for factors such as these by conducting a meta-regression. This is a way to estimate how certain variables (such as the size of cash transfer) moderate the effect size. A meta-regression behaves similarly to a standard regression.[4] We next describe the main results from the meta-regression, which can be seen in Table 2 of the working paper. We also illustrate some of the relationships in figures below; note that the regressions on the figures do not control for other variables, unlike the results from the meta-regression (Table 2).
Firstly, and unsurprisingly, the size of a cash transfer matters! It is a statistically significant predictor of the effect size, both for absolute (the dollar value) and relative size (the proportion of previous consumption). Doubling income for a year leads to a 0.11 standard deviation increase in our subjective well-being index[5] and a transfer equivalent to a monthly value of $100 PPP received over two years[6] leads to an increase in SWB of 0.10 standard deviations (all else held equal).[7] Note that these findings may not apply to high-income countries.
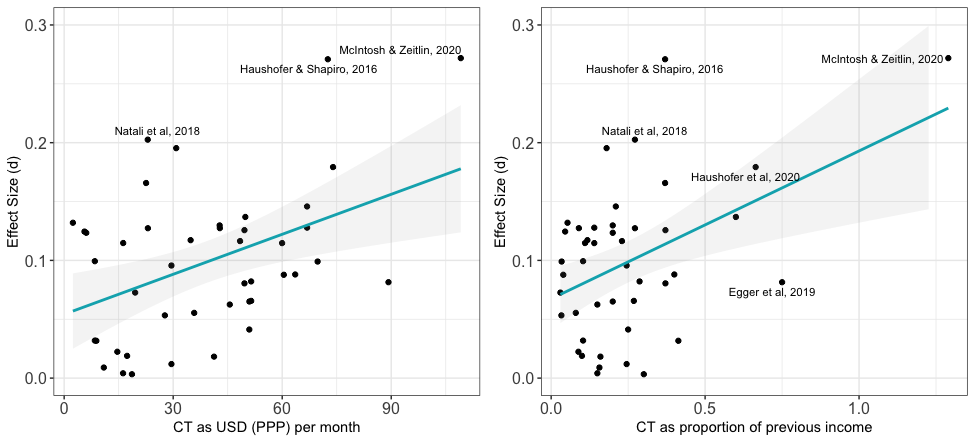
Note: effect size compared to absolute cash transfer size (left, in US dollars per month) and relative size (right, as a proportion of previous income). The blue lines are simple regressions of y against x; see Table 2 in the paper for the full results.
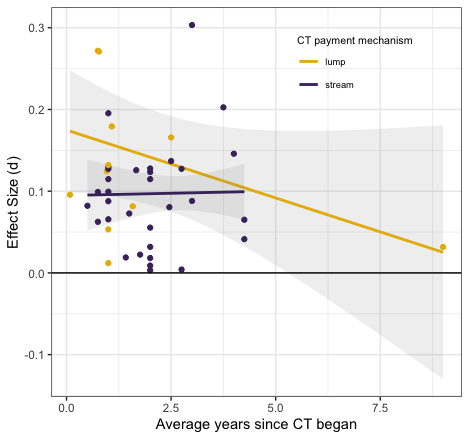
Secondly, we investigated the duration of the effects. The figure below shows the data for lump sum and stream cash transfers in yellow and purple, respectively, and a simple regression of effect size against time for each. The vast majority of data was collected less than three years after the transfers began. Only one study has a follow-up after five years. We find that there is a decay through time, whereby the average effect would reach zero after approximately seven years have passed since the transfer started, assuming a linear decay with time (see Models 3 & 4 in Table 2 in the paper).[8] We also conduct the analyses on lump sum and streams cash transfers separately; in these cases we do not detect a statistically significant decay, which may be due to low power. More data of the long-run effect of cash transfers would improve this analysis.
Thirdly, as the figure below suggests and our analysis confirms (see Model 1, Table 2), cash transfers have a greater effect (0.04 standard deviations, or nearly half the average effect size) on life satisfaction than depression. Results for happiness are less clear, but appear to be intermediate between depression and life satisfaction.
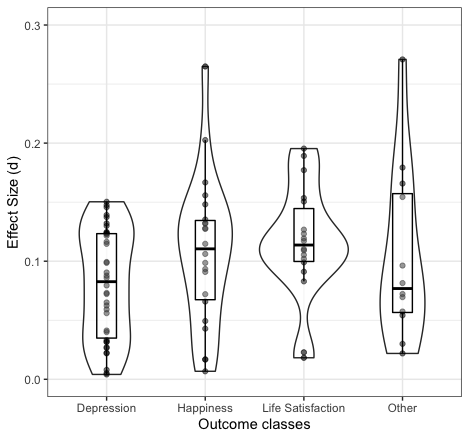
Note: This figure shows the effect size for each study as circles, grouped by type of outcome. A box plot for each outcome shows the values of the median, first and third quartiles. The surrounding violin plots illustrate the density of data points on the y-axis.
We also tested if the study’s design, continent, or conditionality influenced the magnitude of the effect. We only found that conditionality had a significant effect: conditional cash transfers had a considerably smaller impact on SWB (-0.040 SDs).
Finally, we do not detect a significant spillover effect, that is an effect on non-recipients in other households in the same community. This result is important as a potential concern about cash transfers, one emphasised by Plant (2019, p230), is that transfers might increase recipients’ well-being at the cost of making non-recipients worse off, thereby reducing their overall effectiveness. However, we note only four of the studies included a measure of spillovers to the community.
What does all this imply for our understanding of the total impact a $1,000 cash transfer, given to someone in global poverty, would have on their well-being? We use the unit of a WELLBY to answer this, defined as an increase of one subjective well-being point (on a 0-10 scale) for one year.[9] We estimate that the total effect over time is 0.38 standard deviations, or roughly 0.87 WELLBYs.[10][11]
We don’t know of any reviews of a similar intervention (i.e. a ‘micro’-intervention in low-income countries) that allows us to compare the total impact on subjective well-being. However, our future work aims to fill this gap, by reviewing evidence on the effects from interventions such as cataract surgery and group therapy.
Our study has several limitations, most notably that the evidence is thin (with only four studies) on spillovers to other members of the community, and in the long run (greater than five years). There is no data on the effect on other members of the recipient’s household. Some general caveats are (1) that insignificant results do not mean an effect does not exist -- it could be too small to detect given our sample size and (2) this effect only pertains to similar populations (the very poor in low- and middle-income countries).
This review provides strong evidence that cash transfers improve the subjective well-being of people in low-income contexts. Our estimate of the total effect on well-being is novel, and we encourage future studies to make similar estimates in order to compare the cost-effectiveness of different health and development interventions.
We regarded questions that asked about life satisfaction, happiness or cheerfulness as subjective well-being. Subjective well-being measures tend to assess how someone is doing overall, sometimes including separate measures of positive and negative mental states. We therefore considered mental health questionnaires which asked about affective or mood disorders as proxies for the negative affect aspect of subjective well-being. The "measures" column of Table A4 in the paper includes all included measures. ↩︎
We included experimental and quasi-experimental study designs, published since the year 2000. ↩︎
Cohen (1992) established the convention that small = 0.2, moderate = 0.5 and large = 0.8. ↩︎
One way that a meta-regression is different to a standard regression is that individual studies are used as data points, rather than individual people. Another difference is that studies are weighted by their precision, so generally, larger studies have a greater influence than smaller studies. Meta-regressions also allow for within study and in the case of random effects meta-regression, between study variability. ↩︎
As mentioned in Footnote 1, we include many outcome metrics in the overall effect size index, including life satisfaction, happiness and mental health outcomes that measure affective states. ↩︎
Stream CTs were received for an average of two years, and this is the period we assumed a lump CT was consumed in. ↩︎
A $120 monthly value would double household income for the year and lead to a 0.12 standard deviation effect on SWB. ↩︎
This is consistent with the result even when removing the follow-up at nine years, or using the decay for studies with multiple follow-ups. ↩︎
As noted previously, this index includes life satisfaction, happiness, and measures of mood disorders. ↩︎
Using a standard deviation of 2.3, as we did previously (see cell 4 in our previous model. ↩︎
This is notably less than our earlier estimate of ~1.6 WELLBYs for the individual, where WELLBYs were in terms of life satisfaction points. Given the significant difference in effect for life satisfaction and depression outcomes, our estimate here is likely an underestimate, as compared to our previous estimate. We plan to investigate the effect of different subjective well-being metrics in due course. Further, previously we considered GiveDirectly cash transfers only, but, for example, here we include conditional as well as unconditional cash transfers, which also suggests this is an underestimate. We expect to update our earlier estimate in future, based on the information from this meta-analysis. ↩︎
Credits

This research was produced by the Happier Lives Institute.
If you like our work, please consider subscribing to our newsletter.
You can also follow us on Facebook, Twitter, and LinkedIn


Thanks for posting that. I'm really excited about HLI's work in general, and especially the work on the kinds of effects you are trying to estimate in this post!
I personally don't have a clear picture of how much $ / WELLBY is considered good (whereas GiveWell's estimates for their leading charities is around 50-100 $ / QALY). Do you have a table or something like that on your website, summarizing your results for charities you found to be highly effectively, for reference?
Thanks again!
Hello,
Glad to hear you're excited!
Unfortunately, we do not have a clear picture yet of how many WELLBYs per dollar is a good deal. Cash transfers are the first intervention we (and I think anyone) have analyzed in this manner. Figuring this out is my priority and I will soon review the cost effectiveness of other interventions which should give more context. To give a sneak peak, cataracts surgery is looking promising in terms of cost effectiveness compared to cash transfers.
I see, thanks for the teaser :)
I was under the impression that you have rough estimate for some charities (e.g. StrongMinds). Looking forward to see your future work on that.
Those estimates are still in the works, but stay tuned!
I realized my previous reply might have been a bit misleading so I am adding this as a bit of an addendum.
There are previous calculations which include WELLBY like calculations such as Michael's comparison of StrongMinds to GiveDirectly in his 2018 Mental Health cause profile or in Origins of Happiness / Handbook for WellBeing Policy Making in the UK. Why do we not compare our effects to these previous efforts? Most previous estimates looked at correlational effects and give no clear estimate of the total effect through time.
An aside follows: An example of these results communicated well is Micah Kaats thesis (which I think was related to HRI's WALY report). They show the relationship of different maladies to life satisfaction and contextualize it with different common effects of life events.
Moving from standard deviations to points on a 0-11 scale is a further difficulty.
Something else worth noting is that different estimation methods can lead to systematically different effect sizes.In the same thesis, Kaats shows that fixed effects model tend to have lower effects.
While this may make it seem as if the the non fixed effects estimates are over-estimates. That's only if you "are willing to assume the absence of dynamic causal relationships" -- whether that's reasonable will depend on the outcome.
As Michael did in his report with StrongMinds, and Clark et al., did for two studies (moving to a better neighborhood and building cement floors in Mexico -- p. 207) in Origins of happiness, there have been estimates of cost effectiveness that take duration of effects into consideration, but they address only single studies. We wish to have a good understanding of evidence base as a whole before presenting estimates.
To further explain this last point, I have the view that the more scrutiny is applied to an effect the more it diminishes (can't cite a good discussion of this at the moment). Comparing the cost effectiveness of a single study to our synthesis could give the wrong impression. In our synthesis we try hard to include all the relevant studies where it's plausible that the first study we come across of an alternative well-being enhancing intervention is exceptionally optimistic in its effects.
Just on the different effect sizes from different methods, where do/would RCT methods fit in with the four discussed by Kaats?
FWIW, I agree that a meta-analysis of RCTs isn't a like-for-like to a single RCT. That said, when(if?) we exhaust the existing SWB literature relevant t cost-effectiveness we should present everything we find (which shouldn't hard as there's not much!).
Thank you for following up and clarifying that.