Comments
Summary
- I studied the dispersion in the predictions for the extinction risk from 2023 to 2100 made in the Existential Risk Persuasion Tournament (XPT).
- I was most surprised by some forecasters having predicted a risk of exactly 0:
- For extinction, 3.18 % (5/157).
- For AI extinction, 4.29 % (7/163).
- For nuclear extinction, 6.21 % (10/161).
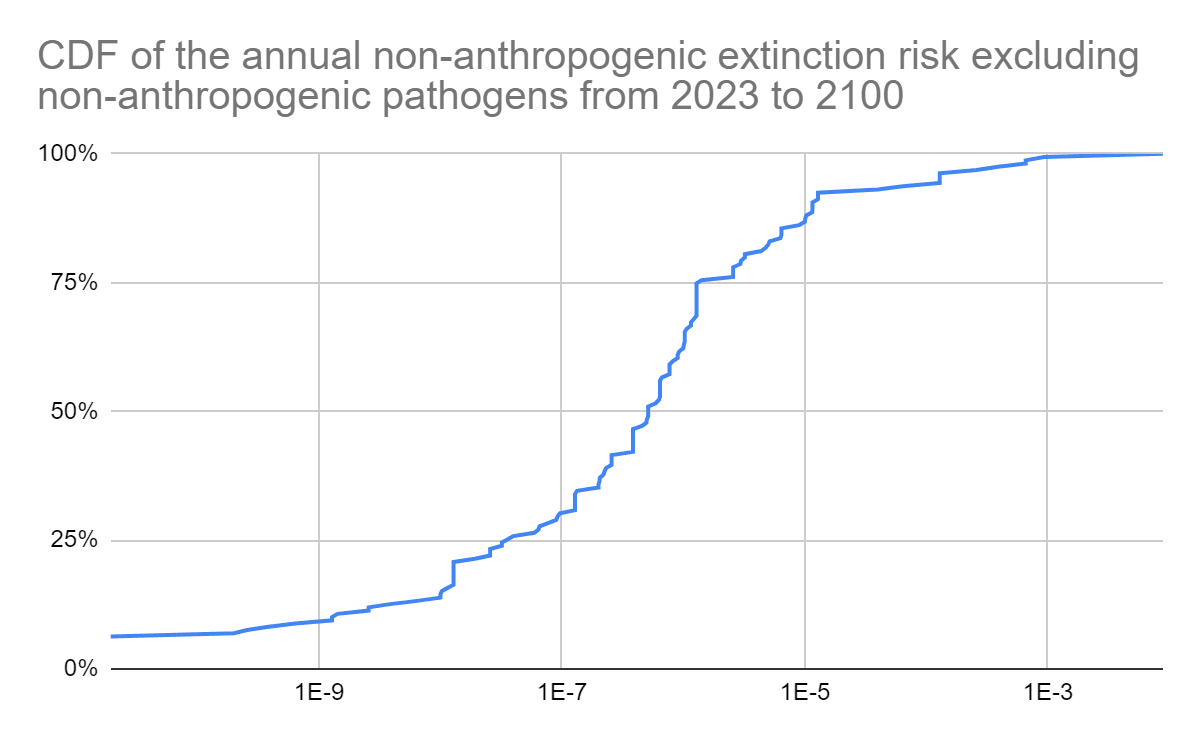
- Non-anthropogenic extinction excluding non-anthropogenic pathogens, 5.66 % (9/159).
Methods
I analysed XPT’s data to study the dispersion in the predictions for the extinction risk from 2023 to 2100. I calculated the annual extinction risk from 2023 to 2100 from 1 - (1 - “extinction risk from 2023 to 2100”)^(1/78), where 78 (= 2100 - 2023 + 1) is the number of years from the start of 2023 to the end of 2100. I excluded (nonsensical) predictions of exactly 0 risk in my aggregates.
Results
The calculations are in this Sheet.
Statistics
| Statistic | Annual risk from 2023 to 2100 | |||
| Extinction | AI extinction | Nuclear extinction | Non-anthropogenic extinction excluding non-anthropogenic pathogens[1] | |
| Number of values | 157 | 163 | 161 | 159 |
| Minimum excluding zeros | 1.28*10^-13 | 1.28*10^-13 | 1.28*10^-14 | 1.92*10^-11 |
| 5th percentile excluding zeros | 1.27*10^-7 | 1.21*10^-8 | 8.97*10^-8 | 1.94*10^-9 |
| Median excluding zeros | 0.0287 % | 0.0129 % | 0.00128 % | 6.41*10^-7 |
| 95th percentile excluding zeros | 0.857 % | 0.593 % | 0.0517 % | 0.0129 % |
| Maximum | 4.04 % | 3.19 % | 0.885 % | 0.885 % |
| Mean excluding zeros | 0.165 % | 0.120 % | 0.0208 % | 0.00840 % |
| Geometric mean excluding zeros | 0.0136 % | 0.00548 % | 9.37*10^-6 | 4.69*10^-7 |
| Probability linked to the geometric mean of odds excluding zeros | 0.0136 % | 0.00548 % | 9.37*10^-6 | 4.69*10^-7 |
| Ratio between the 95th percentile excluding zeros and 5th percentile excluding zeros | 67.6 k | 489 k | 5.76 k | 66.5 k |
Ratio between the highest and lowest typical aggregate[2] | 12.2 | 21.8 | 22.2 | 179 |
| Number of null values | 5 | 7 | 10 | 9 |
| Number of null values as a fraction of the number of values | 3.18 % | 4.29 % | 6.21 % | 5.66 % |
| Number of null values from superforecasters | 5 | 6 | 8 | 6 |
| Number of null values from superforecasters as a fraction of the number of null values | 100 % | 85.7 % | 80.0 % | 66.7 % |
Ordered predictions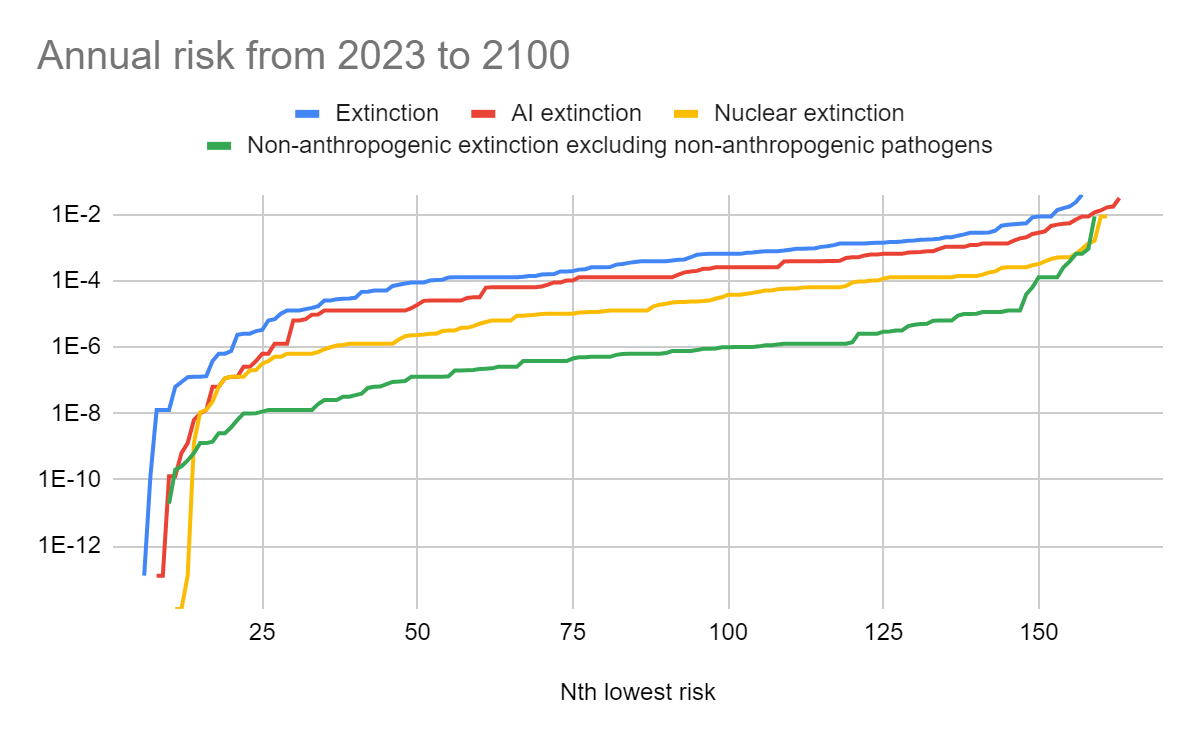
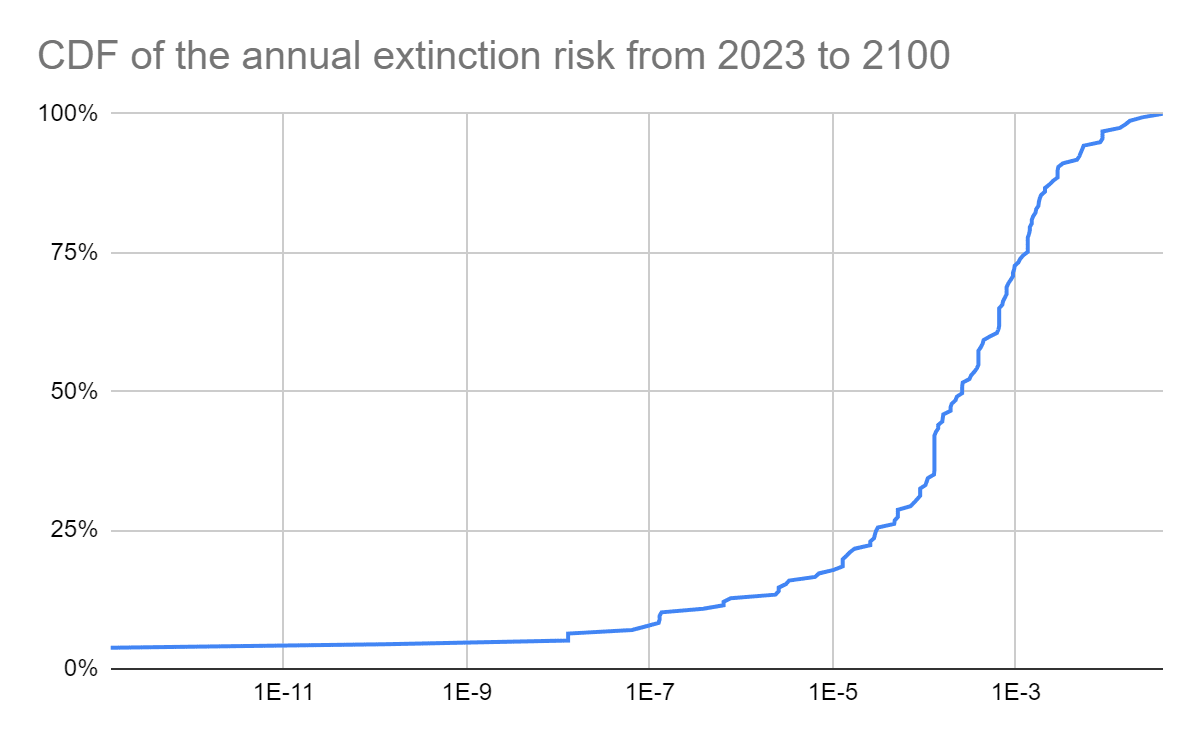
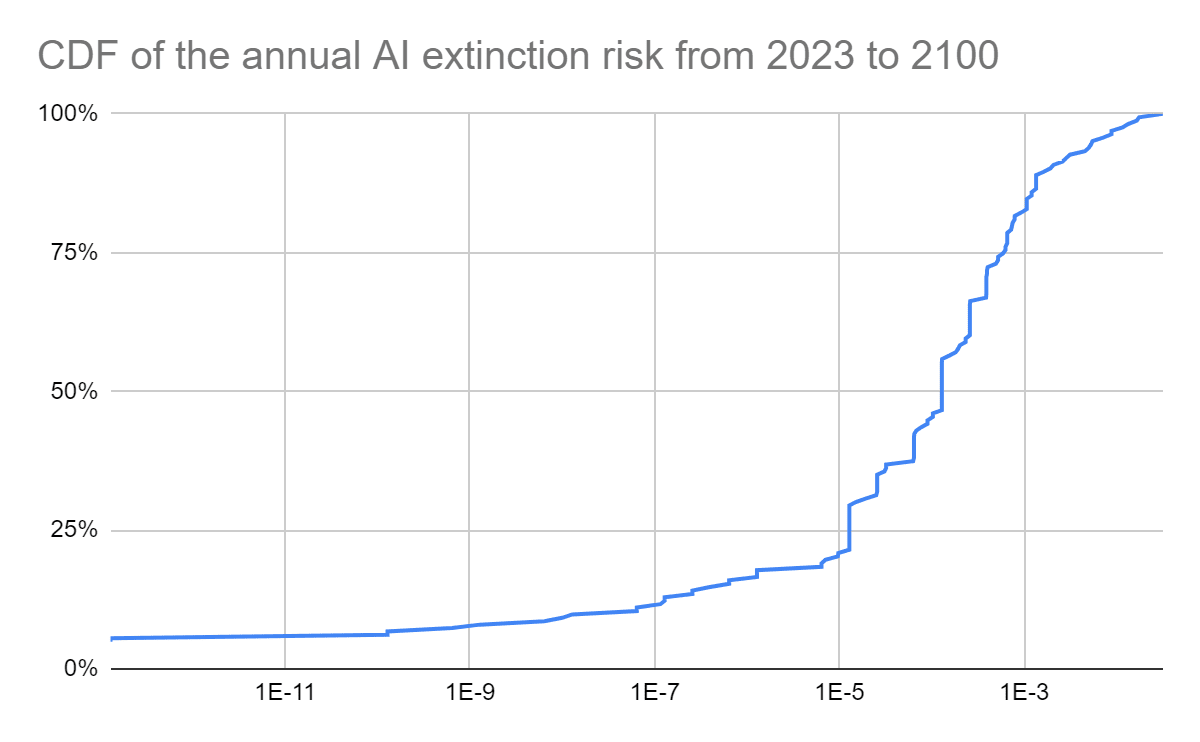
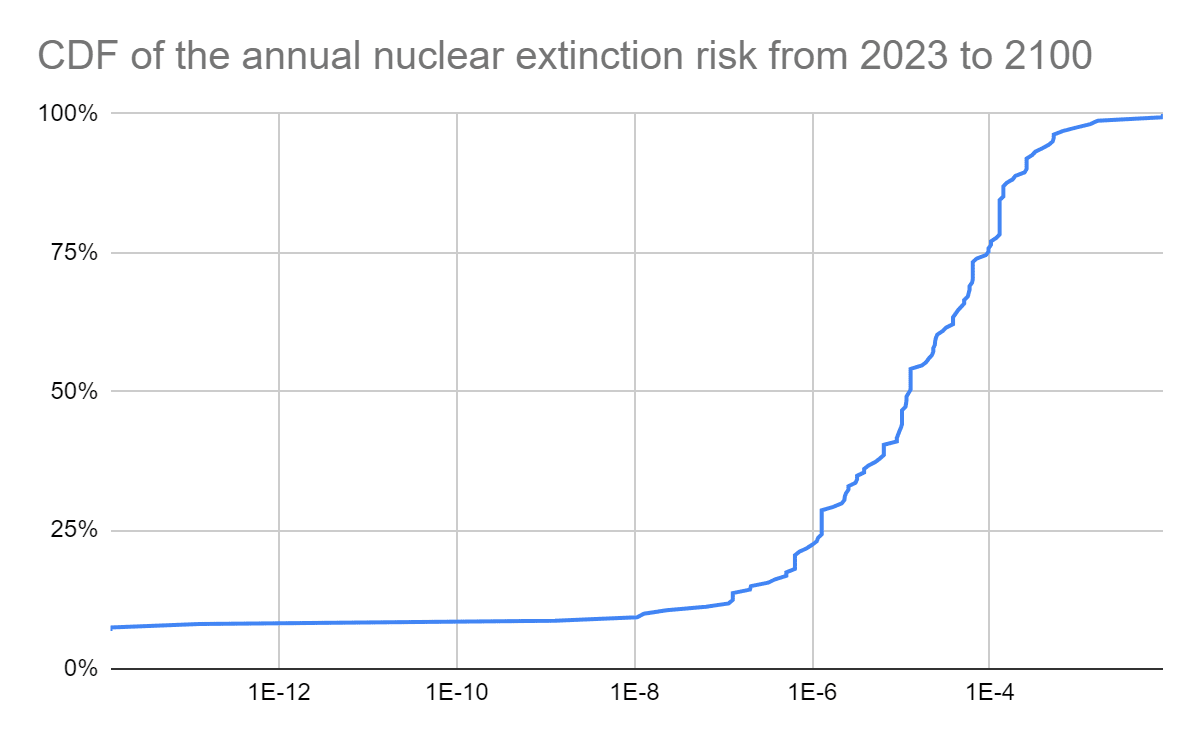
Cumulative distribution functions (CDFs)
Discussion
Here are my thoughts:
- There is great dispersion in the annual extinction risk from 2023 to 2100. Across the 4 categories[3], the ratio between the 95th percentile excluding zeros and 5th percentile excluding zeros ranges from 66.5 k to 489 k.
- The level of optimism/pessimism matters much more than which typical aggregation method one picks[2]. The ratio between the highest and lowest typical aggregate ranges from 12.2 to 179, which is a much narrower interval than the one I mentioned just above.
- As expected, for the same degree of optimism/pessimism, AI extinction risk is predicted to be higher than nuclear extinction risk, and this is predicted to be higher than non-anthropogenic extinction risk excluding non-anthropogenic pathogens[4] (see 1st graph).
- There are some predictions of astronomically low annual extinction risk from 2023 to 2100. The 5th percentile excluding zeros ranges from 1.94*10^-9 to 1.27*10^-7.
- The typical aggregates for the annual nuclear extinction risk from 2023 to 2100 range from 9.37*10^-6 to 0.0208 %, i.e. from 1.58 M (= 9.37*10^-6/(5.93*10^-12)) to 35.1 M (= 2.08*10^-4/(5.93*10^-12)) times mine of 5.93*10^-12[5]. However:
- Unsurprisingly, there are some predictions lower than mine.
- 13 predictions, corresponding to 8.07 % (= 13/161) of the total, were no larger than 1.28*10^-13.
- Surprisingly, there are some predictions of exactly 0 risk in each of the 4 categories, most of which were made by superforecasters. .
- These predictions are not reasonable because one cannot be infinitely confident that humans will not go extinct. Accordingly, I excluded predictions of exactly 0 risk from my aggregates.
- Yet, I suppose forecasters predicting an exactly 0 extinction risk just meant it is astronomically low rather than null.
- Somewhat intriguingly, the geometric mean excluding zeros and probability linked to the geometric mean of odds excluding zeros of the annual AI extinction risk from 2023 to 2100 are only 40.3 % (= 5.48*10^-5/(1.36*10^-4)) of the same statistics for (total) extinction risk.
- Interestingly, but arguably not importantly, the 5th percentile excluding zeros of the annual nuclear extinction risk from 2023 to 2100 is 7.41 (= 8.97*10^-8/(1.21*10^-8)) times the same statistic for AI extinction risk. In other words, a very optimistic non-null nuclear extinction risk is higher than a very optimistic non-null AI extinction risk.
Acknowledgements
Thanks to Molly Hickman for feedback on the draft.
- ^
Non-anthropogenic pathogens are excluded here in agreement with footnote 36 of XPT’s report. “The resolution details for this question explicitly exclude non-anthropogenic pathogens”.
- ^
Typical aggregate here respects the median, mean, geometric mean, or probability linked to the geometric mean of odds, all excluding zeros.
- ^
Extinction, AI extinction, nuclear extinction risk, and non-anthropogenic extinction risk excluding non-anthropogenic pathogens. There were no questions about the extinction risk from engineered and non-engineered pathogens in the main tournament due to concerns about information hazards among its funders.
24


I think it would be informative to also report predicted total extinction risk to 2100, I find annual extinction risk harder to think about.
Thanks, Michael. I have now added to the sheet stats and graphs about the total risk from 2023 to 2100.