Comments
Summary
- I previously estimated astronomically low annual probabilities of a terrorist attack and war causing human extinction, using Python’s library fitter to fit SciPy’s 111 types of distributions to historical terrorist attack and war deaths as a fraction of the global population. My analyses of wars was based on Correlates of War’s (CoW’s) data from 1816 to 2014. In this post, I run a similar analysis, but fitting the distributions to Conflict Catalog’s data from 1400 to 2000.
- In addition, I fit Pareto distributions to increasingly rightmost sections of the tail distribution of the annual conflict deaths as a fraction of the global population. In each of my previous analyses and the one described above, the distributions are fitted to the same section of the right tail, so I wanted to understand the effect of fitting distributions to increasingly rightmost sections of the tail.
- The expected damage from conflicts is very concentrated in the most severe ones, with 98.8 % of the annual conflict deaths as a fraction of the global population coming from ones whose such fraction is at least 0.01 %.
- There has been a slight downwards trend in the logarithm of the annual conflict deaths as a fraction of the global population, with the coefficient of determination (R^2) of the linear regression of it on the year being 8.45 %.
- In agreement with my past analyses on terrorist attacks and wars, the median annual probability of a conflict causing human extinction across fitter’s best fit distributions is 0. Also in line with those analyses, the results are quite sensitive to the type of distribution, with the 95th percentile being a way too high 5.02 %.
- The great variation of the results I got based on fitter makes me put much more weight on the Pareto distributions fitted to increasingly rightmost sections of the tail distribution. The tail distribution starts to decay abruptly for annual conflict deaths as a fraction of the global population greater than around 0.1 %. So the annual probability of a conflict causing human extinction predicted by the Pareto distributions quickly becomes astronomically low when they are fitted to such rightmost sections of the tail.
- I believe one should place more weight on points further in the right tail to predict extinction risk. So I would say my results suggest yet again an astronomically low prior annual probability of a conflict causing human extinction.
Introduction
I previously estimated astronomically low annual probabilities of a terrorist attack and war causing human extinction, using Python’s library fitter to fit SciPy’s 111 types of distributions to historical terrorist attack and war deaths as a fraction of the global population. My analyses of wars was based on CoW’s data on annual war deaths of combatants due to fighting, disease, and starvation. In this post, I run a similar analysis, but fitting the distributions to Our World in Data’s (OWID’s) data on annual conflict deaths as a fraction of the global population, which is based on Conflict Catalog’s data collected by Peter Brecke. I think this has 3 advantages relative to CoW’s:
- It includes deaths due to fighting, disease, and starvation of not only combatants, but also civilians. So there is no need to guess the ratio between the total deaths and those of combatants.
- It goes from 1400 to 2000, covering 601 years (= 2000 - 1400 + 1), i.e. 3.02 times (= 601/199) as many as the 199 years (= 2014 - 1816 + 1) covered by CoW’s, which goes from 1816 to 2014.
- Less importantly, it accounts for political disagreements between organised groups, or between an organized group and civilians that cause at least 32 deaths during a year. CoW’s is less inclusive, accounting only for wars that cause at least 1 k deaths during a year.
The disadvantage of using Conflict Catalog’s data is that it “provides an incomplete record – particularly for the distant past and outside of Europe”. Nonetheless, I corrected for this preprocessing the data.
In addition, I fit Pareto distributions to increasingly rightmost sections of the tail distribution of the annual conflict deaths as a fraction of the global population.
- In each of my previous analyses and the one described above, the distributions are fitted to the same section of the right tail, so I wanted to understand the effect of fitting distributions to increasingly rightmost sections of the tail.
- I focus on Pareto distributions for simplicity, and because these are arguably the most commonly used to model tail risk.
- One could argue they have overly thin tails due the possibility of dragon kings, i.e. flatter sections of the right tail (in the unobserved domain), but I assume steep sections cannot be ruled out either.
- Consequently, I suppose Pareto distributions still offer a good prior.
Methods
Preprocessing
I assume OWID’s data underestimate the annual conflict deaths as a fraction of the global population due to Conflict Catalog’s data providing an incomplete record. Peter was kind enough to share his thoughts on how to adjust the data:
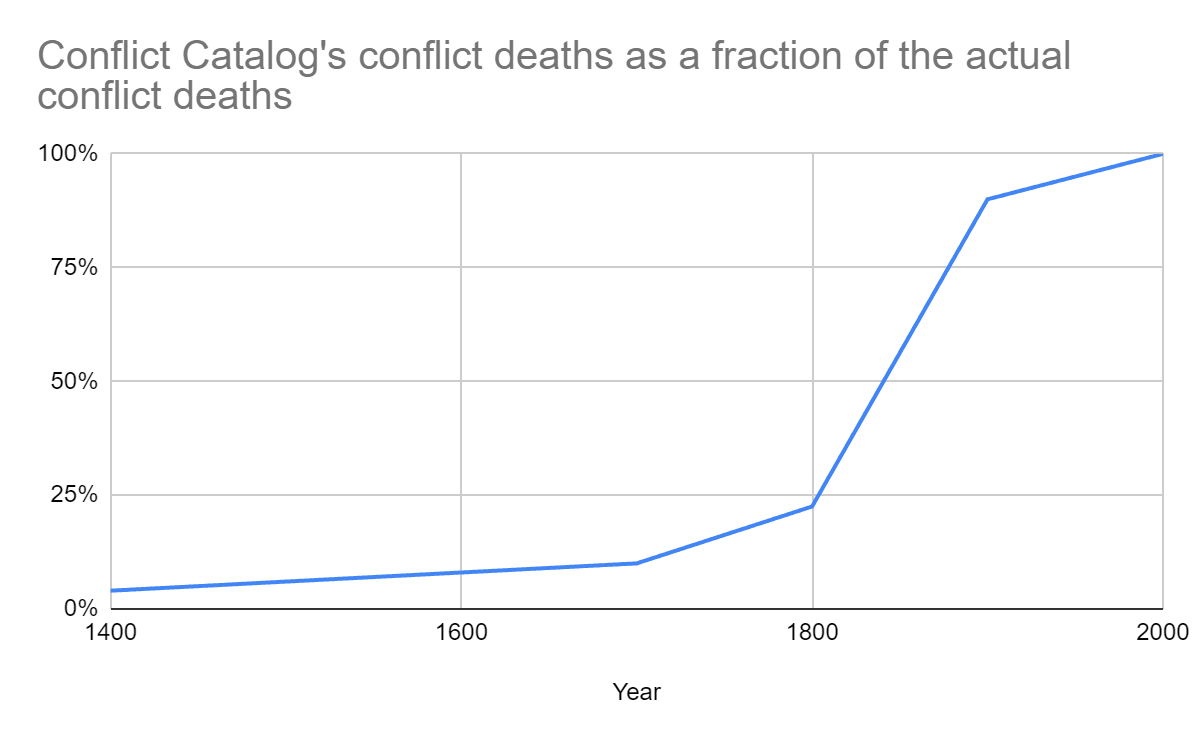
If I had to guess because there was a gun to my head [[1]], I would estimate the share [reported annual conflict deaths as a fraction of the actual annual conflict deaths] to be about .03 to .05 in 1400 and rising only slowly until the 1700s when it would start to rise more quickly going from about .1 to .2 or possibly .25. Then in the 1800s it would begin to rise rapidly, reaching .9 by 1900, and then in the 20th century rise up to 1.
Please note that this is not much better than a wild-assed guess [which is fine, says Vasco].
In agreement with the above, I suppose the ratio between the Conflict Catalog’s and actual annual conflict deaths is a piecewise linear function defined by the following values:
- In 1400, 4 % (= (0.03 + 0.05)/2).
- In 1700, 10 %.
- In 1800, 22.5 % (= (0.2 + 0.25)/2).
- In 1900, 90 %.
- In 2000, 100 %.
Peter also said I could determine the ratio as follows:
Alternatively, count the number of conflicts with fatality data for each decade and divide that by the number of conflicts for that decade.
I suspect this approach would be more noisy, so I went ahead with the function defined based on Peter’s guesses.
Fitting all types of distribution to the right tail
As in my previous analyses, I rely on fitter to find the distributions which best fit the top 10 % annual conflict deaths as a fraction of the global population. I only analysed the top 10 %, respecting 0.175 % to 0.630 % annual conflict deaths as a fraction of the global population, because I am interested in the right tail, which is the relevant part of the distribution to estimate the probability of human extinction.
fitter tries all the types of distributions in SciPy, 111 on 20 May 2024. For each type of distribution, the best fit is that with the lowest residual sum of squares (RSS), respecting the sum of the squared differences between the predicted and baseline PDF. I set the number of bins to define the baseline PDF to the ceiling of the square root of the number of data points[2], and left the maximum time to find the best fit parameters to the default value in fitter of 30 s.
I estimated the probability of the annual conflict deaths as a fraction of the global population being at least 10^-7, 10^-6, …, and 100 % (human extinction) multiplying:
- 10 %, which is the probability of the annual conflict deaths of combatants being in the right tail.
- Probability of the annual conflict deaths as a fraction of the global population being at least 10^-7, 10^-6, …, and 100 % if they are in the right tail, which I got using the best fit parameters outputted by fitter.
Fitting Pareto distributions to various sections of the right tail
I fit Pareto distributions to the 2, 3, … and 601 years with the most annual conflict deaths as a fraction of the global population. To do this:
- I get the slope and intercept of linear regressions of the logarithm of (sections of) the tail distribution on the logarithm of the annual conflict deaths as a fraction of the global population.
- Since the tail distribution of a Pareto distribution is P(X > x) = (“minimum”/x)^“tail index”, ln(P(X > x)) = “tail index”*ln(“minimum”) - “tail index”*ln(x) = “intercept” + “slope”*ln(x), so I determine the parameters of the Pareto distributions from:
- “Tail index” = -“slope”.
- “Minimum” = e^(“intercept”/“tail index”).
Then I obtain the annual probability of a conflict causing extinction from that of annual conflict deaths exceeding the global population, which is P(X > 1) = “minimum”^“tail index”. This decreases with the tail index, given the minimum of each Pareto distribution is lower than 1.
Results
The calculations are in this Sheet and this Colab, and the results are in the Sheet.
Historical annual conflict deaths as a fraction of the global population
Preprocessing
Basic stats
| Statistic | Annual conflict deaths as a fraction of the global population |
| Mean | 0.0906 % |
| Minimum | 1.10*10^-6 |
| 5th percentile | 0.00143 % |
| 10th percentile | 0.00404 % |
| Median | 0.0322 % |
| 90th percentile | 0.215 % |
| 95th percentile | 0.597 % |
| Maximum | 0.992 % |
Linear regression of the logarithm of the annual conflict deaths as a fraction of the global population on the year
| Slope (1/year) | Intercept | Coefficient of determination |
| -0.00279 | -3.40 | 8.45 % |
Risk by severity
| Annual conflict deaths as a fraction of the global population | Years | Years as a fraction of the total | Conditional annual conflict deaths as a fraction of the global population | Unconditional annual conflict deaths as a fraction of the global population | Unconditional annual conflict deaths as a fraction of the global population as a fraction of the total | |
| Minimum | Maximum | |||||
| 0 | Infinity | 601 | 100 % | 0.0906 % | 0.0906 % | 100 % |
| 0 | 0.001 % | 24 | 3.99 % | 4.01*10^-6 | 1.60*10^-7 | 0.0177 % |
| 0.001 % | 0.01 % | 117 | 19.47 % | 0.00552 % | 0.00108 % | 1.19 % |
| 0.01 % | 0.1 % | 328 | 54.6 % | 0.0382 % | 0.0208 % | 23.0 % |
| 0.1 % | 1 % | 132 | 22.0 % | 0.313 % | 0.0687 % | 75.8 % |
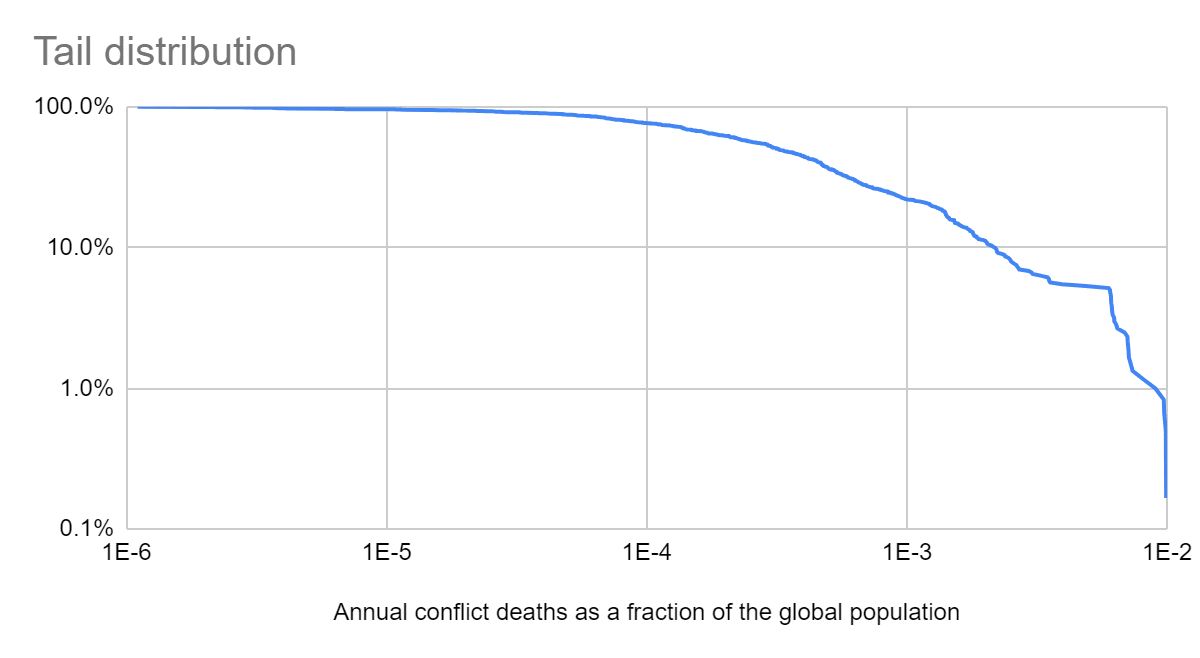
Tail distribution
Conflict tail risk
Fitting all types of distribution to the right tail
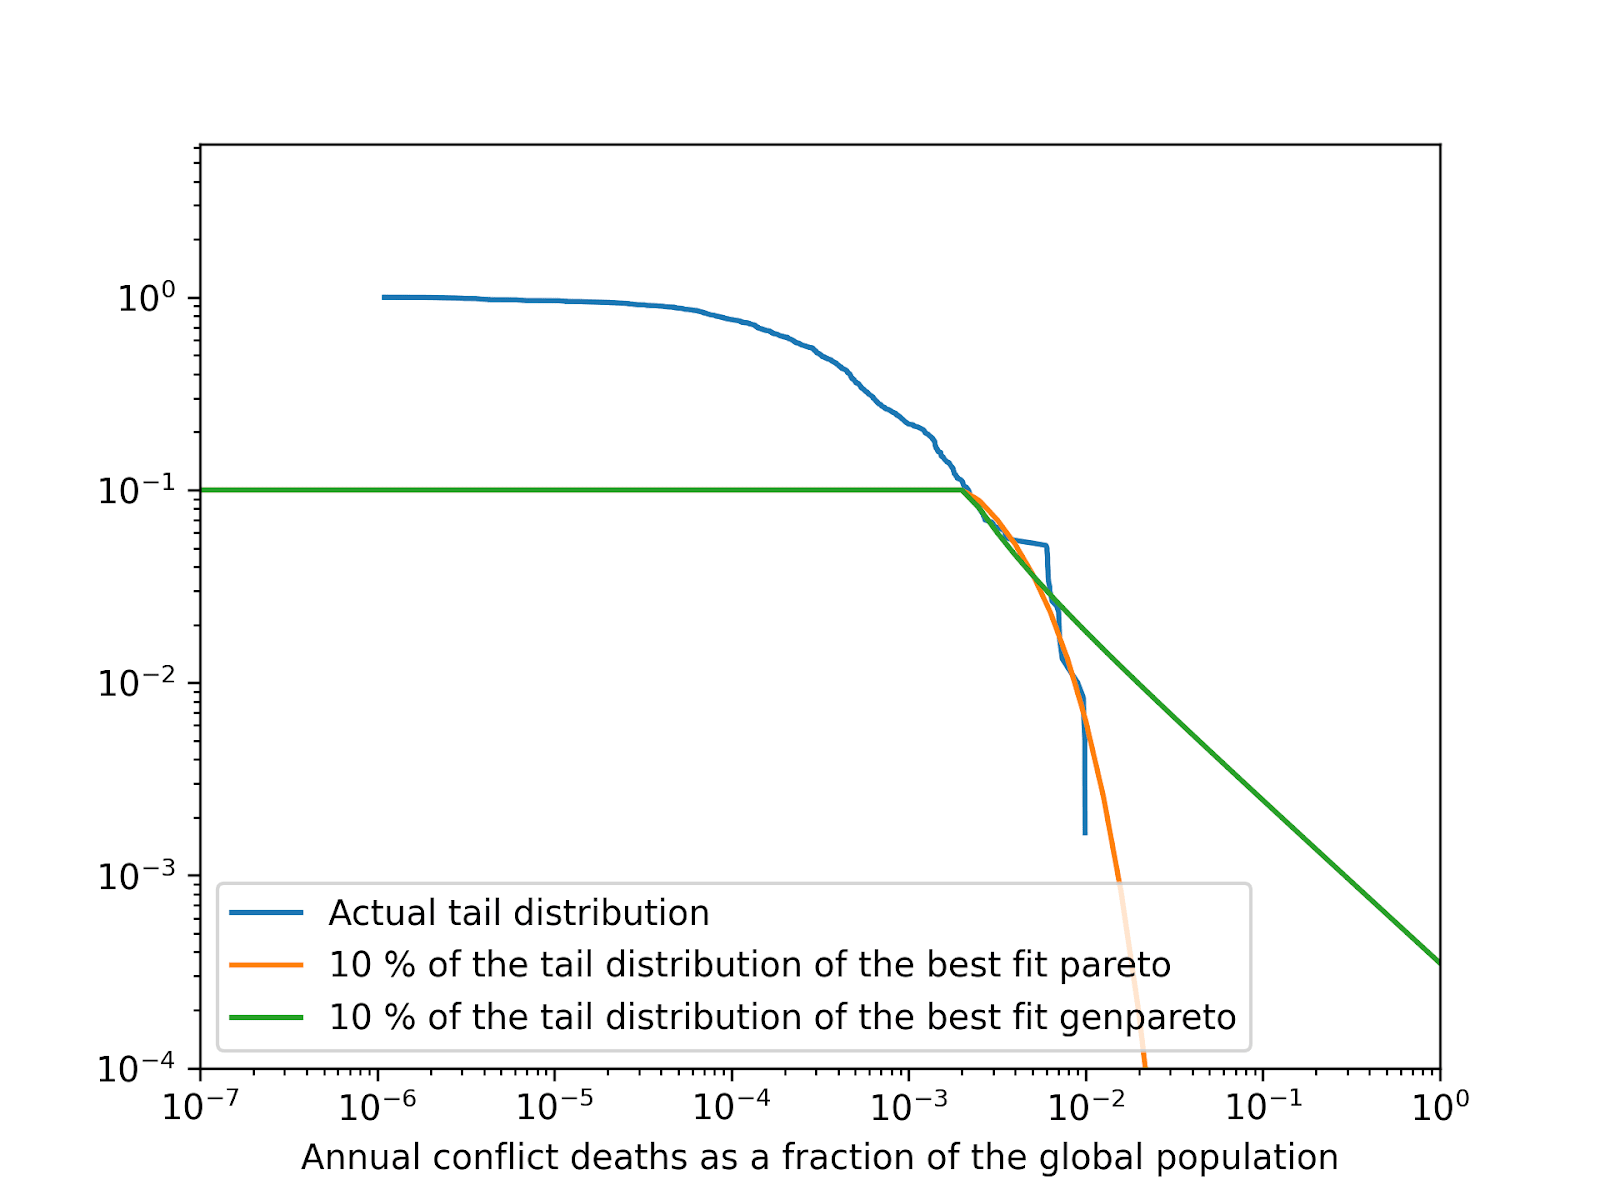
Below are the Pareto’s, generalised Pareto’s[3], mean, 5th percentile, median and 95th percentile RSS, R^2[4], and probability of the annual conflict deaths as a fraction of the global population being at least 10^-7, 10^-6, …, and 100 % (human extinction). Null values may be exactly 0 if they concern bounded distributions, or just sufficiently small to be rounded to 0 due to finite precision.
I also show the tail distribution of the actual data, and 10 % of the tail distributions of the best fit Pareto and generalised Pareto[5]. Extreme value theory (EVT) suggests the right tail should follow a generalised Pareto.
| Statistic | RSS | R^2 |
| Pareto’s | 9.39*10^4 | 0.637 |
| Generalised Pareto’s | 7.79*10^4 | 0.699 |
| Mean | 1.27*10^5 | 0.501 |
| 5th percentile | 7.67*10^4 | 0.210 |
| Median | 1.15*10^5 | 0.556 |
| 95th percentile | 2.05*10^5 | 0.704 |
| Statistic | Probability of the annual conflict deaths as a fraction of the global population being at least... | |||
| 10^-7 | 10^-6 | 0.001 % | 0.01 % | |
| Pareto’s | 10.0 %[6] | 10.0 % | 10.0 % | 10.0 % |
| Generalised Pareto’s | 10.0 % | 10.0 % | 10.0 % | 10.0 % |
| Mean | 9.83 % | 9.83 % | 9.83 % | 9.83 % |
| 5th percentile | 9.43 % | 9.43 % | 9.43 % | 9.41 % |
| Median | 10.0 % | 10.0 % | 10.0 % | 10.0 % |
| 95th percentile | 10.0 % | 10.0 % | 10.0 % | 10.0 % |
| Statistic | Probability of the annual conflict deaths as a fraction of the global population being at least... | |||
| 0.1 % | 1 % | 10 % | 100 % | |
| Pareto’s | 10.0 % | 0.636 % | 1.22*10^-16 | 0 |
| Generalised Pareto’s | 10.0 % | 1.84 % | 0.246 % | 0.0350 % |
| Mean | 9.78 % | 1.35 % | 0.696 % | 0.592 % |
| 5th percentile | 9.14 % | 0 | 0 | 0 |
| Median | 10.0 % | 0.517 % | 0 | 0 |
| 95th percentile | 10.0 % | 7.17 % | 5.89 % | 4.92 % |
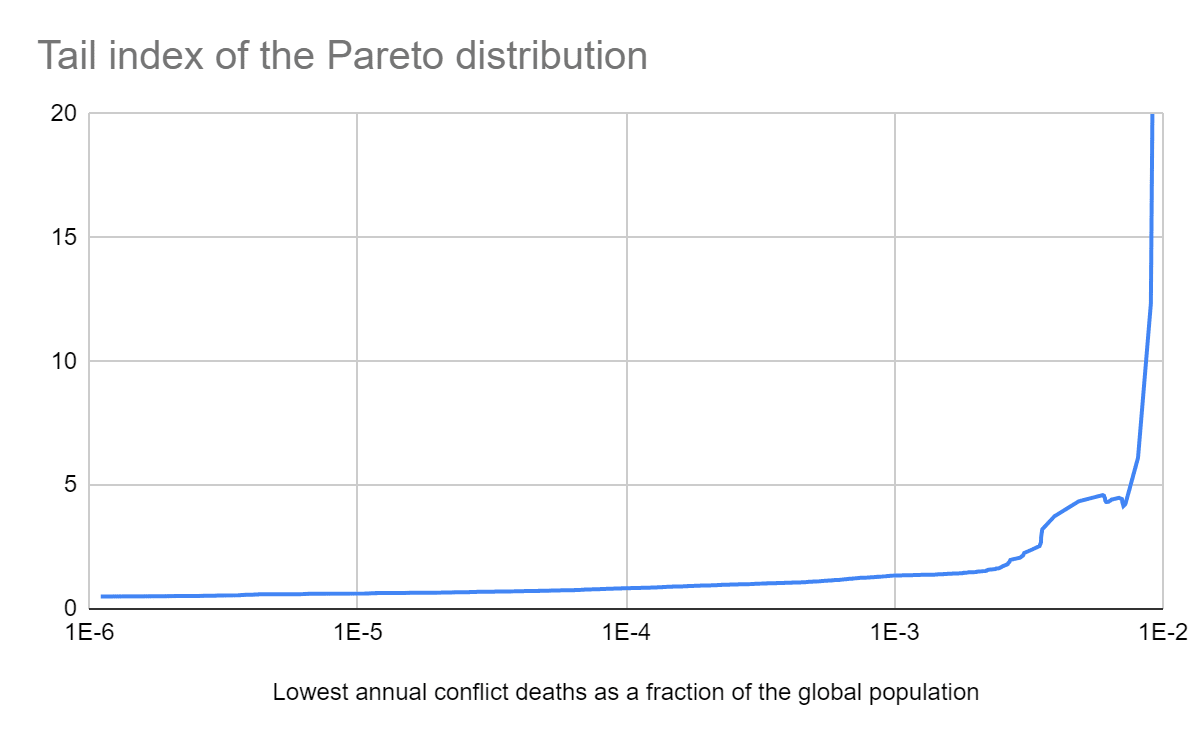
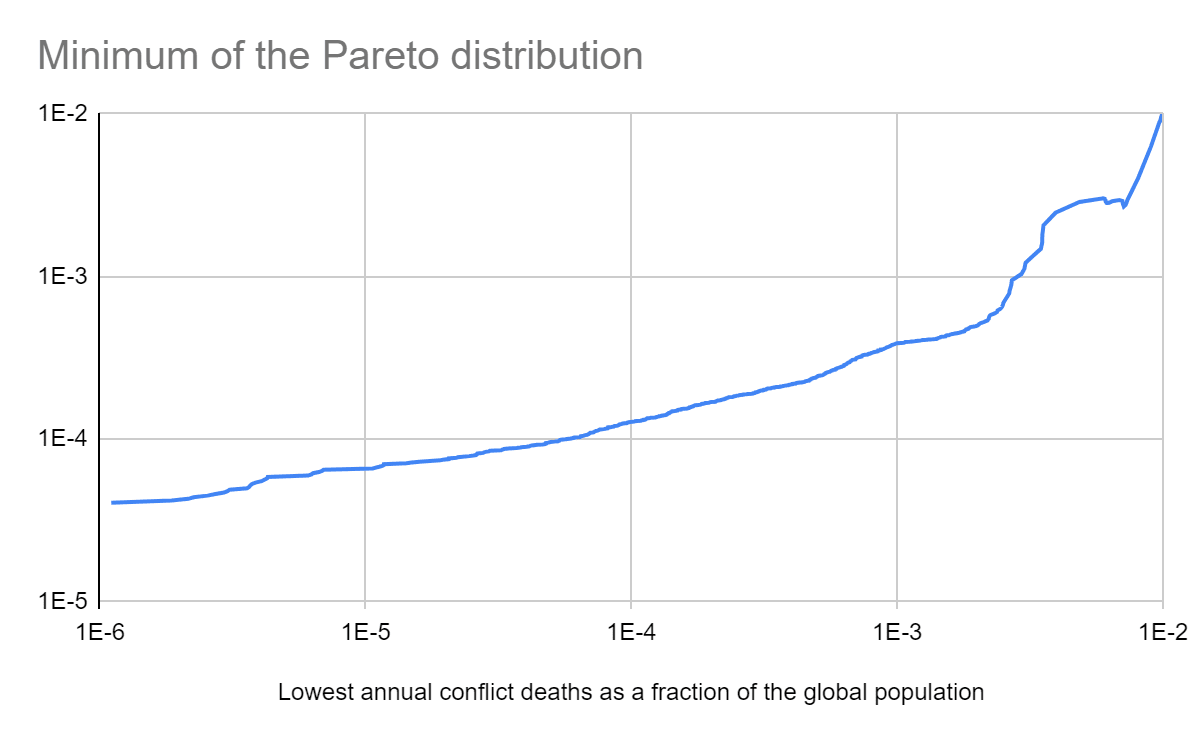
Fitting Pareto distributions to various sections of the right tail
Discussion
Historical annual conflict deaths as a fraction of the global population
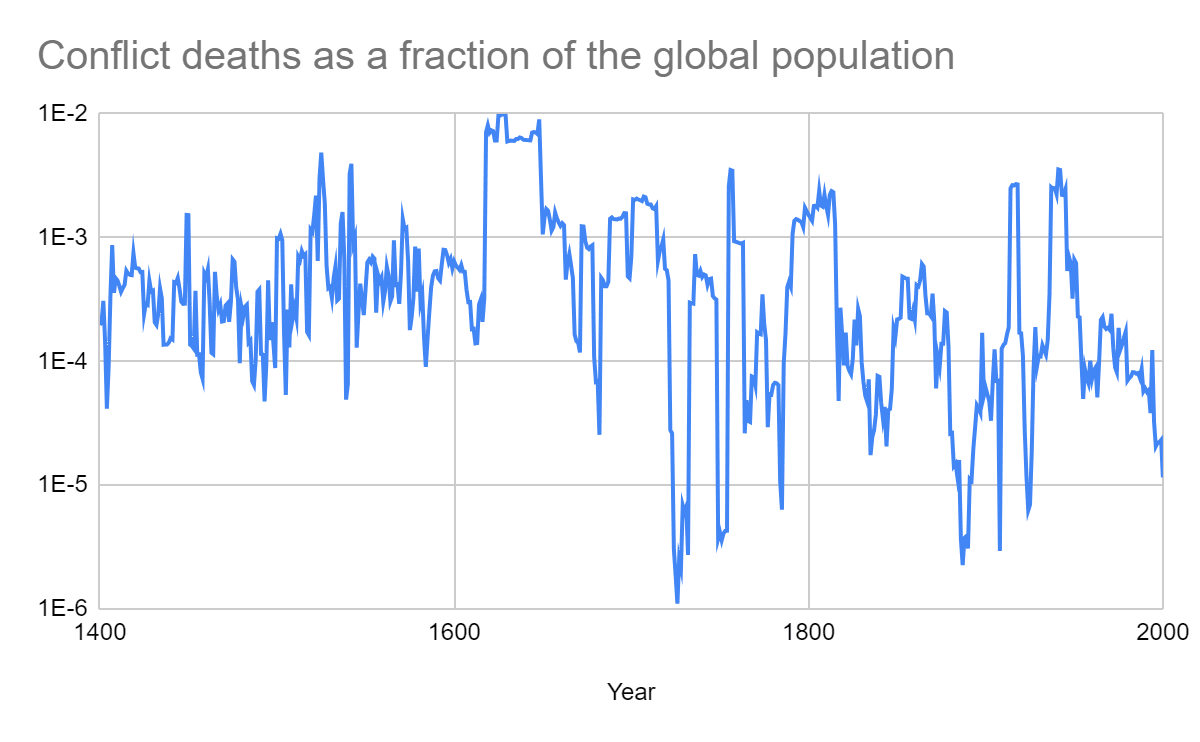
The years with the highest annual conflict deaths as a fraction of the global population were in the 1st half of the 17th century. The conflict contributing to this was the Thirty Years’ War, “one of the longest and most destructive conflicts in European history, lasting from 1618 to 1648”. Without the preprocessing, the years with the highest annual conflict deaths as a fraction of the global population were in the periods of World War I and II.
There has been a slight downwards trend in the logarithm of the annual conflict deaths as a fraction of the global population, with the R^2 of the linear regression of it on the year being 8.45 %. However, it is unclear to me whether the sign of the slope is resilient against changes in the function I used to model the ratio between the Conflict Catalog’s and actual annual conflict deaths.
In agreement with the above, Metaculus’ community predicts a decrease in the median annual conflict deaths as a fraction of the global population over the next 100 years.
Conflict tail risk
In agreement with my past analyses on terrorist attacks and wars, the median annual probability of a conflict causing human extinction across fitter’s best fit distributions is 0[7]. Also in line with those analyses, the results are quite sensitive to the type of distribution. The 5th and 95th percentile annual probability of a conflict causing human extinction are 0 and 5.02 %[8]. This is clearly too high, as it would imply a probability of survival from 1400 to 2000 of only 3.61*10^-14 (= (1 - 0.0502)^601), which is totally unrealistic considering humans have not come close to extinction during that period.
The coefficients of determination linked to fitter’s best fit distributions[4] do not track well which ones are actually a better fit. For instance, the Generalised Pareto has a slightly higher such coefficient than the Pareto (0.699 > 0.637), but is a much worse fit (see graph here).
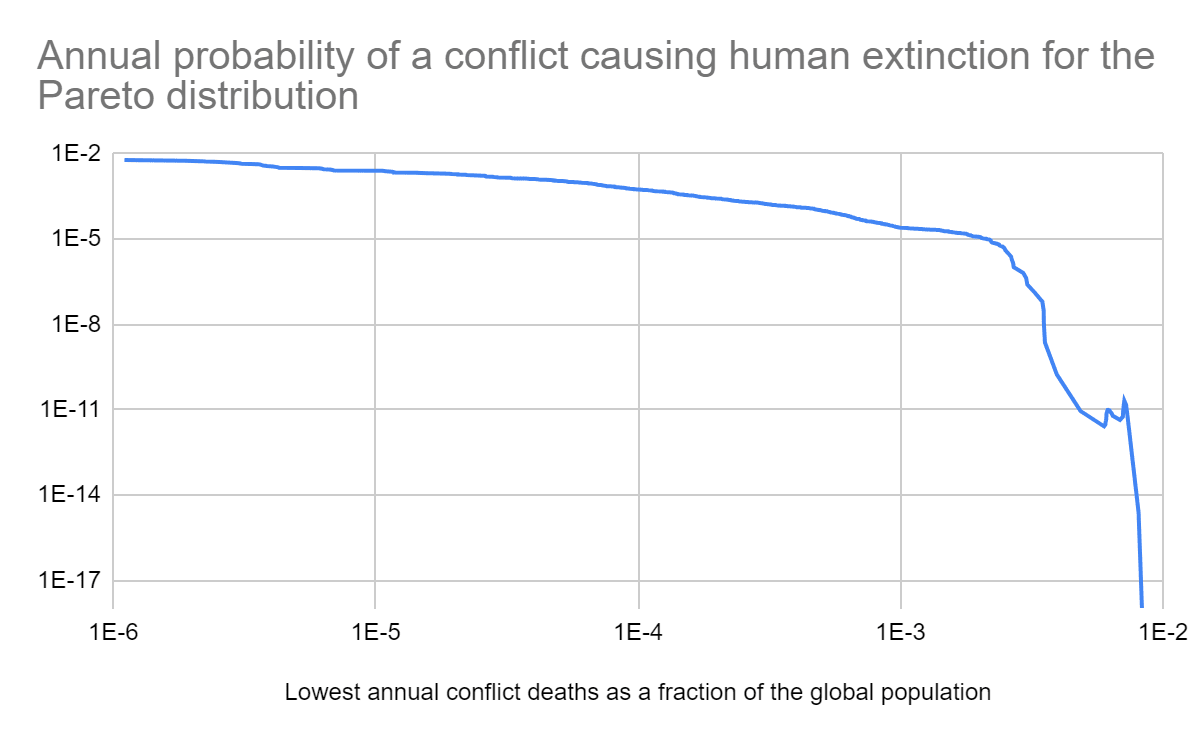
The issue above and the great variation of the results I got based on fitter makes me put much more weight on the Pareto distributions fitted to increasingly rightmost sections of the tail distribution. Increasing the lowest annual conflict deaths as a fraction of the global population included in the linear regression of the tail distribution, i.e. relying on increasingly rightmost sections of the tail, the annual probability of a conflict causing human extinction decreases (see last graph). The decrease is gradual until around 0.1 % annual conflict deaths as a fraction of the global population, for which the annual probability of a conflict causing human extinction is roughly 0.001 %. After that, the decrease is very abrupt, and conflicts quickly become astronomically unlikely to cause human extinction. These results are explained by the tail distribution decaying much faster after around 0.1 % annual conflict deaths as a fraction of the global population (see 1st graph), which is to be expected in light of deaths being limited to the global population.
The annual conflict deaths can be arbitrarily large under any Pareto distribution. Nevertheless, I like that my annual probability of a conflict causing human extinction quickly becomes super low for increasingly rightmost sections of the tail. In this case, the predicted probability of annual conflict deaths largely exceeding the global population shiftily becomes astronomically unlikely too.
Stephen Clare’s extinction risk from wars from 2023 to 2099 of 0.95 %, which was obtained based on a Pareto distribution fitted to CoW’s data, corresponds to an annual risk of 0.0124 % (= 1 - (1 - 0.0095)^(1/77)). I arrive at a similar risk for the linear regression with lowest annual conflict deaths as a fraction of the global population of 0.0341 %, which concerns the 47.8 % rightmost points of the tail. Fitting a Pareto to almost half of the tail distribution results in a much higher extinction risk because the tail is much flatter at the start.
I believe one should place more weight on points further in the right tail to predict extinction risk. There is the disadvantage of data becoming increasingly sparse as one moves further into the right tail. However, the predicted annual probability of a conflict causing extinction is 8.98*10^-12 for the 32 rightmost points, which feels like a sufficient sample size to ensure reliability. So I would say my results suggest yet again an astronomically low prior annual probability of a conflict causing human extinction.
One may argue extinction risk from conflicts is much higher based on inside view factors (e.g. weapon technology), and indirect effects, like increasing the likelihood of civilisational collapse. Nevertheless:
- Extraordinary evidence would be required to move up sufficiently many orders of magnitude for an AI, bio or nuclear conflict to have a decent chance of causing human extinction. I think underweighting the outside view is a major reason leading to overly high risk.
- Weapon technology also improved during the period of 1400 to 2000 covered by my data, but its tail distribution still suggests an astronomically low extinction risk from conflicts.
I estimated an inside view annual extinction risk from nuclear war of 5.53*10^-10[9], which is only 0.0111 % (= 5.53*10^-10/(5*10^-6)) of the 5*10^-6 that I understand Toby Ord assumed in The Precipice.
For further discussion, you can check my similar posts on terrorist attack and war deaths, including their comments.
Acknowledgements
Thanks to Peter Brecke for sharing his thoughts on the annual conflict deaths reported in Conflict Catalog as a fraction of the actual annual conflict deaths. Thanks to Stephen Clare for feedback on the draft.
- ^
Thanks for putting yourself in such a hard hypothetical position for science, Peter!
- ^
Setting the number of bins to the number of data points would result in overfitting.
- ^
The exponential, uniform, Pareto and exponentiated generalised Pareto distributions are particular cases of the generalised Pareto distribution.
- ^
- ^
I multiply the tail distributions of the best fit distributions by 10 % because they are supposed to model the right tail, and there is a 10 % chance of the annual conflict deaths being in the right tail as I defined it.
- ^
It makes sense there are many probabilities equal to 10.0 %. I use the parameters of the best fit distributions to compute the probability of the annual conflict deaths as a fraction of the global population being at least as high as x (10^-7, 10^-6, …, and 100 %) if they are in the right tail, but this probability is often 1 due to x being lower than the minimum of the best fit distributions. It follows that the unconditional probability of the annual conflict deaths as a fraction of the global population being at least as high as x is equal to the probability of them being in the right tail, which is 10 % as I defined it.
- ^
- ^
- ^
My best guess is lower due to outside view considerations driving the risk down.


Executive summary: An analysis of historical conflict deaths data suggests an astronomically low prior annual probability of a conflict causing human extinction.
Key points:
This comment was auto-generated by the EA Forum Team. Feel free to point out issues with this summary by replying to the comment, and contact us if you have feedback.
Thanks, SummaryBot!
I guess reasonable distribution types will lead to astronomically low extinction risk as long as one focusses on the rightmost points of the tail distribution.
To clarify: