Let’s call the hypothesis that the base rate of major wars hasn’t changed the constant risk hypothesis. The best presentation of this view is in Only the Dead, a book by an IR professor with the glorious name of Bear Braumoeller. He argues that there is no clear trend in the average incidence of several measures of conflict—including uses of force, militarized disputes, all interstate wars, and wars between “politically-relevant dyads”—between 1800 and today.
A quick note on Braumoeller's analysis:
He's relying on the Correlates of War (COW) dataset, which is extremely commonly used but (in my opinion) somewhat more problematic than the book indicates. As a result, I don't think we should give the book's main finding too much weight.
The COW dataset is meant to record all "militarized disputes" between states since 1816. However, it uses a really strange standard for what counts as a "state." If I remember correctly, up until WW1, a political entity only qualifies as a "state" if it has a sufficiently high-level diplomatic presence in England or France. As a result, in 1816, there are supposedly only two non-European states: Turkey and the US. If I remember correctly, even an obvious state like China doesn't get classified as a "state" until after the Opium Wars. The dataset only really becomes properly global sometime in the 20th century century.
This means that Braumoeller is actually comparing (A) the rate of intra-European conflict in the first half of the 19th century and (B) the global rate of interstate conflict in the late 20th century.
This 19th-century-Europe-vs.-20th-century-world comparison is interesting, and suggestive, but isn't necessarily as informative as we'd want. Europe was almost certainly, by far, the most conflict-free part of the world at the start of the 19th century -- so I strongly expect that the actual global rate of conflict in the early 19th century was much higher.
It's also important that the COW dataset begins in 1816, at the very start of a few-decade period that was -- at the time -- marvelled over as the most peaceful in all of European history. This period was immediately preceded by two decades of intense warfare involving essentially all the states in Europe.
So, in summary: I think Braumoeller's analysis would probably show a long-run drop in the rate of conflict if the COW dataset was either properly global or went back slightly further in time. (Which is good news!)
EDIT: Here's a bit more detail, on the claim that the COW dataset can't tell us very much about long-run trends in the global rate of interstate conflict.
From the COW documentation, these are the criteria for state membership:
The Correlates of War project includes a state in the international system from 1816-2016 for the following criteria. Prior to 1920, the entity must have had a population greater than 500,000 and have had diplomatic missions at or above the rank of charge d’affaires with Britain and France. After 1920, the entity must be a member of the League of Nations or the United Nations, or have a population greater than 500,000 and receive diplomatic missions from two major powers.
As a result, the dataset starts out assuming that only 23 states existed in 1816. For reference, they're: Austria-Hungary, Baden, Bavaria, Denmark, France, Germany, Hesse Electoral, Hesse Grand Ducal, Italy, Netherlands, Papal States, Portugal, Russia, Saxony, Two Sicilies, Spain, Sweden, Switzerland, Tuscany, United Kingdom, USA, Wuerttemburg, and Turkey.
An alternative dataset, the International Systems(s) Dataset, instead produces an estimate of 135 states by relaxing the criteria to (a) estimated population over 100,000, (b) "autonomy over a specific territory", and (c) "sovereignty that is either uncontested or acknowledged by the relevant
international actors."
So - at least by these alternative standards - the COW dataset starts out considering only a very small portion (<20%) of the international system. We also have reason to believe that this portion of the international system was really unusually peaceful internally, rather than serving as a representative sample.
5 forecasters from Samotsvety Forecasting discussed the forecasts in this post.
First, I estimate that the chance of direct Great Power conflict this century is around 45%.
Our aggregated forecast was 23.5%. Considerations discussed were the changed incentives in the nuclear era, possible causes (climate change, AI, etc.) and the likelihood of specific wars (e.g. US-China fighting over Taiwan).
Second, I think the chance of a huge war as bad or worse than WWII is on the order of 10%.
Our aggregated forecast was 25%, though we were unsure if this was supposed to only count wars between great powers, in which case it’s bounded above by the first forecast.
There was some discussion of the offense-defense balance as tech capabilities increase; perhaps offense will have more of an advantage over time.
Some forecasters would have preferred to predict based on something like human suffering per capita rather than battle deaths, due to an expected shift in how a 21st century great power war would be waged.
Third, I think the chance of an extinction-level war is about 1%. This is despite the fact that I put more credence in the hypothesis that war has become less likely in the post-WWII period than I do in the hypothesis that the risk of war has not changed.
Our aggregated forecast was 0.1% for extinction. Forecasters were skeptical of using Braumoeller’s model to estimate this as it seems likely to break down at the tails; killing everyone via a war seems really hard. There was some uncertainty of whether borderline cases such as war + another disaster to finish people off or war + future tech would count.
(Noticed just now that MaxRa commented giving a similar forecast with similar reasoning)
For now, let’s assume that the power law distribution of deaths is a close enough approximation of the expected results of any given war.
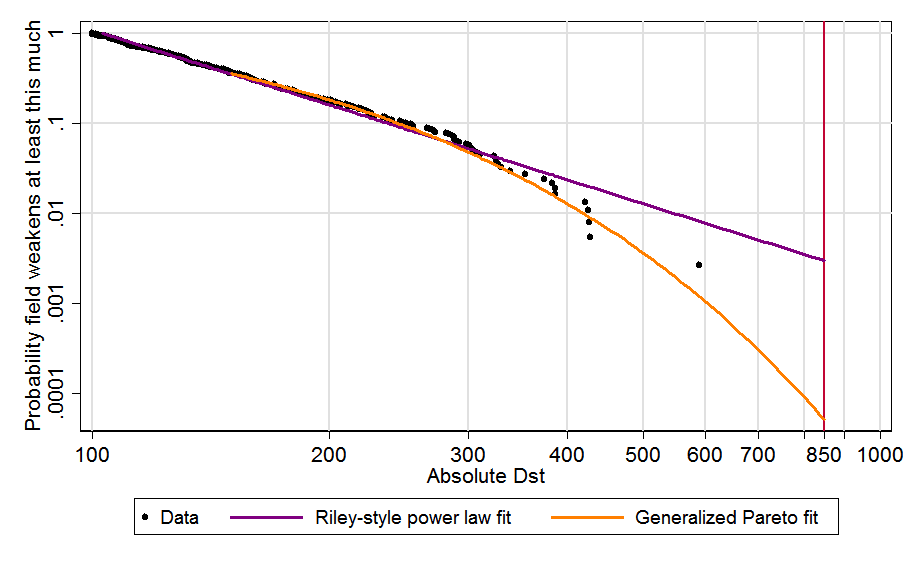
Power law extrapolation often results in greatly overestimating tail risk because the tail usually starts decaying faster at some point. It is better to use a generalised Pareto distribution, which has the pareto distribution (power law) as a special case. David Roodman found using a generalised pareto instead of a power law led to a decrease in 2 orders of magnitude (OOMs) of the risk of a solar storm at least as severe as a Carrington event:
The Carrington event "was the most intense geomagnetic storm in recorded history", but would very hardly cause extinction today (although now we have more electronics). As illustrated above, the higher the severity, the more the power law overestimates tail risk. So, if one fitted a generalised pareto to war deaths, I guess the extinction risk would decrease by many OOMs.
Another detail to have in mind is that, because the slope of the tail distribution usually bends downwards (as illustrated by the data points of the figure above), it matters whether we are fitting the power law to all the data points, or just to the right tail. The right tail will tend to have a more negative slope, so fitting a power law to all points will usually lead to overestimating the risk.
If one fitted a generalised pareto (instead of a power law) to e.g. 1 % or 10 % most deadly wars (instead of all wars), I guess the probability of a war causing human extinction would be OOMs lower than Braumoeller's 0.03 %. However, I expect it would still be many OOMs higher than my estimates for the extinction risk posed by terrorist attacks, as power laws still resulted in astronomically small risk of extinction (in agreement with Clauset 2013; see Figures 1 and 2). I might try to repeat the analysis for wars instead of terrorist attacks in the future, but you are welcome to do it yourself! Update: I will do it. Update: published!
Hi Vasco, thank you for this! I agree with you that just extrapolating the power law likely overestimates the chance of an enormous or extinction-level war by quite a bit. I'd mentioned this in my 80,000 Hours article but just as an intuition, so it's useful to have a mathematical argument, too. I'd be very interested to see you run the numbers, especially to see how they compare to the estimates from other strands of evidence I talk about in the 80K article.
The Middle East was rocked by a series of deadly clashes: measured by intensity (deaths divided by the population of the countries involved), the Iran-Iraq War of the 1980s was the third bloodiest war of all time.[1]
Wait, really? I thought there were plenty of wars in the past where a significant fraction of an entire region was killed. Like, 75%.
Also, shouldn't intensity be deaths per year divided by population of the countries involved?
Ah, great catch. It's the third-bloodiest war in the time period Braumoeller considers, i.e. 1816-2007. That's super different, so thanks! I've edited the main text.
On intensity - Braumoeller thinks dividing by year can actually mask the intensity of bloody, prolonged conflicts (pp. 39-41 of Only The Dead). For example, there were fewer battle deaths per year in the Vietnam War than in the Korean War, but the Vietnam War was much bloodier overall (~50% more battle deaths):
By any rational accounting, Vietnam was the more intense war. But the more modest annual death totals in Vietnam produce the illusion of a downward trend in battle deaths. That’s because, relative to the Korean War, the Vietnam War produced a much steadier death toll, and it produced it over a longer period. Korea looks incredibly deadly, and Vietnam seems less so, solely because the Korean War was short and intense while the war in Vietnam was long and drawn out
OK, cool, thanks. I flat-out disagree with Braumoeller here. The Korean war was way more intense than the Vietnam war. It just was over quickly, whereas the vietnam war dragged on for a long time and thus was worse/bloodier/moredestructive overall.
If the word you used was bloodiest I'd agree. But you used intensity.
Fair enough! I think something Braumoeller is trying to get at with his definition of intensity is like: if I were a citizen of one of the nations involved in a war, how likely is it that I would be killed? If you end up dividing by year, then you're measuring how likely is it that I would be killed per year of warfare. But what I would really care about is the total risk over the duration of the war.
Nice, thanks for further looking into this, I think it's really important to get more clarity on this, and looking at simple models based on base rates is super useful. Some random thoughts and reactions while reading:
what else changed since WWII:
wealth of a nation is predominantly not in agriculture and natural resources, but in high tech industry -> conquering land much less relevant
a lot of time passed in which countries learned about how to co-exist peacefully/productively in a globalized world
That said, while a 27% reduction in the chance of war is nice, it’s not a big enough effect to fully explain the Long Peace.
I thought even without a reduction you can "explain" the long peace.
Long-term gains from success in war can be larger than temporary disruptions in trade.
quote mentions "disputes", not war. I associate disputes with less intense confrontations to war, so I expect that disruptions in trade due to a war will be much bigger
However, [the democratic peace theory is] less relevant here because it can’t help explain the lack of Great Power conflict. The USSR was not a democracy, and today neither China nor Russia are. So democratic peace theory cannot explain why the Cold War stayed cold, and doesn’t provide any reason to be hopeful about the possibility of maintaining peace in the 21st century.
but maybe it contributes to the global shunning of war, e.g. China and Russia are probably still dependent on democratic allies who communicate strong preferences for peace
I think there’s about a 1% chance of an extinction-level war before 2100.
I think using the assumption of the power law distribution not breaking down above multiple billion dead people is fairly unlikely for the reason you gave and personally downdate this estimate by ~ an order of magnitude
At that time, the volume of US-China trade was just below the 90th percentile for their data, and the authors conclude that the growth of US-China trade reduced the chance of conflict by 27%.[18]
That said, while a 27% reduction in the chance of war is nice, it’s not a big enough effect to fully explain the Long Peace. Other reasons to think that the pacifying effect of global trade is smaller than is sometimes claimed include: [...]
This passage seems a bit off in a few ways. Not sure how important this is, but feels like some people might get a bit of a distorted picture from the passage?
"27% reduction in the chance of war" is already using a metric we fairly directly care about. I shouldn't get less excited about a 27% reduction in the chance of war as a result of it being only a fraction of some other even better thing, or see it as less impressive as a result, or something like that - I already know roughly how useful a 27% reduction in the chance of war seems to me.
As you note, the Long Peace is plausibly just a lucky role of the dice anyway, so there might not even be anything to explain. Or the Long Peace might be a smaller-than-it-first-appears effect, plus some luck, and then maybe 27% of the apparent effect could be roughly the whole "actual effect".
Trade only explaining 27% doesn't seem to obviously suggest that trade's effect is smaller than it's sometimes claimed. Is it sometimes claimed that trade explains much more than 27%? My guess is that that does sometimes happen but that most scholars who see trade as important would already only be arguing that trade accounts for something like 5-40% of the reduction in the risk of war.
But in any case, 27% was just the reduction of the US-China chance of war (I think). So then it obviously doesn't fully explain the Long Peace, but the reason isn't that it's just 27% but that it's focused on only one great power dyad.
(Again, not sure how important this is. Also not sure how well I explained what I'm thinking here.)
Good points, thanks! I agree the wording in the main post there could be more careful. In deemphasizing the size of the effect there, I was reacting to claims along the lines of "US-China conflict is unlikely because their economic interdependence makes it too costly". I still think that that's not a particularly strong consideration for reasons discussed in the main post. But you're probably right that I'm probably responding to a strawman, and that serious takes are more nuanced than that.
Have you considered making this three-part series a sequence? (It's quick to do so, and it makes it a bit easier for people to navigate between the posts in order.)
Also, as I noted on your previous post, I feel unclear precisely what you're forecasting when you forecast a given chance of "extinction-level war" - maybe you could clarify that?
Thanks for the great analysis! Your first post said "My current best guess is that, between now and 2100, we face a ~35% chance of a serious, direct conflict between Great Powers." This seems to be the estimate that is used in your guesstimate model for "probability of a major great power war breaking out before 2100". But in this post you say your best guess for the chance of at least one great power war breaking out this century is 45%. Not sure why there is this discrepancy, am I missing something?
First, I am not an academic in this area, and as such my observations will not be strictly bound to the models in question, as I think there are other risks that have not been explicitly examined that are having an effect. (Also, the current situation in Ukraine appears to represent a substantial risk of an unintended wider war which could ignite by a fog of war or a misread of the enemy event, and then there is the problem of echo-chambers reinforcing poor data or poor interpretation of good data.)
"No plan of operations extends with certainty beyond the first encounter with the enemy's main strength.” - Moltke the Elder
The chaotic nature of war is a major problem, and when delivery times of nuclear weapons range from less than 5 minutes for closely situated SLBMs to 30 minutes for ICBMs to hours for bombers, the ability to make the right call under extreme stress is a serious problem.
We also need to look at close calls and the role of luck. The Cuban Missile Crisis did not go nuclear because one thread held - Vasili Arkhipov's vote to not launch a nuclear torpedo. Able Archer 83 was a case where at a time of heightened tensions a military exercise by NATO was being interpreted in the Soviet Union as a ruse of war. (We cannot control or anticipate the mindset of our opponent who may be predisposed to assume the worst about an adversary's intensions.) And there are the possibilities of technical issues in detections systems resulting in false positives such as the case in September 26th, 1983 when cloud reflections sent false indications of ICBM launches in the United States by a malfunctioning Soviet launch detection system. Again, one thread probably held in that Stanislav Petrov probably acted above his pay grade by not simply passing the indications further up the chain of command because the pattern that he saw was inconsistent with what he expected a first strike would look like.
So one of many historical weaknesses have already been shown that could have caused a tense situation to tip into a nuclear war despite the desire for it to not do so by any sane actor. I don't think this is taken into account by the model - and it may be very difficult to do so. Also, the number of data points that we have since the beginning of the nuclear era may be insufficient to formulate a suitable model. And there is also the problem of proliferation to a wider number of actors that would increase probabilities of a nuclear exchange, and changes of mindset around the use of tactical nuclear warheads. (Russia for example has a doctrine that permits first tactical use, and Putin has threatened nuclear escalation in the Ukraine conflict.)
Again, I am not an academic, and someone with greater knowledge and expertise can probably poke holes in what is simply a non-expert looking at patterns and the behaviour of people as individuals and in groups at times of extreme stress, and the problems of technical malfunction. (Lastly, the aggravating effects of climate change over time will probably also change the calculus of catastrophic war, and that also does not appear to have been factored in, and what of Graham Allison's "Thucydides Trap"?)
I will be most interested to follow this discussion further as it is of much more than academic interest for obvious reasons.
I think the Thucydides Trap thing is a significant omission that might increase the probabilities listed here. If we forget the historical data for a minute and just intuitively look at how this could most foreseeably happen, the world's two greatest powers are at a moment of peak tensions and saber-rattling, with a very plausible conflict spark over Taiwan. Being "tough on China" is also one of the only issues that both Republicans and Democrats can agree on in an increasingly polarized society. All of which fits Allison's hypothesis that incumbent hegemons rarely let others catch up to them without a fight. So the risk of a great power war - and of escalation - intuitively seems higher today than it was in 2000, for instance, though neither the constant risk nor durable peace hypotheses seem to reflect that.
Maybe the next step is a "fluctuating risk" hypothesis that takes certain (admittedly tough to measure) global conditions of the world right now into account, rather than just the historical frequency of such wars. This would probably be less useful the longer the time horizon we're trying to model - who knows if US/China will still be the riskiest conflict 50 years from now? - so I don't want to overstate our confidence and its impact on overall risk would need to be sufficiently marginal. But I also don't think prior major wars were completely unforeseeable events (in 1930, if you had to predict which countries would be likeliest to fight the next great power war, you'd not be blindsided to learn Germany would be involved). So in theory, a cooling of great power tensions could decrease our risk estimate, while further decoupling of great power economies could increase it, etc.
I agree with this. I think there's multiple ways to generate predictions and couldn't cover everything in one post. So while here I used broad historical trends, I think that considerations specific to US-China, US-Russia, and China-India relations should also influence our predictions. I discuss a few of those considerations on pp. 59-62 of my full report for Founders Pledge and hope to at least get a post on US-China relations out within the next 2-3 months.
One quick hot take: I think Allison greatly overestimates the proportion of power transitions that end in conflict. It's not actually true that "incumbent hegemons rarely let others catch up to them without a fight" (emphasis mine). So, while I haven't run the numbers yet, I'll be somewhat surprised if my forecast of a US-China war ends up being higher than ~1 in 3 this century, and very surprised if it's >50%. (Metaculus has it at 15% by 2035).
Makes sense, and I'm not surprised to hear Allison may overestimate the risk. By coincidence, I just finished a rough cost/benefit analysis of U.S. counterterrorism efforts in Afghanistan for my studies, and his book on Nuclear Terrorism also seemed to exaggerate that risk. (I do give him credit for making an explicit prediction, though, a few years before most of us were into that sort of thing).
In any case, I look forward to a more detailed read of your Founders Pledge report once my exams end next week. The Evaluating Interventions section seems like precisely what I've been looking for in trying to plan my own foreign policy career.
AI Use Note: Main body text entirely human written. Claude (Opus 4.8) helped develop models of animal life histories in the appendix.
Cross-posted from Good Structures.
Executive Summary
* Animal advocates sometimes make claims like “there are X of this animal...
“How long have you been v*g*n?”
This is one of the most common icebreakers at animal protection events. It’s a baseline assumption, and it mostly holds true: if you’re out advocating for animals not to be tortured or abused, realistically these days you are v**n, or close. And it makes for good conversation. It seems fairly safe to assume when you meet strangers.
But this assumption is hurting the movement in a way which we don’t always notice: someone new comes into the sp...
Summary
Back in November 2023 I posted here to launch Spiro and raise our first $198k. Two and a half years later this is an update and a fundraiser for the next step.
The short version: we've now reached over-5,900 people with TB preventive medicine, including over 3,000 children under five years old. Our early results have held up well an...
This is part 2 in a planned three-part series on Great Power conflict. Part 1 presented my model of Great Power conflict and existential risk.
Thanks to Founders Pledge for support during the research phase of this work, and John Halstead and Max Daniel for feedback on earlier drafts.
The second half of the 20th century was hardly a peaceful era. Civil wars and wars of independence were fought across Africa, South America, and Asia. The Middle East was rocked by a series of deadly clashes: measured by intensity (deaths divided by the population of the countries involved), the Iran-Iraq War of the 1980s was the third bloodiest war of the last 200 years.[1]
During this time, though, the Great Powers managed to avoid coming into direct conflict. The last war in which soldiers from competing Great Powers fought against each other was the Korean War, which ended in 1953.[2] In the seven decades since, there have been proxy wars, near-misses, arms races, threats, and harsh rhetoric, but no direct conflict. This period is sometimes referred to as the Long Peace. It has been contrasted with the earlier 20th century and the 19th century.[3]
In this post I discuss the likelihood that the Long Peace continues throughout the 21st century. I tackle this question in two parts. I first consider how likely any Great Power war is considering the base rate of international conflict. I then discuss the likelihood that such a conflict, should it occur, would escalate massively.
These are difficult questions and my estimates have a lot of uncertainty. Still, I advance a few conclusions.
First, I estimate that the chance of direct Great Power conflict this century is around 45%.
Second, I think the chance of a huge war as bad or worse than WWII is on the order of 10%.
Third, I think the chance of an extinction-level war is about 1%. This is despite the fact that I put more credence in the hypothesis that war has become less likely in the post-WWII period than I do in the hypothesis that the risk of war has not changed.
In what follows, I discuss two competing hypotheses about whether the risk of war has changed after WWII. I then discuss their implications for the risk of war we face before 2100.
Great Power conflict has probably become somewhat less likely
The constant risk hypothesis
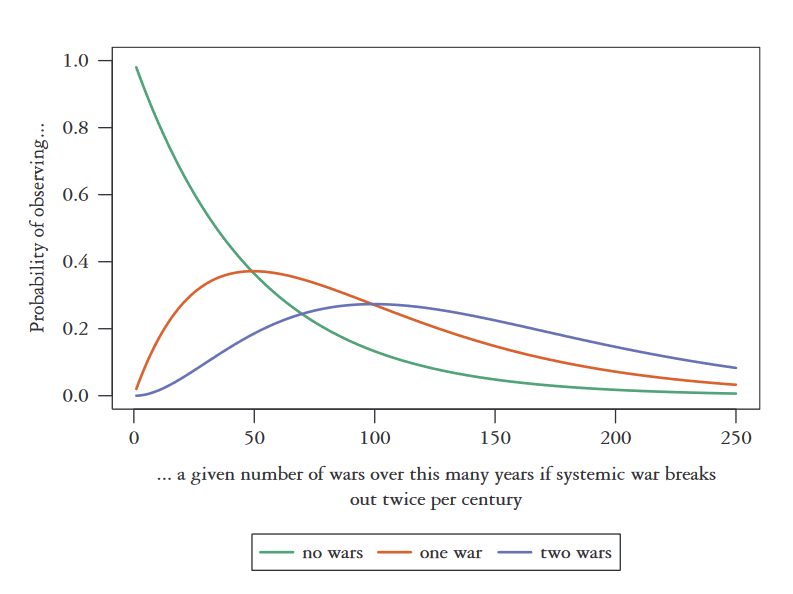
Over the last few centuries, the world has experienced about two Great Power wars each century.[4] If the rate of conflict hasn’t changed and wars are independent, we can use a binomial distribution to roughly estimate the probability of seeing a certain number of major wars in a given time period. Calculating the risk annually, the chance of seeing 0 major wars between 1945 and 2022 was .98^77 = 21%.[5] That makes the Long Peace look like a lucky outcome, but not clearly inconsistent with a constant, underlying risk of war.
Source: Bear Braumoeller, Only The Dead, p. 27
Let’s call the hypothesis that the base rate of major wars hasn’t changed the constant risk hypothesis. The best presentation of this view is in Only the Dead, a book by an IR professor with the glorious name of Bear Braumoeller. He argues that there is no clear trend in the average incidence of several measures of conflict—including uses of force, militarized disputes, all interstate wars, and wars between “politically-relevant dyads”—between 1800 and today.
Braumoeller's preferred measure for conflict frequency is the number of reciprocated disputes per politically-relevant dyad per year. Here, a dyad is a pair of countries; political relevance is a continuous variable that’s a function of whether countries share a border, how far apart they are, and whether at least one is a Great Power;[6] and reciprocated disputes are uses of force in which both parties fire. Using reciprocated events only excludes “trivial skirmishes” that do not have a meaningful chance of actual escalation.
The figure below is a graph of this variable since 1800. There is a lot of year-to-year variation. Braumoeller uses a “change point analysis” to look for years where “the change in the overall trend is larger than one could reasonably expect by chance” and calculates the median for each of the periods bookended by the change points the algorithm found.[7] Remember that this is for all wars, not just Great Power wars.[8] Note also the truncated y-axis. The most violent years are much more violent than average.
Reciprocated uses of force per politically-relevant dyad per year. The red line is median for a given period, where periods are divided up by the change-point algorithm. From Only The Dead, p. 47
Braumoeller’s statistical analysis suggests that the Cold War period was actually more violent on average than any period since 1800 except the World Wars. The median rate of conflict fell around the year 2000 (an effect of the end of the Cold War, Braumoeller speculates), but remains at a level comparable to the late 1800s and higher than the early 1800s.
Could it be the case that Great Power wars in particular have become less likely? Because such wars are a small fraction of all wars (again, averaging just two per century), this effect probably wouldn’t be big enough to show up in the data for all wars.[9] One initial reason to be skeptical of this idea is just that, again, it’s not that surprising that there hasn’t been a major world war in the last 77 years: the binomial model gives a ~21% chance to this outcome. These odds also seem consistent with what we know about Cold War close calls. Many people have suggested that avoiding war came down to decisions made by individuals, on short notice and in intensely-stressful environments, which could easily have been different.
What hasn’t changed?
Considering how much the world has changed in the last couple of centuries, it might seem pretty unlikely that the risk of war has been constant. But it may also be useful to consider several factors which haven’t changed. The nation-state is still the dominant unit of international politics, for example. Earth is a mosaic of states that act basically independently. Major wars before WWII were fought between nations each trying to defend or advance what they considered to be their national self-interest. Today, states still act in the absence of a strong world government that can adjudicate disputes and enforce agreements. Braumoeller thinks the basic cause of war is competing international orders.[10] This kind of competition, between sets of countries with different preferences, values, interests, and rules, is as much a feature of the world in 2020 as it was in 1920.
States are also still led by individuals, and individuals are still humanly imperfect. It’s important to remember that wars are not always–perhaps not even usually–the result of a rational cost-benefit analysis by national leaders. Instead, they can result from poor decisions, risky gambles, the pursuit of status and honour, or plain stupidity. As long as humans remain in charge, they are prone to human mistakes.
The durable peace hypothesis
However, other researchers have argued that the absence of a direct Great Power conflict since 1945 should not be chalked up to luck or randomness. They instead think that systemic changes have made war less likely. Call this the durable peace hypothesis. Steven Pinker is the most well-known proponent of this view, having advocated for it in The Better Angels of Our Nature. But it has other proponents, including some IR scholars like Azar Gat and John Muellbauer.[11]
This hypothesis is also consistent with the data we have: it predicts that a Great Power war would be very unlikely, and none has occurred. Plus, eyeballing the graph in the conflict initiation figure above, it does look like the rate of conflict has been falling rather consistently since WWII. Our World in Data’s analysis also appears to show a decline since WII in per-capita battle deaths.
Source: Our World in Data, https://ourworldindata.org/war-and-peace#war-and-peace-after-1945
Why might the risk of war have suddenly changed after WWII? Unfortunately, statistical tests of the durable peace and constant risk hypotheses are underpowered. Wars don’t happen very often, and the larger they are the rarer they are. It’s also not clear how much we can generalize from historical data. What do the Napoleonic wars tell us about 21st century US-China relations? For these reasons, I think we also have to look at qualitative arguments for and against the influence of specific factors on the outbreak of wars. Various explanations for the durable peace hypothesis have been proposed. Here I’ll discuss nuclear deterrence, globalization, international institutions, and democracy.
Nuclear deterrence
One of the more plausible explanations for a Great Power peace is nuclear deterrence. The argument goes that nuclear-armed superpowers are very unlikely to fight each other due to the high mutual costs of nuclear conflict. Although we know it can’t reduce the probability of conflict to zero because India and Pakistan fought a (small) war in 1999, IR researcher Greg Cashman has written that “most [IR researchers] would agree that possession of nuclear weapons vastly reduces the chances of war between two possessors.”[12] But Cashman also writes that this pattern does not extend to lesser conflicts between nuclear states, like militarized disputes and international crises that do not escalate beyond 1000 battle deaths (the typical threshold for a conflict to qualify as a war).[13] This implies that the degree of escalation, conditional on conflict initiation, is not completely random: nuclear-armed states are less likely to escalate minor clashes.
Interestingly, some evidence suggests that nuclear deterrence is less effective against non-nuclear states.[14] Perhaps these states perceive there to be a taboo against the use of nuclear force against a non-nuclear opponent. For instance, the US didn’t use nukes in Korea, Vietnam, Afghanistan, or Iraq, nor did the Soviets use them in Afghanistan in the 1980s, nor did the Israelis in Lebanon, even in the cases where the nuclear side lost. This taboo could result from moral views incubated by individuals and advocacy groups, or from a rational accounting of the reputational costs incurred by using nuclear force.[15] It could also be the case that the strategic utility and deterrent power of nuclear weapons is generally overemphasized.[16]
Growth, trade, and globalization
A second explanation for the Long Peace is globalization and growth in international trade since WWII. Also commonly proposed as explanation for fall of conflict. Exported goods now account for about one-quarter of the world’s GDP.
Source: Our World in Data, https://ourworldindata.org/trade-and-globalization
You can’t trade with someone you’re at war with. So, the more two countries trade, the more costly a war between them will be, and the less likely they should be to fight. This argument is appealing for a few reasons. First, it makes intuitive sense. Second, it looks like it fits the data well, at least for the post-war period. Since WWII, international trade has grown dramatically while the rate of international conflict has fallen.
This theory also benefits from some seemingly-strong empirical support. Two prominent proponents, Bruce Russett and John Oneal, have produced a number of books and papers that show increased economic interdependence, usually measured as the value of bilateral trade between two countries divided by a country’s GDP, reduces the chance of war between two countries. More specifically, in a 2003 paper they report that “increasing economic interdependence from the 10th to the 90th percentile reduces the risk of a fatal dispute by 32 percent.”[17] At that time, the volume of US-China trade was just below the 90th percentile for their data, and the authors conclude that the growth of US-China trade reduced the chance of conflict by 27%.[18]
That said, while a 27% reduction in the chance of war is nice, it’s not a big enough effect to fully explain the Long Peace. Other reasons to think that the pacifying effect of global trade is smaller than is sometimes claimed include:
The economic benefits of trade with any one country are usually not that large.[19]
Long-term gains from success in war can be larger than temporary disruptions in trade.[20]
As the world gets more interconnected, trade with any given country A will become a smaller proportion of a country B’s economy.
Some scholars have noted that negotiating trade deals also gives one country more leverage over the other, and potentially raises more issues over which countries can disagree.[21]
Global trade was at historic highs just prior to WWI
Finally, disentangling the causal relationships among the highly-correlated variables of trade interdependence, GDP level, strength of democracy, and participation in international organizations is difficult. Russett, Oneal, and collaborators try things like measuring lagged effects to try and improve their causal inference, but I’m not sure how successfully this isolates causal relationships. I think these studies provide strong evidence of the direction of the effect, but my best guess would be that they overestimate its size.[22]
International institutions and democracy
The final drivers I want to briefly cover are the proliferation of international institutions and the spread of democracy. Some researchers have suggested a number of mechanisms by which international institutions like the United Nations could reduce the chance of war. These include providing more opportunities for bargaining and negotiating solutions to international crises, increasing the rate of cultural and diplomatic exchange to strengthen bilateral relationships, and making it easier for the international community to coordinate peacekeeping missions and punish interstate aggression. Russett and Oneal, again, show that countries which share membership in intergovernmental organizations are less likely to go to war with each other, though the strength of this effect is smaller than the effect of trade or democracy.[23]
Lastly, it’s worth mentioning democratic peace theory. This is the idea that war is much less likely between two countries which are both democracies than it is between a democracy and autocracy or two autocratic countries. While working on this project, I was surprised by the strength of the evidence for democratic peace theory. Cashman writes that, even after coming under heavy scrutiny, it has “now gained overwhelming support among Western scholars” (p. 258). In fact, there are very few counterexamples. Though the mechanism is not clear, shared democratic systems seem to almost guarantee peace between countries.
Democracy, in tandem with regional economic integration, surely plays a key role in explaining why western Europe, and perhaps South America, has avoided serious interstate conflict in recent decades. However, it’s less relevant here because it can’t help explain the lack of Great Power conflict. The USSR was not a democracy, and today neither China nor Russia are. So democratic peace theory cannot explain why the Cold War stayed cold, and doesn’t provide any reason to be hopeful about the possibility of maintaining peace in the 21st century.
Summary of likelihood of conflict
It’s hard to come down conclusively on one side of the constant risk vs. durable peace debate. Contra Braumoeller, I don’t think it’s fair to say there’s no evidence for the durable peace hypothesis. His constant risk model only predicts a 21% chance of going this long without a major war. That alone makes the Long Peace surprising! Plus, I think there are relatively strong reasons to think that nuclear deterrence has made Great Power war more costly, while globalization has made peace more profitable.
At the same time, I think it would be naive to claim that the risk of Great Power war was close to zero during the Cold War, or that it will be so low in the future. On several occasions during the Cold War, the US and the USSR likely avoided conflict by luck as well as good decision-making. Today, military budgets continue to grow in absolute terms and relations between Great Powers are relatively negative.
For these reasons, it makes sense to have some credence in both hypotheses. One way to work out how much credence to assign to each is to use Bayes factors. The longer we go without a Great Power war, the less likely it seems that there is a constant underlying risk of war breaking out, and the more credence we should shift to the durable peace hypothesis.
I’ve used this method to estimate how much credence to put in each hypothesis. You can see my calculations in tab 1 of this spreadsheet.[24] I first assigned priors for each hypothesis. To do this, I tried to imagine what I’d make of the arguments for and against each hypothesis if I didn’t know that we’d had 77 years of peace.[25] I think it’s plausible that I’d assign more credence to constant risk than durable peace, mostly because that would be consistent with the historical record. I think the primary consideration would simply be that we still live in a world of autonomous nation-states acting and competing in the absence of a world government. So I assigned a prior of 65% to constant risk and 35% to durable peace. I then updated the priors using our available data (77 years of peace) to generate posterior probabilities. I used these to forecast the chance of seeing a major war before 2100, 77 years away, weighting the predictions of each hypothesis by my posterior credences.
The model implies I should put 65% of my credence on the durable peace hypothesis and 35% on the constant risk hypothesis. This suggests a 45% chance of at least one Great Power war breaking out in the next 77 years. Still not great odds!
However, I’m pretty uncertain about my priors on each theory, so I’ve also added upper and lower bounds in the spreadsheet. On the whole, they don’t actually change the end result that much:
Skeptic’s take: if my prior credence on the constant risk hypothesis rises to 80%, then the chance of war before 2100 rises to 55%
Optimist’s take: if instead I had only 40% credence on the constant risk hypothesis, then the chance of war before 2100 is 35%
This range is probably too narrow considering the uncertainty we face. Still, the takeaway is that the chance of a major war is pretty high even when one puts quite a lot of stock in the durable peace hypothesis.
If a conflict occurs, it could be very deadly
So far I’ve talked about the likelihood that a Great Power war breaks out. But to assess the risk of such a war, its likelihood must be multiplied by its potential severity. Unfortunately, I think that the potential severity is very high. World War III could be much worse than WWII. Indeed, it could even threaten us with extinction.
Two considerations lead me in this direction. The first is the large and ongoing increase in humanity’s war-making capacity, discussed in part 1 of this series. World War II took place just 20 years after World War I, but was far more deadly due in part to advances in flight and explosives technology. The gap between World War II and World War III would be at least four times longer. If the Great Powers come to blows again, their increased military capacity, driven by economic growth and technological innovation, means they could inflict unprecedented damage on each other and the rest of the world.
The second consideration is simply that the distribution of the number of casualties per conflict is long-tailed. Most conflicts, even after they pass the threshold of 1000 deaths needed to qualify as a “war”, are small. A small number, though, are enormous.
Source: Pasquale Cirillo and Nassim Nicholas Taleb, “On the Statistical Properties and Tail Risk of Violent Conflicts,” Physica A: Statistical Mechanics and Its Applications 452 (June 2016): 35, https://doi.org/10.1016/j.physa.2016.01.050.
What’s unsettling about this is that, if we use the existing data to estimate the shape of the underlying distribution, we find that it’s consistent with wars much, much larger than World War II. Both Cirillo and Taleb[26] and Braumoeller[27] think the distribution is a power law with a very fat tail.[28] This implies a war could keep getting larger until it hits the natural limit: the number of people alive.
Braumoeller does look at trends in the lethality of wars to check if there’s any evidence that they’ve been getting less lethal over time. He looks at two measures of lethality:
Intensity: battle deaths divided by pooled population of the countries fighting
Severity: raw battle deaths
He finds no strong trend in either measure.[29] Here’s his graph for war intensity:[30]
Battle deaths per 1000 population of combatant countries for wars ordered sequentially. It starts in 1816, i.e. just after the Napoleonic Wars. Source: Only the Dead, p. 107
Braumoeller writes that “These conclusions are, by a wide margin, the worst news that this book has to convey. The past two centuries have seen some of the deadliest wars in human history, including the deadliest of them all, World War II. The data give us no reason to believe that the next two centuries will be any better, and they could easily be much, much worse”.[31] Later, in the conclusion to that chapter, he puts it more bluntly: “I briefly considered typing, “We’re all going to die,” and leaving it at that”.[32]
I disagree with the strength of his conclusion. I do think there’s some evidence that it’s become less likely for wars to occur. I think it’s even harder to assess whether wars have become less likely to escalate, but generally do agree with Braumoeller that this seems unlikely. The data don’t give strong reasons to suggest it, and I think the qualitative reasons to think this might be the case are weaker.
How plausible is this model?
All that said, I think the discussion on why and how wars escalate is one of the less convincing sections of the Braumoeller book. Braumoeller models wars as occurring according to an annual random draw from a binomial distribution, with each war’s death count drawn randomly from a power law distribution. But the escalation potential is clearly shaped by the identities of the combatants. I would be a lot more worried about the tail risk potential of a violent escalation in the Sino-Indian border dispute than an escalation of the Belizean-Guatemalan dispute.
I’m also unsure if there’s enough data for Braumoeller’s change-point analysis to pick up a post-WWII change in severity in the tails of the distribution. When discussing nuclear war, I noted that escalation is not a random process. Instead, there is evidence that the risk of nuclear war leads nuclear-armed superpowers to avoid escalating minor conflicts.
Similarly, deciding where to cap the unobserved tail of the distribution is far from trivial. Braumoeller’s model is that, due to randomness in who wins battles, they can escalate arbitrarily. For example, if key battles in WWII had unfolded differently, then perhaps the war could have dragged on for much longer, and killed several times more people. Or perhaps it could have ended much more quickly and killed only a fraction as many.
However, it seems hard to imagine how WWII could have just continued escalating until everybody died. Under what circumstances does it kill every Australian farmer? Certain regions or populations are much more isolated than others, and much less likely to get swallowed up by even massive global conflagrations. Because I also think that civilization would probably recover from even truly horrific death tolls,[33] the extreme tails of the death distribution matter a lot from a longtermist perspective.
Combining the data on conflict rate and escalation potential to estimate direct existential risk
For now, let’s assume that the power law distribution of deaths is a close enough approximation of the expected results of any given war. This lets us calculate the chance that a war, once it has started, will escalate to a certain level.
Braumoeller reports some results for war severity (total number of battle deaths) using his bootstrapped parameters. The results are not comforting. A given war has:
About a 1 in 100 chance of matching WWI’s toll of about 10 million battle deaths.
About a 1 in 200 chance of causing ~30 million battle deaths, twice that of WWII.
And at least a 3 in 10,000 chance of causing 8 billion battle deaths, i.e. human extinction.[34] (I’ll assume it’s actually twice as likely as this.)
To calculate the total probability of seeing one of these kinds of wars before 2100, we need to combine the escalation model with the frequency of conflict model.
Under the constant risk hypothesis, we assume that wars continue to start at their historical rate of one every two years.[35]
The durable peace hypothesis could mean that wars in general are less likely to start. Or it could mean that when wars do start, they are less likely to escalate and become Great Power wars. It could also mean both of these things. As I did earlier, I assume the chance of a war breaking out is reduced by 80%. I also assume the chance of the war escalating to extinction level is reduced by 50%.[36] I have included some robustness tests for these parameters in the third tab of the supplementary sheet.
Probability of war twice as severe as WWII before 2100
Probability of extinction war before 2100
Constant risk hypothesis
(35% credence)
1−(1−1200)772=18%
1−(1−2×310,000)772=2.3%
Durable peace hypothesis
(65% credence)
1−(1−12×1200)15×772=1.9%
1−(1−12×2×310,000)15×772=0.23%
Weighted mean
.35×18%+.65×1.9%=7.5%
.35×2.3%+.65×0.23%=0.95%
After weighting the forecasts by my credence, this model gives a ~8% chance of a war twice as severe as WWII before 2100. Such a war would be an unprecedented disaster. It would involve at least 32 million battle deaths plus an unknown number of civilian deaths. Such a war would stimulate huge increases in military spending. Depending on when it occurred, this increased spending could accelerate the development of dangerous new technologies. This war would also reshuffle the international order. The current liberal order could be retrenched, or a new order based on different rules could arise.
Even more worryingly, this model suggests that the chance of an extinction-level war is surprisingly high: about 1% likely in the next 77 years. This estimate assumes the power-law distribution of battle deaths holds even in long tails we haven’t observed. This is a strong assumption; it’s possible that the distribution is heavy-tailed but not a power law, or that it breaks down at the extreme ends of the tail. But I also can’t think of knock-down reasons to rule out the possibility of a war orders of magnitude larger than WWII. The lesson here is that such a war is at least consistent with a model that fits the available data.
Conclusion
In this post I’ve made the following points:
Both the constant risk and durable peace hypotheses are consistent with the data on conflict since WWII
Because wars are rare, evaluating which hypothesis is more plausible is not trivial. However, the lack of direct conflict between Great Powers since the Korean War is a relatively strong update towards the durable peace hypothesis. I now put 65% credence in the hypothesis that conflict generally, and especially conflict between Great Powers, has become noticeably less likely.
Still, we don’t have enough data to rule out the constant risk hypothesis entirely. Given our current uncertainty, the risk of major conflict in the years to come is worryingly high. I think there’s about an 8% chance of a war much larger than WWII occurring before 2100.
The distribution of war deaths has a very long tail. The available data suggest it could follow a power law. If this holds, then there is the potential for wars orders of magnitude larger than WWII to occur. I think there’s about a 1% chance of an extinction-level war before 2100.
In the next post, the last in this introductory series, I’m going to review what we know–and what we don’t know–about what philanthropists, researchers, and other actors might do to make these terrible outcomes even less likely.
Surprisingly, the most intense wars in history aren’t the World Wars. Instead, they’re the 1860s’ Paraguayan War and the 1930s’ Chaco War, both of which involved the country of Paraguay.
China and India fought a war in the 1960s, but their status as Great Powers at that time is arguable. There have also been deadly border clashes between China, India, and the USSR since 1953, but none has been deadly enough to qualify as a war (>1000 deaths).
There was a period of relative peace between Great Powers from 1871 to 1914, but the Napoleonic Wars, the Crimean War, and the wars of German Unification occurred prior to that.
“If we look at the record of Great Power wars over the past five centuries (Levy, 1983; Goldstein, 1988, 146), we find an average of about two per century prior to the twentieth century” (Bear Braumoeller, Only the Dead, p. 26)
I calculate the risk annually because that’s what Bear Braumoeller does in Only The Dead (see pp. 26-7). At this rate, the standard deviation for the number of wars in 77 years is 1.2. The chance of seeing 4 or more wars is 7%.
One might argue that the standard deviation should be lower. We could model this by breaking the century up into fewer trials of higher probability. This decreases the chance of extreme events, like centuries with no wars or many wars. If instead we model each decade as a trial with a 20% chance of war, then there’s an 18% chance of seeing no wars since 1953. The number of trials only starts to make a big difference when there are very few trials: roughly less than 7 or 8.
It’s firmly established in the IR literature that countries which share a border, and powerful countries, are both more likely to fight than average. More specifically, Braumoeller calculates the political relevance of a dyad as: “𝜦(4.801 + 4.50 × contiguity−1.051 × log(distance) + 2.901 × major power), where 𝜦 denotes a standard logistic function, defined as f(x) = 1/(1 + e−x)” (note 5, pp. 254-5).
I’ve tried my best to understand, practically, how this change-point algorithm works. Unfortunately I haven’t been able to find the explanatory materials Braumoeller says are included in the book’s Online Appendix (the book just directs readers to the Harvard Dataverse). The technical paper, available here, is beyond me. For now I’m kind of eyeballing the graph to see if Braumoeller’s analysis feels sensible.
Braumoeller’s definition of international orders: “multilateral security regimes that involve one or more major powers and are legitimated by a set of principles that are potentially universal in scope” (Only The Dead, p. 153)
I should note that the strongest version of this claim is that wars of all kinds have become less likely, not just Great Power wars. Here I want to focus specifically on Great Power wars due to their potential long-term significance.
“quite a few studies using different data collections on MIDs and crises agree that while nuclear possessors are unlikely to go to war, joint possession does not prevent nuclear powers from initiating crises or militarized disputes with another nuclear weapons state” (Cashman, p. 363)
See Nina Tannenwald, The Nuclear Taboo (2007): “It is widely acknowledged today among nuclear policy analysts and public officials that a “nuclear taboo” exists at the global level. It is associated with widespread popular revulsion against nuclear weapons and widely held inhibitions on their use. Such hard-nosed analysts and prominent theorists of deterrence as George Quester, Bruce Russett, and Thomas Schelling have noted this phenomenon and suggested that it has played a role in explaining non-use” (p. 8). And also TV Paul, “Taboo or tradition?”: “The tradition [of not using nuclear weapons] emerged because of a realisation of the horrendous effects of nuclear attack (a material fact) which generated reputation costs for a potential user” (http://www.jstor.org/stable/40961956, p. 853).
“I also agree with Mueller that nuclear weapons have proliferated less than originally expected, and that's probably as much or more due to their surprisingly low military and diplomatic utility and high cost as it is to counter-proliferation efforts. Their danger is often exaggerated” (lukeprog, “Note on Atomic Obsession”, https://forum.effectivealtruism.org/posts/SWezwguRBf89KzqDQ/notes-on-atomic-obsession-2009)
In 2003, the US-China trade as a proportion of the US economy was around the 90th percentile for trade interdependence, but was just 1.2% of US GDP (“Causes of Peace”, p. 383)
“A dispute normally affects trade for only one or two years” (“Causes of Peace”, pp. 388-9), so the costs are typically bounded. But the benefits of conquering territory, stymying the rise of rivals, or gaining influence over international rules and institutions could flow for a long time.
For example, Europe’s reliance on Russian natural gas has been a source of tension between European countries, and between countries like Russia and France.
To quantify: I think there’s an 80% chance that doubling the amount of trade between two countries reduces the annual chance they go to war by between 0% and 35%.
“mutual memberships in intergovernmental organizations (IGOs) make an important independent contribution, above and beyond those of trade and democracy, to reducing militarized disputes between pairs of states (though the pacific benefits of IGO membership are smaller than the other two Kantian variables)” Cited in What Causes War?, p. 270
You can make a copy of the spreadsheet and input your own values for the annual risk of war and priors. Cells with orange backgrounds are inputs and the rest of the sheet should update automatically.
What I basically want to do here is try to estimate, quantitatively, how surprising the Long Peace is given the strength of the arguments for and against a decline of war. The degree of surprising-ness depends on the plausibility of the arguments for an enduring decline of war, and the duration of the Long Peace.
It’s arguable whether my approach makes much sense. In the prior, I tried to account for all available empirical information other than the duration of the Long Peace. This means that I wasn’t imagining the prior an observer in 1945 would have assigned. This wouldn’t make sense because, e.g., they wouldn’t have had any information about globalization, nuclear weapons, etc. But it’s also hard to separate my judgment of the strength of the arguments about the Long Peace from the context in which they’re presented, i.e. from the fact that they are post-hoc explanations for the Long Peace.
In other words: yes this method is imperfect; probably the output is useful anyway; no I can’t think of a better alternative right now.
More technically, in both Cirillo and Taleb’s “Tail Risk” and Braumoeller’s Only The Dead, the bootstrapped slope coefficient of the distribution is estimated to be <2, implying that the distribution of war deaths has infinite mean. That is, in practice it’s bounded only by the world population. See fig. 5.5 in Braumoeller (p. 111) and fig. 7 in Cirillo and Taleb (p. 39).
Because world population has grown, it might seem weird that there’s no trend in severity. But trend in war deaths is so noisy, and so dominated by the outliers of WWI and WWII, that no trend shows up (at least according to Braumoeller’s change-point analysis). “here’s no point between 1815 and the present at which the difference between the earlier and later distributions of war severity are even close to significantly different” (Braumoeller, Only The Dead, p. 115)
This is a lower bound because this is the chance that a war escalates to 8 billion battle deaths. However, most wars also kill many civilians. Braumoeller’s figure for WWII battle deaths, for example, is 17 million. But the total number of people killed in WWII was over 70 million, more than four times larger than the number of battle deaths alone. So, the number of battle deaths required for an extinction war could be much lower than 8 billion, depending on how many civilians are killed per soldier. The expected value of this ratio is disputed in the IR community (Braumoeller, personal communication). The WWII example, though, shows that it can be very high.
I haven’t formally modeled this reduction. It’s based on my sense of the strength of the evidence on changing international norms and nuclear deterrence.


A quick note on Braumoeller's analysis:
He's relying on the Correlates of War (COW) dataset, which is extremely commonly used but (in my opinion) somewhat more problematic than the book indicates. As a result, I don't think we should give the book's main finding too much weight.
The COW dataset is meant to record all "militarized disputes" between states since 1816. However, it uses a really strange standard for what counts as a "state." If I remember correctly, up until WW1, a political entity only qualifies as a "state" if it has a sufficiently high-level diplomatic presence in England or France. As a result, in 1816, there are supposedly only two non-European states: Turkey and the US. If I remember correctly, even an obvious state like China doesn't get classified as a "state" until after the Opium Wars. The dataset only really becomes properly global sometime in the 20th century century.
This means that Braumoeller is actually comparing (A) the rate of intra-European conflict in the first half of the 19th century and (B) the global rate of interstate conflict in the late 20th century.
This 19th-century-Europe-vs.-20th-century-world comparison is interesting, and suggestive, but isn't necessarily as informative as we'd want. Europe was almost certainly, by far, the most conflict-free part of the world at the start of the 19th century -- so I strongly expect that the actual global rate of conflict in the early 19th century was much higher.
It's also important that the COW dataset begins in 1816, at the very start of a few-decade period that was -- at the time -- marvelled over as the most peaceful in all of European history. This period was immediately preceded by two decades of intense warfare involving essentially all the states in Europe.
So, in summary: I think Braumoeller's analysis would probably show a long-run drop in the rate of conflict if the COW dataset was either properly global or went back slightly further in time. (Which is good news!)
EDIT: Here's a bit more detail, on the claim that the COW dataset can't tell us very much about long-run trends in the global rate of interstate conflict.
From the COW documentation, these are the criteria for state membership:
As a result, the dataset starts out assuming that only 23 states existed in 1816. For reference, they're: Austria-Hungary, Baden, Bavaria, Denmark, France, Germany, Hesse Electoral, Hesse Grand Ducal, Italy, Netherlands, Papal States, Portugal, Russia, Saxony, Two Sicilies, Spain, Sweden, Switzerland, Tuscany, United Kingdom, USA, Wuerttemburg, and Turkey.
An alternative dataset, the International Systems(s) Dataset, instead produces an estimate of 135 states by relaxing the criteria to (a) estimated population over 100,000, (b) "autonomy over a specific territory", and (c) "sovereignty that is either uncontested or acknowledged by the relevant international actors."
So - at least by these alternative standards - the COW dataset starts out considering only a very small portion (<20%) of the international system. We also have reason to believe that this portion of the international system was really unusually peaceful internally, rather than serving as a representative sample.