Again there doesn’t seem to be a strong reason to think there’s an upper bound to the amount of people that could be killed in a war featuring widespread deployment of AI commanders or lethal autonomous weapons systems.[17]
So on technological grounds, at least, there seem to be no strong reasons to think that the distribution of war outcomes continues all the way to the level of human extinction.
Sounds right!
This made me realise that my post is confusing/miseadling in a particular way -- because of the context of the 80,000 Hours problem profiles page, I was thinking of the question like "what's the leftover x-risk from conflict once you aren't considering AI, bio, or nukes (since those have their own problem profiles)"? But that context is much stronger in my head than in the readers', and should be made explicit.
I guess also AI-as-a-weapon should perhaps fall into the great power conflict bucket, as it's not discussed that much in the AI profile.
Thanks Arden, that makes sense. I think it will be hard to separate "x-risk from conventional war" from "x-risk from war fought with WMDs and autonomous weapons" because pacifying interventions like improving US-China relations would seem to reduce both those risks simultaneously.
I really appreciate this post (and am curating it). It's a follow-up to previous work that targets important uncertainties; following up on discussion of an initial piece of work (especially when the discussion is critical) is great — and a focus on the relevant uncertainties or disagreements is really important.
Here's a quote (I added a link to the original post):
Does the distribution of battle deaths follow a power law?
What do we know about the extreme tails of this distribution?
As always, I really appreciate the summary:
Our findings are:
That battle deaths per war are plausibly distributed according to a power law, but few analyses have compared the power law fit to the fit of other distributions. Plus, it’s hard to say what the tails of the distribution look like beyond the wars we’ve experienced so far.
To become more confident in the power law fit, and learn more about the tails, we have to consider theory: what drives war, and how might these factors change as wars get bigger?
Perhaps some factors limit the size of war, such as increasing logistical complexity. One candidate for such a factor is technology. But while it seems plausible that in the past, humanity’s war-making capacity was not sufficient to threaten extinction, this is no longer the case.
This suggests that wars could get very, very bad: we shouldn’t rule out the possibility that war could cause human extinction.
I also like the uncertainties and ways the tentative conclusions could be incorrect are outlined (e.g. in this section, but also even in the summary). And the conclusion provides suggestions for future research based on those uncertainties.
Somewhat related (discussions of the likelihood of war, not how bad it could get):
>So on technological grounds, at least, there seem to be no strong reasons to think that the distribution of war outcomes continues all the way to the level of human extinction.
Is this possibly missing a 'not' in there? It seems like you just concluded that there was no reason to think there was a cap on how many deaths could come from advanced military AI systems, then conclude there's no strong reason to think the distribution continues all the way to extinction?
I would argue that technology is changing wars such that the models of the past are irrelevant. We are entering the age of ultra-precision where making a weapon twice as accurate only requires 1/8 the destructive force to maintain the same lethality.
In the future, the expanded use of things like drones coupled with facial recognition and other advanced sensors, will make war more personal but overall, less destructive. The goals of modern warfare are more about capitulation than killing. Killing is the result of forcing your will upon an adversary but it isn't the end goal and neither is the total destruction of an adversaries country.
Nukes have never been used because there has never been a compelling use case while the reasons not to use them exist in abundance. For over 70 years, nukes as a deterrence has prevented another world scale war.
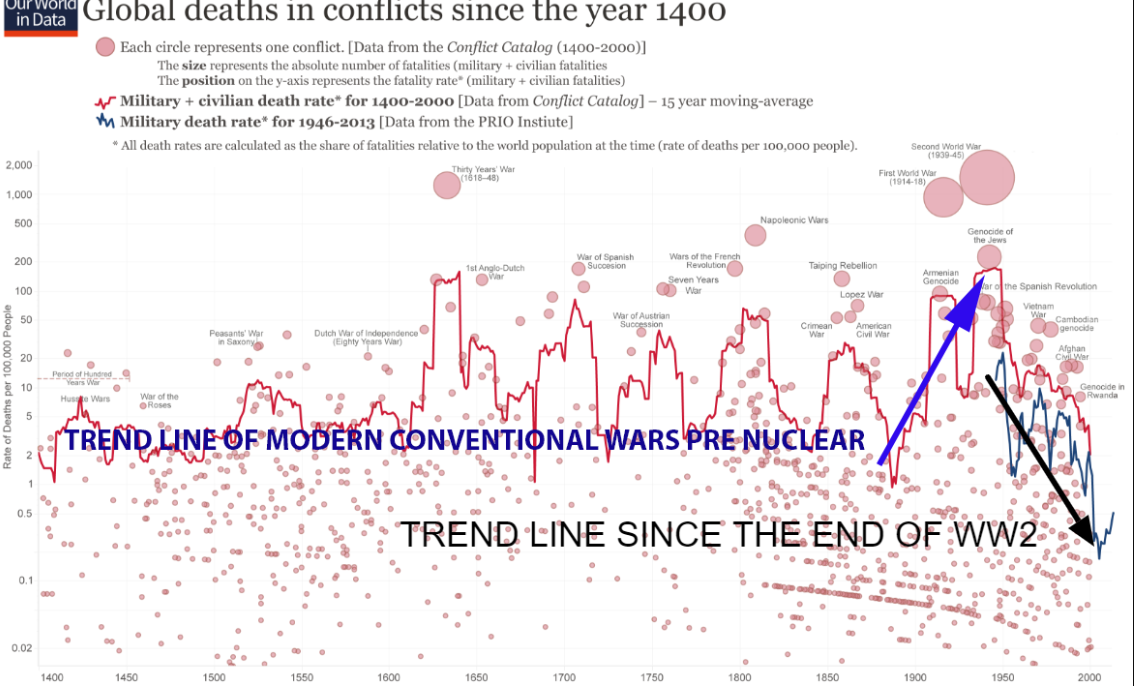
What this chart suggests is that currently, the world overall, is in the most peaceful extended period seen in over 600 years. Global warfare changed forever in 1945.
The pre nuclear modern warfare trend line is an expression of the industrialization of killing. In a nuclear free world, we would have made killing more and more efficient making the horrors of the battlefield truly unbelievable.
Yet that is not quite as chilling as the prospect of nuclear war. Conventional wars would have likely occurred on the global scale at least once since the end of WW2. The use of chemical weapons and bio weapons would have likely been in the mix. The use of such weapons is muted today as such large-scale use would warrant a nuclear response. Without nukes there is no such direct threat discouraging their use.
She found six papers and one book in which a power law distribution is fitted to data on battle deaths per war. In each case, a power law was found to be a plausible fit for the conflict data. Estimates for the of conflict death data range from 1.35 to 1.74, with a mean of 1.60. Anything in this range would be considered a relatively low value of (most empirical power laws have values between 2 and 3). In other words, if these estimates are accurate, the tail of the battle death distributions is scarily long.
Nitpick. I think "tail index" is missing before " of conflict death data range".
This is a fascinating read, however I tend to agree mostly with the end and the conclusions rather than the approach. I think that the question posed somehow cannot be answered by a natural-science based approach, that it's one to be approached best by the tools of history or maybe IR rather than power distributions, as a eras change, even between WWI, WWII and 2022, and big wars are quite sui generis events. A parameter that I would like to see in such an analysis would be how much more interconnected our world is at present and that it may get in the future. Here's two examples from the present: a) the energy situation affecting Europe, and the economic effects of the Ukraine war, and b) internet use - imagine if a rogue country had in its tactics to cut internet supply or attack nuclear facilities or hospitals through cyberwarfare. Or, imagine worse, if the AI you mentioned is linked to the internet and some state hackers decide to hack them, without knowing for example how crazy the AI would go if hacked (ok, i'm stretching it a bit here).
I think more useful a more useful lead from your article is the mention of the democratization and the turning of the tide with citizens not willing to fight in really big and protracted wars (i guess the extinction war would have to escalate a bit before it reaches doomsday point, even though I wouldn't rule out the accidental escalation that would lead to the nuclear winter in like a week or so - I can even see a quick escalation over Taiwan or sth, i hope i'm just naive).
Anyway, this was just a ramble, I apologise for this, the key takeaway from the above that I'd love to discuss with you is that I don't think that power-laws can say much about a war leading to human extinction. On the contrary, history and perhaps psychology (the decisions of those a) deciding politics b) creating weapons and c) using weapons) could be more useful guides.
Hi Haris, thanks for this. I agree that it's useful to tackle such complicated questions from a variety of approaches.
I've written a little bit about interconnectedness and democratization here. I agree they exert some influence on the likelihood of conflict. I do think that the pacifying effects of interconnectedness are somewhat overrated. The economic costs of going to war against any given trade partner are usually small relative to a country's total GDP and the potential gains, material and symbolic, from fighting.
And while I find the evidence for a democratic peace surprisingly strong, it has limited bearing on the possibility of a major war this century because China and Russia are not likely to democratize.
Maybe I didn't explain myself well regarding the interconnectedness, I don't mean bilateral trade (which is what you mention in your linked article) but just the fact that the world we live in is much more brittle in the sense that a black swan event such as a rogue state attacking the internet may have potentially extinction-scale consequences. In other words, before say WWII any war simply couldn't spread to the level of threatening world extinction as there weren't enough nuclear weapons or there were enough third parties either too far away for the conflict or otherwise uninterested to commit their populations to the death. Whereas now, with cyberwarfare, biological warfare and nuclear, it is envisageable that at least one of the Great Powers will regard the whole of the Earth as the War theatre. I hope this explains my idea a bit better.
As democratization, again, I guess as callous as it sounds, the situations currently in Iran and Russia may prove to be good case studies.
First, and most importantly, only two papers in the review also check whether other distributions might fit the same data.
I agree this is crucial. Ultimately, lognormal, power law, power law with exponential cutoff, exponential, and stretched exponential distributions cannot be correct. They do not have an upper bound, whereas:
the range of the battle death distribution can’t stretch to infinity
I think it would be worth fitting the data about the number of deaths as a fraction of the total population to truncated versions of the above distributions to the interval between 0 and 1.
In “How Likely is World War III?”, one of us suggested the chance of an extinction-level war occurring sometime this century is just under 1%. This was a simple, rough estimate, made in the following steps:
Assume that wars, i.e. conflicts that cause at least 1000 battle deaths, continue to break out at their historical average rate of one about every two years.
Assume that the distribution of battle deaths in wars follows a power law.
Use parameters for the power law distribution estimated by Bear Braumoeller in Only the Dead to calculate the chance that any given war escalates to 8 billion battle deaths
Work out the likelihood of such a war given the expected number of wars between now and 2100.
Not everybody was convinced. Arden Koehler of 80,000 Hours, for example, slammed it as “[overstating] the risk because it doesn’t consider that wars would be unlikely to continue once 90% or more of the population has been killed.” While our friendship may never recover, we have to admit that some skepticism is justified. An extinction-level war would be 30-to-100 times larger than World War II, the most severe war humanity has experienced so far.[1] Is it reasonable to just assume number go up? Would the same escalatory dynamics that shape smaller wars apply at this scale?
Forecasting the likelihood of enormous wars is difficult. The extrapolatory approach creates estimates that are sensitive to the data included and the kind of distribution fit, particularly in the tails. But such efforts are important despite their defects. Estimates of the likelihood of major conflict are an important consideration for cause prioritization. And out-of-sample conflicts may account for most of the x-risk accounted for by global conflict. So in this post we interrogate two of the assumptions made in “How Likely is World War III?”:
Does the distribution of battle deaths follow a power law?
What do we know about the extreme tails of this distribution?
Our findings are:
That battle deaths per war are plausibly distributed according to a power law, but few analyses have compared the power law fit to the fit of other distributions. Plus, it’s hard to say what the tails of the distribution look like beyond the wars we’ve experienced so far.
To become more confident in the power law fit, and learn more about the tails, we have to consider theory: what drives war, and how might these factors change as wars get bigger?
Perhaps some factors limit the size of war, such as increasing logistical complexity. One candidate for such a factor is technology. But while it seems plausible that in the past, humanity’s war-making capacity was not sufficient to threaten extinction, this is no longer the case.
This suggests that wars could get very, very bad: we shouldn’t rule out the possibility that war could cause human extinction.
Battle deaths and power laws
Fitting power laws
One way to gauge the probability of out-of-sample events is to find a probability distribution, a mathematical function which gives estimates for how likely different events are, which describes the available data. If we can find a well-fitting distribution, then we can use it to predict the likelihood of events larger than anything we’ve observed, but within the range of the function describing the distribution.
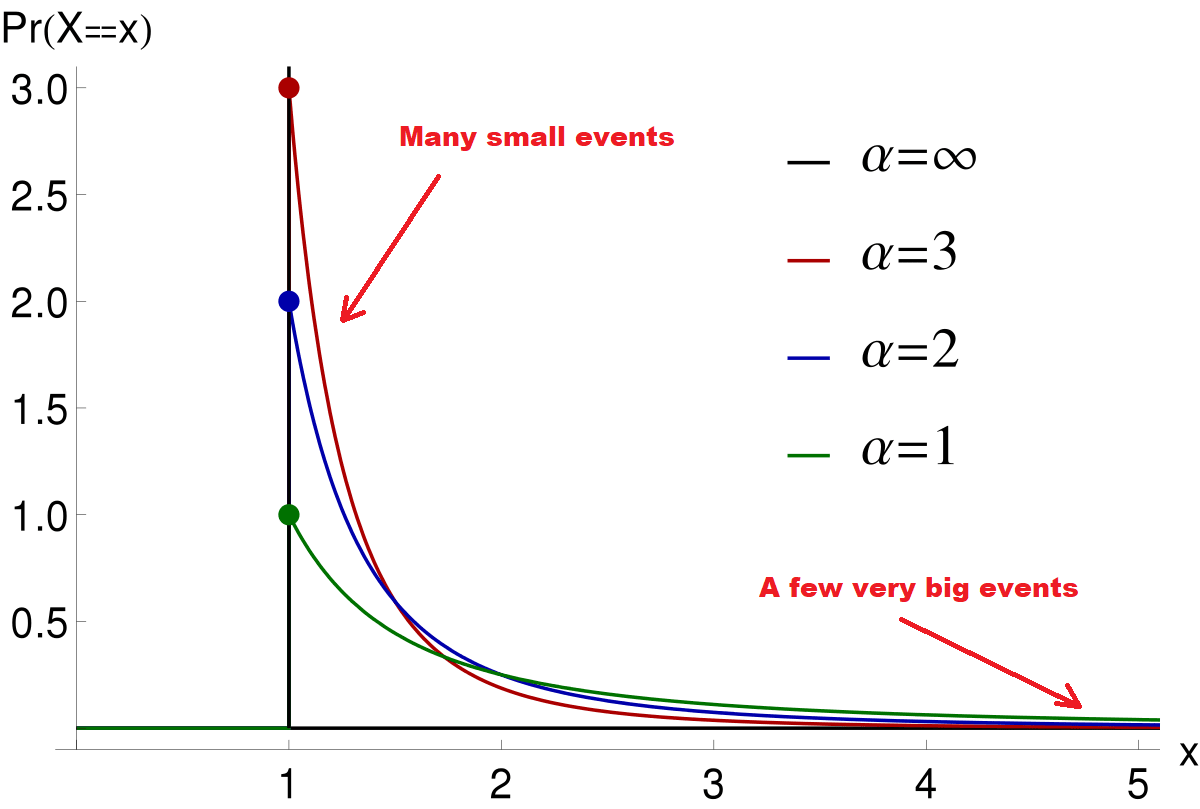
Several researchers have proposed that the number of battle deaths per war is distributed according to a power law. Power law distributions are described by the formula P(x)∝x−α. This means that the probability of event x is proportional to the value of x raised to the power −α. These distributions look like this:
Figure 1. Power law distributions of various scaling parameters
α, the scaling parameter, determines the shape of the distribution. As the figure above shows, the smaller the α, the longer the tails of the distribution. There’s a simple way to interpret this parameter: if one event is twice as large as another, it is 2α times less likely.
Long tails are an important feature of power laws. Events many orders of magnitude larger than the mean or median observation are unlikely, but not impossible. However, we need to be careful when fitting power laws. Other long-tailed distributions may fit the same data, but imply different probabilities for out-of-sample events. Since the tails of power laws are so long, improperly fitting this distribution to our data can lead us to overestimate the likelihood of out-of-sample events.
Power laws and conflict data
Rani conducted an informal literature review to assess the strength of the evidence for a power law distribution of war deaths. You can find a summary of her review, including the goodness-of-fit tests, here.
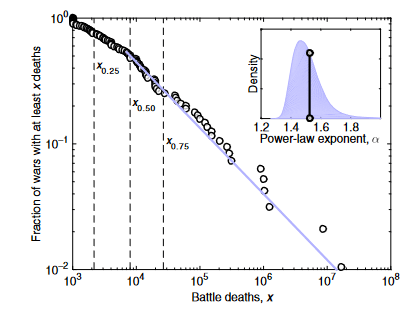
She found six papers and one book in which a power law distribution is fitted to data on battle deaths per war. In each case, a power law was found to be a plausible fit for the conflict data. Estimates for the of conflict death data range from 1.35 to 1.74, with a mean of 1.60. Anything in this range would be considered a relatively low value of (most empirical power laws have values between 2 and 3). In other words, if these estimates are accurate, the tail of the battle death distributions is scarily long.
Figure 2. Clauset (“Trends and fluctuations in the severity of interstate wars”)’s power law model of war severity. Note that the axes are logarithmic and do not start at 0.
How scary exactly? In Only the Dead, political scientist Bear Braumoeller uses his estimated parameters to infer the probability of enormous wars. His distribution gives a 1 in 200 chance of a given war escalating to be twice as bad as World War II and a 3 in 10,000 chance of it causing 8 billion deaths (i.e. human extinction).
That’s bad news. If wars continue to break out at their historical-average rate of one every two years, Braumoeller’s estimates imply a ~18% chance of war twice as bad as World War II and a ~1.2% chance of an extinction war occurring between now and 2100.[2]
Breaking the law
Before we all start digging bunkers, though, it’s worth highlighting a few caveats.
First, and most importantly, only two papers in the review also check whether other distributions might fit the same data.Clauset, Shalizi, and Newman (2009) consider four other distributions,[3] while Rafael González-Val (2015) also considers a lognormal fit. Both papers find that alternative distributions also fit the Correlates of War data well. In fact, when Clauset, Shalizi, and Newman compare the fit of the different distributions, they find no reason to prefer the power law.[4]
Second, there are potentially important data limitations. Wars are relatively rare, especially large wars that kill an appreciable fraction of the world, and death counts are uncertain for many wars. The small sample size makes our estimates of the underlying distributions more uncertain. It also means that our parameter estimates are sensitive, and could change in important ways if uncertain death counts are revised. Unfortunately, our estimates of the probability of extreme tail events are super sensitive to changes in these parameters.
Third, most of the papers we considered use the Correlates of War dataset. Analyses using other datasets may produce different parameter estimates. The CoW dataset also excludes many countries from its dataset in the pre-WWII period.[5] If, for some reason, the excluded countries were more likely than average to fight especially large or small wars, then the estimates using these data may be biased.
Fourth, analyses that group together wars over time implicitly ignore potential changes in the distribution over time. Perhaps the probability distribution for deaths in a 21st century war is different from the distributions for 20th or 19th century wars. Whether the frequency or severity of war has been changing over time is a complicated question.[6] Economic growth, globalization, technological change, and political and social institutions are dynamic and all plausibly influence the conduct of war.
What does the tail of the distribution look like?
To summarize the previous section: battle deaths are plausibly distributed according to a power law. But there is some evidence that other distributions also fit the same data. We also have to contend with the fact that we have a small sample size and the distribution could be changing over time.
Suppose, though, that we could establish with confidence that battle deaths are power law distributed. Extrapolating would still pose a problem. Power laws with α<2 have an infinite mean. But the range of the battle death distribution can’t stretch to infinity. Its upper bound must be, at most, the global population. And it could even be lower than this, with the distribution bending downwards at some point between the largest war we’ve observed and the logical limit.[7] We can't tell if or where the distribution is capped based on data alone. We need to consider “physical motivating or theoretical factors.”[8]
Cioffi-Revilla and Midlarsky (2004), for example, argue that enormous wars are less likely than they should be according to a power law.[9] They venture two explanations for this observation. First, they suggest that as a larger proportion of the population is drawn into the war, public pressure on the government to end the war grows. This “democratization” of war limits the extent to which they can scale. Second, the international system is “finite”. As wars escalate they become more complex. They suggest that the diplomatic, strategic, and logistical dynamics of enormous wars may be too difficult to manage.[10]
While we don’t find either of those explanations fully convincing, at least Cioffi-Revilla and Midlarsky are trying to sketch the tail of the distribution. This is a rich vein for future research. We’d be very interested in seeing analyses that try to connect the observed distribution of outcomes to insights from the IR literature on models of escalation. These would give more insight into the shape of the tail.
Here we want to touch on a narrower, and perhaps distinctly EA, claim. Are there technological reasons to think the distribution of outcomes is bounded at a severity level below extinction? In other words, do we have the weaponry to kill ourselves in war?[11]
Weapon technology as a mechanistic factor
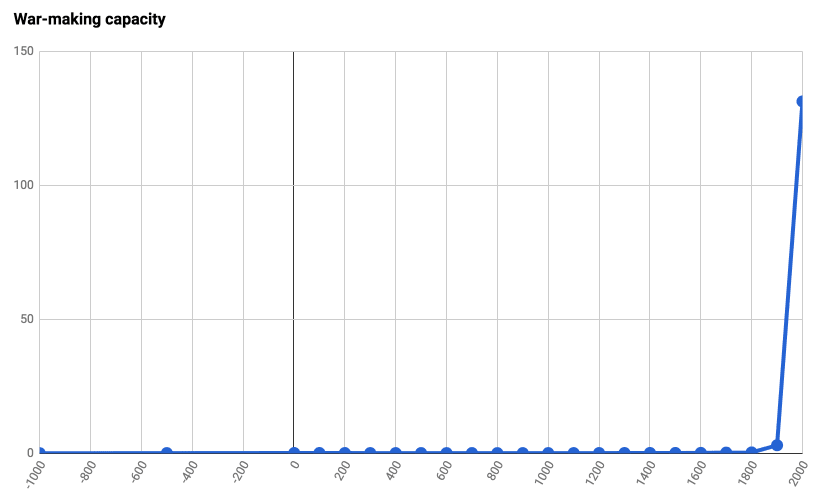
In the 19th century, the first century included in the Correlates of War dataset, it’s plausible that technology limited the degree to which wars could escalate. To be sure, some extremely bloody wars were still fought. In the Paraguayan War of 1864-70, for example, it’s plausible that more than half of Paraguay’s population was killed (though estimates are highly uncertain). 5% of the combined population of Paraguay, Brazil, Argentina, and Uruguay died in that war, making it the most intense conflict since 1816 at least even before accounting for civilian deaths.[12] But it surely stretches credulity to think that this war, or even larger conflicts like the Napoleonic Wars, could have continued escalating until they threatened all of humanity.[13]
But in a world of ICBMs, biological agents, kamikaze drones, and autonomous systems, technology is less of a constraint.
Figure 3. Source: Luke Muehlhauser, “How big a deal was the Industrial Revolution?”, Luke Muehlhauser (blog), https://lukemuehlhauser.com/industrial-revolution
Nuclear weapons may have the potential to cause a nuclear winter that threatens extinction, though this is controversial and surprisingly understudied. pp. 84-91 of the Founders Pledge report expresses skepticism about this (though did not rule it out). We’ve become slightly more concerned after the Metaculus Nuclear Horizons forecasts, which put worryingly high probabilities on extreme death counts following nuclear exchanges. Like, a 45% chance of >4 billion deaths given 1000 detonations or more. That seems too high: there aren’t that many forecasts, and a similar question puts just a 2% chance of extinction in the same scenario. It seems we should have some credence on the possibility that an all-out nuclear war could cause extinction, though it may be unlikely.
Emerging technologies, chiefly bioweapons or military AI systems, also seem to have the potential to cause human extinction.[14] The risk of a catastrophic, extinction-level biological event is “difficult to rule out”.[15] Deliberate use in a war is among the plausible trigger mechanisms for such an event. Autonomous systems are, potentially, scarier still. In fact, military AI systems pose special risks as they’re likely to be developed in secrecy, linked to weapons technologies like drones and missile systems, and deployed in “complex, hazardous, and adversarial environments”.[16] Again there doesn’t seem to be a strong reason to think there’s an upper bound to the amount of people that could be killed in a war featuring widespread deployment of AI commanders or lethal autonomous weapons systems.[17]
So on technological grounds, at least, there seem to be no strong reasons to think that the distribution of war outcomes is capped below the level of human extinction.
Conclusion
We set out to investigate what the probability distribution of outcomes looks like for a modern global war. Some IR research has shown that a power law distribution is a plausible fit given the battle death data we have. But few analyses have compared the fit to that of other distributions, and the few that have found that it’s not clearly better than a log-normal or cut-off power law distribution. Plus, even if fitting a power law is appropriate, the extent to which we can extrapolate this distribution to infer the likelihood of events outside of the available data is unclear. So we have to go beyond the data and ask: given what we know about how wars are fought, does a war so large it constitutes an existential catastrophe seem implausible?
There are many different factors one could consider, and unfortunately a dearth of literature to rely on. Focusing on the reach of modern weapons, we found no strong reasons to think that an extinction-level war is not technologically possible. A 21st century great power war could see weapons of mass destruction deployed on an unprecedented scale. Since we cannot rule out extinction-level scenarios following the use of bioweapons or advanced military AI systems, it’s plausible that the distribution of possible outcomes includes extinction.
Of course, there could be other limiting factors. Future research could examine other candidates. For example, how do the political costs of further escalation change? How does the ratio of civilian to military deaths change? Are there logistical, tactical, or economic factors that limit how large wars can get? And for any proposed “limiting factor”, how does it interact with the existential risk of a runaway bioweapon or military AI system?
Given the destructive potential of nukes, bioweapons and AI systems, though, our guess is that it will be hard to rule out the possibility that a war could get very, very bad indeed. We don’t think there’s an upper bound: not at 5%, nor at 90%, nor at any point in between.
The severity of a war refers to the number of battle deaths it causes. World War II killed about 65 million people, which was ~3% of the global population at the time. So a modern extinction-level war would be about 100 times more severe in absolute terms and 30 times more severe in proportional terms. In this post we also sometimes refer to the intensity of a war. This refers to the number of battle deaths divided by the pooled populations of the countries involved.
Note that this uses Braumoeller’s estimates of the distribution of severity: the number of battle deaths. This may underestimate the chance of an extinction war for at least two reasons. First, world population has been growing over time. If we instead considered the proportion of global population killed per war instead, extreme outcomes may seem more likely. Second, he does not consider civilian deaths. Historically, the ratio of civilian-deaths-to-battle deaths in war has been about 1-to-1 (though there’s a lot of variation across wars). So fewer than 8 billion battle deaths would be required for an extinction war, since many civilians would also be killed.
“In particular, the distributions for birds, books, cities, religions, wars, citations, papers, proteins, and terrorism are plausible power laws, but they are also plausible log-normals and stretched exponentials” (Clauset, Shalizi, and Newman, 2009, p. 26).
Note that stretched exponential is not found to be a good fit for the war data; see Table 6.2 on p. 28 of the paper for details.
It should also be noted that, confusingly, a “cut off” power law distribution doesn’t actually have a hard upper bound; instead, the distribution is multiplied by an exponential function. This “thins” the tail but doesn’t actually change the range.
“In cases such as these, it is important to look at physical motivating or theoretical factors to make a sensible judgment about the which [sic] distributional form is more reasonable—we must consider whether there is a mechanistic or other non-statistical argument favoring one distribution or another” (Clauset, Aaron, Cosma Rohilla Shalizi, and Mark EJ Newman. "Power-law distributions in empirical data." SIAM review 51, no. 4 (2009): 26).
More specifically, they compare a distribution fitted to the entire Correlates of War dataset to a distribution fitted to the “top decile of international wars” (n=13). They find that the parameters are significantly different. This violates one of the properties of “true” power law distributions, which is that the same parameters describe the data everywhere in its range.
“there are just so many belligerents, so many possible war alliances, so much armament, so many combat fronts that can be managed simultaneously, and so forth. As a result, the theoretically possible largest magnitudes of warfare are never actually realized due to the underlying anite dynamics” Cioffi-Revilla, C., & Midlarsky, M. I. (2004). Power laws, scaling, and fractals in the most lethal international and civil wars. In The Scourge of War: New Extensions on an Old Problem (p. 23).
This focus may seem too narrow. But if we can find just one limiting factor among the various inputs needed for war, then we can be confident in lowering our upper bound.
What about before the 18th century? Luke Muehlhauser has estimated that 9.5% of the world’s population died in Ghengis Khan’s conquests. That's still well short of an extinction-threatening catastrophe (Muehlhauser, Luke. “How big a deal was the Industrial Revolution?”, Luke Muehlhauser (blog), https://lukemuehlhauser.com/industrial-revolution).
On bioweapons, you might want to read 80,000 Hours’ article on biological risks and W. Seth Carus’ review of biological weapons programs since 1915. For military AI, we recommend Christian Ruhl’s report for Founders Pledge.
In fact, Paul Scharre of the Center for a New American Security has previously speculated that AI could make escalation more likely (Scharre, “ AI arms race”).
This is a crosspost from the new Animal Welfare Alignment Newsletter by Anima International. You can subscribe on Substack if you are interested in following these efforts. Audio reading also available on Substack.
The goals of this post are to:
1. Raise a question I see as crucially important to the goal of aligning AI to animal welfare...
Hello! I'm Justin Portela. I got hired by GWWC to make YouTube videos after AI in Context did such a kickass job.
My channel is using that same cinematic, high-production value beauty to talk about everything in the EA universe that isn't AI.
...
This is a linkpost for Request for Proposals: Research and Applied Work on Digital Minds.
I'm glad to announce a request for proposals for research and applied work on digital minds at Longview Ph...


Sounds right!
This made me realise that my post is confusing/miseadling in a particular way -- because of the context of the 80,000 Hours problem profiles page, I was thinking of the question like "what's the leftover x-risk from conflict once you aren't considering AI, bio, or nukes (since those have their own problem profiles)"? But that context is much stronger in my head than in the readers', and should be made explicit.
I guess also AI-as-a-weapon should perhaps fall into the great power conflict bucket, as it's not discussed that much in the AI profile.
Thanks Arden, that makes sense. I think it will be hard to separate "x-risk from conventional war" from "x-risk from war fought with WMDs and autonomous weapons" because pacifying interventions like improving US-China relations would seem to reduce both those risks simultaneously.