Thanks again for this post, Vasco, and for sharing it with me for discussion beforehand. I really appreciate your work on this question. It's super valuable to have more people thinking deeply about these issues and this post is a significant contribution.
The headline of my response is I think you're pointing in the right direction and the estimates I gave in my original post are too high. But I think you're overshooting and the probabilities you give here seem too low.
I have a couple of points to expand on; please do feel free to respond to each in individual comments to facilitate better discussion!
To summarize, my points are:
I think you're right that my earlier estimates were too high; but I think this way overcorrects the other way.
There are some issues with using the historical war data
I'm still a bit confused and uneasy about your choice to use proportion killed per year rather than proportion or total killed per war.
I think your preferred estimate is so infinitesimally small that something must be going wrong.
First, you're very likely right that my earlier estimates were too high. Although I still put some credence in a power law model, I think I should have incorporated more model uncertainty, and noted that other models would imply (much) lower chances of extinction-level wars.
I think @Ryan Greenblatt has made good points in other comments so won't belabour this point other than to add that I think some method of using the mean, or geometric mean, rather than median seems reasonable to me when we face this degree of model uncertainty.
One other minor point here: a reason I still like the power law fit is that there's at least some theoretical support for this distribution (as Bear wrote about in Only the Dead). Whereas I haven't seen arguments that connect other potential fits to the theory of the underlying data generating process. This is pretty speculative and uncertain, but is another reason why I don't want to throw away the power law entirely yet.
Second, I'm still skeptical that the historical war data is the "right" prior to use. It may be "a" prior but your title might be overstating things. This is related to Aaron's point you quote in footnote 9, about assuming wars are IID over time. I think maybe we can assume they're I (independent), but not that they're ID (identically distributed) over time.
I think we can be pretty confident that WWII was so much larger than other wars not just randomly, but in fact because globalization[1] and new technologies like machine guns and bombs shifted the distribution of potential war outcomes. And I think similarly that distribution has shifted again since. Cf. my discussion of war-making capacity here. Obviously past war size isn't completely irrelevant to the potential size of current wars, but I do think not adjusting for this shift at all likely biases your estimate down.
Third, I'm still uneasy about your choice to use annual proportion of population killed rather than number of deaths per war. This is just very rare in the IR world. I don't know enough about how the COW data is created to assess it properly. Maybe one problem here is that it just clearly breaks the IID assumption. If we're modelling each year as a draw, then since major wars last more than a year the probabilities of subsequent draws are clearly dependent on previous draws. Whereas if we just model each war as a whole as a draw (either in terms of gross deaths or in terms of deaths as a proportion of world population), then we're at least closer to an IID world. Not sure about this, but it feels like it also biases your estimate down.
Finally, I'm a bit suspicious of infinitesimal probabilities due to the strength they give the prior. They imply we'd need enormously strong evidence to update much at all in a way that seems unreasonable to me.
Let's take your preferred estimate of an annual probability of "6.36*10^-14". That's a 1 in 15,723,270,440,252 chance. That is, 1 in 15 trillion years.
I look around at the world and I see a nuclear-armed state fighting against a NATO-backed ally in Ukraine; I see conflict once again spreading throughout the Middle East; I see the US arming and perhaps preparing to defend Taiwan against China, which is governed by a leader who claims to consider reunification both inevitable and an existential issue for his nation.
And I see nuclear arsenals that still top 12,000 warheads and growing; I see ongoing bioweapons research powered by ever-more-capable biotechnologies; and I see obvious military interest in developing AI systems and autonomous weapons.
This does not seem like a situation that only leads to total existential destruction once every 15 trillion years.
I know you're only talking about the prior, but your preferred estimate implies we'd need a galactically-enormous update to get to a posterior probability of war x-risk that seems reasonable. So I think something might be going wrong. Cf. some of Joe's discussion of settling on infinitesimal priors here.
All that said, let me reiterate that I really appreciate this work!
What I mean here is that we should adjust somewhat for the fact that world wars are even possible nowadays. WWII was fought across three or four continents; that just couldn't have happened before the 1900s. But about 1/3 of the COW dataset is for pre-1900 wars.
Third, I'm still uneasy about your choice to use annual proportion of population killed rather than number of deaths per war. This is just very rare in the IR world.
Looking into annual war deaths as a fraction of the global population is relevant to estimate extinction risk, but the international relations world is not focussing on this. For reference, here is what I said about this matter in the post:
Stephen commented I had better follow the typical approach of modelling war deaths, instead of annual war deaths as a fraction of the global population, and then getting the probability of human extinction from the chance of war deaths being at least as large as the global population. I think my approach is more appropriate, especially to estimate tail risk. There is human extinction if and only if annual war deaths as a fraction of the global population are at least 1. In contrast, war deaths as a fraction of the global population in the year the war started being at least 1 does not imply human extinction. Consider a war lasting for the next 100 years totalling 8 billion deaths. The war deaths as a fraction of the global population in the year the war started would be 100 %, which means such a war would imply human extinction under the typical approach. Nevertheless, this would only be the case if no humans were born in the next 100 years, and new births are not negligible. In fact, the global population increased thanks to these during the years with the most annual war deaths of combatants in the data I used:
From 1914 to 1918 (years of World War 1), they were 9.28 M, 0.510 % (= 9.28/(1.82*10^3)) of the global population in 1914, but the global population increased 2.20 % (= 1.86/1.82 - 1) during this period.
From 1939 to 1945 (years of World War 2), they were 17.8 M, 0.784 % (= 17.8/(2.27*10^3)) of the global population in 1939, but the global population increased 4.85 % (= 2.38/2.27 - 1) during this period.
Do you have any thoughts on the above?
I don't know enough about how the COW data is created to assess it properly. Maybe one problem here is that it just clearly breaks the IID assumption. If we're modelling each year as a draw, then since major wars last more than a year the probabilities of subsequent draws are clearly dependent on previous draws. Whereas if we just model each war as a whole as a draw (either in terms of gross deaths or in terms of deaths as a proportion of world population), then we're at least closer to an IID world. Not sure about this, but it feels like it also biases your estimate down.
It is unclear to me whether this is a major issue, because both methodolies lead to essentially the same annual war extinction risk for a power law:
Like I anticipated, the best fit Pareto (power law) resulted in a higher risk, 0.0122 % (R^2 of 99.7 %), i.e. 98.4 % (= 1.22*10^-4/(1.24*10^-4)) of Stephen’s 0.0124 %. Such remarkable agreement means the extinction risk for the best fit Pareto is essentially the same regardless of whether it is fitted to the top 10 % logarithm of the annual war deaths of combatants as a fraction of the global population (as I did), or to the war deaths of combatants per war (as implied by Stephen using Bear’s estimates). I guess this qualitatively generalises to other types of distributions. In any case, I would rather follow my approach.
Second, I'm still skeptical that the historical war data is the "right" prior to use. It may be "a" prior but your title might be overstating things. This is related to Aaron's point you quote in footnote 9, about assuming wars are IID over time. I think maybe we can assume they're I (independent), but not that they're ID (identically distributed) over time.
Historical war deaths seem to me like the most natural prior to assess future war deaths. I guess you consider it a decent prior too, as you relied on historical war data to get your extinction risk, but maybe you have a better reference class in mind?
Aron's point about annual war deaths not being IID over time does not have a clear impact on my estimate for the annual extinction risk. If one thinks war deaths have been decreasing/increasing, then one should update towards a lower/higher extinction risk. However:
There is not an obvious trend in the past 600 years (see last graph in the post).
My impression is that there is lots of debate in the literature, and that the honest conclusion is that we do not have enough data to establish a clear trend.
I think Aron's paper (Clauset 2018) agrees with the above:
Since 1945, there have been relatively few large interstate wars, especially compared to the preceding 30 years, which included both World Wars. This pattern, sometimes called the long peace, is highly controversial. Does it represent an enduring trend caused by a genuine change in the underlying conflict-generating processes? Or is it consistent with a highly variable but otherwise stable system of conflict? Using the empirical distributions of interstate war sizes and onset times from 1823 to 2003, we parameterize stationary models of conflict generation that can distinguish trends from statistical fluctuations in the statistics of war. These models indicate that both the long peace and the period of great violence that preceded it are not statistically uncommon patterns in realistic but stationary conflict time series.
I think there is also another point Aron was referring to in footnote 9 (emphasis mine):
you have a deeper assumption that is quite questionable, which is whether events are plausibly iid [independent and identically distributed] over such a long time scale. This is where the deep theoretical understanding from the literature on war is useful, and in my 2018 paper [Clauset 2018], my Discussion section delves into the implications of that understanding for making such long term and large-size extrapolations.
Relevant context for what I highlighted above:
Clauset 2018 did estimate a 50 % probability of a war causing 1 billion battle deaths[15] in the next 1,339 years (see “The long view”), which is close to my pessimistic scenario [see post for explanation]
I think Aron had the above in mind, and therefore was worried about assuming wars are IID over a long time, because this affects how much time it would take in expectation for a war to cause extinction. However, in my post I am estimating this time, but rather the nearterm annual probability of a war causing extinction, which does not rely on assumptions about whether wars will be IID over a long time horizon. I alluded to this in footnote 9:
Assuming wars are IID over a long time scale would be problematic if one wanted to estimate the time until a war caused human extinction, but I do not think it is an issue to estimate the nearterm annual extinction risk.
It is possible you missed this part, because it was not in the early versions of the draft.
I think we can be pretty confident that WWII was so much larger than other wars not just randomly, but in fact because globalization[1] and new technologies like machine guns and bombs shifted the distribution of potential war outcomes.
Some thoughts on the above:
What directy matters to assess the annual probability of a war causing human extinction is not war deaths, but annual war deaths as a fraction of the global population. For instance, one can have increasing war deaths with constant annual probability of a war causing human extinction if wars become increasinly long and population increases. Hopefully not, but it is possible wars in the far future will routinely wipe out e.g. trillions of digital minds while not posing any meaningful risk of wiping out all digital minds due to the existence of a huge population.
It is unclear to me whether globalisation makes wars larger. For example, globalisation is associated with an expansion of international trade, and this can explain the "durable peace hypothesis" (see Jackson 2015).
In agreement with deterrence theory, I believe greater potential to cause damage may result in less expected damage, although I am personally not convinced of this.
Even if globalisation makes wars larger, it could make them less frequent too, such that the expected annual damage decreases, and so does the annual probability of one causing extinction.
And I think similarly that distribution has shifted again since. Cf. my discussion of war-making capacity here. Obviously past war size isn't completely irrelevant to the potential size of current wars, but I do think not adjusting for this shift at all likely biases your estimate down.
I assume increasing capability to cause damage is the main reason for people arguing that future wars would belong to a different category. Yet:
I think war capabilities have been decreasing or not changing much in the last few decades:
"Nuclear risk has been decreasing. The estimated destroyable area by nuclear weapons deliverable in a first strike has decreased 89.2 % (= 1 - 65.2/601) since its peak in 1962" (see 1st graph below).
Military expenditure as a fraction of global GDP has decreased from 1960 to 2000, and been fairly constant since then (see 2nd graph below).
Taking a broader view, war capabilities do have been increasing, but there is not a clear trend in the deaths in conflicts as a fraction of the global population since 1400 (see last figure in the post).
Increases in the capability to cause damage are usually associated with increases in the capability to prevent damage, which I guess explains what I said just above, so one should not forecast future risk based on just one side alone.
Thanks for all the feedback, and early work on the topic, Stephen! I will reply to your points in different comments as you suggested.
First, you're very likely right that my earlier estimates were too high. Although I still put some credence in a power law model, I think I should have incorporated more model uncertainty, and noted that other models would imply (much) lower chances of extinction-level wars.
To be fair, you and Rani had a section on breaking the [power] law where you say other distributions would fit the data well (although you did not discuss the implications for tail risk):
First, and most importantly, only two papers in the review also check whether other distributions might fit the same data.Clauset, Shalizi, and Newman (2009) consider four other distributions,[3] while Rafael González-Val (2015) also considers a lognormal fit. Both papers find that alternative distributions also fit the Correlates of War data well. In fact, when Clauset, Shalizi, and Newman compare the fit of the different distributions, they find no reason to prefer the power law.[4]
With respect to the below, I encourage readers to check the respective thread for context.
I think @Ryan Greenblatt has made good points in other comments so won't belabour this point other than to add that I think some method of using the mean, or geometric mean, rather than median seems reasonable to me when we face this degree of model uncertainty.
As I explained in the thread, I do not think a simple mean is appropriate. That being said, the mean could also lead to astronomically low extinction risk. With the methodology I followed, one has to look into at least 34 distributions for the mean not to be astronomically low. I have just obtained the following graph in this tab:
You suggested using the geometric mean, but it is always 0 given the null annual extinction risk for the top distribution, so it does not show up in the above graph. The median only is non-null for at least 84 distributions. I looked into all the 111 types of distributions available in SciPy, since I wanted to minimise cherry-picking as much as possible, but typical analyses only study 1 or a few. So it would have been easy to miss on noticing that the mean could lead to a much higher extinction risk.
Incidentally, the steep increase in the red line of the graph above illustrates one worry I have about using the mean I had alluded to in the thread. The simple mean is not resistant to outliers, in the sense that these are overweighted[1]. I have a strong intuition that, given 33 models outputting an annual extinction risk between 0 and 9.07*10^-14, with mean 1.15*10^-13 among them, one should not update upwards by 8 OOMs to an extinction risk of 6.45*10^-6 after integrating a 34th model outputting an annual extinction risk of 0.0219 % (similar to yours of 0.0124 %). Under these conditions, I think one should put way less weight on the 34th model (maybe roughly no weight?). As Holden Karnofsky discusses in the post Why we can’t take expected value estimates literally (even when they’re unbiased):
An EEV [explicit expected value] approach to this situation [analogous to using the simple mean in our case] might say, “Even if there’s a 99.99% chance that the estimate [of high extinction risk] is completely wrong and that the value of Action A is 0, there’s still an 0.01% probability that Action A has a value of X. Thus, overall Action A has an expected value of at least 0.0001X; the greater X is, the greater this value is, and if X is great enough [if there are a few models outputting a high enough extinction risk] then, then you should take Action A unless you’re willing to bet at enormous odds that the framework is wrong.”
However, the same formula discussed above indicates that Action X actually has an expected value – after the Bayesian adjustment – of X/(X^2+1), or just under 1/X. In this framework, the greater X is [the higher the extinction risk of a poorly calibrated model], the lower the expected value of Action A [the lower the product between the weight a poorly calibrated model should receive and its high extinction risk]. This syncs well with my intuitions: if someone threatened to harm one person unless you gave them $10, this ought to carry more weight (because it is more plausible in the face of the “prior” of life experience) than if they threatened to harm 100 people, which in turn ought to carry more weight than if they threatened to harm 3^^^3 people (I’m using 3^^^3 here as a representation of an unimaginably huge number).
Ideally, one would do more research to find how much weight each distribution should receive. In the absence of that, I think using the median is a simple way to adequately weight outliers.
One other minor point here: a reason I still like the power law fit is that there's at least some theoretical support for this distribution (as Bear wrote about in Only the Dead).
The worry here is that the theoretical support for using a power law breaks at some point. According to a power law, the probability p1 of at least 8 billion deaths conditional on 800 M deaths is the same as the probability p2 of 80 billion deaths conditional on 8 billion deaths. However, p1 is low[2] whereas p2 is 0.
Whereas I haven't seen arguments that connect other potential fits to the theory of the underlying data generating process.
There is this argument I mentioned in the post:
In addition, according to extreme value theory (EVT), the right tail should follow a generalised Pareto[10], and the respective best fit distribution resulted in an extinction risk of exactly 0[11] (R^2 of 99.8 %). Like I anticipated, the best fit Pareto (power law) resulted in a higher risk, 0.0122 % (R^2 of 99.7 %), i.e. 98.4 % (= 1.22*10^-4/(1.24*10^-4)) of Stephen’s 0.0124 %. Such remarkable agreement means the extinction risk for the best fit Pareto is essentially the same regardless of whether it is fitted to the top 10 % logarithm of the annual war deaths of combatants as a fraction of the global population (as I did), or to the war deaths of combatants per war (as implied by Stephen using Bear’s estimates). I guess this qualitatively generalises to other types of distributions. In any case, I would rather follow my approach.
I should note I have just updated in the post the part of the sentence above after "i.e.". Previously, I was comparing the annual war extinction risk of my best fit power law with your extinction risk per war under the "constant risk hypothesis". Now I am making the correct comparison with your annual war extinction risk.
This is pretty speculative and uncertain, but is another reason why I don't want to throw away the power law entirely yet.
Just to clarify, I am still accounting for the results of the power law in my best guess. However, since I am using the median to aggregate the various estimates of the extinction risk, I get astronomically low extinction risk even accounting for distributions predicting super high values.
Thanks Vasco! I'll come back to this to respond in a bit more depth next week (this is a busy week).
In the meantime, curious what you make of my point that setting a prior that gives only a 1 in 15 trillion chance of experiencing an extinction-level war in any given year seems wrong?
I'll come back to this to respond in a bit more depth next week (this is a busy week).
No worries, and thanks for still managing to make an in-depth comment!
In the meantime, curious what you make of my point that setting a prior that gives only a 1 in 15 trillion chance of experiencing an extinction-level war in any given year seems wrong?
I only managed to reply to 3 of your points yesterday and during this evening, but I plan to address that 4th one still today.
Finally, I'm a bit suspicious of infinitesimal probabilities due to the strength they give the prior. They imply we'd need enormously strong evidence to update much at all in a way that seems unreasonable to me.
[...]
Cf. some of Joe's discussion of settling on infinitesimal priors here.
I think there is a potential misunderstanding here. Joe Carlsmith's[1]discussion on the contraints on future updating apply to one's best guess. In contrast, my astronomically low best guess prior is not supposed to be neither my current best guess nor a preliminary best guess from which one should formally update towards one's best guess. That being said, historical war deaths seem to me like the most natural prior to assess future war deaths, so I see some merit in using my astronomically low best guess prior as a preliminary best guess.
I also agree with Joe that an astronomically low annual AI extinction risk (e.g. 6.36*10^-14) would not make sense (see this somewhat related thread). However, I would think about the possibility of AI killing all humans in the context of AI risk, not great power war.
Let's take your preferred estimate of an annual probability of "6.36*10^-14". That's a 1 in 15,723,270,440,252 chance. That is, 1 in 15 trillion years.
I look around at the world and I see a nuclear-armed state fighting against a NATO-backed ally in Ukraine; I see conflict once again spreading throughout the Middle East; I see the US arming and perhaps preparing to defend Taiwan against China, which is governed by a leader who claims to consider reunification both inevitable and an existential issue for his nation.
And I see nuclear arsenals that still top 12,000 warheads and growing; I see ongoing bioweapons research powered by ever-more-capable biotechnologies; and I see obvious military interest in developing AI systems and autonomous weapons.
This does not seem like a situation that only leads to total existential destruction once every 15 trillion years.
I feel like the sentiment you are expressing describing current events and trends would also have applied in the past, and today to risks which you might consider overly low. On the one hand, I appreciate a probability like 6.36*10^-14 intuitively feels way too small. On the other, humans are not designed to intuitively/directly assess the probability of rare events in a reliable way. These involve many steps, and therefore give rise to scope neglect.
As a side note, I do not think there is an evolutionary incentive for an individual human to accurately distinguishing between an extinction risk of 10^-14 and 0.01 %, because both are negligible in comparison with the annual risk of death 1 % (for a life expectancy of 100 years). Relatedly, I mentioned in the post that:
In general, I suspect there is a tendency to give probabilities between 1 % and 99 % for events whose mechanics we do not understand well [e.g. extinction conditional on a war larger than World War 2], given this range encompasses the vast majority (98 %) of the available linear space (from 0 to 1), and events in everyday life one cares about are not that extreme. However, the available logarithmic space is infinitely vast, so there is margin for such guesses to be major overestimates. In the context of tail risk, subjective guesses can easily fail to adequately account for the faster decay of the tail distribution as severity approaches the maximum.
In addition, I guess my astronomically low annual war extinction risk feels like an extreme value to many because they have in the back of their minds Toby's guesses for the existential risk between 2021 and 2120 given in The Precipice. The guess was 0.1 % for nuclear war, which respects an annual existential risk of around 10^-5, way larger than the estimates for annual war extinction risk I present in my post. Toby does not mechanistically explain how he got his guesses, but I do not think he used quantitative models to derive them. So I think they may well be prone to scope neglect. In terms of Toby's guesses, I also mentioned in the post that:
In general, I agree with David Thorstad that Toby Ord’s guesses for the existential risk between 2021 and 2120 given in The Precipice are very high (e.g. 0.1 % for nuclear war). In the realm of the more anthropogenic AI, bio and nuclear risk, I personally think underweighting the outside view is a major reason leading to overly high risk. I encourage readers to check David’s series exaggerating the risks, which includes subseries on climate, AI and bio risk.
To give an example that is not discussed by David, Salotti 2022 estimated the extinction risk per century from asteroids and comets is 2.2*10^-12 (see Table 1), which is 6 (= log10(10^-6/(2.2*10^-12)) orders of magnitude lower than Toby Ord’s guess for the existential risk. The concept of existential risk is quite vague, but I do not think one can say existential risk from asteroids and comets is 6 orders of magnitude higher than extinction risk from these:
There have been 5 mass extinctions, and the impact winter involved in the last one, which played a role in the extinction of the dinosaurs, may well have contributed to the emergence of mammals, and ultimately humans.
It is possible a species better than humans at steering the future would have evolved given fewer mass extinctions, or in the absence of the last one in particular, but this is unclear. So I would say the above is some evidence that existential risk may even be lower than extinction risk.
I know you're only talking about the prior, but your preferred estimate implies we'd need a galactically-enormous update to get to a posterior probability of war x-risk that seems reasonable. So I think something might be going wrong.
The methodology I followed in my analysis is quite similar to yours. The major differences are that:
I fitted distributions to the top 10 % logarithm of the annual war deaths of combatants as a fraction of the global population, whereas you relied on an extinction risk per war from Bear obtained by fitting a power law to war deaths of combatants per war. As I commented, it is unclear to me whether this is a major issue, but I prefer my approach.
I dealt with 111 types distributions, whereas you focussed on 1.
For the distribution you used (a Pareto), I got an annual probability of a war causing human extinction of 0.0122 %, which is very similar to the 0.0124 %/year respecting your estimate of 0.95 % over 77 years.
Aggregating the results of the top 100 distributions, I got 6.36*10^-14.
You might be thinking something along the lines of:
Given no fundamental flaw in my methodology, one should updated towards an astronomically low war extinction risk.
Given a fundamental flaw in my methodology, one should updated towards a war extinction risk e.g. 10 % as high as your 0.0124 %/year, i.e. 0.00124 %/year.
However, given the similarities between our methodologies, I think there is a high chance that any fundamental flaw in my methodology would affect yours too. So, given a fundamental flaw in mine, I would mostly believe that neither my best guess prior nor your best guess could be trusted. So, to the extent your best guess for the war extinction is informed by your methodology, I would not use it as a prior given a fundamental flaw in my methodology. In this case, one would have to come up with a better methodology rather than multiplying your annual war extinction risk by e.g. 10 %.
I also feel like updating on your prior via multiplication by something like 10 % would be quite arbitrary because my estimates for the annual war extinction risk are all over the map. Across all 111 distributions, and 3 values for the deaths of combatants as a fraction of the total deaths (10 %, 50 % and 90%) I studied, I got estimates for the annual probability of a war causing human extinction from 0 to 8.84 %. Considering just my best guess of war deaths of combatants equal to 50 % of the total deaths, the annual probability of a war causing human extinction still ranges from 0 to 2.95 %. Given such wide ranges, I would instead update towards a state of greater cluelessness or less resilience. In turn, these would imply a greater need for a better methodology, and more research on quantifying the risk of war in general.
This is an interesting analysis that I haven't properly digested, so what I'm about to say might be missing something important, but something feels a bit strange about this type of approach to this type of question.
For example, couldn't I write a post titled "Can AI cause human extinction? not on priors" where I look at historical data on "humans killed by machines" (e.g. traffic accidents, factory accidents) as a fraction of the global population, show that it is tiny, and argue it's extremely unlikely that AI (another type of machine) will wipe us all out?
I think the mistake I'd be making here is lumping in AGI with cars, construction machinery, etc, into one single category. But then I imagine the people who worry about extinction from war are also imagining a kind of war which should belong in a different category to previous wars.
What's your take on this? Would the AI post be actually valid as well? Or is there an important difference I'm missing?
I think the mistake I'd be making here is lumping in AGI with cars, construction machinery, etc, into one single category. But then I imagine the people who worry about extinction from war are also imagining a kind of war which should belong in a different category to previous wars.
I agree that would be the mistake. I think one can use an analysis similar to mine to conclude, for example, that the probability of car accidents causing human extinction is astronomically low. However, I would say using past war deaths to estimate future war deaths is much more appropriate than using past car accident deaths to estimate the risk of human extinction due to advanced AI.
I assume increasing capability to cause damage is the main reason for people arguing that future wars would belong to a different category. Yet:
I think war capabilities have been decreasing or not changing much in the last few decades:
"Nuclear risk has been decreasing. The estimated destroyable area by nuclear weapons deliverable in a first strike has decreased 89.2 % (= 1 - 65.2/601) since its peak in 1962" (see 1st graph below).
Military expenditure as a fraction of global GDP has decreased from 1960 to 2000, and been fairly constant since then (see 2nd graph below).
Taking a broader view, war capabilities do have been increasing, but there is not a clear trend in the deaths in conflicts as a fraction of the global population since 1400 (see last figure in the post).
Increases in the capability to cause damage are usually associated with increases in the capability to prevent damage, which I guess explains what I said just above, so one should not forecast future risk based on just one side alone.
Something like deaths in car accidents does not capture the relevant factors which can lead to AI causing human extinction. I think the best reference class for this is looking into how species have gone extinct in the past. Jacob Steinhardt did an analysis which has some relevant insights:
Thus, in general most species extinctions are caused by:
A second species which the original species has not had a chance to adapt to. This second species must also not be reliant on the original species to propagate itself.
A catastrophic natural disaster or climate event. [As a side note, I believe we have pretty good reasons to think this point applies much more weakly to humans than animals.]
Habitat destruction or ecosystem disruption caused by one of the two sources above.
Advanced AI is much more analogous to a new species than e.g. cars, so per the 1st point it makes sense that extinction risk from advanced AI is much higher than from e.g. cars. I would still claim deaths in past wars and terrorist attacks provide a strong basis for arguing that humans will not go extinct via an AI war or terrorist attack. However, the 1st point alludes to what seems to me to be the greatest risk from AI, natural selection favoring AIs over humans.
I should note I do not consider humans being outcompeted by AI as necessarily bad. I endorse expected total hedonistic utilitarianism (ETHU), and humans are unlikely to be the most efficient way of increasing welfare longterm. At the same time, minimising nearterm extinction risk from AI is an arguably helpful heuristic to align AI with ETHU.
It seems to me like a pretty relevant comparison would be to the probabilty that an asteroid impact causes >1 billion deaths.
As in, run this exact methodology using deaths due to asteroid impacts per year over the past 200 years as the dataset (we could also use injuries instead of deaths).
My understanding is that this would result in predicting an astronomically, astronomically low probability of >1 billion deaths.
So either:
- Updating up massively on such astronomically low priors is common in cases where we have other arguments at hand (in the asteroid case it would be various other data sources on asteriod collisions, in the war case it would be arguments related to bioweapons or similar) - This methodology provides a very bad prior for asteroids.
Yes, asteroids are slightly cherry picked, but when talking about probabilities of 10^-13 this amount of cherry picking doesn't matter.
In general, extrapolations based on a given dataset become less reliable as one tries to predict events which are increasingly far away from the region for which there is data. Therefore my methodology is way more applicable to estimate the annual risk of human extinction from wars than from asteroids:
My maximum annual war deaths as a fraction of the global population is 0.300 %[1] (= 1.50*10^-3/0.5), which is just 2.5 orders of magnitude away from extinction.
I guess the maximum annual deaths from asteroids in the past 200 years were less than 800, i.e. less than 10^-7 (= 800/(8*10^9)) of the global population, which is at least 7 orders of magnitude away from extinction.
In any case, annual extinction risk from asteroids and comets is astronomically low based on inside view models. The results of Table 1 of Salotti 2022 suggest it is 2.2*10^-14 (= 2.2*10^-12/100), which is around 1/3 of my best guess prior for wars of 6.36*10^-14.
Agreed. At the same time, my methodology resulting in an astronomically low extinction risk from asteroids would arguably still be qualitatively in agreement with the results of Salotti 2022.
Perhaps I misunderstand the situation, but it seems like methodology around how to analyze tails of distributions will dominate the estimates at the current scale. Then, we should take the expectation over our corresponding uncertainty and we end up with a vastly higher estimate.
Another way to put this is that median (or geometric mean) seem like the wrong aggregation methods in this regime and the right aggregation method is more like arithmetic mean (though perhaps slightly less aggressive than this).
You are right that using the mean could lead to very different conclusions. For war deaths of combatants equal to 50 % of war deaths (my best guess), the annual probability of a war causing human extinction is:
For the top 10 best fit distributions, 0 using the median, but 1.09*10^-14 using the mean.
For the top 100 best fit distributions, 6.36*10^-14 using the median, but 0.132 % using the mean.
However, I did not use the mean because it is not resistant to outliers[1]. Relatedly, I commented that:
In general, my view is more that it feels overconfident to ignore predictions, and using the mean does this when samples differ a lot among them. To illustrate, if I am trying to aggregate N probabilities, 10 %, 1 %, 0.1 %, ..., and 10^-N, for N = 9:
The probability corresponding to the geometric mean of odds is 0.0152 % (= 1/(1 + (1/9)^(-(1 + 7)/2*7/7))), which is 1.52 times the median of 0.01 %.
The mean is 1.59 % (= 0.1*(1 - 0.1^7)/(1 - 0.1)/7), i.e. 159 times the median.
I think the mean is implausible because:
Ignoring the 4 to 5 lowest predictions among only 7 seems unjustifiable, and using the mean is equivalent to using the probability corresponding to the geometric mean of odds putting 0 weight in the 4 to 5 lowest predictions, which would lead to 0.894 % (= 1/(1 + (1/9)^(-(1 + 5)/2*5/7))) to 4.15 % (= 1/(1 + (1/9)^(-(1 + 4)/2*4/7))).
Ignoring the 3 lowest and 3 highest predictions among 7 seems justifiable, and would lead to the median, whereas the mean is 159 times the median.
I think there are probably cases where you want to do tail analysis and where doing something more like arithmetic mean produces much better estimates. I quickly tried to construct a toy model of this (but I failed).
In particular, I think if you have 10 possible models of tail behavior, your prior is 10% on each, and you don't update much between which fitting models to use based on seeing the data you have (due to limited data from the tail), then I think the right aggregation model is going to be arithmetic mean (or something close to this based on the amount of update).
The fact that the mean isn't robust to outliers is actually the right property in the case: indeed low probabilites in the tail are dominated by outliers. (See work by Nassim Taleb for instance.)
In particular, I think if you have 10 possible models of tail behavior, your prior is 10% on each, and you don't update much between which fitting models to use based on seeing the data you have (due to limited data from the tail), then I think the right aggregation model is going to be arithmetic mean (or something close to this based on the amount of update).
There is a sense in which I agree with the above in theory, because I think the models are mutually incompatible. The annual war deaths as a fraction of the global population cannot simultaneously follow e.g. a Pareto and lognormal distribution. However, I would say the median or other method which does not overweight extremely high predictions is better in practice. For example:
The weighted/unweighted median performed better than the weighted/unweighted mean on Metaculus' questions.
Samotsvetyaggregated predictions differing a lot between them from 7 forecasters[1] using the geometric mean after removing the lowest and highest values.
The geometric mean, like the median, does not overweight extremely high predictions.
The more one removes extreme predictions before using the geometric mean, the closer it gets to the median.
A priori, it seems sensible to use an aggregation method that one of the most accomplished forecasting groups uses.
The fact that the mean isn't robust to outliers is actually the right property in the case: indeed low probabilites in the tail are dominated by outliers. (See work by Nassim Taleb for instance.)
I said "I did not use the mean because it is not resistant to outliers", but I meant "because it ignores information from extremely low predictions" (I have updated the post):
The arithmetic mean of probabilities ignores information from extreme predictions
The arithmetic mean of probabilities ignores extreme predictions in favor of tamer results, to the extent that even large changes to individual predictions will barely be reflected in the aggregate prediction.
As an illustrative example, consider an outsider expert and an insider expert on a topic, who are eliciting predictions about an event. The outsider expert is reasonably uncertain about the event, and each of them assigns a probability of around 10% to the event. The insider has priviledged information about the event, and assigns to it a very low probability.
Ideally, we would like the aggregate probability to be reasonably sensitive to the strength of the evidence provided by the insider expert - if the insider assigns a probability of 1 in 1000 the outcome should be meaningfully different than if the insider assigns a probability of 1 in 10,000 [9].
The arithmetic mean of probabilities does not achieve this - in both cases the pooled probability is around (10%+1/1,000)/2≈(10%+1/10,000)/2≈5.00%. The uncertain prediction has effectively overwritten the information in the more precise prediction.
The geometric mean of odds works better in this situation. We have that [(1:9)×(1:999)]1/2≈1:95, while [(1:9)×(1:9999)]1/2≈1:300. Those correspond respectively to probabilities of 1.04% and 0.33% - showing the greater sensitivity to the evidence the insider brings to the table.
See (Baron et al, 2014) for more discussion on the distortive effects of the arithmetic mean of probabilities and other aggregates.
I have asked Jaime Sevilla to share his thoughts. Thanks for raising this important point!
For the question "What is the unconditional probability of London being hit with a nuclear weapon in October?", the 7 forecasts were 0.01, 0.00056, 0.001251, 10^-8, 0.000144, 0.0012, and 0.001. The largest of these is 1 M (= 0.01/10^-8) times the smallest.
Thanks for the detailed reply and for asking Jaime Sevilla!
FWIW on the Samotsvety nuclear forecasts, I'm pretty intuitively scared by that aggregation methodology and spread of numbers (as people discussed in comments on that post).
Interesting case. I can see the intuitive case for the median.
I think the mean is more appropriate - in this case, what this is telling you is that your uncertainty is dominated by the possibility of a fat tail, and the priority is ruling it out.
I am still standing by the median. I think using a weighted mean could be reasonable, but not a simple one. Even if all distributions should have the same weight on priors, and the update to the weights based on the fit to the data is pretty negligible, I would say one should put less weight on predictions further away from the median. This effect can be simply captured by aggregating the predictions using the median[1].
I have now done a graph illustrating how the mean ignores information from extremely low predictions:
More importantly, I have now noticed the high annual probabilities of extinction are associated with arguably unreasonably high probability of extinction conditional on an annual population loss of at least 10 %.
For the annual probability of a war causing human extinction to be at least 0.0122 %, which is similar to the "0.0124 %/year"[2] I inferred for Stephen's results, the probability of a war causing human extinction conditional on it causing an annual population loss of at least 10 % has to be at least 14.8 %. I see this as super high.
"I inferred for Stephen's results, the probability of a war causing human extinction conditional on it causing an annual population loss of at least 10 % has to be at least 14.8 %."
This is interesting! I hadn't thought about it that way and find this framing intuitively compelling.
That does seem high to me, though perhaps not ludicrously high. Past events have probably killed at least 10% of the global population, WWII was within an order of magnitude of that, and we've increased out warmaking capacity since then. So I think it would be reasonable to put that annual chance of a war killing at least 10% of the global population at at least 1%.
That could give some insight into the extinction tail, perhaps implying that my estimate was about 10x too high. That would still make it importantly wrong, but less egregiously than the many orders of magnitude you estimate in the main post?
That does seem high to me, though perhaps not ludicrously high. Past events have probably killed at least 10% of the global population, WWII was within an order of magnitude of that, and we've increased out warmaking capacity since then. So I think it would be reasonable to put that annual chance of a war killing at least 10% of the global population at at least 1%.
Note the 14.8 % I mentioned in my last comment refers to "the probability of a war causing human extinction conditional on it causing an annual population loss of at least 10 %", not to the annual probability of a war causing a population loss of 10 %. I think 14.8 % for the former is super high[1], but I should note the Metaculus' community might find it reasonable:
It is predicting:
A 5 % chance of a nuclear catastrophe causing a 95 % population loss conditional on it causing a population loss of at least 10 %.
A 10 % chance of a bio catastrophe causing a 95 % population loss conditional on it causing a population loss of at least 10 %.
I think a nuclear or bio catastrophe causing a 95 % population loss would still be far from causing extinction, so I could still belive the above suggest the probability of a nuclear or bio war causing extinction conditional on it causing a population loss of at least 10 % is much lower than 5 % and 10 %, and therefore much lower than 14.8 % too.
However, the Metaculus' community may find extinction is fairly likely conditional on a 95 % population loss.
That could give some insight into the extinction tail, perhaps implying that my estimate was about 10x too high. That would still make it importantly wrong, but less egregiously than the many orders of magnitude you estimate in the main post?
Note "the probability of a war causing human extinction conditional on it causing an annual population loss of at least 10 %" increases quite superlinearly with the annual probability of a war causing human extinction (see graph in my last comment). So this will be too high by more than 1 OOM if the 14.8 % I mentioned is high by 1 OOM. To be precise, for the best fit distribution with a "probability of a war causing human extinction conditional on it causing an annual population loss of at least 10 %" of 1.44 %, which is roughly 1 OOM below 14.8 %, the annual probability of a war causing human extinction is 3.41*10^-7, i.e. 2.56 (= log10(1.24*10^-4/(3.41*10^-7))) OOMs lower. In reality, I suspect 14.8 % is high by many OOMs, so an astronomically low prior still seems reasonable to me.
I have just finished a draft where I get an insive view estimate of 5.53*10^-10 for the nearterm annual probability of human extinction from nuclear war, which is not too far from the best guess prior I present in the post of 6.36*10^-14. Comments are welcome, but no worries if you have other priorities! Update: I have now published the post.
I understand war extinction risk may be majorly driven by AI and bio risk rather than nuclear war. However, I have sense this is informed to a significant extent by Toby's estimates for existential risk given in The Precipice, whereas I have found them consistently much higher than my estimates for extinction risk for the matters I have investigated. For example, in the draft I linked above, I say it is plausible extinction risk from nuclear war is similar to that from asteroids and comets.
Thanks for the post. I really appreciate this type of modeling exercise.
I've been thinking about this for a while, and there are some reflections it might be proper to share here. In summary, I'm afraid a lot of effort in x-risks might be misplaced. Let me share some tentative thoughts on this:
a) TBH, I'm not very concerned with precise values of point-estimates for the probability of human extinction. Because of anthropic bias, or the fact that this is necessarily a one-time event, the incredible values involved, and doubts about how to extrapolate from past events here, etc., So many degress of freedom, that I don't expect the uncertainties in question to be properly expressed. Thus, if the overall "true" x-risk is 1% or 0.00000001%, that doesn't make a lot of difference to me - at least in terms of policy recommendation.
I'm rather more concerned with odds ratios. If one says that every x-risk estimate is off by n orders of magnitude, I have nothing to reply; instead, I'm interested in knowing if, e.g., one specific type of risk is off, or if it makes human extinction 100 times more likely than the "background rate of extinction" (I hate this expression, because it suggests we are talking about frequencies).
b) So I have been wondering if, instead of trying to compute a causal chain leading from now to extinction, it'd be more useful to do backward reasoning instead: suppose that humanity is extinct (or reduced to a locked-in state) by 3000 CE (or any other period you choose); how likely is it that factor x figures in a causal chain leading to that?
When I try to consider this, I think that a messy unlucky narrative where many catastrophes concur is at least on a pair with a "paperclip-max" scenario. Thus, even though WW 3 would not wipe us out, it would make it way more likely that something else would destroy us afterwards. I'll someday try to properly model this.
Ofc, I admit that this type of reasoning "makes" x-risks less comparable with near-termist interventions - but I'm afraid that's just the way it is.
c) I suspect that some confusions might be due to Parfit's thought-experiment: because extinction would be much worse than an event that killed 99% of humanity, people often think about events that could wipe us out once and for all. But, in the real world, an event that killed 99% of humanity at once is way more likely than extinction at once, and the former would probably increase extinction risk in many orders of magnitude (specially if most survivors were confined to a state where they would be fragile against local catastrophes). The last human will possibly die of something quite ordinary.
d) There's an interesting philosophical discussion to be had about what "the correct estimate of the probability of human extinction" even means. It's certainly not an objective probability; so the grounds for saying that such an estimate is better than another might be something like that it converges towards what an ideal prediction market or logical inductor would output. But then, I am quite puzzled about how such a mechanism could work for x-risks (how would one define prices? well, one could perhaps value lives with the statistical value of life, like Martin & Pyndick).
suppose that humanity is extinct (or reduced to a locked-in state) by 3000 CE (or any other period you choose); how likely is it that factor x figures in a causal chain leading to that?
Perhaps not a direct answer to your question, but this reminded me of the Metaculus Ragnarok series.
a) TBH, I'm not very concerned with precise values of point-estimates for the probability of human extinction. Because of anthropic bias, or the fact that this is necessarily a one-time event, the incredible values involved, and doubts about how to extrapolate from past events here, etc., So many degress of freedom, that I don't expect the uncertainties in question to be properly expressed. Thus, if the overall "true" x-risk is 1% or 0.00000001%, that doesn't make a lot of difference to me - at least in terms of policy recommendation.
On the one hand, I agree expected value estimates cannot be taken literally. On the other, I think there is a massive difference between one's best guess for the annual extinction risk[1] being 1 % or 10^-10 (in policy and elsewhere). I guess you were not being literal? In terms of risk of personal death, that would be the difference between a non-Sherpa first-timer climbing Mount Everest[2] (risky), and driving for 1 s[3] (not risky).
It is worth noting one of the upshorts of the post I linked above is that priors are important. I see my post as an illustration that priors for extinction risk are quite low, such that inside view estimates should be heavily moderated.
It may often not be desirable to prioritise based on point estimates, but there is a sense in which they are unavoidable. When one decides to prioritise A over B at the margin, one is implicitly relying on point estimates: "expected marginal cost-effectiveness of A" > "expected marginal cost-effectiveness of B".
I'm rather more concerned with odds ratios. If one says that every x-risk estimate is off by n orders of magnitude, I have nothing to reply; instead, I'm interested in knowing if, e.g., one specific type of risk is off, or if it makes human extinction 100 times more likely than the "background rate of extinction" (I hate this expression, because it suggests we are talking about frequencies).
That makes a lot of sense if one is assessing interventions to decrease extinction risk. However, if the risk is sufficiently low, it will arguably be better to start relying on other metrics. So I think it is worth keeping track of the absolute risk for the purpose of cause prioritisation.
b) So I have been wondering if, instead of trying to compute a causal chain leading from now to extinction, it'd be more useful to do backward reasoning instead: suppose that humanity is extinct (or reduced to a locked-in state) by 3000 CE (or any other period you choose); how likely is it that factor x figures in a causal chain leading to that?
Pre-mortems make sense. Yet, they also involve thinking about the causal chain. In contrast, my post takes an outside view approach without modelling the causal chain, which is also useful. Striking the right balance between inside and outside views is one of the Ten Commandments for Aspiring Superforecasters.
When I try to consider this, I think that a messy unlucky narrative where many catastrophes concur is at least on a pair with a "paperclip-max" scenario. Thus, even though WW 3 would not wipe us out, it would make it way more likely that something else would destroy us afterwards. I'll someday try to properly model this.
I agree cascade effects are real, and that having a 2nd catastrophe conditional on 1 catastrophe will tend to be more likely than having the 1st catastrophe. Still, having 2 catastrophes will tend to be less likely than having 1, and I guess the risk of the 1st catastrophe will often be a good proxy for the overall risk.
c) I suspect that some confusions might be due to Parfit's thought-experiment: because extinction would be much worse than an event that killed 99% of humanity, people often think about events that could wipe us out once and for all. But, in the real world, an event that killed 99% of humanity at once is way more likely than extinction at once, and the former would probably increase extinction risk in many orders of magnitude (specially if most survivors were confined to a state where they would be fragile against local catastrophes). The last human will possibly die of something quite ordinary.
Relatedly, readers may want to check Luisa Rodriguez' post on the likelihood that civilizational collapse would directly lead to human extinction. Nonetheless, at least following my methodology, which does not capture all relevant considerations, annual war deaths being 99 % of the global population is also astronomically unlikely for most best fit distributions. You can see this comparing my estimates for the probability of a 10 % and 100 % population loss.
d) There's an interesting philosophical discussion to be had about what "the correct estimate of the probability of human extinction" even means. It's certainly not an objective probability; so the grounds for saying that such an estimate is better than another might be something like that it converges towards what an ideal prediction market or logical inductor would output. But then, I am quite puzzled about how such a mechanism could work for x-risks (how would one define prices? well, one could perhaps value lives with the statistical value of life, like Martin & Pyndick).
I would argue there is not a fundamental difference between objective and subjective probabilities. All probabilities are based on past empirical evidence and personal guesses to a certain extent. That being said, I think using heuristics like the ones you suggested can be useful to ground more subjective probabilities.
10^-10 corresponds to 10^-4 micromorts, and driving "370 km" corresponds to 1 micromort. So 10^-10 respects driving for 0.037 km (370 km times 10^-4), which would take 1 s (= 0.037/100*60^2) at 100 km/h.
I think there is a massive difference between one's best guess for the annual extinction risk[1] being 1 % or 10^-10 (in policy and elsewhere). I guess you were not being literal? In terms of risk of personal death, that would be the difference between a non-Sherpa first-timer climbing Mount Everest[2] (risky), and driving for 1 s[3] (not risky).
I did say that I'm not very concerned with the absolute values of precise point-estimates, and more interested in proportional changes and in relative probabilities; allow me to explain:
First, as a rule of thumb, coeteris paribus, a decrease in the avg x-risk implies an increase in the expected duration of human survival - so yielding a proportionally higher expected value for reducing x-risk. I think this can be inferred from Thorstad's toy model in Existential risk pessimism and the time of perils. So, if something reduces x-risk by 100x, I'm assuming it doesn't make much difference, from my POV, if the prior x-risk is 1% or 10^-10 - because I'm assuming that EV will stay the same. This is not always true; I should have clarified this.
Second, it's not that I don't see any difference between "1%" vs. "10^-10"; I just don't take sentences of the type “the probability of p is 10^-14” at face value. For me, the reference for such measures might be quite ambiguous without additional information - in the excerpt I quoted above, you do provide that when you say that this difference would correspond to the distance between the risk of death for Everest climbing vs. driving for 1s – which, btw, are extrapolated from frequencies (according to the footnotes you provided).
Now, it looks like you say that, given your best estimate, the probability of extinction due to war is really approximately like picking a certain number from a lottery with 10^14 possibilities, or the probability of tossing a fair coin 46-47 times and getting only heads; it’s just that, because it’s not resilient, there are many things that could make you significantly update your model (unlike the case of the lottery and the fair coin). I do have something like a philosophical problem with that, which is unimportant; but I think it might result in a practical problem, which might be important. So...
It reminds me of a paper by the epistemologist Duncan Pritchard, where he supposes that a bomb will explode if (i) in a lottery, a specific number out of 14 million is withdrawn, or if ( (ii) a conjunction of bizarre events (eg., the spontaneous pronouncement of a certain Polish sentence during the Queen's next speech, the victory of an underdog at the Grand National...) occurs, with an assigned probability of 1 in 14 million. Pritchard concludes that, though both conditions are equiprobable, we consider the latter to be a lesser risk because it is "modally farther away", in a "more distant world"; I think that's a terrible solution: people usually prefer to toss a fair coin rather than a coin they know is biased (but whose precise bias they ignore), even though both scenarios have the same “modal distance”. Instead, the problem is, I think, that reducing our assessment to a point-estimate might fail to convey our uncertainty regarding the differences in both information sets – and one of the goals of subjective probabilities is actually to provide a measurement of uncertainty (and the expectation of surprise). That’s why, when I’m talking about very different things, I prefer statements like “both probability distributions have the same mean” to claims such as “both events have the same probability”.
Finally, I admit that the financial crisis of 2008 might have made me a bit too skeptical of sophisticated models yielding precise estimates with astronomically tiny odds, when applied to events that require no farfetched assumptions - particularly if minor correations are neglected, and if underestimating the probability of a hazard might make people more lenient regarding it (and so unnecessarily make it more likely). I'm not sure how epistemically sound my behavior is; and I want to emphasize that this skepticism is not quite applicable to your analysis - as you make clear that your probabilities are not resilient, and point out the main caveats involved (particularly that, e.g., a lot depends on what type of distribution is a better fit for predicting war casualties, or on what role tech plays).
First, as a rule of thumb, coeteris paribus, a decrease in the avg x-risk implies an increase in the expected duration of human survival - so yielding a proportionally higher expected value for reducing x-risk. I think this can be inferred from Thorstad's toy model in Existential risk pessimism and the time of perils. So, if something reduces x-risk by 100x, I'm assuming it doesn't make much difference, from my POV, if the prior x-risk is 1% or 10^-10 - because I'm assuming that EV will stay the same. This is not always true; I should have clarified this.
I think you mean that the expected value of the future will not change much if one decreases the nearterm annual existential risk without decreasing the longterm annual existential risk.
Something that surprised me a bit, but that is unlikely to affect your analysis:
I used Correlates of War’s data on annual war deaths of combatants due to fighting, disease, and starvation. The dataset goes from 1816 to 2014, and excludes wars which caused less than 1 k deaths of combatants in a year.
Actually, I'm not sure if this dataset is taking into account average estimates of excess deaths in Congo Wars (1996-2003, 1.5 million - 5.4 million) - and I'd like to check how it takes into account Latin American Wars of the 19th century.
Global annual deaths of combatants from 1996 to 2003 were 59.8 k according to Correlates of War, whereas the death tolls you mention would imply annual deaths of 431 k (= (1.5 + 5.4)/2*10^6/(2003 - 1996 + 1)) for the CongoWars alone. So it looks like the vast majority of deaths of the Congo Wars are being attributed to civilians.
I agree the above will not matter for the conclusions of my analysis. Based on the 2 estimates above, global deaths of combatants were 13.9 % (= 59.8/431) of all deaths in the Congo Wars, which much less than my central estimate of 50 %. However, I also used a pessimistic fraction of 10 % for the deaths of combatants as a fraction of total deaths (for all years, not just those of the Congo Wars), and still got astronomically low extinction risk.
I used AI to fix transcription errors, rerrarange the ideas, and suggest tweaks to the title and some sentences.
Three of the most exciting projects to come out of EA in recent years are, in a vague sense, CEA spinouts:
* Kairos is directly a spinout of CEA and now handles most support for university AI safety groups. Basically everyone I've found who knows them is really excited about what they do
* NEST is an opinionated ideas-fi...
This post presents the executive summary from Giving What We Can’s impact evaluation for 2025. At the end of this post we share links to more information, including the full report and...
Stephen Clare’s classic EA Forum post How likely is World War III? concludes “the chance of an extinction-level war [this century] is about 1%”. I commented that power law extrapolation often results in greatly overestimating tail risk, and that fitting a power law to all the data points instead of the ones in the right tail usually leads to higher risk too.
To investigate the above, I looked into historical annual war deaths along the lines of what I did in Can a terrorist attack cause human extinction? Not on priors, where I concluded the probability of a terrorist attack causing human extinction is astronomically low.
Historical annual war deaths of combatants suggest the annual probability of a war causing human extinction is astronomically low once again. 6.36*10^-14 according to my preferred estimate, although it is not resilient, and can easily be wrong by many orders of magnitude (OOMs).
One may well update to a much higher extinction risk after accounting for inside view factors (e.g. weapon technology), and indirect effects of war, like increasing the likelihood of civilisational collapse. However, extraordinary evidence would be required to move up sufficiently many orders of magnitude for an AI, bio or nuclear war to have a decent chance of causing human extinction.
In the realm of the more anthropogenic AI, bio and nuclear risk, I personally think underweighting the outside view is a major reason leading to overly high risk. I encourage readers to check David Thorstad’s series exaggerating the risks, which includes subseries on climate, AI and bio risk.
Introduction
The 166th EA Forum Digest had Stephen Clare’s How likely is World War III? as the classic EA Forum post (as a side note, the rubric is great!). It presents the following conclusions:
First, I estimate that the chance of direct Great Power conflict this century is around 45%.
Second, I think the chance of a huge war as bad or worse than WWII is on the order of 10%.
Third, I think the chance of an extinction-level war is about 1%. This is despite the fact that I put more credence in the hypothesis that war has become less likely in the post-WWII period than I do in the hypothesis that the risk of war has not changed.
With 35 % credence, an extinction risk per war of 0.06 %, and 1 war every 2 years ("constant risk hypothesis").
With 65 % credence, an extinction risk per war of 0.03 %, and 1 war every 5 years ("durable peace hypothesis").
The extinction risk per war under the durable peace hypothesis is defined as half of that under the constant risk hypothesis[1], and this is based on research from Bear Braumoeller (I recommend his appearance on The 80,000 Hours Podcast!). From How bad could a war get? by Stephen and Rani Martin:
“In Only the Dead, political scientist Bear Braumoeller uses his estimated parameters to infer the probability of enormous wars. His [power law] distribution gives a 1 in 200 chance of a given war escalating to be [at least] twice as bad as World War II and a 3 in 10,000 chance of it causing [at least] 8 billion deaths [of combatants] (i.e. human extinction).
I had already come across these posts, but now a 0.06 % chance of war causing human extinction based on historical data jumped out to me as more surprising. I had recently been looking into how astronomically unlikely it is for a terrorist attack to cause human extinction based on historical data.
So I commented on Stephen’s classic EA Forum post that:
Power law extrapolation [the one used by Bear] often results in greatly overestimating tail risk because the tail usually starts decaying faster at some point. It is better to use a generalised Pareto distribution, which has the pareto distribution (power law) as a special case. David Roodman found using a generalised pareto instead of a power law led to a decrease in 2 orders of magnitude (OOMs) of the risk of a solar storm at least as severe as a Carrington event:
The Carrington event “was the most intense geomagnetic storm in recorded history”, but would very hardly cause extinction today (although now we have more electronics). As illustrated above, the higher the severity, the more the power law overestimates tail risk. So, if one fitted a generalised pareto to war deaths, I guess the extinction risk would decrease by many OOMs.
Another detail to have in mind is that, because the slope of the tail distribution usually bends downwards (as illustrated by the data points of the figure above), it matters whether we are fitting the power law to all the data points, or just to the right tail. The right tail will tend to have a more negative slope, so fitting a power law to all points will usually lead to overestimating the risk.
If one fitted a generalised pareto (instead of a power law) to e.g. 1 % or 10 % most deadly wars (instead of all wars), I guess the probability of a war causing human extinction would be OOMs lower than Bear’s 0.03 %. However, I expect it would still be many OOMs higher than my estimates for the extinction risk posed by terrorist attacks, as power laws still resulted in astronomically small risk of extinction (in agreement with Clauset 2013; see Figures 1 and 2). I might try to repeat the analysis for wars instead of terrorist attacks in the future, but you are welcome to do it yourself! Update: I will do it.
This [“the right tail will tend to have a more negative slope, so fitting a power law to all points will usually lead to overestimating the risk”] is not an accurate statement, in fact. The visual shape of the extreme upper tail is not a reliable indicator of the shape of the underlying generating distribution, because the extreme upper tail (where the largest events are) is the most subject to sampling fluctuations. Hence, in the case where the true data generating distribution is in fact power law, you will often still get an artifactual visual appearance of a somewhat negative slope. This is one reason why one has to use tail-fitting methods that have appropriate assumptions about the data generating process, or else you’re basically overfitting the data. Additionally, “right tail” is an ambiguous term -- where does the body end and the tail begin? There’s a set of methods designed to identify that point algorithmically, and generally speaking, visual methods (any methods like “Hill plots”) are highly unreliable for the reasons I mention at the beginning of this comment.
The above makes sense to me. Nevertheless, I maintain the actual tail distribution decaying faster is evidence that the underlying distribution has a thinner tail, although one should update less on this given the large amount of noise in the right tail. Moreover, our prior underlying distribution should eventually decay faster than a power law because this implies deaths can be arbitrarily large, whereas the real death toll is in fact limited to the global population. Noisier observations mean we should put greater weight on the prior, so one should end up with a thinner tail.
Methods
I used Correlates of War’s data on annual war deaths of combatants due to fighting, disease, and starvation. The dataset goes from 1816 to 2014, and excludes wars which caused less than 1 k deaths of combatants in a year.
Stephen commented I had better follow the typical approach of modelling war deaths, instead of annual war deaths as a fraction of the global population, and then getting the probability of human extinction from the chance of war deaths being at least as large as the global population. I think my approach is more appropriate, especially to estimate tail risk. There is human extinction if and only if annual war deaths as a fraction of the global population are at least 1. In contrast, war deaths as a fraction of the global population in the year the war started being at least 1 does not imply human extinction. Consider a war lasting for the next 100 years totalling 8 billion deaths. The war deaths as a fraction of the global population in the year the war started would be 100 %, which means such a war would imply human extinction under the typical approach. Nevertheless, this would only be the case if no humans were born in the next 100 years, and new births are not negligible. In fact, the global population increased thanks to these during the years with the most annual war deaths of combatants in the data I used:
From 1914 to 1918 (years of World War 1), they were 9.28 M, 0.510 % (= 9.28/(1.82*10^3)) of the global population in 1914, but the global population increased 2.20 % (= 1.86/1.82 - 1) during this period.
From 1939 to 1945 (years of World War 2), they were 17.8 M, 0.784 % (= 17.8/(2.27*10^3)) of the global population in 1939, but the global population increased 4.85 % (= 2.38/2.27 - 1) during this period.
I relied on the Python library fitter to find the distributions which best fit the top 10 % logarithm of the annual war deaths of combatants as a fraction of the global population. I only analysed the top 10 %, respecting more than 0.0153 % annual war deaths of combatants as a fraction of the global population, because I am interested in the right tail, which may decay faster than suggested by the whole distribution (see previous section). I took logarithms so that the probability density functions (PDFs) describing the actual data are defined based on points uniformly distributed in logarithmic space instead of linear space, which is appropriate given the wide variation of war deaths[3].
fitter tries all the types of distributions in SciPy, 111 on 10 December 2023. For each type of distribution, the best fit is that with the lowest residual sum of squares (RSS), respecting the sum of the squared differences between the predicted and baseline PDF. I set the number of bins to define the baseline PDF to the square root of the number of data points[4], and left the maximum time to find the best fit parameters to the default value in fitter of 30 s.
I estimated the probability of the annual war deaths as a fraction of the global population being at least 10^-6, 0.001 %, …, and 100 % (human extinction) as follows:
I supposed deaths of combatants as a fraction of all deaths (f) are 10 %, 50 % (= 1/(1 + 1)) or 90 %. 50 % is my best guess following Stephen and Rani. “Historically, the ratio of civilian-deaths-to-battle deaths in war has been about 1-to-1 (though there’s a lot of variation across wars)”.
I obtained the probability of the annual war deaths of combatants as a fraction of the global population being at least 10^-6 f, 0.001 % f, …, and f multiplying:
10 %, which is the probability of the annual war deaths of combatants being in the right tail.
Probability of the annual war deaths of combatants as a fraction of the global population being at least 10^-6 f, 0.001 % f, …, and f if they are in the right tail, which I got using the best fit parameters outputted by fitter.
I aggregated probabilities from different best fit distributions using the median. I did not use:
The mean because it ignores information from extremely low predictions, and overweights outliers.
Below are the median RSS, coefficient of determination[6] (R^2), and probability of the annual war deaths as a fraction of the global population being at least 10^-6, 0.001 %, …, and 100 % (human extinction). The medians are taken across the best, top 10, and top 100 distributions according to the default fitness criterion in fitter, lowest RSS[7]. Null values may be exactly 0 if they concern bounded distributions, or just sufficiently small to be rounded to 0 due to finite precision. I also show the tail distribution of the actual data, and 10 % of the tail distributions of the best fit Pareto and generalised Pareto[8], and the annual probability of a war causing human extinction as a function of R^2.
Best fit distributions
Median RSS
Median R^2
Best
0.0167
100 %
Top 10
0.398
99.8 %
Top 100
0.665
99.7 %
War deaths of combatants equal to 50 % of all deaths (best guess)
Best fit distributions
Median probability of the annual war deaths as a fraction of the global population being at least...
10^-6
0.001 %
0.01 %
0.1 %
Best
10.0 %
10.0 %
10.0 %
5.00 %
Top 10
10.0 %
10.0 %
10.0 %
5.33 %
Top 100
10.0 %
10.0 %
10.0 %
4.93 %
Best fit distributions
Median probability of the annual war deaths as a fraction of the global population being at least...
1 %
10 %
100 %
Best
7.54*10^-15
0
0
Top 10
0
0
0
Top 100
0.0499 %
3.47*10^-8
6.36*10^-14
War deaths of combatants equal to 90 % of all deaths (optimistic guess)
Best fit distributions
Median probability of the annual war deaths as a fraction of the global population being at least...
10^-6
0.001 %
0.01 %
0.1 %
Best
10.0 %
10.0 %
10.0 %
4.00 %
Top 10
10.0 %
10.0 %
9.95 %
3.91 %
Top 100
10.0 %
10.0 %
10.0 %
2.57 %
Best fit distributions
Median probability of the annual war deaths as a fraction of the global population being at least...
1 %
10 %
100 %
Best
0
0
0
Top 10
0
0
0
Top 100
0.00665 %
1.60*10^-9
2.22*10^-15
War deaths of combatants equal to 10 % of all deaths (pessimistic guess)
Best fit distributions
Median probability of the annual war deaths as a fraction of the global population being at least...
10^-6
0.001 %
0.01 %
0.1 %
Best
10.0 %
10.0 %
10.0 %
10.0 %
Top 10
10.0 %
10.0 %
10.0 %
9.92 %
Top 100
10.0 %
10.0 %
10.0 %
10.0 %
Best fit distributions
Median probability of the annual war deaths as a fraction of the global population being at least...
1 %
10 %
100 %
Best
3.34 %
0
0
Top 10
3.36 %
0
0
Top 100
2.21 %
0.00448 %
9.02*10^-10
Discussion
Historical annual war deaths of combatants suggest the annual probability of a war causing human extinction is astronomically low, with my estimates ranging from 0 to 9.02*10^-10. My preferred estimate is 6.36*10^-14, which belongs to the top 100 best fit distribution, and war deaths of combatants as a fraction of total deaths of 50 %. Among those with this value, it is the one which aggregates the most information, which is arguably good given the high median R^2 of 99.7 % of the top 100 best fit distributions.
As I expected, my methodology points to an extinction risk many orders of magnitude lower than Stephen’s. His war extinction risk of 0.95 % over 77 years corresponds to 0.0124 %/year (= 1 - (1 - 0.0095)^(1/77)), which is 9 (= log10(1.24*10^-4/(6.36*10^-14))) orders of magnitude above my best guess for the prior.
I do not think anthropics are confounding the results much. There would be no one to do this analysis if a war had caused human extinction in the past, but there would be for less severe wars, and there have not been any. The maximum annual war deaths of combatants as a fraction of the global population were only 0.150 %, which is still 2.52 (= -log10(0.00150/0.5)) orders of magnitude away from extinction.
Interestingly, 102 best fit distributions have a R^2 of at least 99.7 %, but they result in annual probabilities of a war causing human extinction ranging from 0 to 15.7 %, with 5 respecting values higher than 1 % (see 1st graph in the previous section). As a consequence, figuring out which types of distributions should be weighted more heavily is a key consideration. Stephen noted investigating the connection between which distribution makes the most sense statistically and theoretically is missing in the literature on international relations, and that Bear was planning to work on this. Aaron commented “high R^2 values do not correlate with “good fits” of heavy tailed data, and other, more powerful and statistically grounded methods are required”, such as the ones discussed in Clauset 2009. It would be good to do a more in-depth analysis assessing distributions based on the best methods. Aaron elaborated that[9]:
If you want to do this properly, you would want to first correctly assess which distributions are statistically plausible fits to the data [as in Clauset 2009], and then treat them as an ensemble, potentially bootstrapping their estimation in order to get a prior distribution of model parameters that you could use to estimate a posterior distribution for the probability of the event size you’re interested in. This would take some work, because this is a pretty esoteric task and quite different from the standard stuff that’s implemented in widely used stats packages.
Nonetheless, I do not think I have an a priori reason to put lots of weight into particular distributions with my current knowledge, so I assume it makes sense to rely on the median. Recall my preferred estimate stems from the results of the top 100 best fit distributions, thus not putting an unwarranted weight on ones which have a marginally higher R^2.
In addition, according to extreme value theory (EVT), the right tail should follow a generalised Pareto[10], and the respective best fit distribution resulted in an extinction risk of exactly 0[11] (R^2 of 99.8 %). Like I anticipated, the best fit Pareto (power law) resulted in a higher risk, 0.0122 % (R^2 of 99.7 %), i.e. 98.4 % (= 1.22*10^-4/(1.24*10^-4)) of Stephen’s 0.0124 %. Such remarkable agreement means the extinction risk for the best fit Pareto is essentially the same regardless of whether it is fitted to the top 10 % logarithm of the annual war deaths of combatants as a fraction of the global population (as I did), or to the war deaths of combatants per war (as implied by Stephen using Bear’s estimates). I guess this qualitatively generalises to other types of distributions. In any case, I would rather follow my approach.
In contrast, the type of distribution certainly matters. In the right tail domain of the actual data, ranging from 0.0153 % to 0.150 % annual war deaths of combatants as a fraction of the global population, the actual tail distribution, and 10 % of the tail distributions of the best fit Pareto and generalised Pareto are all similar (see 2nd graph in the previous section). Afterwards, kind of following the actual tail distribution, the generalised Pareto bends downwards much more than the Pareto, which implies a massive difference in their extinction risk. Aaron noted EVT’s “predictions only hold asymptotically [for infinitely many wars] and we have no way of assessing how close to “asymptopia” the current or extrapolated data might be”. I take this to mean it is unclear how much one should trust the best fit generalised Pareto, but a similar criticism applies to the best fit power law. It predicts deaths can be arbitrarily large, but they are in effect limited to the global population, so a power law will eventually cease to be a good model of the right tail at some point. In contrast, some of the best fit distributions I considered are bounded (e.g. the best generalised Pareto).
Aaron has looked into the trends and fluctuations in the severity of interstate wars in Clauset 2018, which also deals with the Correlates of War data. The article does not estimate the probability of a war causing human extinction, arguably given the limitations mentioned just above, but (like Stephen) used a power law[12], did not restrict the analysis to the most deadly wars[13] (although its model is tailored to accurately model the right tail), and focussed on war deaths rather than annual war deaths as a fraction of the global population[14]. I have discussed why I consider all these 3 assumptions result in overestimating tail risk. Clauset 2018 did estimate a 50 % probability of a war causing 1 billion battle deaths[15] in the next 1,339 years (see “The long view”), which is close to my pessimistic scenario:
Assuming total war deaths are 2 times as large[16], and that such a war lasts 6 years[17], that death toll would correspond to annual deaths of 333 M (= 2*10^9/6), 4.21 % (= 0.333/7.91) of the global population in 2021.
The 50 % probability would respect an annual chance of 0.0518 % (= 1 - (1 - 0.5)^(1/1339)).
According to my pessimistic estimates, the chance of annual war deaths being at least as large as 1 % of the global population (about 1/4 the above 4.21 %) is 2.21 % to 3.36 % (about 4 times the above 0.0518 %).
There may be a temptation to guess something like a 10 % chance of human extinction if there is at least 1 billion battle deaths, in which case Aaron’s results would suggest an annual extinction risk due to war of 0.005 % (= 5.18*10^-4*0.1). Millett 2017 does a move like this, “assuming that only 10% of such [bio] attacks that kill more than 5 billion eventually lead to extinction (due to the breakdown of society, or other knock-on effects)”. In general, I suspect there is a tendency to give probabilities between 1 % and 99 % for events whose mechanics we do not understand well, given this range encompasses the vast majority (98 %) of the available linear space (from 0 to 1), and events in everyday life one cares about are not that extreme. However, the available logarithmic space is infinitely vast, so there is margin for such guesses to be major overestimates. In the context of tail risk, subjective guesses can easily fail to adequately account for the faster decay of the tail distribution as severity approaches the maximum.
As a final reflection, Aaron added that:
Based on everything I know from working in this field for 20 years, and having written several of the state-of-the-art papers in this broad area, my professional opinion is that these calculations are fun, but they are not science. They might be useful as elaborate statistical thought experiments, and perhaps useful for helping us think through other aspects of the underlying causes of war and war size, but no one should believe these estimates are accurate in the long run [or in the extreme right tail].
Well, Clauset 2018 was published in Science Advances, so I suppose it is fair to say such work is science, although I agree it is fun too. More seriously, I understand it is difficult to get reliable estimates of tail risk. If it is worth doing, it is worth doing with made-up statistics, and I did my analysis in this spirit, but none of my mainline estimates are resilient. My estimates of extinction risk can all easily be wrong by many OOMs. Yet, I hope they highlight there is much room for disagreement over predictions of high risk of human extinction due to a war this century, and ideally encourage further work.
I must also say one may well update to a much higher extinction risk after accounting for inside view factors (e.g. weapon technology), and indirect effects of war, like increasing the likelihood of civilisational collapse. However, extraordinary evidence would be required to move up sufficiently many orders of magnitude for an AI, bio or nuclear war to have a decent chance of causing human extinction. Moreover, although war-making capacity has been increasing, conflict deaths as a fraction of the global population have not changed much in the past 6 centuries (relatedly).
Stephen commented nuclear weapons could be an example of extraordinary evidence, and I somewhat agree. However:
Nuclear risk has been decreasing. The estimated destroyable area by nuclear weapons deliverable in a first strike has decreased 89.2 % (= 1 - 65.2/601) since its peak in 1962.
I think today’s nuclear risk is much lower than Stephen’s 1 % chance of a war causing human extinction this century. I estimated a probability of 3.29*10^-6 for a 50 % population loss due to the climatic effects of nuclear war before 2050, so around 0.001 % (= 3.29*10^-6*76/26) before 2100. I guess extinction would be much less likely, maybe 10^-7 this century. This is much lower than the forecasted in The Existential Risk Persuasion Tournament (XPT), which I have discussed before.
In general, I agree with David Thorstad that Toby Ord’s guesses for the existential risk between 2021 and 2120 given in The Precipice are very high (e.g. 0.1 % for nuclear war). In the realm of the more anthropogenic AI, bio and nuclear risk, I personally think underweighting the outside view is a major reason leading to overly high risk. I encourage readers to check David’s series exaggerating the risks, which includes subseries on climate, AI and bio risk. Relatedly, I commented before that:
David Thorstad’s posts, namely the ones on mistakes in the moral mathematics of existential risk, epistemics and exaggerating the risks, increased my general level of scepticism towards deferring to thought leaders in effective altruism before having engaged deeply with the arguments. It is not so much that I got to know knock-down arguments against existential risk mitigation, but more that I become more willing to investigate the claims being made.
Acknowledgements
Thanks to Aaron Clauset and Stephen Clare for feedback on the draft.
I [Stephen] haven’t formally modeled this reduction. It’s based on my sense of the strength of the evidence on changing international norms and nuclear deterrence.
The median fraction of explained variance across the 100 best fit distributions (highest fraction of explained variance) was 99.7 % defining the baseline PDF based on points uniformly distributed in logarithmic space, but only 68.5 % based on points uniformly distributed in linear space.
Fraction of the variance of the baseline PDF explained by the predicted PDF. I computed this fraction from 1 minus the ratio between the residual and total sum of squares.
I multiply the tail distributions of the best fit distributions by 10 % because they are supposed to model the right tail, and there is a 10 % chance of the annual war deaths being in the right tail as I defined it.
Even then, you have a deeper assumption that is quite questionable, which is whether events are plausibly iid [independent and identically distributed] over such a long time scale. This is where the deep theoretical understanding from the literature on war is useful, and in my 2018 paper [Clauset 2018], my Discussion section delves into the implications of that understanding for making such long term and large-size extrapolations.
Assuming wars are IID over a long time scale would be problematic if one wanted to estimate the time until a war caused human extinction, but I do not think it is an issue to estimate the nearterm annual extinction risk.
The tail should follow a generalised Pareto distribution, but I studied the logarithm of the tail, which does not have to follow such a distribution. If the tail follows a generalised Pareto distribution with null location parameter, the logarithm of the tail should follow an exponentiated generalised Pareto distribution, but this is not available in fitter (and a null location parameter is a very particular case).
“The estimated power-law model has two parameters: xmin, which represents the smallest value above which the power-law pattern holds, and α, the scaling parameter”.
I think battle deaths refer to all deaths of combatants, not only those due to fighting, but also disease and starvation, as these are all included in the Correlates of War dataset.
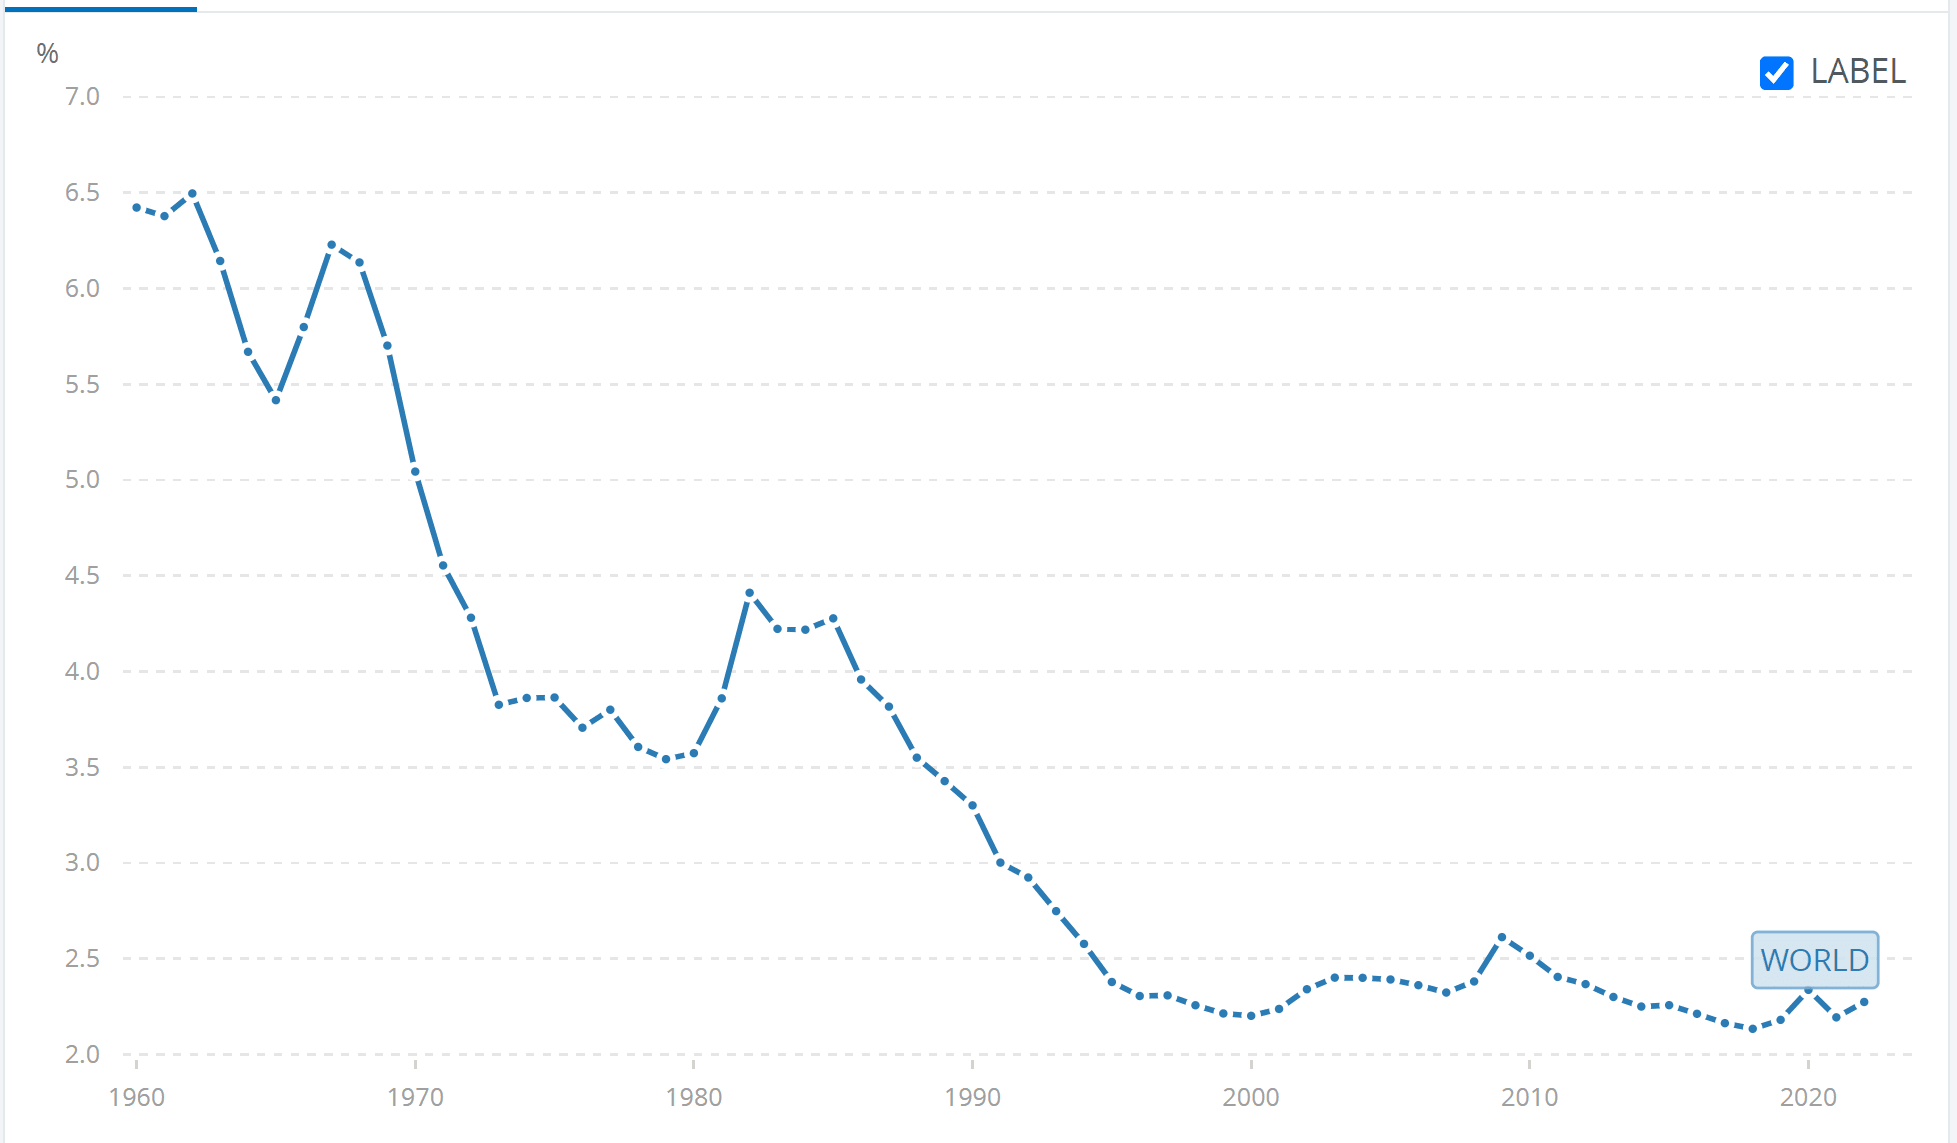
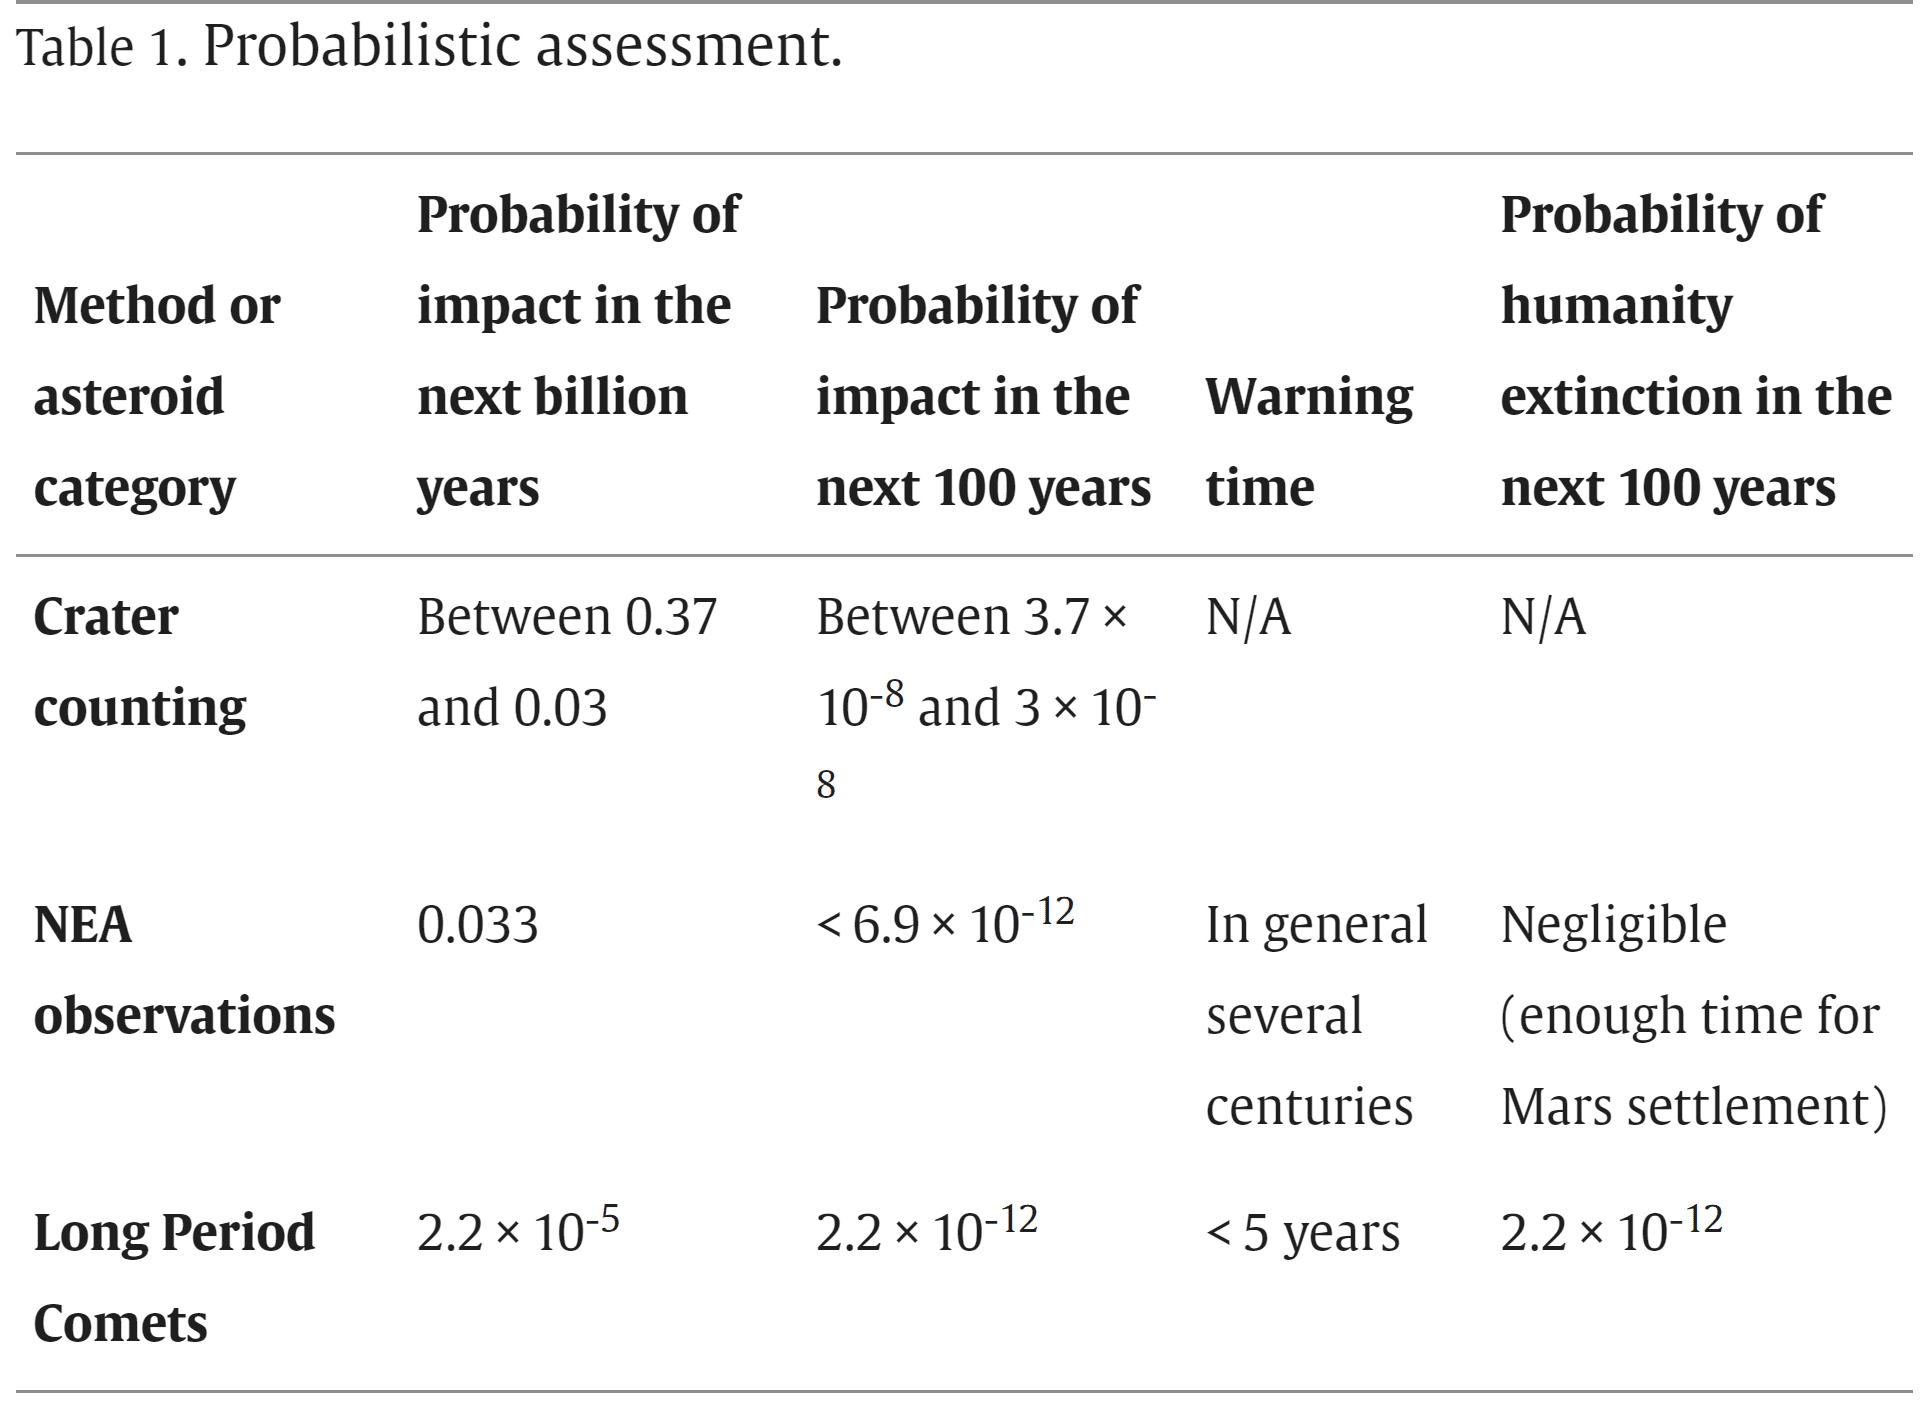
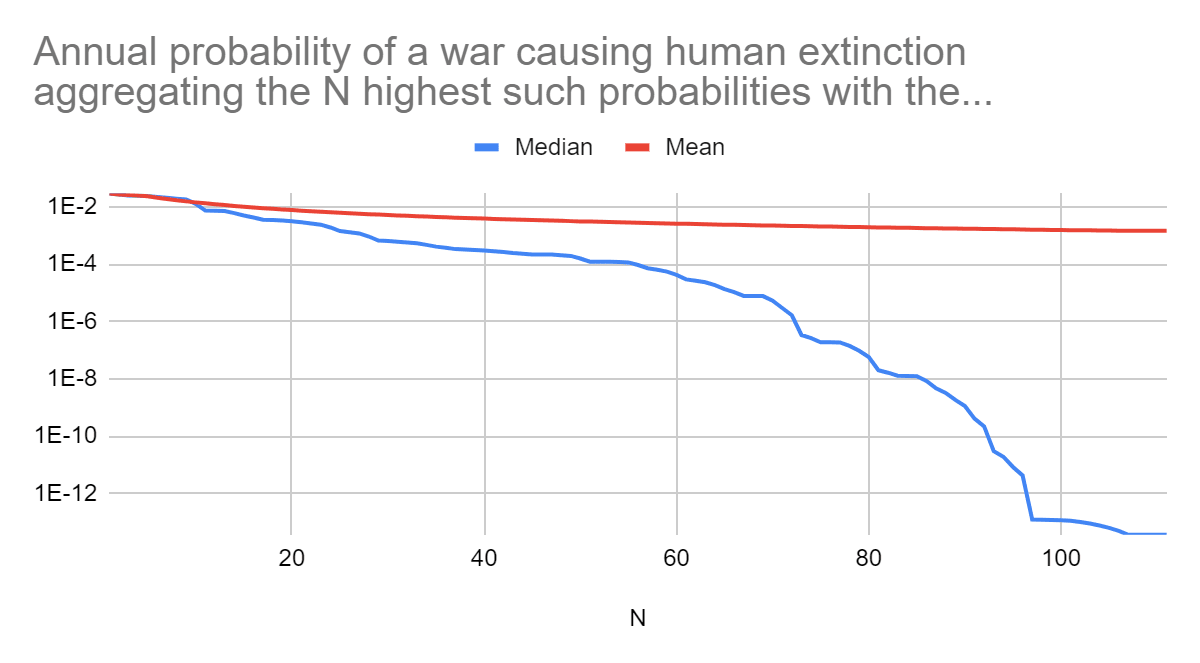
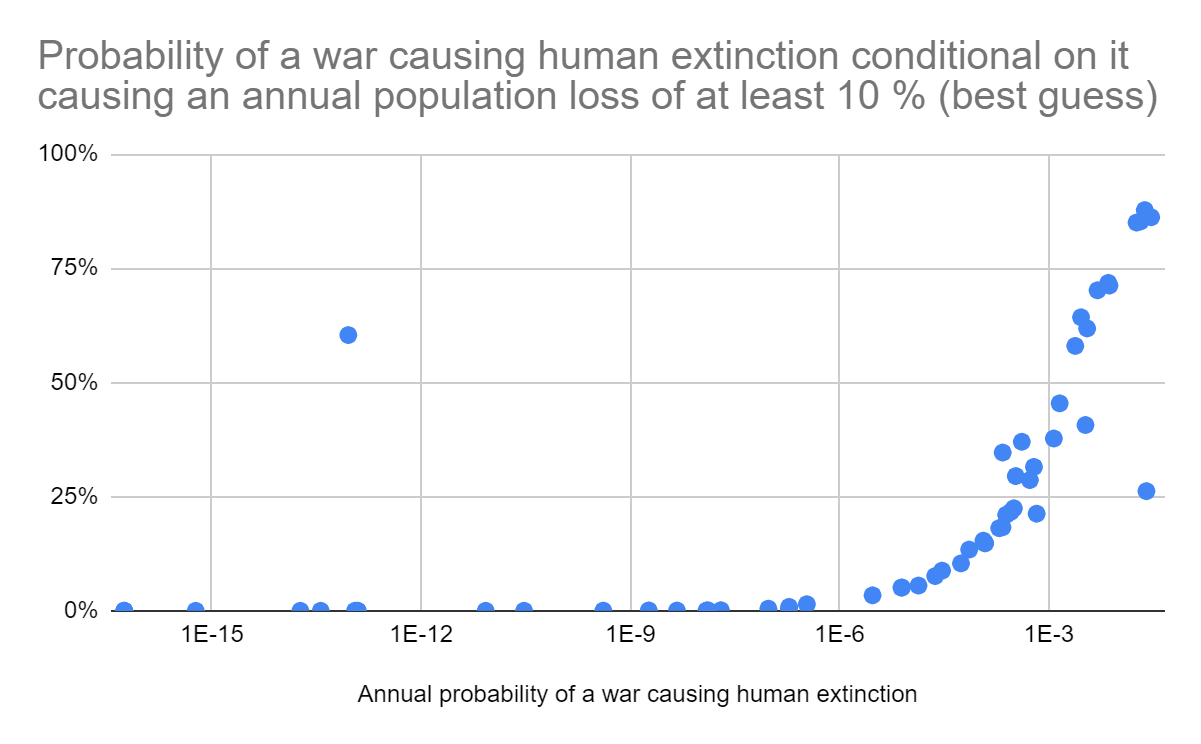


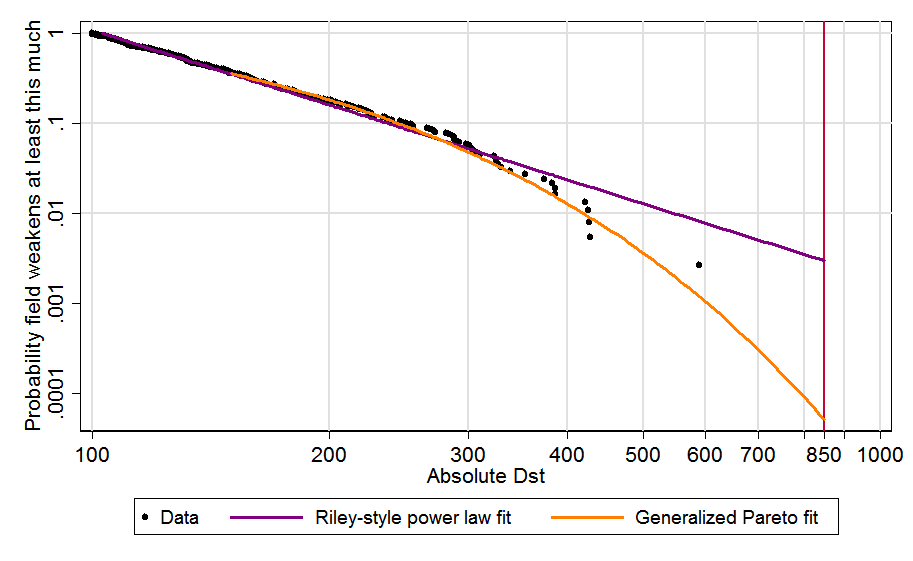
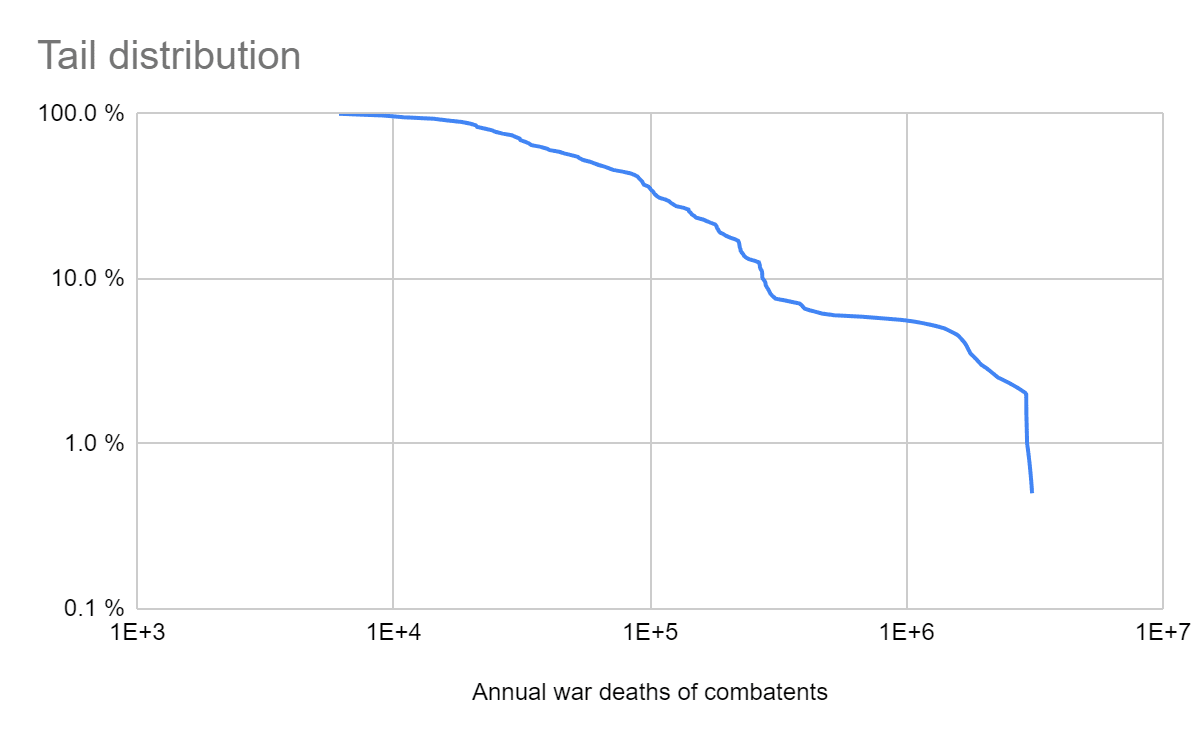
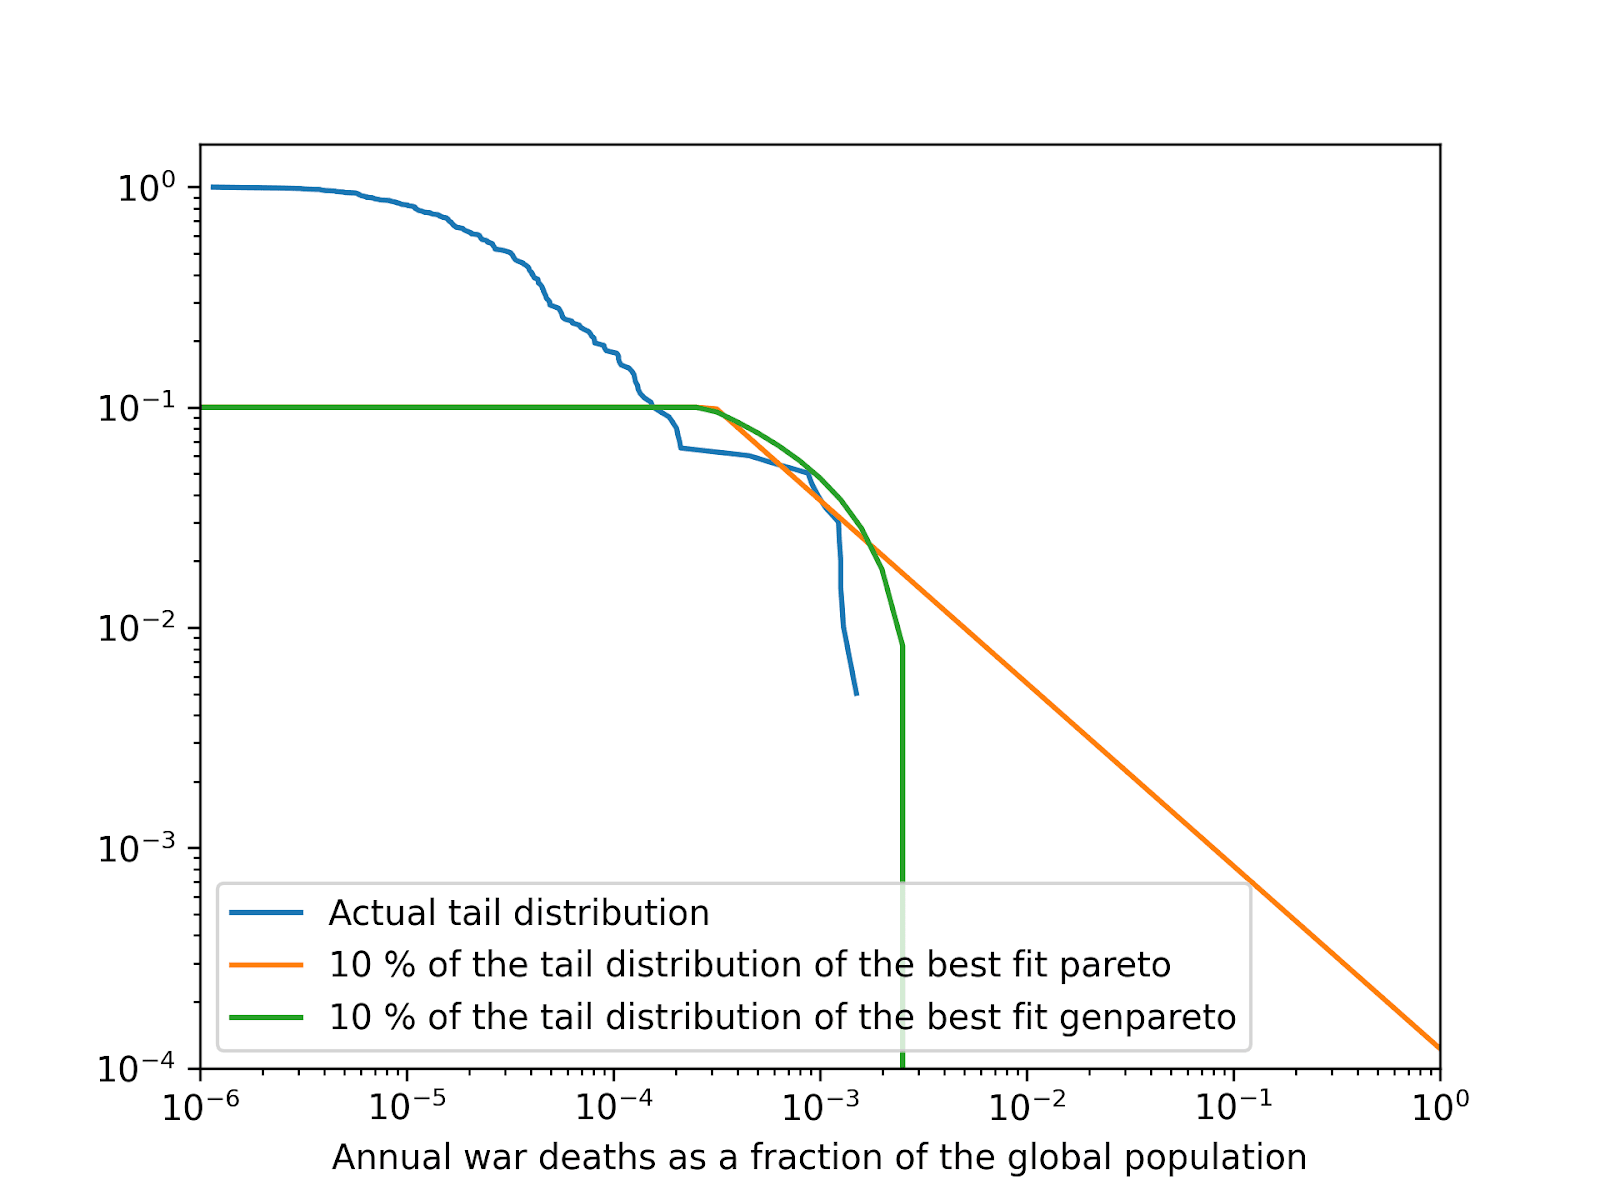
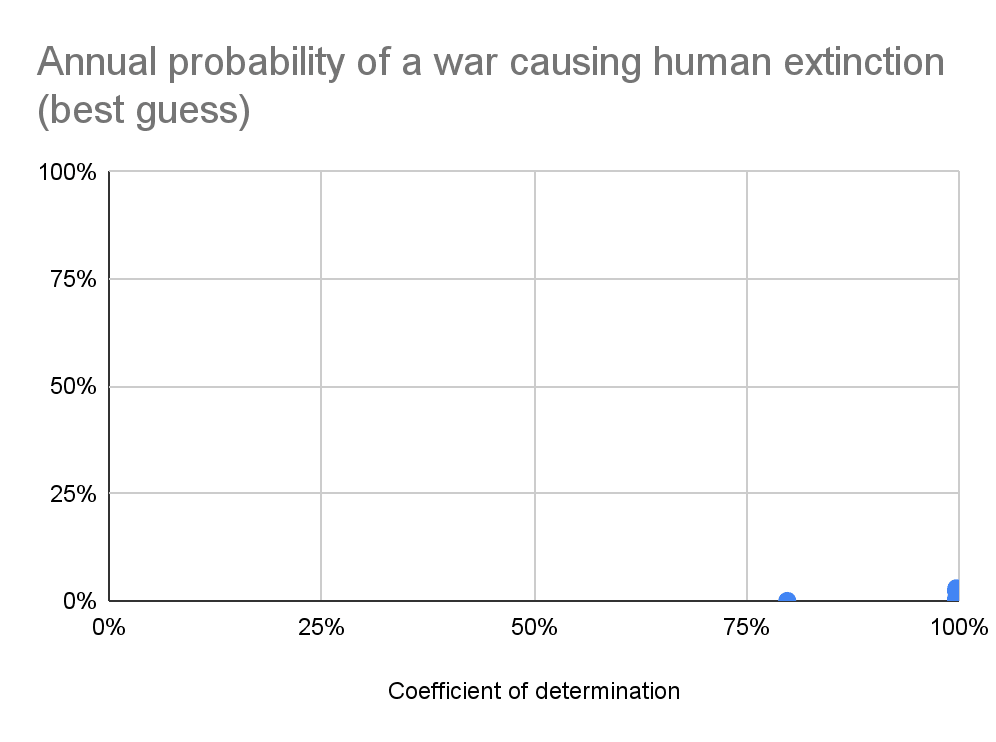
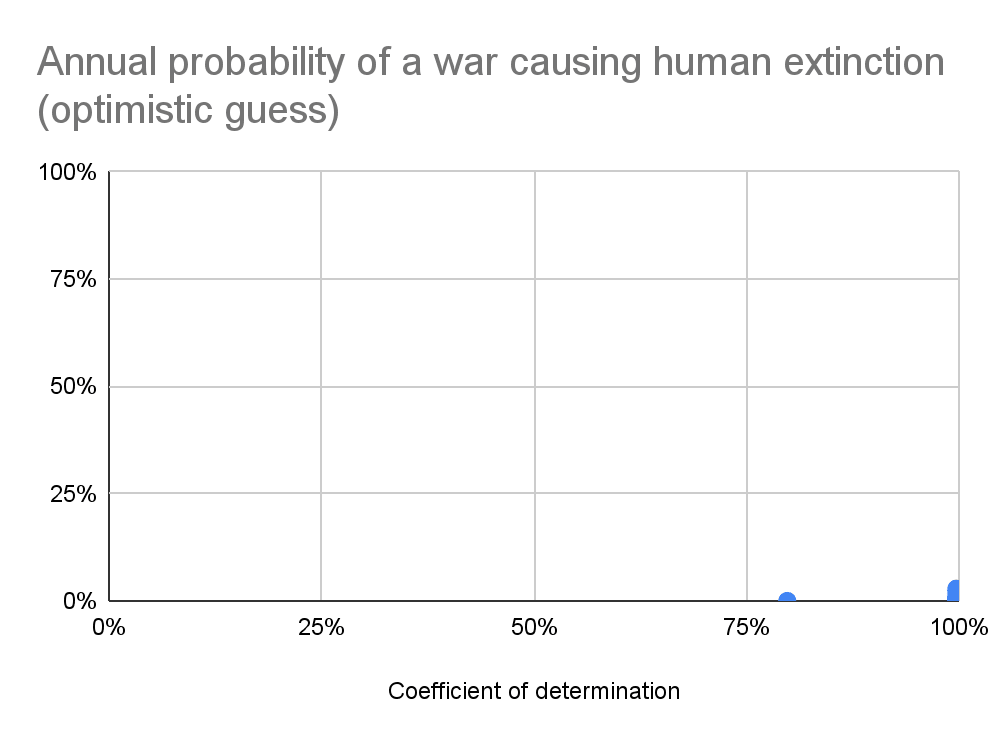
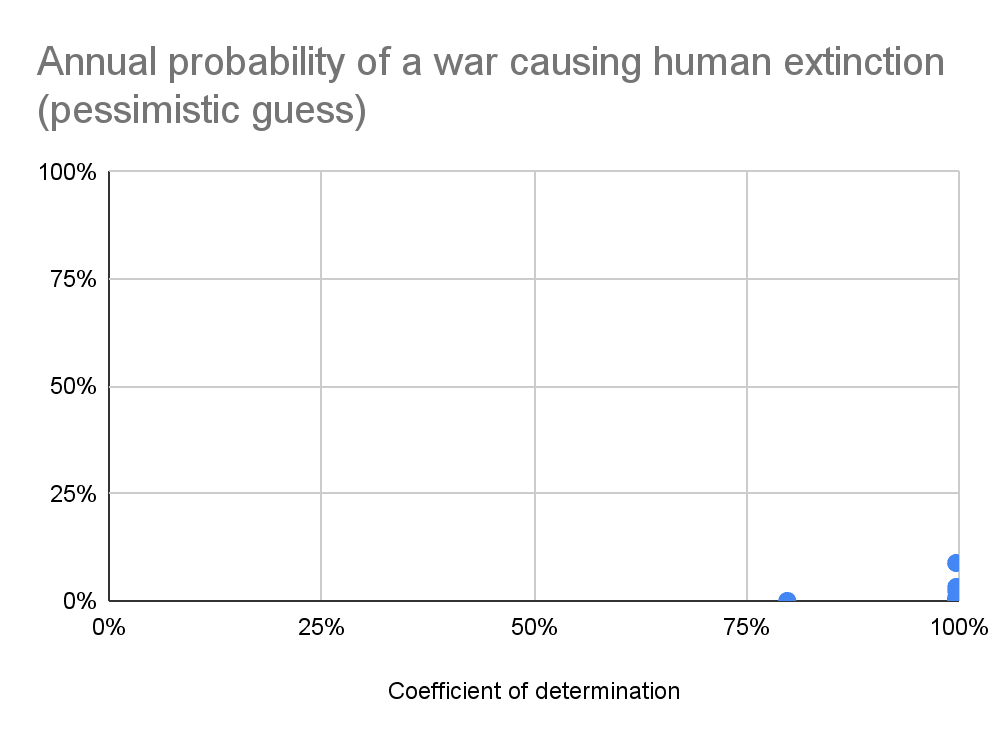
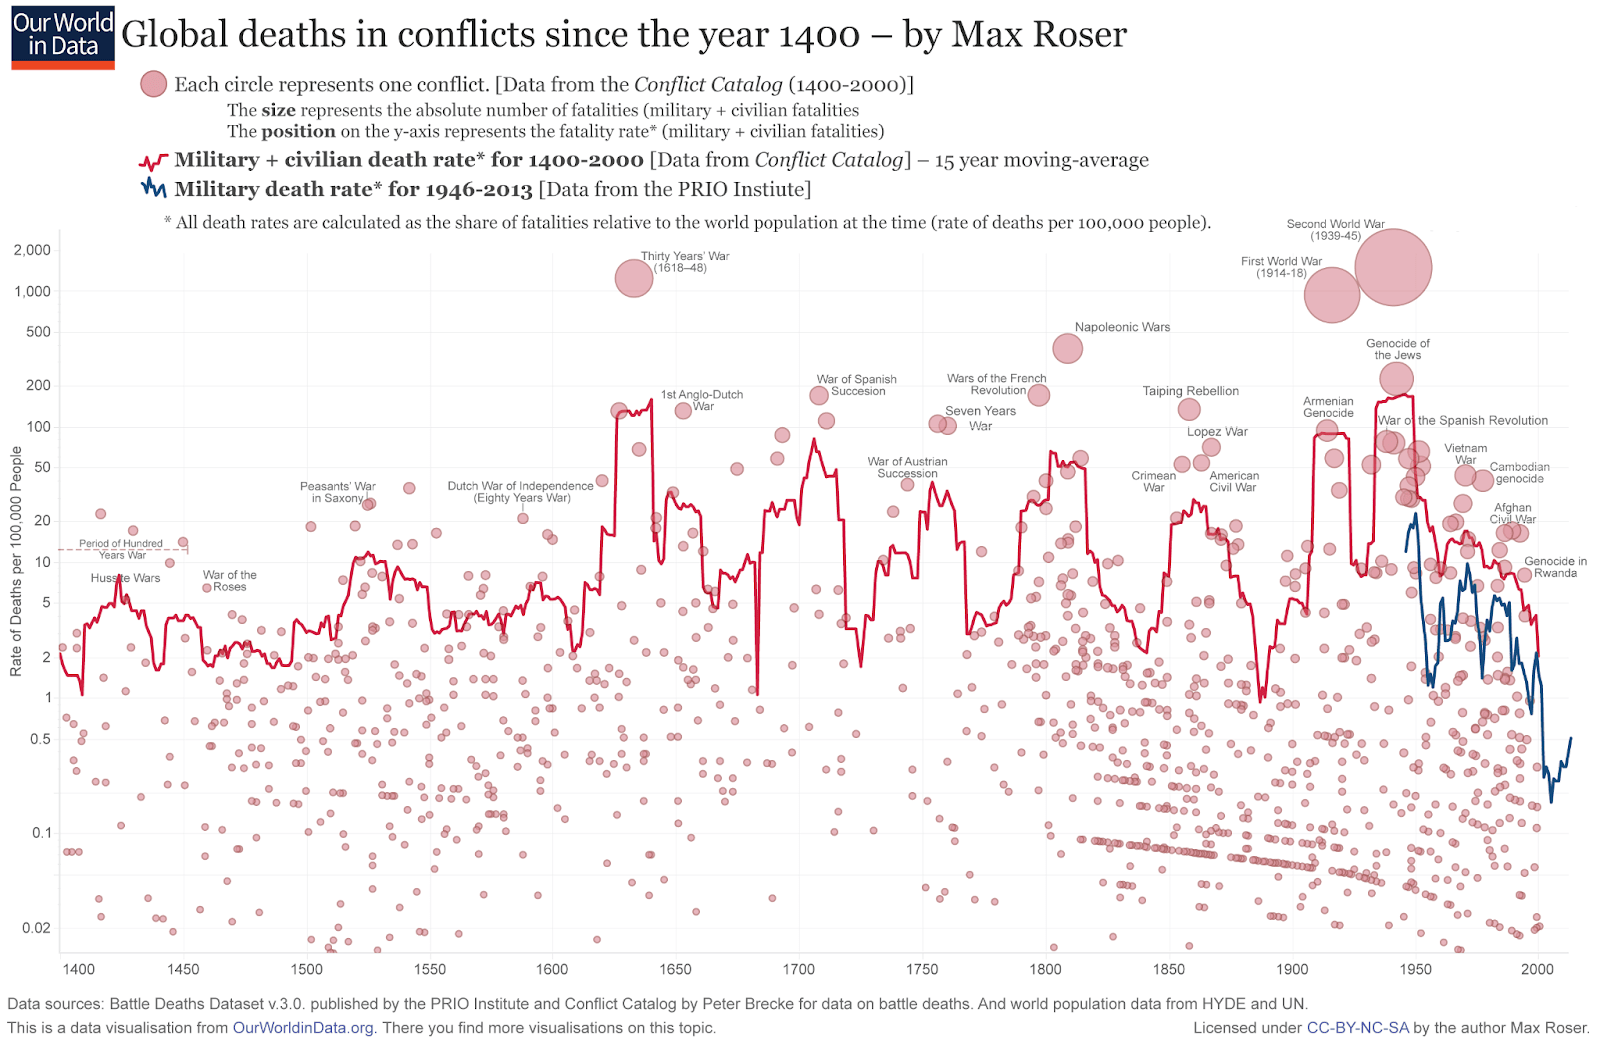
Thanks again for this post, Vasco, and for sharing it with me for discussion beforehand. I really appreciate your work on this question. It's super valuable to have more people thinking deeply about these issues and this post is a significant contribution.
The headline of my response is I think you're pointing in the right direction and the estimates I gave in my original post are too high. But I think you're overshooting and the probabilities you give here seem too low.
I have a couple of points to expand on; please do feel free to respond to each in individual comments to facilitate better discussion!
To summarize, my points are:
First, you're very likely right that my earlier estimates were too high. Although I still put some credence in a power law model, I think I should have incorporated more model uncertainty, and noted that other models would imply (much) lower chances of extinction-level wars.
I think @Ryan Greenblatt has made good points in other comments so won't belabour this point other than to add that I think some method of using the mean, or geometric mean, rather than median seems reasonable to me when we face this degree of model uncertainty.
One other minor point here: a reason I still like the power law fit is that there's at least some theoretical support for this distribution (as Bear wrote about in Only the Dead). Whereas I haven't seen arguments that connect other potential fits to the theory of the underlying data generating process. This is pretty speculative and uncertain, but is another reason why I don't want to throw away the power law entirely yet.
Second, I'm still skeptical that the historical war data is the "right" prior to use. It may be "a" prior but your title might be overstating things. This is related to Aaron's point you quote in footnote 9, about assuming wars are IID over time. I think maybe we can assume they're I (independent), but not that they're ID (identically distributed) over time.
I think we can be pretty confident that WWII was so much larger than other wars not just randomly, but in fact because globalization[1] and new technologies like machine guns and bombs shifted the distribution of potential war outcomes. And I think similarly that distribution has shifted again since. Cf. my discussion of war-making capacity here. Obviously past war size isn't completely irrelevant to the potential size of current wars, but I do think not adjusting for this shift at all likely biases your estimate down.
Third, I'm still uneasy about your choice to use annual proportion of population killed rather than number of deaths per war. This is just very rare in the IR world. I don't know enough about how the COW data is created to assess it properly. Maybe one problem here is that it just clearly breaks the IID assumption. If we're modelling each year as a draw, then since major wars last more than a year the probabilities of subsequent draws are clearly dependent on previous draws. Whereas if we just model each war as a whole as a draw (either in terms of gross deaths or in terms of deaths as a proportion of world population), then we're at least closer to an IID world. Not sure about this, but it feels like it also biases your estimate down.
Finally, I'm a bit suspicious of infinitesimal probabilities due to the strength they give the prior. They imply we'd need enormously strong evidence to update much at all in a way that seems unreasonable to me.
Let's take your preferred estimate of an annual probability of "6.36*10^-14". That's a 1 in 15,723,270,440,252 chance. That is, 1 in 15 trillion years.
I look around at the world and I see a nuclear-armed state fighting against a NATO-backed ally in Ukraine; I see conflict once again spreading throughout the Middle East; I see the US arming and perhaps preparing to defend Taiwan against China, which is governed by a leader who claims to consider reunification both inevitable and an existential issue for his nation.
And I see nuclear arsenals that still top 12,000 warheads and growing; I see ongoing bioweapons research powered by ever-more-capable biotechnologies; and I see obvious military interest in developing AI systems and autonomous weapons.
This does not seem like a situation that only leads to total existential destruction once every 15 trillion years.
I know you're only talking about the prior, but your preferred estimate implies we'd need a galactically-enormous update to get to a posterior probability of war x-risk that seems reasonable. So I think something might be going wrong. Cf. some of Joe's discussion of settling on infinitesimal priors here.
All that said, let me reiterate that I really appreciate this work!
What I mean here is that we should adjust somewhat for the fact that world wars are even possible nowadays. WWII was fought across three or four continents; that just couldn't have happened before the 1900s. But about 1/3 of the COW dataset is for pre-1900 wars.
Looking into annual war deaths as a fraction of the global population is relevant to estimate extinction risk, but the international relations world is not focussing on this. For reference, here is what I said about this matter in the post:
Do you have any thoughts on the above?
It is unclear to me whether this is a major issue, because both methodolies lead to essentially the same annual war extinction risk for a power law:
Historical war deaths seem to me like the most natural prior to assess future war deaths. I guess you consider it a decent prior too, as you relied on historical war data to get your extinction risk, but maybe you have a better reference class in mind?
Aron's point about annual war deaths not being IID over time does not have a clear impact on my estimate for the annual extinction risk. If one thinks war deaths have been decreasing/increasing, then one should update towards a lower/higher extinction risk. However:
I think Aron's paper (Clauset 2018) agrees with the above:
I think there is also another point Aron was referring to in footnote 9 (emphasis mine):
Relevant context for what I highlighted above:
I think Aron had the above in mind, and therefore was worried about assuming wars are IID over a long time, because this affects how much time it would take in expectation for a war to cause extinction. However, in my post I am estimating this time, but rather the nearterm annual probability of a war causing extinction, which does not rely on assumptions about whether wars will be IID over a long time horizon. I alluded to this in footnote 9:
It is possible you missed this part, because it was not in the early versions of the draft.
Some thoughts on the above:
Related to the above, I commented that:
Thanks for all the feedback, and early work on the topic, Stephen! I will reply to your points in different comments as you suggested.
To be fair, you and Rani had a section on breaking the [power] law where you say other distributions would fit the data well (although you did not discuss the implications for tail risk):
With respect to the below, I encourage readers to check the respective thread for context.
As I explained in the thread, I do not think a simple mean is appropriate. That being said, the mean could also lead to astronomically low extinction risk. With the methodology I followed, one has to look into at least 34 distributions for the mean not to be astronomically low. I have just obtained the following graph in this tab:
You suggested using the geometric mean, but it is always 0 given the null annual extinction risk for the top distribution, so it does not show up in the above graph. The median only is non-null for at least 84 distributions. I looked into all the 111 types of distributions available in SciPy, since I wanted to minimise cherry-picking as much as possible, but typical analyses only study 1 or a few. So it would have been easy to miss on noticing that the mean could lead to a much higher extinction risk.
Incidentally, the steep increase in the red line of the graph above illustrates one worry I have about using the mean I had alluded to in the thread. The simple mean is not resistant to outliers, in the sense that these are overweighted[1]. I have a strong intuition that, given 33 models outputting an annual extinction risk between 0 and 9.07*10^-14, with mean 1.15*10^-13 among them, one should not update upwards by 8 OOMs to an extinction risk of 6.45*10^-6 after integrating a 34th model outputting an annual extinction risk of 0.0219 % (similar to yours of 0.0124 %). Under these conditions, I think one should put way less weight on the 34th model (maybe roughly no weight?). As Holden Karnofsky discusses in the post Why we can’t take expected value estimates literally (even when they’re unbiased):
Ideally, one would do more research to find how much weight each distribution should receive. In the absence of that, I think using the median is a simple way to adequately weight outliers.
The worry here is that the theoretical support for using a power law breaks at some point. According to a power law, the probability p1 of at least 8 billion deaths conditional on 800 M deaths is the same as the probability p2 of 80 billion deaths conditional on 8 billion deaths. However, p1 is low[2] whereas p2 is 0.
There is this argument I mentioned in the post:
I should note I have just updated in the post the part of the sentence above after "i.e.". Previously, I was comparing the annual war extinction risk of my best fit power law with your extinction risk per war under the "constant risk hypothesis". Now I am making the correct comparison with your annual war extinction risk.
Just to clarify, I am still accounting for the results of the power law in my best guess. However, since I am using the median to aggregate the various estimates of the extinction risk, I get astronomically low extinction risk even accounting for distributions predicting super high values.
I have added this point to the post.
I would argue not just low, but super low.
Thanks Vasco! I'll come back to this to respond in a bit more depth next week (this is a busy week).
In the meantime, curious what you make of my point that setting a prior that gives only a 1 in 15 trillion chance of experiencing an extinction-level war in any given year seems wrong?
You are welcome, Stephen!
No worries, and thanks for still managing to make an in-depth comment!
I only managed to reply to 3 of your points yesterday and during this evening, but I plan to address that 4th one still today.
I think there is a potential misunderstanding here. Joe Carlsmith's[1] discussion on the contraints on future updating apply to one's best guess. In contrast, my astronomically low best guess prior is not supposed to be neither my current best guess nor a preliminary best guess from which one should formally update towards one's best guess. That being said, historical war deaths seem to me like the most natural prior to assess future war deaths, so I see some merit in using my astronomically low best guess prior as a preliminary best guess.
I also agree with Joe that an astronomically low annual AI extinction risk (e.g. 6.36*10^-14) would not make sense (see this somewhat related thread). However, I would think about the possibility of AI killing all humans in the context of AI risk, not great power war.
I feel like the sentiment you are expressing describing current events and trends would also have applied in the past, and today to risks which you might consider overly low. On the one hand, I appreciate a probability like 6.36*10^-14 intuitively feels way too small. On the other, humans are not designed to intuitively/directly assess the probability of rare events in a reliable way. These involve many steps, and therefore give rise to scope neglect.
As a side note, I do not think there is an evolutionary incentive for an individual human to accurately distinguishing between an extinction risk of 10^-14 and 0.01 %, because both are negligible in comparison with the annual risk of death 1 % (for a life expectancy of 100 years). Relatedly, I mentioned in the post that:
In addition, I guess my astronomically low annual war extinction risk feels like an extreme value to many because they have in the back of their minds Toby's guesses for the existential risk between 2021 and 2120 given in The Precipice. The guess was 0.1 % for nuclear war, which respects an annual existential risk of around 10^-5, way larger than the estimates for annual war extinction risk I present in my post. Toby does not mechanistically explain how he got his guesses, but I do not think he used quantitative models to derive them. So I think they may well be prone to scope neglect. In terms of Toby's guesses, I also mentioned in the post that:
To give an example that is not discussed by David, Salotti 2022 estimated the extinction risk per century from asteroids and comets is 2.2*10^-12 (see Table 1), which is 6 (= log10(10^-6/(2.2*10^-12)) orders of magnitude lower than Toby Ord’s guess for the existential risk. The concept of existential risk is quite vague, but I do not think one can say existential risk from asteroids and comets is 6 orders of magnitude higher than extinction risk from these:
The methodology I followed in my analysis is quite similar to yours. The major differences are that:
You might be thinking something along the lines of:
However, given the similarities between our methodologies, I think there is a high chance that any fundamental flaw in my methodology would affect yours too. So, given a fundamental flaw in mine, I would mostly believe that neither my best guess prior nor your best guess could be trusted. So, to the extent your best guess for the war extinction is informed by your methodology, I would not use it as a prior given a fundamental flaw in my methodology. In this case, one would have to come up with a better methodology rather than multiplying your annual war extinction risk by e.g. 10 %.
I also feel like updating on your prior via multiplication by something like 10 % would be quite arbitrary because my estimates for the annual war extinction risk are all over the map. Across all 111 distributions, and 3 values for the deaths of combatants as a fraction of the total deaths (10 %, 50 % and 90%) I studied, I got estimates for the annual probability of a war causing human extinction from 0 to 8.84 %. Considering just my best guess of war deaths of combatants equal to 50 % of the total deaths, the annual probability of a war causing human extinction still ranges from 0 to 2.95 %. Given such wide ranges, I would instead update towards a state of greater cluelessness or less resilience. In turn, these would imply a greater need for a better methodology, and more research on quantifying the risk of war in general.
I like use the full name on the 1st occasion a name is mentioned, and then just the 1st name afterwards.