When I looked at the same dataset, albeit processing the data quite differently, I found that a truncated or cutoff power-law appeared to be a good fit. This gives a much lower value for extreme probabilities using the best-fit parameters. In particular, there were too few of the most severe pandemics in the dataset (COVID-19 and 1918 influenza) otherwise; this issue is visible in fig 1 of Marani et al. Could you please add the data to your tail distribution plot to assess how good a fit it is?
A final note, I think you're calculating the probability of extinction in a single year but the worst pandemics historically have lasted multiple years. The total death toll from the pandemic is perhaps the quantity most of interest.
Agreed. In my analysis of conflict deaths, for the method where I used fitter:
The 5th and 95th percentile annual probability of a conflict causing human extinction are 0 and 5.02 % [depending on the distribution]
When I looked at the same dataset, albeit processing the data quite differently, I found that a truncated or cutoff power-law appeared to be a good fit. This gives a much lower value for extreme probabilities using the best-fit parameters. In particular, there were too few of the most severe pandemics in the dataset (COVID-19 and 1918 influenza) otherwise; this issue is visible in fig 1 of Marani et al. Could you please add the data to your tail distribution plot to assess how good a fit it is?
I did not get what you would like me to add to my tail distribution plot. However, I added here the coefficients of determination (R^2) of the regressions I did.
A final note, I think you're calculating the probability of extinction in a single year but the worst pandemics historically have lasted multiple years. The total death toll from the pandemic is perhaps the quantity most of interest.
Focussing on the annual deaths as a fraction of the global population is useful because it being 1 is equivalent to human extinction. In contrast, total epidemic/pandemic deaths as a fraction of the global population in the year in which the epidemic/pandemic started being equal to 1 does not imply human extinction. For example, a pandemic could kill 1 % of the population each year for 100 years, but population remain constant due to births being equal to the pandemic deaths plus other deaths.
However, I agree interventions should be assessed based on standard cost-effectiveness analyses. So I believe the quantity of most interest which could be inferred from my analysis is the expected annual epidemic/pandemic deaths. These would be 2.28 M (= 2.87*10^-4*7.95*10^9) multiplying:
My annual epidemic/pandemic deaths as a fraction of the global population based on data from 1900 to 2023. Earlier years are arguably not that informative.
The population in 2021.
The above expected death toll would rank as 6th in 2021.
For reference, based on my analysis of conflicts, I get an expected death toll of conflicts based on historical data from 1900 to 2000 (also adjusted for underreporting), and the population in 2021 of 3.83 M (= 2.87*10^-4*7.95*10^9), which would rank above as 5th.
Here is a graph with the top 10 actual causes of death and expected conflict and epidemic/pandemic deaths:
Are the high numbers of deaths in the 1500s old world diseases spreading in the new world? If so, that seems to overestimate natural risk: the world's current population isn't separated from a larger population that has lots of highly human-adapted diseases.
In the other direction, this kind of analysis doesn't capture what I personally see as a larger worry: human-created pandemics. I know you're extrapolating from the past, and it's only very recently that these would even have been possible, but this seems at least worth noting.
Are the high numbers of deaths in the 1500s old world diseases spreading in the new world?
Yes, and deaths are especially high in the 1500s given my assumption of high underreporting then.
If so, that seems to overestimate natural risk: the world's current population isn't separated from a larger population that has lots of highly human-adapted diseases.
Agreed. Personally, I guess the annual probability of a natural pandemic causing human extinction is lower than 10^-10.
In the other direction, this kind of analysis doesn't capture what I personally see as a larger worry: human-created pandemics. I know you're extrapolating from the past, and it's only very recently that these would even have been possible, but this seems at least worth noting.
I think it is interesting that:
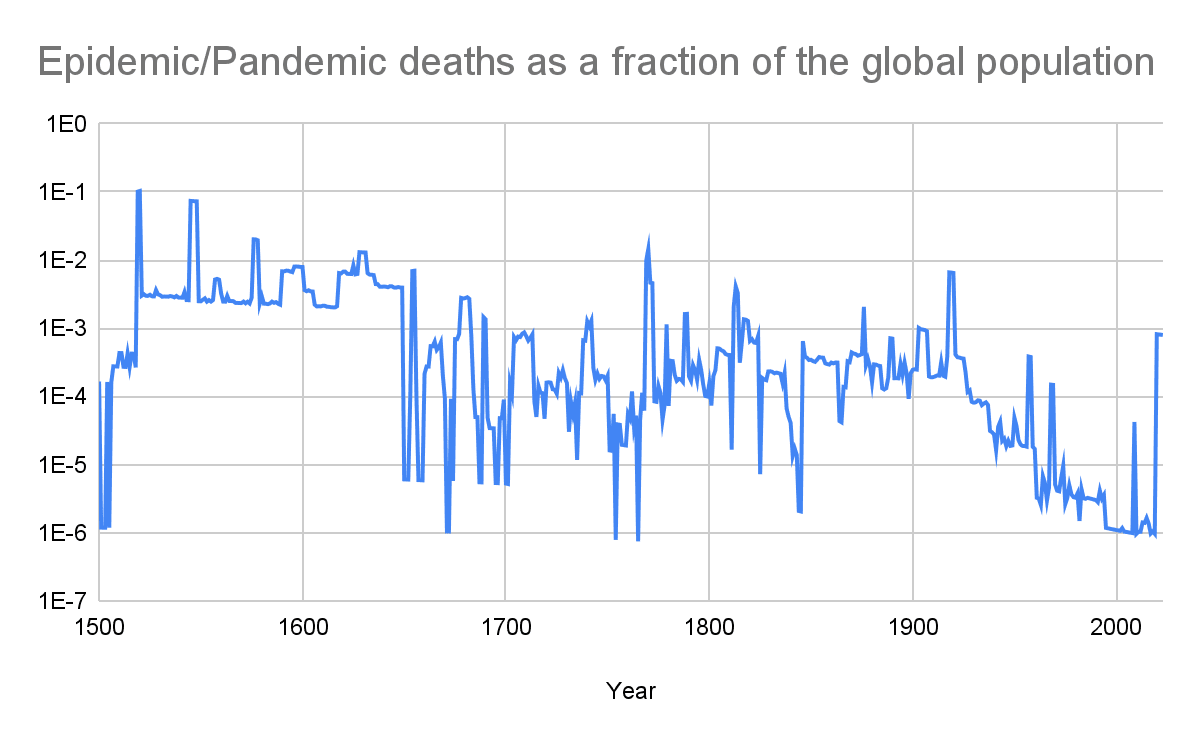
There has been a downward trend in the logarithm of the annual epidemic/pandemic deaths as a fraction of the global population, with the R^2 of the linear regression of it on the year being 38.5 %. I guess the sign of the slope is resilient against changes to my modelling of the underreporting. One may argue the aforementioned logarithm will increase in the next few decades based on inside view factors such as technology becoming cheaper and more powerful. Nevertheless, technology also became cheaper and more powerful during the period of 1500 to 2023 covered by my data, but these still suggest a decreasing logarithm of the annual epidemic/pandemic deaths as a fraction of the global population.
AI Use Note: Main body text entirely human written. Claude (Opus 4.8) helped develop models of animal life histories in the appendix.
Cross-posted from Good Structures.
Executive Summary
* Animal advocates sometimes make claims like “there are X of this animal...
Summary
Back in November 2023 I posted here to launch Spiro and raise our first $198k. Two and a half years later this is an update and a fundraiser for the next step.
The short version: we've now reached over-5,900 people with TB preventive medicine, including over 3,000 children under five years old. Our early results have held up well an...
Adapted from my Substack, Funding Anthropalypse.
Short version: if you want a share of the coming Anthropic and OpenAI windfall - the $37bn+ that could be in play next year - the way in is to become 'legibly excellent', so the evaluators and donors that frontier lab staff already trust point them to yo...
The views expressed here are my own, not those of my employers.
Summary
I previously estimated an astronomically low annual probability of a conflict causing human extinction fitting Pareto distributions to increasingly rightmost sections of the tail distribution of the annual conflict deaths as a fraction of the global population. In this post, I run a similar analysis for annual epidemic/pandemic deaths.
The expected damage from epidemics/pandemics is very concentrated in the most severe ones, with 94.0 % of the annual epidemics/pandemics deaths as a fraction of the global population coming from ones whose such fraction is at least 0.1 %.
There has been a downward trend in the logarithm of the annual epidemic/pandemic deaths as a fraction of the global population, with the coefficient of determination (R^2) of the linear regression of it on the year being 38.5 %.
In contrast to the conclusion of my past analyses on terrorist attacks, wars and conflicts, a pandemic can possibly cause human extinction, at least on priors. The tail distribution of the annual epidemic/pandemic deaths as a fraction of the global population does not decay fast enough for the annual probability of a pandemic causing human extinction to become astronomically low.
Introduction
I previously estimated an astronomically low annual probability of a conflict causing human extinction fitting Pareto distributions to increasingly rightmost sections of the tail distribution of the annual conflict deaths as a fraction of the global population. In this post, I run a similar analysis for annual epidemic/pandemic deaths.
I focussed on Pareto distributions for simplicity, and because these are arguably the most commonly used to model tail risk. One could argue they have overly thin tails due the possibility of dragon kings, i.e. flatter sections of the right tail (in the unobserved domain), but I assume steep sections cannot be ruled out either. Consequently, I supposed Pareto distributions still offer a good prior.
Methods
I got the epidemic/pandemic deaths from 1500 to 2023 based on data from Marani et. al 2021 on the start and end years as well as deaths by epidemic/pandemic[1]. I stipulated the deaths of each epidemic/pandemic are distributed uniformly from its start to end year.
I assumed Marani et. al’s data underestimate the epidemic/pandemic deaths due to underreporting.
I got no epidemic/pandemic deaths with the procedure above in 8 of 524 (= 2023 - 1500 + 1) years, i.e. 1.53 % (= 8/524) of them. However, I wanted the deaths to be positive in all years to fairly assess the linear regression of the logarithm of the annual epidemic/pandemic deaths as a fraction of the global population on the year. So I supposed the epidemic/pandemic deaths in each of the aforementioned 8 years to be 597, which is half of the ratio between 5 k deaths (lowest value outside these 8 years; see previous footnote) and the mean epidemic/pandemic duration of 4.19 years.
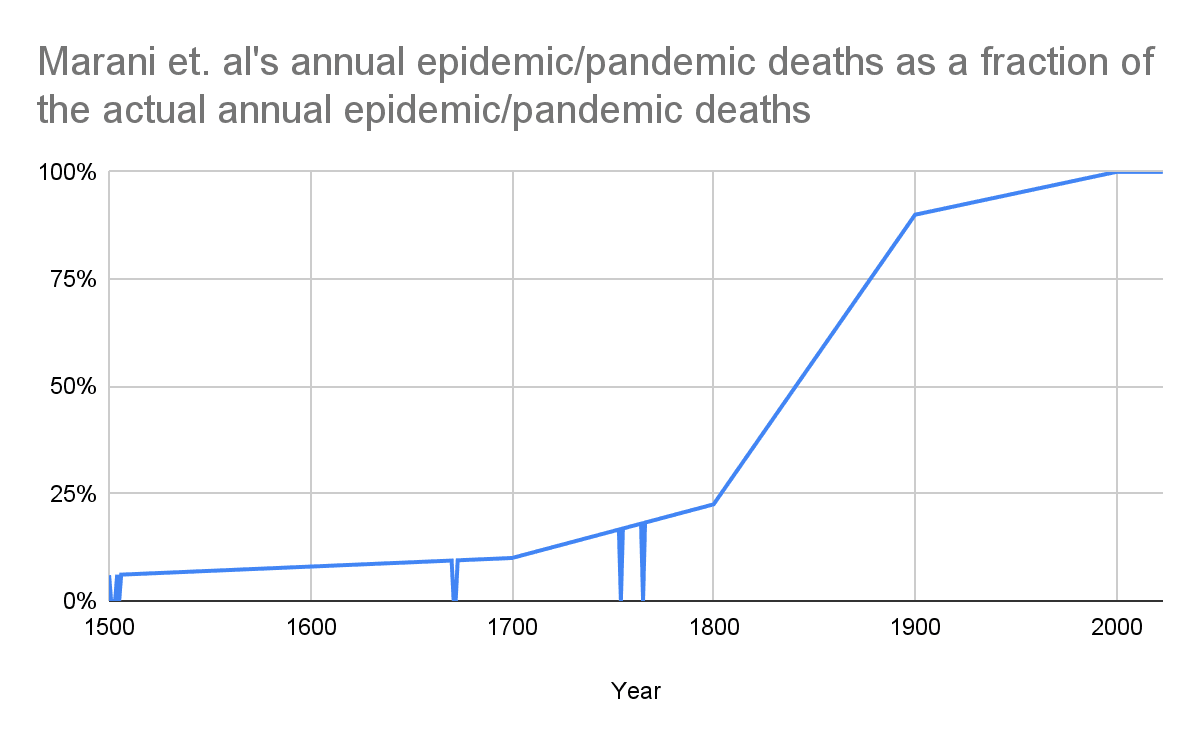
For the other years, I considered Marani et. al’s annual epidemic/pandemic deaths as a fraction of the actual annual epidemic/pandemic deaths are represented by a piecewise linear function of the year[2]. I asked Marco Marani on July 2 about some points to define it, but I have not heard back[3]. So I used the function of my analysis of conflict deaths, which is defined by the following points (in agreement with guesses from Peter Brecke, who built the Conflict Catalog dataset):
In 1400, 4 %.
In 1700, 10 %.
In 1800, 22.5 %.
In 1900, 90 %.
In 2000, 100 %.
I also relied on a value of 100 % for 2023, as the above implies underreporting decreases with time.
I fit Pareto distributions to the 2, 3, … and 524 (= 2023 - 1500 + 1) years with the most epidemic/pandemic deaths as a fraction of the global population. To do this:
I get the slope and intercept of linear regressions of the logarithm of (sections of) the tail distribution on the logarithm of the annual epidemic/pandemic deaths as a fraction of the global population.
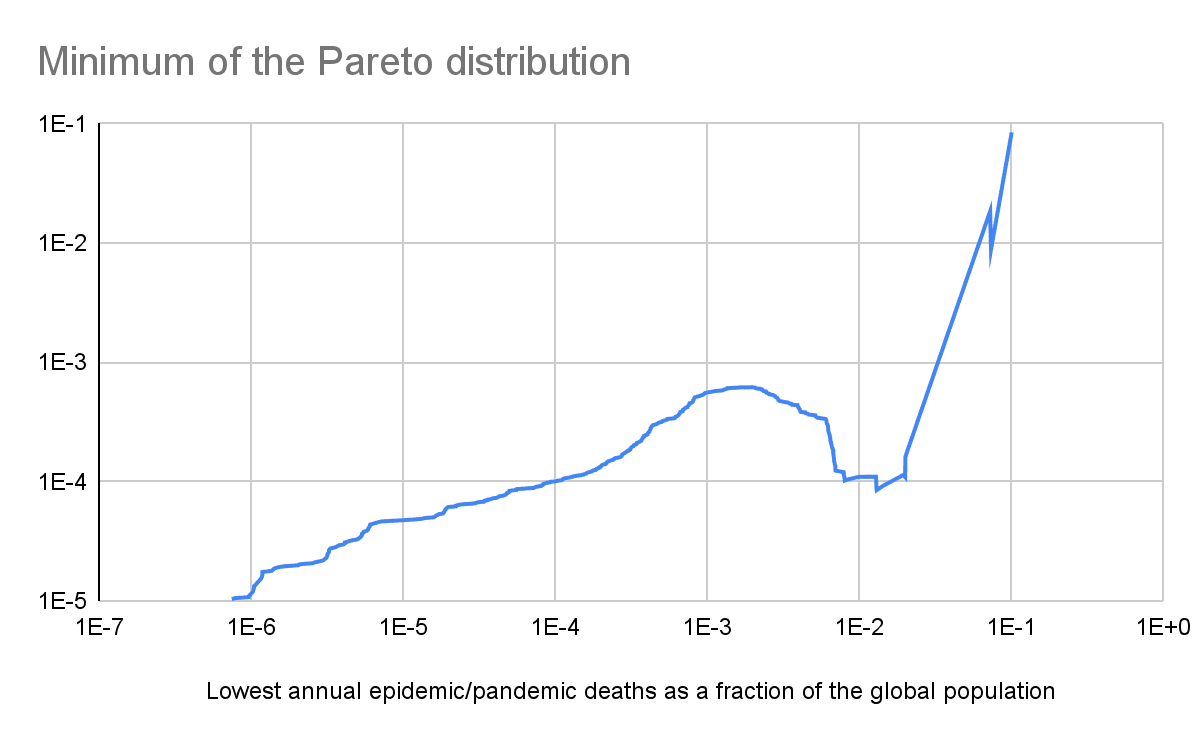
Since the tail distribution of a Pareto distribution is P(X > x) = (“minimum”/x)^“tail index”, ln(P(X > x)) = “tail index”*ln(“minimum”) - “tail index”*ln(x) = “intercept” + “slope”*ln(x), so I determine the parameters of the Pareto distributions from:
“Tail index” = -“slope”.
“Minimum” = e^(“intercept”/“tail index”).
Then I obtain the annual probability of a pandemic causing human extinction from that of conflict deaths exceeding the global population, which is P(X > 1) = “minimum”^“tail index”. This decreases with the tail index, given the minimum of each Pareto distribution is lower than 1.
Historical annual epidemic/pandemic deaths as a fraction of the global population
Preprocessing
Basic stats
Statistic
Annual epidemic/pandemic deaths as a fraction of the global population
Mean
0.236 %
Minimum
0
5th percentile
1.19*10^-6
10th percentile
3.60*10^-6
Median
0.0276 %
90th percentile
0.414 %
95th percentile
0.684 %
Maximum
10.3 %
Worst years
N
Nth highest annual epidemic/pandemic deaths as a fraction of the global population
Year
Location of the epidemics/pandemics
1
10.3 %
1520
Americas, Dominican Republic, Haiti, Ireland and Mexico
2
10.1 %
1519
China, Dominican Republic, Haiti, Ireland and Mexico
3
7.39 %
1545
Americas, China and India
4
7.34 %
1546
Americas
5
7.32 %
1547
Americas
6
7.30 %
1548
Americas
7
2.02 %
1576
Americas, England, France, Ireland and Italy
8
2.01 %
1577
Americas, England, Ireland and Italy
9
1.96 %
1578
Americas and France
10
1.45 %
1770
England, Germany, India, Iraq, Ireland, Italy, Russia, Scotland and Sweden
Linear regression of the logarithm of the annual epidemic/pandemic deaths as a fraction of the global population on the year
Slope (1/year)
Intercept
Coefficient of determination
-0.0106
10.2
38.5 %
Risk by severity
Annual epidemic/pandemic deaths as a fraction of the global population
Years
Years as a fraction of the total
Conditional annual epidemic/pandemic deaths as a fraction of the global population
Unconditional annual epidemic/pandemic deaths as a fraction of the global population
Unconditional annual epidemic/pandemic deaths as a fraction of the global population
Minimum
Maximum
0
Infinity
524
100 %
0.236 %
0.236 %
100 %
0
10^-6
6
1.15 %
9.05*10^-7
1.04*10^-8
4.38*10^-6
10^-6
0.001 %
74
14.1 %
3.24*10^-6
4.57*10^-7
0.0193 %
0.001 %
0.01 %
81
15.5 %
0.00471 %
0.00073 %
0.308 %
0.01 %
0.1 %
202
38.5 %
0.0342 %
0.0132 %
5.58 %
0.1 %
1 %
147
28.1 %
0.368 %
0.103 %
43.6 %
1 %
10 %
12
2.29 %
3.50 %
0.0802 %
33.9 %
10 %
100 %
2
0.382 %
10.2 %
0.0390 %
16.5 %
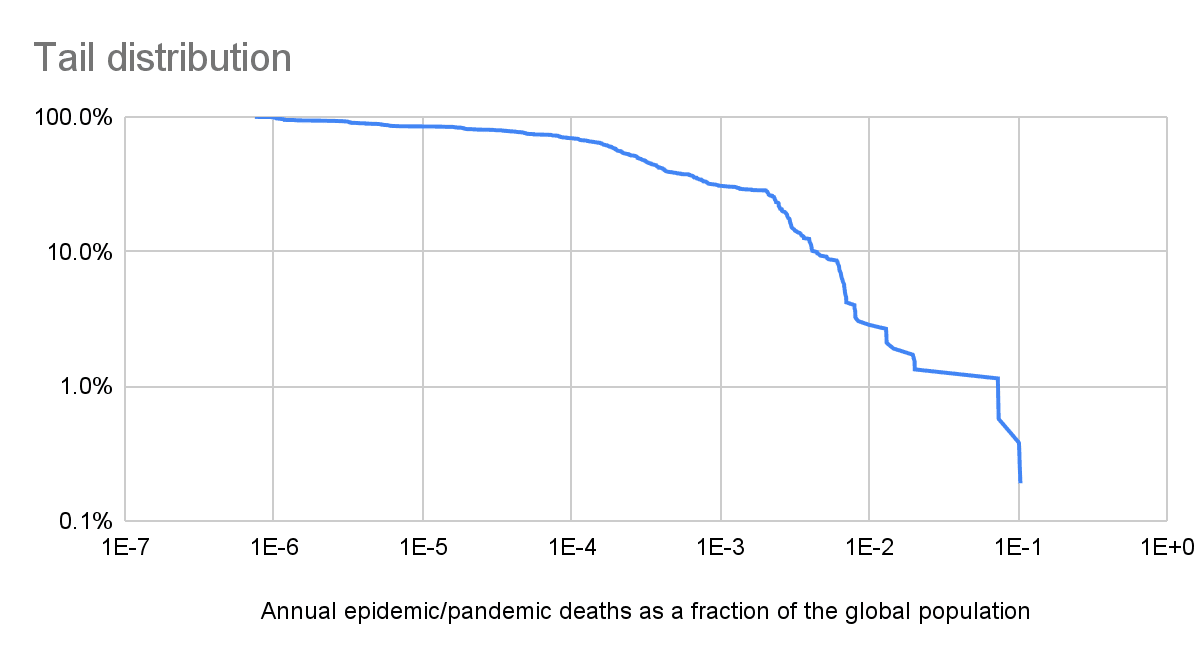
Tail distribution
Pandemics tail risk
The tail distribution decays faster for higher tail indices. A tail index of 1 (10) means annual epidemic/pandemic deaths as a fraction of the global population are 10 % (10^-10) likely to become 10 times as large.
Discussion
Historical annual epidemic/pandemic deaths as a fraction of the global population
The expected damage from epidemics/pandemics is very concentrated in the most severe ones, with 94.0 % (= 0.436 + 0.339 + 0.165) of the annual epidemics/pandemics deaths as a fraction of the global population coming from ones whose such fraction is at least 0.1 % (see last table).
The highest annual epidemic/pandemic deaths as a fraction of the global population were 10.3 % in 1520. This involved pandemics/epidemics in the Americas, Dominican Republic, Haiti, Ireland and Mexico.
There has been a downward trend in the logarithm of the annual epidemic/pandemic deaths as a fraction of the global population, with the R^2 of the linear regression of it on the year being 38.5 %. I guess the sign of the slope is resilient against changes to my modelling of the underreporting. One may argue the aforementioned logarithm will increase in the next few decades based on inside view factors such as technology becoming cheaper and more powerful. Nevertheless, technology also became cheaper and more powerful during the period of 1500 to 2023 covered by my data, but these still suggest a decreasing logarithm of the annual epidemic/pandemic deaths as a fraction of the global population.
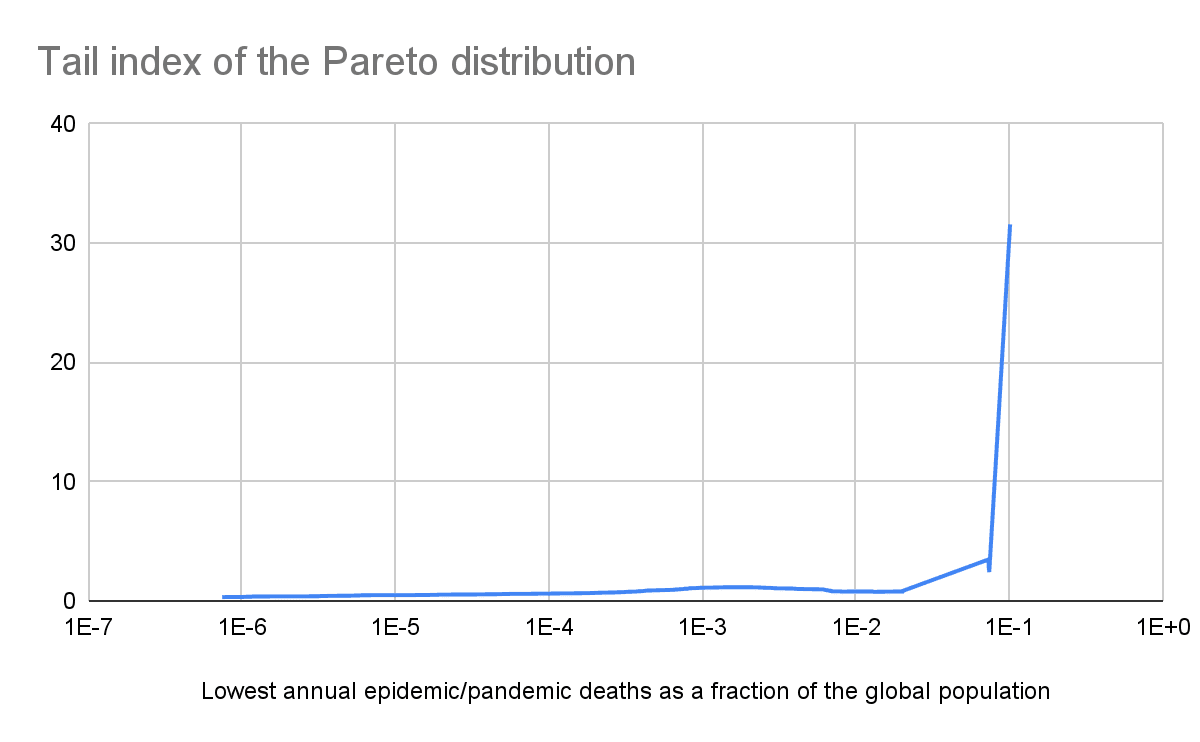
Pandemics tail risk
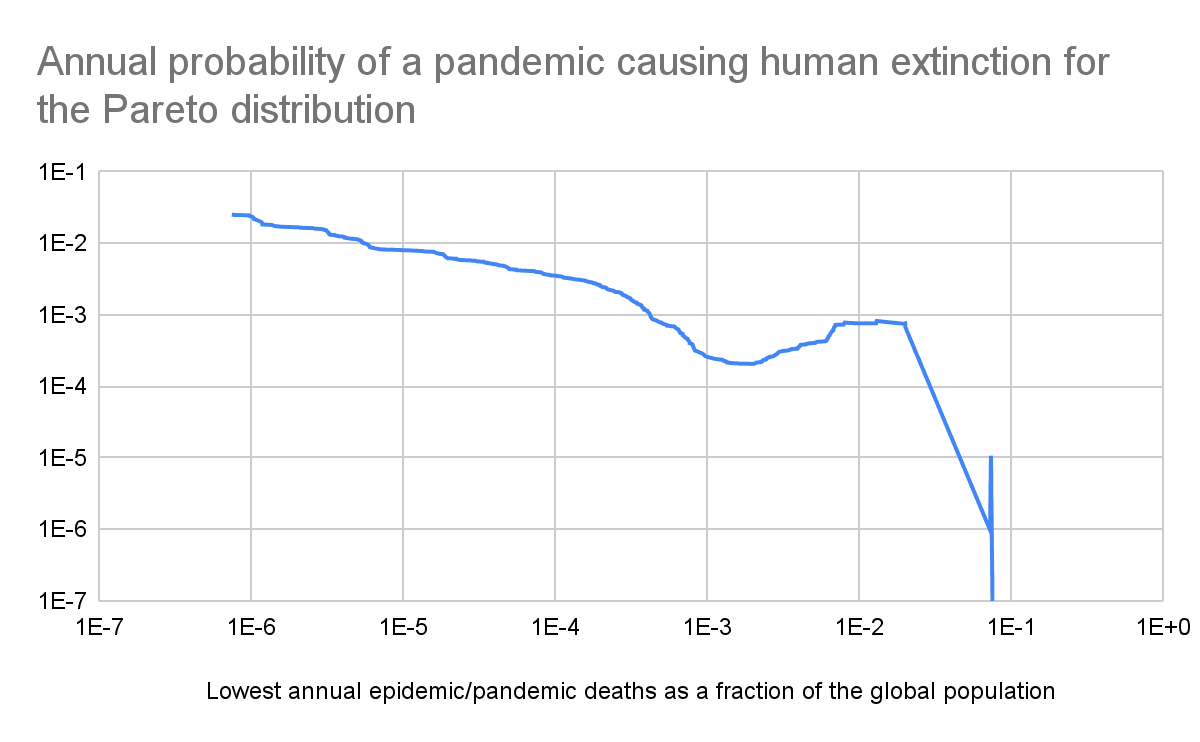
Increasing the lowest annual epidemic/pandemic deaths as a fraction of the global population included in the linear regression of the tail distribution, i.e. relying on increasingly rightmost sections of the tail, the annual probability of a pandemic causing human extinction (see last graph):
Decreases to 0.0206 % for 0.202 % lowest annual epidemic/pandemic deaths as a fraction of the global population.
Then increases to 0.0823 % for 1.31 % lowest annual epidemic/pandemic deaths as a fraction of the global population.
Then decreases to 9.76*10^-7 for 7.30 % lowest annual epidemic/pandemic deaths as a fraction of the global population.
Then increases to 0.00107 % for 7.39 % lowest annual epidemic/pandemic deaths as a fraction of the global population.
Then decreases to 1.46*10^-34 for 10.1 % lowest annual epidemic/pandemic deaths as a fraction of the global population.
The median superforecaster and domain expert of The Existential Risk Persuasion Tournament (XPT) predicted an annual probability of an engineered pathogen causing human extinction in the 78 years (= 2100 - 2023 + 1) from 2023 to 2100 of 1.28*10^-6 (= 1 - (1 - 10^-4)^(1/78)) and 0.0129 %[4] (= 1 - (1 - 10^-4)^(1/78)).
My only astronomically low annual probability of a pandemic causing human extinction of 1.46*10^-34 relies on just the 2 rightmost points of the tail. I believe these should get the most weight to predict extinction risk, but that such a tiny sample size is clearly insufficient to conclude the prior annual probability of a pandemic causing human extinction is astronomically low. This is in contrast to the conclusion of my past analyses on terrorist attacks, wars and conflicts.
The tail distribution still has to eventually decay abruptly for annual epidemic/pandemic deaths as a fraction of the global population that are higher than the ones I studied, as deaths are limited to the global population. However, such an abrupt decrease is not born out of past data. So, at least on priors, a pandemic can possibly cause human extinction.
I assumed 5 k deaths (= (0 + 10)/2*10^3) for epidemics/pandemics qualitatively inferred (said) to have caused less than 10 k deaths, which are coded as having caused -999 (0) deaths. I also considered the deaths from COVID-19, which is not in the original dataset.
By Marani et. al’s annual epidemic/pandemic deaths, I mean those I got based on Marani et. al’s data, but Marani et. al 2021 do not (explicitly) provide data on the annual epidemic/pandemic deaths.


Could you please expand on why you think a Pareto distribution is appropriate here? Tail probabilities are often quite sensitive to the assumptions here, and it can be tricky to determine if something is truly power-law distributed.
When I looked at the same dataset, albeit processing the data quite differently, I found that a truncated or cutoff power-law appeared to be a good fit. This gives a much lower value for extreme probabilities using the best-fit parameters. In particular, there were too few of the most severe pandemics in the dataset (COVID-19 and 1918 influenza) otherwise; this issue is visible in fig 1 of Marani et al. Could you please add the data to your tail distribution plot to assess how good a fit it is?
A final note, I think you're calculating the probability of extinction in a single year but the worst pandemics historically have lasted multiple years. The total death toll from the pandemic is perhaps the quantity most of interest.
Thanks for the relevant points, Joshua. I strongly upvoted your comment.
I did not mean to suggest a Pareto distribution is appropriate, just that it is worth considering.
Agreed. In my analysis of conflict deaths, for the method where I used fitter:
I did not get what you would like me to add to my tail distribution plot. However, I added here the coefficients of determination (R^2) of the regressions I did.
Focussing on the annual deaths as a fraction of the global population is useful because it being 1 is equivalent to human extinction. In contrast, total epidemic/pandemic deaths as a fraction of the global population in the year in which the epidemic/pandemic started being equal to 1 does not imply human extinction. For example, a pandemic could kill 1 % of the population each year for 100 years, but population remain constant due to births being equal to the pandemic deaths plus other deaths.
However, I agree interventions should be assessed based on standard cost-effectiveness analyses. So I believe the quantity of most interest which could be inferred from my analysis is the expected annual epidemic/pandemic deaths. These would be 2.28 M (= 2.87*10^-4*7.95*10^9) multiplying:
The above expected death toll would rank as 6th in 2021.
For reference, based on my analysis of conflicts, I get an expected death toll of conflicts based on historical data from 1900 to 2000 (also adjusted for underreporting), and the population in 2021 of 3.83 M (= 2.87*10^-4*7.95*10^9), which would rank above as 5th.
Here is a graph with the top 10 actual causes of death and expected conflict and epidemic/pandemic deaths: