Comments
This smells like a composition effect. Have you checked that this is not just due to e.g. aging of the population; or driven by the rise in immigration?
This smells like a composition effect. Have you checked that this is not just due to e.g. aging of the population; or driven by the rise in immigration?
On the aging thing I've just done a rough estimate. The median age increased about 3 years between 1999 and 2019, and as it's around 40 which is before the mid-life crisis (life satisfaction being U-shaped as you age, the lowpoint around 50), an age increase of 3 years would if anything lower happiness. (Of course it would be a mix of some going down and others up depending on their ages, but the overall effect would presumably be down. Incidentally the bottom of the U-shape hasn't noticeably got older as the population aged over this period.)
But the effect is small anyway - the median, getting 3 years older, would lose about 0.07/10 points life satisfaction (when expressed as a score out of 10), which is only about 10% of the 1999-2019 change, as well as in the wrong direction.
The aging did occur to me, but without doing the numbers I doubt it would have an effect that fast on happiness, and certainly not that fast on misery.
Re immigration, research shows immigrants mostly take on the happiness of the country they move to, partly retaining their previous happiness. And as most recent immigration has been from less happy countries (eg Eastern Europe), I’d expect the effect to be a small fall in happiness not a rise. Though again without doing the figures I doubt it would be big enough to affect the general shape of the graphs.
cf. IHME's data visualization tool, which shows that UK rates of depression have been roughly constant since the 1990s (except for a recent decline in Northern Ireland):
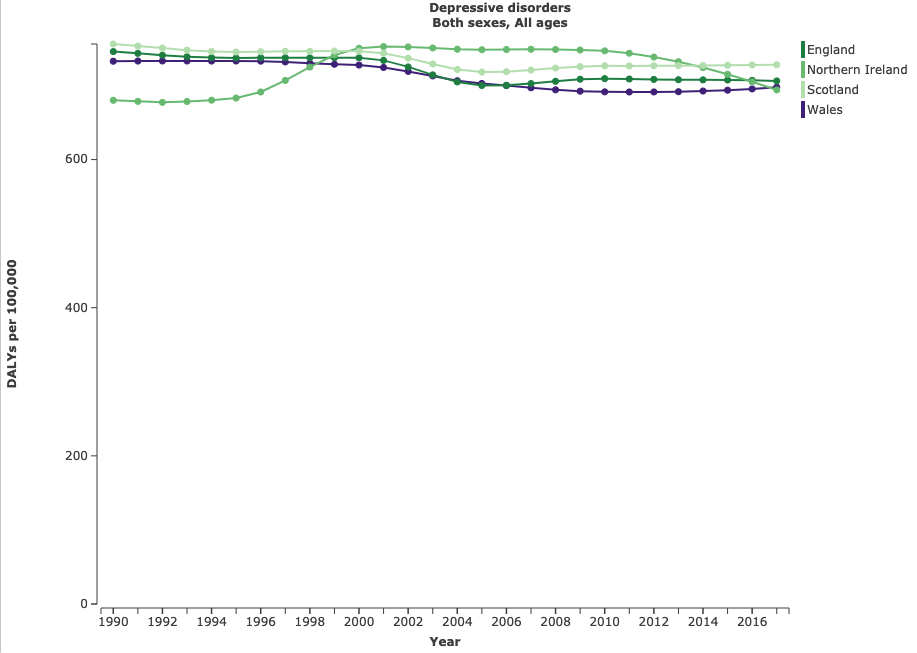
Which is actually sorta surprising given the rollout of third-generation antidepressants during that time.
Do you know how this data was gathered? The prevalence of mental health problems is presumably hard to determine (see my footnote 7). I’m inclined to believe the falling suicide stats as a proxy, as they’re objective.
I also don't trust mental health time series to show whether conditions are becoming more common, because it's equally or more likely that more people are coming forward as having, e.g. depression, as it becomes very acceptable to talk about it.
But suicide rates are hugely influenced by the social acceptability of suicide specifically, and easy access to suicide methods that allow you to successfully kill yourself on impulse (e.g. guns, which have become less accessible to people over time). So unfortunately I don't think suicide rates are a reliable way to track mental health problems over time either.
Thanks for this.
The ONS suicide data is from 1981, showing a decline by about a third by 2007 - pretty big, and I'm not aware that any popular suicide method became less available in that time.
(Unlike e.g. coal gas used in ovens, once a popular suicide method but it was phased out in the 1960s and 1970s leading to a suicide reduction - I don't think coal gas was available thereafter as the last plant closed in the late 1970s. And guns have never been generally available in the UK.)
The methods used have apparently changed popularity in recent years; hanging/suffocation/strangulation and poisoning are the most popular:
But I'm not sure why they have changed other than 'fashion'. It could be the case that some of these methods are significantly more effective than others which could affect the statistics, but I doubt by this much.
Also I'm not aware that suicide has changed in acceptability in the UK in recent decades. It was never considered acceptable (unlike say in Japan).
So I'm still inclined to regard suicide as a better proxy of extreme mental health problems than anything else. (That said, I'm not an expert at all in this area.)
Hi bfinn, maybe have a listen to this episode of the Freakonomics podcast: http://freakonomics.com/podcast/new-freakonomics-radio-podcast-the-suicide-paradox/
It's one of the things that shaped my view that cross-country differences in suicide are best explained by culture rather than underlying happiness.
Some background on the IHME tool here: http://www.healthdata.org/data-visualization/gbd-compare
And I believe you can download all the underlying data & citations from there as well.
Thanks. It's a very cool site. I couldn't figure out how to find the source, but never mind. The figures for England (the vast majority of the UK population) do indeed show a slight decline so at least that's consistent with my hunch, though not explaining much of the misery fall (and it shows anxiety as completely flat). Possibly there was a bigger mental health improvement in the 1970s/1980s. More likely these figures measure presenting or treatment rather than pure prevalence, so hard to conclude much.
This article is about the little-noticed fact that happiness has been climbing in the UK for 20 years (despite endless bad news), and misery has almost disappeared. And why this might be.
It also outlines measuring happiness and using it to guide policies, as governments are starting to do (and arguably so too should Effective Altruism).
All comments very welcome, particularly from experts in the field.


Hmm, I just went to OurWorldInData and looked at their info.
They're each slightly different but it seems useful to look at as many data sources as possible.
Thanks, very useful. The World Happiness Report data (from Gallup World Poll; I'd seen the figures before but couldn't find more info) does show a rise of about 0.25/10 over the period - about one-third of the rise in the other ONS and Eurobarometer results (when Eurobarometer converted to a score out of 10).
I suspect the difference is in the wording of the question, which defines 0 as 'the worst possible life for you' and 10 as 'the best possible life for you' and asks where they are now. (It doesn't mention the word 'satisfaction'). Whereas the ONS question is 'Overall, how satisfied are you with your life nowadays?' where 0 = not at all satisfied and 10 = completely satisfied (Eurobarometer has similar wording AFAIK). They're rather different, and personally I find the 'life for you' wording (which I've come across before) a bit confusing, as does 10 mean 'doing as well as I could given my abilities & circumstances' or 'having the best life I can imagine (with no restriction)'?
[ADDED] To put it another way, the Gallup question seems to be asking people to compare with some unclear external scale of what's possible for their life (in the real world? in a fantasy world in which they could be a rock star or Bill Gates?), rather than how satisfied they feel about their life (a more internal scale of feelings). If they're comparing where they actually are with what might be possible in a fantasy world, it's not so surprising it doesn't go up much, because reality rarely approaches fantasy.
Without deciding which survey has a 'better wording', if any of them shows a substantial effect then it suggests something is going on in whatever that question is measuring.
There is a lot of happiness data available, including from the ONS, but there is a tendency now to prefer life satisfaction because it's more stable (happiness varies with the weather and day of the week) and more all-encompassing. So I didn't look into it. Though the ONS happiness data show the same trend over time as satisfaction.
(On a lesser point, I don't know how large the Gallup poll is but I imagine, like Eurobarometer, it's a few thousand people per country. The ONS is over 150,000 so very reliable. That said, aggregating multiple years removes the sample size problem.)
I also thought the World Happiness Survey looked flat but it has gone up. 0.25/10 is not be sniffed at.
WHS has a much smaller sample size - around 1,000 per year - whereas the Office of National Statistics asks around 300,000 people a year. ONS data also shows a rise of about 0.3/10 between 2011 and 2019 (https://www.ons.gov.uk/peoplepopulationandcommunity/wellbeing/datasets/headlineestimatesofpersonalwellbeing)
For comparison, when converted to a 0-10 scale, the Eurobarometer survey shows a rise by 0.7/10 between 1999 and 2019.
Also just came across this claim in this paper:
Couldn't quickly chase down source data up through 2016--best I could find was this through 2008.
Belatedly - thanks. I'm not sure what to make of this. That survey is quite large (30-50,000 people p.a.), so much larger than Eurobarometer, though smaller than ONS (around 150,000). Eurobarometer shows a large rise 1996-2016 (7.19 to 7.74/10), and the later-starting ONS shows a smallish but non-negligible rise 2012-2016 (7.45 to 7.67/10). Possibly again the question wording might have an influence.
But 5.2 to 5.3 is a rise, even if (statistically?) insignificant. It's unfortunate that the paper cites other surveys (in other countries) which confirm its claim of no effect, but doesn't cite these other UK surveys which suggest the opposite.
Since the ONS survey is much the largest, and also kind of confirmed by its findings on happiness (i.e. positive emotions), perhaps the reality is that there has indeed been a substantial rise since 2012, but only a small rise, or perhaps none, before that.