Usually we use purchase-parity adjustments when we look at the value of money, so there might be a subtle circular reasoning problem here. One issue for example is that there is no value in innovation (say, by designing a cheaper transportation service/product, people could end up paying less for the service so the revenue may decrease [while the profits could get higher]).
Another issue is that I don't think this could take into account counterfactual impact.
Didn't read through the whole thing yet, sorry if I missed how you addressed this issues! I love the idea of trying to find simpler ways of estimating impact!
Hm, not sure. If there is an opportunity for innovation, I'd expect either the incumbent to pursue this to expand the addressable market (and thereby make more revenue / have more impact) or/and a competitor to innvoate, thereby reducing the price and capturing market share / prevent the incumbent from increasing profits (and increasing revenue / imapct for the competitor).
On second reading I assume you are referring to the issue that when a product gets cheaper through innvoation it might look like the product would be less impactful because it now gets less share of the total WELLBYs of the customer. I guess, though, what would happen at the same time is that overall life satisfaction of the customer will go slightly up as they now have more disposable income (just saved some money from spending less on that product), and that increased life satisfaction would be distributed across all purchases, including the one that just got cheaper. On a micro level those won't perfectly balance of course but on the coarsness level of this analysis I think we'd be fine - see the section on first dollar vs last dollar spent in Appendix 1.
But I'm not an economist or anything like that by training so very curious about your further thoughts! I very likely missed things.
I addressed the counterfactual impact a bit in Appendix 1 in the section on absolute vs relative impact.
Thank you, this was a very interesting read! While I didn't have time to think through all of it, the idea of adjusting the impact of salaries and profits by bands that are income-adjusted seems intuitively right. If I can choose a job with the same salary in the same industry where one employer mainly sells to people with lower income while the other sells to people with higher income, I should have a higher WELLBY impact at first.
As a side anecdote: When I was selling the consumer product of my company at a market stand, the customers who told me they had been saving up for their $100 purchase seemed much more excited about the product and seemed to be more loyal fans. Given that they were spending a larger share of their income on the product, it seems reasonable to assume that they valued the product more on average and attributed a larger WELLBY share to it.
Thanks for taking the time to share this great anecdote. Exactly what this framework would predict. If any more thoughts come up as you think through it, I'd be curious!
I think one thing that you gloss over a little bit is this chain of reasoning:
GiveDirectly demonstrate that extremely poor people generally spend new money responsibly
For the extreme poor, we can use this to measure purchasing choices as roughly contributing to life satisfaction
Elon Musk, who relies heavily on government subsidies to turn profits & who exclusively sells to wealthy nations, could be the most impactful person alive in WELLBY terms
Specifically, you might be extrapolating a relationship that apparently holds in poor countries to too wide of a net. I think there is good intuition behind this; people that are barely surviving are going to be far less prone to wasting a significant proportion of their income on speculative life satisfaction improvements. Whereas if you or I buy a Tesla I doubt it will have any impact on our life satisfaction at all (and not merely just a logarithmic one); similarly, if we developed a gambling addiction I’m sure that relationship would be negative.
It would be my intuition that the relationship between expenditure and life satisfaction doesn’t decay because it’s logarithmic, but because the relationship itself breaks down at higher and higher incomes.
(A smaller intuition that I have less of a clear reason for: It feels icky that a capitalist can double-dip by having a positive impact and making a monetary ROI. I suspect this hinges much more on what ideological ideas you’re bringing to the table; at the very least we can say that your method works in non-profit organisations)
I really like your accounting method, though, and I think it survives without most of the axioms you laid out. For instance, given that buying X product produces Y value, we have an exciting new method for accounting how to subdivide Y among its contributors! Then we can debate how to model Y, and for what business models this accounting method holds.
Thanks for that! And for making the ideological ickyness visible. I think a lot of people, me included, feel like this. And thanks also for acknowledging the accounting part of the framework. It does rely on a similar relationship though that money spent represents value delivered. So we would have to assume that companies are more rational in their spending choices.
If I understand you correctly, you are questioning three things 1) That there is a marginal relationship between income and life satisfaction at high incomes 2) If there were a relationship, that consumption is a good predictor of contribution to life satisfaction 3) That Elon Musk could be the most impactful person alive
2) If we accept 1), then it's very likely that your spending will be predictive of your life satisfaction. I share your intuition that spending becomes more volatile and impulsive, but if we consider similar amounts on a percentage level, and thereby a similar level of contribution to the WELLBY measure, I think it's fair to assume that somebody who earns $100k will be as diligent about spending $1k as a person earning $1k will be about spending $10.
3) You make the point that Elon relies on government spending. I think this is a valid one because that is far far away from actual consumer life satisfaction and the influence of each citizen and the effect on them is only very very indirect. So maybe the government just spent the money badly (I'd argue though that it's much better spent than on NASA). If, however, he would not rely on these and make most of his money directly from consumers, I think accepting 2) would have to lead us to accept 3) unless he were in some industry that tricks our consumer choices, like the addictions you mentioned, I think he doesn't.
Sorry, to be clear, I was contesting that you can leap from (1) and (2), which I generally agree with, to (3). And to make that point, I was proposing that at higher income levels, the relationship from (1) and (2) may not (and in my opinion, does not) hold.
I did some more research & thought about your points. Although my own experience doesn’t suggest any relationship between conspicuous consumption and life satisfaction (arguably, for me, a negative one), a handful of low-citation papers (example) seem to suggest the relationship might be causal and not merely correlative (I agree it is clearly correlative). So I agree, in principle, it is probably true that in a clear-cut case such as Jeff Bezos (providing goods and services directly to customers in exchange for money where no counterfactual service likely would’ve appeared on a similar time frame), his work might have an immense impact on life satisfaction. (I tend to agree with your point (3) on if Elon switched to a more clearly-attributable business model).
I do have to wonder, though, if conspicuous consumption is fungible in a way that survival goods (food, medical, etc.) are not. I can’t shake the intuition that everyone would be just as happy if Amazon never existed; that when all of your peers have bought iPhones it becomes a table-stakes purchase and you have to get the iPhone Pro to stand out. I will think some more.
Thanks so much for steelmanning my argument and looking for some research yourself! And I share your intuition that some consumption seems zero-sum around status. I do think though that my smartphone is giving me tons of value but that's a different discussion probably haha
A simple and generic framework for impact estimation and attribution — EA Forum
A simple and generic framework for impact estimation and attribution
Building on the logarithmic relationship between income and life satisfaction, we model the purchase of goods as an exchange of money for life satisfaction.
Under that lens, a company’s impact on the life satisfaction of its customers is the income-weighted sum of the company's revenue.
By comparing the company’s revenue with its cost structure, we can attribute the relative share of impact to the company’s employees, suppliers, and shareholders.
While this approach primarily focuses on for-profit companies, it can be extended to NGOs by reframing them as companies selling attribution of their primary impact for donations.
In this framework, an NGO’s impact is then twofold: It’s primary impact, sold and attributed to the donor, and it’s secondary impact on the life satisfaction of the donor, attributed to the employees and other cost drivers.
This approach is not a substitute for measuring any impact beyond life satisfaction of consumers. It cannot replace studies on the primary impact of NGOs or impact on factors beyond life satisfaction, like the environment.
You can use this framework to compare the impact of companies when deciding between jobs, to compare the impact of donations to the impact from a job, or use it as a guide on how to attribute the impact of a for-profit or NGO to it's customers, employees and suppliers.
The corresponding spreadsheet can be used to apply this framework to any company using commonly available data.
Idea: Using money as a proxy for impact
Impact estimation is a dark art: Complex spreadsheets with high sensitivity to parameters, convoluted theories of change, cherry-picked KPIs that can’t be compared between two organizations, triple-counting of the same impact for multiple stakeholders, missing studies to back up assumptions. I am working for a social enterprise and in the five years I’ve been here I tried to estimate impact a couple of times and always gave up frustrated.
In this article I am trying to turn impact estimation around: Instead of trying to estimate impact from detailed bottom-up models, I will take a top-down approach and work with one measure that works for almost anything: money. At its heart, money represents value delivered and I want to see how far we can take this to estimate impact.
I will guide you through this in three steps that you can also follow and adjust in this spreadsheet: We will start with estimating the impact of a donation to GiveDirectly. From this we will derive income-weighted revenue as a proxy measure for impact. With this we can then estimate the impact of a market stand as a simple example and then generalize to any organization[1], any job, and the impact of shareholders. Finally we’ll try to apply this approach to a few examples, look at the extremes, and see how everything holds up.
The impact of a cash transfer
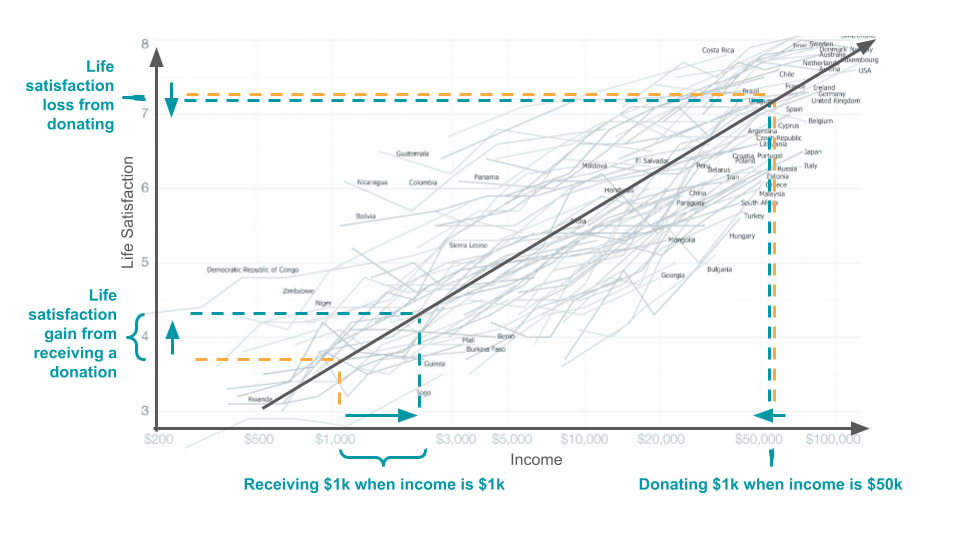
Let’s start with estimating the impact of a donation to GiveDirectly. Most readers are probably familiar with the relation between income and life satisfaction: Life satisfaction is highly correlated to the logarithm of income - at low income levels life satisfaction grows fast with income while at high income levels extra income will have almost no effect on life satisfaction. This holds both when compared between countries and for different income levels within countries. As an illustration, see the gray country-lines in the background of Figure 1 and Our World In Data for more details on this.
Figure 1: The impact of a cash transfer The life satisfaction loss when donating money at a high income is much smaller than the life satisfaction gain of receiving that money at a low income. At this scale, the loss (right/top orange to cyan) is barely readable in the diagram while the gain (left/bottom orange to cyan) is significant. Note that income is on a logarithmic scale. Background image: Our World In Data
We can use this relationship to estimate the impact of donating to GiveDirectly: Let’s say we are looking at a pool of donors whose average yearly income is $50k. That would mean they have, on average, a life satisfaction of about 6.9 Life Satisfaction Points (LSP). Then when they donate ten percent of their income in one year, they are left with $45k and a corresponding life satisfaction of 6.8 LSP for that year because on a log-scale, there is really no big difference between $45k and $50k. If, however, they donate this money to GiveDirectly we shift down on the log-scale and give $5k each at about ~90% efficiency (so ~$4.5k) to a recipient community with an average yearly income of maybe $1k. Let’s assume GiveDirectly gives money in $1k batches (see Figure 1 for an illustration of the effect of one $1k batch), then the life satisfaction gained for these $1k batches for that year in that community is the difference between life satisfaction at $2k and $1k, so 4.3 LSP - 3.7 LSP = 0.6 LSP. So the net impact of the donor pool’s donation is ($5k * 0.9) * (0.6 LSP/y / 1k$) - 0.1 LSP/y ~ 2.5 LSP/y. While they lose on average 0.1 LSP/y, the recipient community of his donation gains on average 2.6 LSP/y per person - a pretty good trade.
What GiveDirectly effectively does is to offer an arbitrage service for life satisfaction: Life satisfaction is cheaper in low-income countries, so by moving your money there, you get more life satisfaction for the same total money spent. On top of this, the donor pool probably also receive life satisfaction simply from the act of donating. We will have a look at that later when discussing edge cases and implications.
In this section we implicitly created a measure for life satisfaction changes: Life Satisfaction Points per Year or LSP/y. This measure has already been established by the World Happiness Report as WELLBY (Well Being Year) can be defined as “a one-point change in life satisfaction on a 0-10 scale, per person per year.” We will use WELLBY from here onwards.
Note that the WELLBY framework has already been used in a detailed study on cash transfers which has shown that a $1k lump-sum cash transfer to low- and middle income countries leads to a WELLBY (or LSP/y) of around 1.1, so even more optimistic than our 0.6. This might be because one-off bumps in income might have outsized effects compared to living steady on a higher income.
Money spent given an income level as a proxy for impact delivered
Just giving $1k to somebody who so far had a $1k income doesn’t automatically increase their life satisfaction, though. Life satisfaction increases because this money represents things and services they can buy with it. How exactly do the two relate? Let’s assume that the $1k will be spent on school fees, food, clothes, data bundles, and some alcohol. We have no way of knowing how these contribute to the donation recipient’s life satisfaction. Maybe the alcohol is needed for a family celebration, maybe the food is unhealthy, maybe the data bundles are needed to search for jobs. The great thing is that we don’t need to know: GiveDirectly has demonstrated that people in general make responsible choices with their money, given the situation they are in.
If we generalize this and assume that the money spent, on average, represents the value to the person making the purchase, then we can assume that the person’s life satisfaction can be attributed to the spending of their income. So in the example of somebody who has $1k of yearly income and an average life satisfaction of 3, we can assume that, on average, each dollar spent leads to a life satisfaction increase of 0.003 WELLBY.
We can then turn this around and look at it from the company’s perspective: A company makes a lot of individual sales and if we assume that each sale corresponds to a life satisfaction increase of the customer, then the sum of all their sales (revenue), weighted by the income their customers, should be their total impact. So while donations can on some level be seen as a “trade” in potential life satisfaction, the impact for the life satisfaction itself should be attributed to whoever realizes this potential by selling goods and services that are consumed.
If you, like most people first reading this, feel like we took a lot of leaps of faith in the last two paragraphs, see Appendix 1 where I go into common concerns from previous discussions on this concept, for example market failures, public goods and first vs last dollar spent. If you first want to form more intuitions on this, let’s look at how this plays out in the example of buying a fish at a market stand:
Example: The impact from buying a fish at a market stand
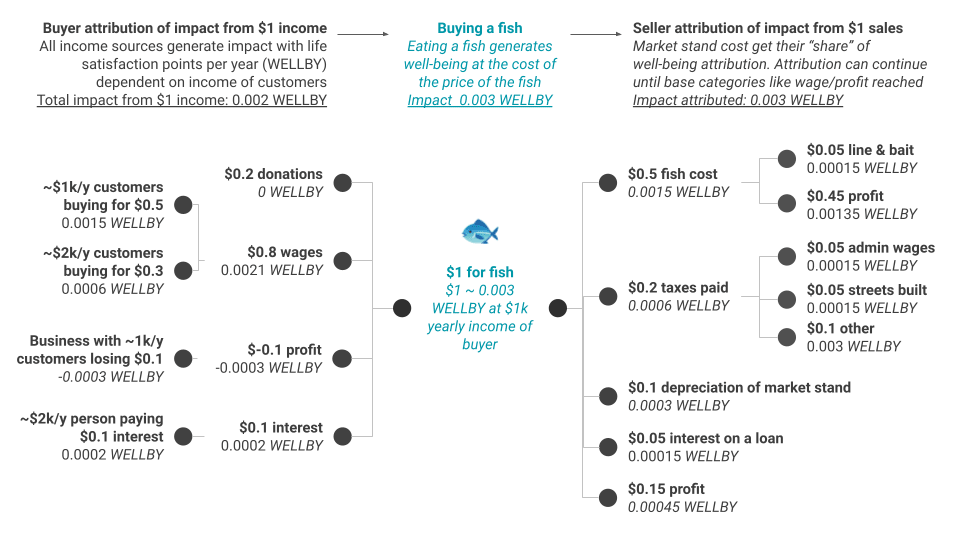
By using money spent as a proxy for impact, we can calculate the impact of any company just by looking at their revenue and the income level of their customers. Let’s start with the example of a fish market stand (see Figure 2): By selling a fish for $1 to somebody who lives on $1k/y, we can approximate the impact in terms of life satisfaction changes for one person for one year (WELLBY) of that fish as $1/$1000 times the average life satisfaction points (LSP) of somebody with $1k/y: 3 LSP. The impact of eating that fish should therefore be on average 0.003 WELLBY. The person buying that fish should, on a yearly population average, be 0.003 WELLBY more satisfied after eating that fish. Note that while this example is set on an individual level for the purpose of visualization, the calculations will only start approximating the average values for larger sample sizes.
Figure 2: The impact of buying a fish at a market stand. Bold text is value in $, light text is value in WELLBY. When somebody with an average income of $1k/y buys a fish (center), we can assign the proportional WELLBYs to everything that contributed to that sale (right). Note that the impact from eating the fish ($1 * 3 WELLBY/$1000 = 0.003 WELLBY) is not the same as the impact generated from the buyer’s income streams (left) as those incomes could have come from higher-income consumers, or from donations, or simply from a badly managed business.
We can now take these 0.003 WELLBY generated from eating the fish and attribute them to all contributors of the fish sale - some go to the fisher who actually got the fish (who in turn needed to buy some line & bait), some go to the government because we need to pay taxes on the sale, some might go to the market stand investment, and hopefully at the end there will be some profit from the sale, which represents impact generated by the owner of the stand. So while the stand owner sold the fish, they can only claim $0.15 or 0.00045 WELLBY worth of impact in the example of the figure, because that’s their profit.
Note that the impact generated from eating this fish is not the same as the impact that the buyer of the fish generated with the dollar they used to buy the fish. In the example in Figure 2, the total WELLBY attributed to the buyer from the work that earned them the 1$ is 0.002 WELLBY while the total WELLBY attributed to others from their consumption of the fish is 0.003 WELLBY. The impact they had generated with that dollar depends on how they earned that dollar - maybe by working for a company that sold services to wealthier customers, therefore generating less life satisfaction, or maybe they received it as a donation, or maybe they actually had some negative impact from a loss-making business they own.
To get the total impact of running the market stand for the owner, we can make some assumptions: Let’s say they sell $25 in fish per day, resulting in $3.75 in profit, representing 0.011 WELLBY, then over the course of a year the stand owner generates around 4 WELLBY - similar to the life satisfaction of one person living on $1k.
Estimating an organization’s impact from their revenue streams
In the following section I will refer to some concepts from finance. If you need a refresher, check Appendix 2. The great thing is that we can re-use a lot of long-established concepts and readily available data from finance because they had a long interest in measuring the revenue (~ value delivered) of companies. As before, check the spreadsheet to follow along.
Current impact of an organization and impact of a job or supplier
To generalize from the market stand to any organization, we simply group the organization’s customers in customer segments and calculate the “impact per dollar spent” for that segment given their average income and corresponding average life satisfaction. By multiplying that number with the revenue in that segment that year, we get the total impact delivered in that year.
Against this we have the total cost to generate that impact: The sum of wages, supplier costs, etc. (operating expenditure), depreciation and amortization (to account for the effect of previous investments the company made to achieve this year’s impact), and any other costs (e.g., loan interest). Finally, we have the profit (revenue minus cost) for that year. We can now split the impact across all these points to attribute their proportional part of the impact.
For most people, the impact of their job is probably most interesting. For this, as for any other cost, we simply take the cost of your job to the company ($50k in the spreadsheet example) and multiply this with the average impact per dollar spent given the revenue stream mix (0.000323 WELLBY/$ in the spreadsheet example) and arrive at the impact attributable to your job (16 WELLBY - more than five times the WELLBY that hypothetical person gets from donating 10% of their income - partly because the hypothetical company is active in low-income segments).
Note that we’re applying a similar efficient market hypothesis here: We assume that your salary should roughly reflect the value you add to the company. However, many companies have fixed salary bands that are supposed to capture the average while often individuals outperform colleagues by a factor of 2 or 3. So when trying this excel on your own job, just adjust the fudge factor as you believe is right. Just keep in mind that if you fudge it up, somebody else has to fudge theirs down to keep the total impact the same. If you can’t think of a person who should fudge theirs down, then you probably shouldn’t fudge your’s up.
Note that some costs, including your job, might be amortized or depreciated over time to reflect their impact over multiple years, which would make this calculation more complex. However, if we assume that revenue segments don’t change significantly over these years (typically 3-5 years), we can skip this and just multiply your cost with the impact per dollar metric. I made this assumption in the spreadsheet to keep things simple.
Apart from the impact of your job, the second most interesting personal impact lever is probably impact from shares. For shareholder impact in a given year, we can take their fractional ownership of the organization to distribute the impact from profits or losses. In the example in the spreadsheet, the startup is still loss-making, so we go from 16 WELLBY to only 14 WELLBY impact that year.
Future impact of an organization and impact of shareholders
So far, we estimated the impact of an organization in a given year. However, for anybody holding shares in a company, the future impact/revenue is often what is more interesting as that could be much larger.
To get the future impact, we start with estimating the future revenue splits from different income segments in line with the organization’s strategy. Having done that, all we have to do is to take the company value (from valuations or stock market information, see Appendix 2), spread it over the income segments, and calculate the resulting impact. One way to think of company value is that it represents discounted future profits - in our case these represent discounted future impact.
To then get the value from shares in the company, we just take the fraction of shares times the calculated future impact. In the spreadsheet example, that ends at 15 WELLBY from $50k of shares at a valuation of $20M and a revenue split that moved to Europe from Africa.
Edge cases and implications
You learn most about a model by trying to break it. I discovered a few interesting edge cases while working on this:
As an employee, your impact is bound by your salary
In this model, the impact of an employee is their salary times the life satisfaction per dollar of the income segment they are working for. If the revenue or impact generated is higher, it is assigned to the shareholder as part of their profits, if it is lower, it is assigned to the shareholder as part of their losses. Therefore the maximal impact an employee can have is limited by the minimal revenue segment one can work for - let’s assume that is $1k/y income with WELLBY/$ of 0.003. At $100k/y income, that means a maximal impact of 300 WELLBY - about as much as the Life Satisfaction for a year of 75 people living on $1k or 37 people living on $100k. That’s pretty high, but it’s also pretty difficult to find a job that makes a lot of money with a lot of poor people at scale.
Compare this to the upper bound of working for a company whose main revenue comes from people living on $100k/y. WELLBY/$ is about 8 WELLBY/$100k = 0.00008. At $100k/y income we're then back at 8 WELLBY impact from the job. A factor of almost 40x vs the 300 WELLBY from the similarly paid job for the $1k/y income population.
Safaricom is the most impactful company in Kenya
Speaking of making a lot of money with a lot of poor people at scale: Safaricom, the TelCo and mobile money provider of Kenya, is doing exactly that and is therefore arguably the most impactful company of Kenya. They made more than $1.5B in revenue last year. At 5% profits and an assumed average income of $5k with 0.0009 WELLBY per dollar, that would result in about 70k WELLBY in “impact profits” for shareholders last year. If we had more data on revenue with each income segment, we could do more precise estimates. This outcome of the model also matches public perception - their mobile money product has been frequently pointed to as one of the most impactful things happening to the population in the last decades.
Does this make Elon Musk the most impactful person alive?
Elon Musk’s net worth is somewhere around $180B. He is competing for the title of the richest person with the luxury goods entrepreneur Bernard Arnault and Amazon’s Jeff Bezos. Elon’s wealth primarily comes from his shares in SpaceX (including Starlink) and Tesla, with some wealth also from his shares in The Boring Company, Twitter/X, Neuralink and x.ai. He also co-founded PayPal and OpenAI.
In this framework, we would estimate Elon’s impact by taking his wealth per company, then splitting the company’s revenue by income segment, and proportionally attributing impact. To keep things simple, let’s just assume here that most people consuming Elon’s products, directly or indirectly, are middle-to-upper-class Western people, with an average income of $50k/y. This is probably lower than the average consumer of Bernard Arnault’s products (mainly LVMH luxury goods like Louis Vuitton handbags) but higher than the average customer of Jeff Bezos - as both Amazon and AWS services are used by a much broader population than Tesla drivers, Starlink users, and other people benefiting from SpaceX. An income of $50k/y would roughly translate to a life satisfaction of 7, so 0.00014 WELLBY/$.
$180B * 0.00014 WELLBY/$ would give us about 25M WELLBY. What is that? If we divide by 7 to conservatively approximate an average European life-year, we get 3.5M - about the size of Berlin. So the wealth of Elon is approximately the impact of the full life satisfaction of Berlin for a year.
Does this make him the most impactful person alive? Not really, because we are only looking at the impact on life satisfaction here, not on climate or our survival as a species, to name just two other causes. While he claims that his work also supports these causes, much more detailed analyses would be necessary to establish this. And even if we were only concerned about impact on life satisfaction, there could be somebody much further down on the Forbes list who makes most of their money with lower-income customers. Finally, we didn’t adjust for any negative impact that Musk’s companies might have on public goods or other market failures that aren’t factored into the price of his products. I don’t want to make the call on this here but looking at the industries of other Forbes billionaires, it seems to me he comes out better than most from that perspective.
Shareholders can have negative impact
In this model, profit represents the impact going to the shareholders of the company. For profitable companies this seems intuitive - after all suppliers and employees got their share of the impact proportional to their cost, the extra value created should go to the owner of the business.
What’s a bit less intuitive is that in the case that you don’t make a profit but a loss, you have a negative impact as a shareholder. More importantly, your negative impact is higher if you run a business in a low-income market than in a high-income market, just as your impact profit would’ve also been higher in a low-income market, even if you had the same revenue and cost in money terms. I think this makes sense: You are promising high impact to employees and suppliers so if you can’t hold these promises you should also be held accountable for them. As an entrepreneur or investor you take the risk - that can be both positive and negative.
See Appendix 2 for a more detailed discussion on negative impact.
This model can guide impact attribution of NGOs
In simple terms, an NGO is a company that can’t pay profits to shareholders but instead re-invests them in the company. In that frame, a donation is revenue and the goods sold are their "primariy impact" - lobbying efforts (policy NGOs), money transfers (GiveDirectly), immunization campaigns, etc.
In our framework, this implies that the impact we are measuring is the effect on life satisfaction of the donor as they are buying the NGO's products. The more the donor donates, the more it should have a positive effect on their life satisfaction[2]. While this sounds counterintuitive, it fits at least some of the data - for a long time donors were not really interested in measuring the impact of their donations but rather in donating for causes they were personally attached to, were donating for status reasons etc.
We can reconcile this with modern impact measuring though: The “market” for donations simply changed in the last years, valuing the primary impact more so that donors now get more life satisfaction from knowing that they donated to causes that actually have very large primary impact. If the donation market keeps developing like this, then particularly impactful NGOs should be able to raise “prices”, raise salary of staff to attract talent and incentivise high performance. At the same time demand for good, bottom-up impact models of NGOs should rise as those can be used to command more donations.
The donor can then claim the primary impact, because they paid for it, and the NGO and its employees can claim the secondary impact -the increase in life satisfaction of the donor. The consultants doing the donation impact estimation study can also claim part of the secondary impact based on the fees they charge for the study.
Let’s apply this to GiveDirectly again - simply because their business model is so simple and easy to understand. What happens when they “sell” impact for a transaction fee? For every $1k donated, you get ~$0.9k donated (primary impact attributed to the donor calculated above) and they get $0.1k in gross margin, which they would use to pay, and assign secondary impact to, employees and suppliers. Let’s assume most of GiveDirectly’s donors are fairly affluent with $50k/y, so 0.00014 WELLBY/$. If you work at GiveDirectly as a Software Developer earning $100k, you would have an impact of 14 WELLBY - more than their own life satisfaction at around 8 (on average) because we assumed the average donor earns less than the software developer.
Summary: Theory of change
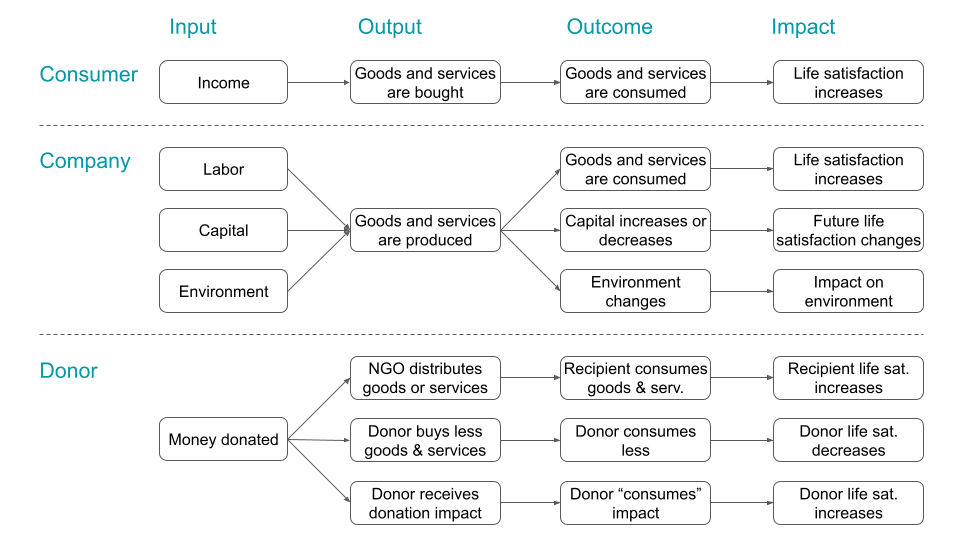
NGOs often model impact with theories of change. The advantage of these is that it makes it very clear how causal links are supposed to run - the disadvantage is that they often get very complex and are difficult to compare between organizations. To summarize the model discussions so far, I am proposing a very simple theory of change: Impact on life satisfaction comes from consuming goods and services, and this allows using money as a proxy KPI.
Figure 3: Theory of change. Consumer (top): Life satisfaction results from consumption of goods & services. Company (middle): Life satisfaction increases (impact) are due to consumption of goods and services (outcome) which result from work, capital, and environment together producing these with secondary outcomes on capital and environment. “Environment” refers to any external factors beyond Labor and Capital, which can include nature, society, and other factors. Donor (bottom): While donations lead to life satisfaction decreases for the donor due to less consumption as described in the section on GiveDirectly, it also leads to a donor life satisfaction increase from the act of donating, which can be attributed to NGOs as explored in the section on edge cases.
Conclusion
This is a simple and generic approach to impact measurement and attribution
We started the article saying that impact estimation usually suffers from complex theories of change, cherry-picked KPIs that can’t be compared across organizations, assigning the same impact to more than one actor and missing studies to back it up.
I hope that with this approach I was able to convince you that by framing impact as income-weighted revenue, converted to Well Being Years (WELLBY), we can solve all of these: The calculation fits in a single spreadsheet, the theory of change is straightforward, we have one KPI that would be the same for all organizations, we avoid the double-counting because money can only be spent once and there are plenty of studies to back up the income-life-satisfaction relationship. The only numbers needed can all be found on a company's income statement and balance sheet, except for revenue splits by income segment, but those can be easily estimated.
It might be less fine-grained than a detailed bottom-up analysis, but I think the benefits largely outweigh the lost granularity, at least for the 99% of organizations that don’t sell impact as a product but still want to estimate their impact. For the 1% of organizations who actually sell impact as a product (like GiveDirectly and most NGOs), their impact on the life satisfaction of their customers/donors is different from their primary impact-product they have, which of course needs more detailed measurement and justification to help their customers choose.
Please give this a try
Still skeptical? Already convinced? Either way, I’d love it if you could just make a copy of the spreadsheet, try to estimate your job or a job you’re interested in, and just send me the results. I’d be curious to see how this holds up in reality. I’m guessing that max 1-2 people will actually do this, so if you are thinking about it, please do it - it’ll take 10 minutes. I’ll update in the comments on the outcomes.
Appendix
Appendix 1: Previously raised concerns on the relationship between revenue and impact
Before we dive in: I am not arguing that there is a perfect relationship between the two. I also would’ve never thought that I would write an article proposing free-market neoliberal reasoning to estimate social impact. But it turns out that money exists for a reason, and that is to have an easy way to compare value delivered between very different goods and services. That’s exactly what we’re looking for when trying to estimate impact. Nevertheless, I of course had concerns and came accross them again and again while discussing this with others so let me share my thoughts on them.
Market failures and public goods
The most common criticism of this approach is that companies do a lot of harm by exploiting public goods, building monopolies, evading tax, being corrupt, tricking customers into addictions or other forms of dependencies on the company, neglecting long-term effects of their products, and other unethical behaviors. This is barely accounted for in the company's revenue because most customers don’t or cannot take these factors into account when making purchasing decisions. I fully acknowledge these and added a “fudge factor” to the model to manually adjust the impact delivered. If you estimate the impact of a multinational, you probably want to apply some fudge factor as they are usually able to drive down prices with monopoly powers, lobbying, and other things that go against free market assumptions.
Estimating this fudge factor is of course a whole other discussion but when using this framework to get a rough comparison between different options, and not for getting a final precise absolute value on imapct, I think this is good enough as a first step.
What if the price doesn’t reflect its impact?
Assuming we have accounted for market failures, what would happen if the price of a good didn’t represent its value to the buyer, for example because it is much more expensive or much cheaper than the value it represents? In those cases, consumers would either stop buying the item and go for a cheaper substitute, or buy so much that eventually production can’t keep up and prices increase. What if there is no cheaper substitute? For example a piece of bread costs ten times as much because there is a food shortage? Then in that case I’d argue it all of a sudden represents a higher value and impact on life satisfaction than before because of the shortage. What about things that are just very expensive to produce but have not a high effect on life satisfaction? Then nobody will buy them - people close to poverty usually don’t buy a jacuzzi.
First dollar vs last dollar spent
One could assume that the “first dollar” spent, maybe on water, doesn’t give the same life satisfaction as the last dollar 1000 spent, maybe on school fees. After all, there exists the log-relationship between income and life satisfaction. Interestingly, for all practical purposes we don’t see this happening. People spend in general 30% of their income on housing, not an absolute amount on for example a very small wooden hut and then the rest on other categories. The same applies to most other categories (see e.g. US and Kenya). Only the percentage spent on food goes down a bit, and even there people don’t “layer” by buying the cheapest rice and then add other things but just “spend more” on food as their income increases. So while in principle some parts of the spending should give more life satisfaction than other parts, in practice we see spending increasing on all categories simultaneously while income increases, suggesting that we can assume a “similar enough” relationship between each dollar spent and life satisfaction received, given a yearly income.
Absolute vs relative impact
Finally, one might suggest that we should look at marginal impact instead of absolute impact here. For example we shouldn’t take the full price of a service as its impact but only some relative measure of how much better it is vs the next best service. I decided against this for a few reasons: First, it is intractable as it doesn’t stop at the next best service but of course that next service should only get the marginal impact vs the one following that one etc. Second, price difference wouldn’t be the only factor influencing impact but also quality, proximity, and a lot of other measures, which are automatically included when we “just” look at a purchase because they all went into the purchasing decision. Last, we also don’t pay some money to the next best product when buying the best product - it seems like an absurd idea. Value was delivered by the person whom the service was bought from, not by the next-best person.
Self-reported life satisfaction is an ordinal scale
In this article we implicitly convert an ordinal measure (self-reported life satisfaction score on a scale from 1-10) to an interval scale. What does this mean? Each number on the ordinal scale represents a category that is higher or lower than the others, but the intervals between the numbers might not represent equal increments of satisfaction. For instance, the difference in life satisfaction between a score of 2 and 3 might not be the same as the difference between 8 and 9. However when starting to add them up and taking increments we implicitly assume that they are the same. I don’t have a better answer than ChatGPT here:
Despite these limitations, researchers often treat such scales as quasi-interval scales for practical purposes, especially in large-scale surveys and studies. This approach allows for the use of parametric statistical methods that can provide more nuanced insights into the data, under the assumption that with large sample sizes, individual differences in scale interpretation might average out.
Because we work with money here, we can borrow a lot of existing data and concepts from finance. Let’s start with the basics: The income statement displays a company's performance during a given year and the balance sheet which keeps track since the company’s founding. A third common concept, the cash flow statement, shows how cash flows operationally, for example how the income statement eventually flows into the balance sheet, but is less relevant here. Most importantly, all these statements are available for any company by law, so are easy to work with.
Income Statement (Profit & Loss)
In its most basic form, the income statement subtracts all costs from all revenue to arrive at the net gains. From an impact perspective, we interpret this as follows: The total revenue is simply the total impact created, by multiplying the revenue (segments) with the WELLBY/$ of that revenue segment. The costs and the net gains can guide us in how to assign that impact. The most common items probably are: Salaries (how much impact goes to you as an employee), procurement (how much impact goes to suppliers), interest payments (how much of the impact should go to the bank), depreciation and amortization (how much of the impact should be assigned to previous investments), taxes (how much of the impact is based on support from government infrastructure etc), and net gains (how much of the impact goes to the shareholders of the company).
Negative Impact
Note that by using the cost and net gains to assign the impact to its contributors, we can get the case that net gains are negative, so the shareholders actually have a negative impact. Let’s take the example that we made $100 in revenue with an impact factor of 0.001 WELLBY/$ for a total 0.1 impact but had $1000 in cost for one employee. Net gains are then $-900. The employee should then be assigned $1000 * 0.001 WELLBY/$ = 1 WELLBY impact and the shareholders $-900 * 0.001 WELLBY/$ = -0.9 WELLBY.
How to interpret this? Basically, the shareholders “promised” to the employee impact in the form of the salary the employer is paying. Money represents a promise of value, so by giving an employee money, the employer transfers a promise of value generated to the employee. However, not enough value is generated (revenue) to balance that promise, so the employer needs to find other ways to balance that promise - either with value he has generated for others (company savings) or other people’s generated value (loans / investments).
This can of course be a very rational choice for the shareholders. They might accept negative impact today from investing in development of a product that initially doesn’t generate a lot of revenue/impact in the hopes of eventually becoming profitable and “paying off” the initial negative impact with more positive impact in the future. This should be reflected in the company value.
Note that if you feel this doesn’t make sense and the employee should simply get less impact assigned, then in the reverse case that the company makes more money than the employee cost, the employee also needs to be assigned the extra impact, always leaving shareholders without any impact, which would result in nobody taking the risk to start a company or invest in one and the system breaking down.
Balance sheet
Next to the income statement, we also have the balance sheet. The balance sheet represents what the company owns and owes by balancing three things: Assets - Liabilities = Book Value. I don’t use much of the balance sheet in the spreadsheet model but it’s still interesting to look at two examples: Non-current assets are assets that are useful to the company in the future and are valued at cost less accumulated depreciation and amortization. Examples could be equipment bought or software developed. They can be used to calculate the amount of future impact that needs to be assigned to investments. A piece of them flows every year into the income statement through depreciation and amortization. The second concept is Book Value. This is what remains after subtracting assets from liabilities and is roughly the value of what the company would generate if everything would be sold off and all debts paid. This is useful in calculating the “base” impact stored in a company and for valuing a company.
Valuations
Finally, we can use the concept of valuations of companies to determine their expected future impact. A valuation should roughly represent the Book Value (see balance sheet) plus expected discounted future profit of a company. Smaller companies get valued when they are sold, the value of publicly traded companies is simply the number of shares * share price (market capitalization). Getting the value of a company that isn’t publicly traded is always a best guess but one “easy” way is to take a group of recently valued companies (because sold or publicly traded), calculate some multiples like revenue/value or profit/value, try to find patterns, calculate the same for your company and do some adjustments. Sounds inaccurate but this is how it is often done. Another approach would be to build bottom-up models of expected future revenue and discount these to a net present value.
Both ways of valuating a company are difficult, time-consuming, and require lots of experience - this is why it’s great that for most companies a valuation exists and we don’t have to try to guesstimate future impact from scratch. If we assume this is somewhat accurate, then we can simply translate the value to expected discounted future impact and use that to determine the impact-value of anybody owning shares in a company.
Note that this analysis assumes that consumers can determine the value to them of the product they are buying. For organizations whose product is impact itself, like most NGOs, this framework won’t be able to measure that impact but will still help to think through attribution of impact, for example to employees.
Note that at the beginning of this article we modeled a donation to GiveDirectly as a loss of life satisfaction. That was a bit simplified to start intuitively. How we would now actually model this is that some of the donor’s potential life satisfaction is realized by “purchasing” the donation. Similar to somebody buying a fish at a market stand, thereby converting potential life satisfaction to actual life satisfaction.
This is the third in a sequence of posts taken from my recent report: Why Did Environmentalism Become Partisan?
Summary
Rising partisanship did not make environmentalism more popular or politically effective. Instead, it saw flat or falling overall public opinion, fewer major legislative achievements, and fluctuating executive actions.
Public Opinion...
I think right now EAs might be making a significant mistake by paying insufficient attention to the political realm. As EAs we tend to figure out what’s most impactful for us to work on and focus hard. That’s great! But there are various actions that are ‘non-delegatable’ - the extent to which an individual can do the action is limited (like voting, going to a protest, making hard money contributions to particular campaigns). It might be useful if we were all more in the habit of doing variou...
Bentham’s Bulldog recently argued that AI won’t definitely make factory farms obsolete. I agree, but I’d go further and argue that by default AI won’t make factory farms obsolete. However, I think it’s possible (though not guaranteed) that AI could make factory farms a lot more humane.
He throws out an 80% chance of cultivated meat being developed, and a 70% chance of it displacing factory far...


Usually we use purchase-parity adjustments when we look at the value of money, so there might be a subtle circular reasoning problem here. One issue for example is that there is no value in innovation (say, by designing a cheaper transportation service/product, people could end up paying less for the service so the revenue may decrease [while the profits could get higher]).
Another issue is that I don't think this could take into account counterfactual impact.
Didn't read through the whole thing yet, sorry if I missed how you addressed this issues! I love the idea of trying to find simpler ways of estimating impact!
Hm, not sure. If there is an opportunity for innovation, I'd expect either the incumbent to pursue this to expand the addressable market (and thereby make more revenue / have more impact) or/and a competitor to innvoate, thereby reducing the price and capturing market share / prevent the incumbent from increasing profits (and increasing revenue / imapct for the competitor).
On second reading I assume you are referring to the issue that when a product gets cheaper through innvoation it might look like the product would be less impactful because it now gets less share of the total WELLBYs of the customer. I guess, though, what would happen at the same time is that overall life satisfaction of the customer will go slightly up as they now have more disposable income (just saved some money from spending less on that product), and that increased life satisfaction would be distributed across all purchases, including the one that just got cheaper. On a micro level those won't perfectly balance of course but on the coarsness level of this analysis I think we'd be fine - see the section on first dollar vs last dollar spent in Appendix 1.
But I'm not an economist or anything like that by training so very curious about your further thoughts! I very likely missed things.
I addressed the counterfactual impact a bit in Appendix 1 in the section on absolute vs relative impact.