Thank you for doing this work! I really admire the rigor of this process. I'm really curious to hear how this work is received by (1) other evaluation orgs and (2) mental health experts. Have you received any such feedback so far? Has it been easy to explain? Have you had to defend any particular aspect of it in conversations with outsiders?
I do have one piece of feedback. You have included a data visualization here that, if you'll forgive me for saying so, is trying to tell a story without seeming to care about the listener. There is simply too much going on in the viz for it to be useful.
I think a visualization can be extremely useful here in communicating various aspects of your process and its results, but cramming all of this information into a single pane makes the chart essentially unreadable; there are too many axes that the viewer needs to understand simultaneously.
I'm not sure exactly what you wanted to highlight in the visualization, but if you want to demonstrate the simple correlation between mechanical and intuitive estimates, a simple scatterplot will do, without the extra colors and shapes. On the other hand, if that extra information is substantive, it should really be in separate panes for the sake of comprehensibility. Here's a quick example with your data (direct link to a larger version here):
I don't think this is the best possible version of this chart (I'd guess it's too wide, and opinions differ as to whether all axes should start at 0), but it's an example of how you might tell multiple stories in a slightly more readable way. The linear trend is visible in each plot, it's easier to make out the screening sizes, and I've outlined the axes delineating the four quadrants of each pane in order to highlight the fact that mostly top-scoring programmes on both measures were included in Round 2.
Feel free to take this with as much salt as necessary. I'm working from my own experience, which is that communicating data has tended to take just as much work on the communication as it does on the data.
Hi Matt. Thanks for your concrete suggestions on the data visualisation. I think we made the mistake of adding more and more information without re-thinking what exactly we’re trying to show.
On how the work is being received by other evaluation orgs: I’m not too sure. I suspect other orgs will be more interested in how we do the final evaluation, rather than the preliminary filtering. Hopefully we’ll also get more feedback this weekend at EAGxVirtual (Jasper is giving a talk).
And from mental health experts: My impression from speaking to several academics is that there’s a real effort in global mental health (GMH) at the moment to show that cost-effective interventions exist (this being important to policy-makers) - see e.g. Levin & Chisholm (2016) and WHO draft menu of cost-effective interventions. We have also had quite a few senior researchers offering their support or advice. We hope that our work on cost-effectiveness of micro-interventions will be useful as part of this wider context. One person we spoke to said that a systematic review, perhaps done in collaboration with a university, would be taken more seriously by academics than our current plan. This seems very likely to be true, with the obvious downside that it would be a lot more work.
We appreciated the focus on LMICs because the treatment gap for mental health conditions is especially high in these countries (WHO Mental Health Atlas, 2017), particularly in low-resource (e.g. rural) settings.
What do you make of the argument that it's more important to go from 0 to 1 on mental health, rather than from 1 to n ?
Could imagine that mental health in developing countries will resemble mental health in developed countries more and more as a result of economic growth. Developing countries become more similar to developed countries overall, and adopt the best mental healthcare practices of developed countries as part of this.
If mental health in developed countries currently misses out on a lot of upside, it would be way more leveraged to focus on realizing that upside (0 to 1), rather than propagating current best practices (1 to n), because the best practices will propagate regardless so long as the developing world continues to develop.
I'm not sure what you mean by going from 0 to 1 vs 1 to n. Can you elaborate? I take it you mean the challenge of going from no to current best practice treatment (in developing countries) vs improving best practice (in developed countries).
I don't have a cached answer on that question, but it's an interesting one. You'd need to make quite a few more assumptions to work through it, e.g. how much better MH treatment could be than the current best practice, how easy it would be to get it there, how fast this would spread, etc. If you'd thought through some of this, I'd be interested to hear it.
See also Slate Star Codex on the weirdness of Western mental healthcare: 1, 2, 3, 4, 5
how easy it would be to get it there
Quick reply: not sure about how easy it would be to achieve the platonic ideal of mental healthcare – QRI is probably more opinionated about this.
Given how much of an improvement SSRIs and CBT were over the preexisting standard-of-care, and how much of an improvement psychedelic, ketamine, and somatic therapies seem to be over the current standard-of-care, I'd guess that we're nowhere close to hitting diminishing marginal returns.
how fast this would spread
Quick reply: if globalization continues, the best practices of the globalized society will propagate "naturally" (i.e. as a result of the incentives stakeholders face). From this perspective, we're more limited by getting the globalized best practices right than we are by distributing our current best practices.
First, all your comments on the weirdness of Western mental healthcare are probably better described as 'the weirdness of the US healthcare system' rather than anything to do with mental health specifically. Note they are mostly to do with insurance issues.
Second, I think one can always raise the question of whether it's better to (A) improve the best of service/good X or (B) improve distribution of existing versions of X. This also isn't specific to mental health: one might retort to donors to AMF that they should be funding improvements in (say) health treatment in general or malaria treatment in particular. There's a saying I like which is "the future is here, it just isn't very evenly distributed" - if you compare Space-X launching rockets which can land themselves vs people not having clean drinking water. There seems to be very little we can say from the armchair about whether (A) or (B) is the more cost-effective option for a given X. I suspect that if there were a really strong 'pull' for goods/services to be provided, then we would already have 'solved' world poverty, which makes me think distribution is weakly related to innovation.
Aside: I wonder if there is some concept of 'trickle-down' innovation at play, and whether this is relevant analogous to that of 'trickle-down' economics.
fwiw I don't think most of this problem is due to insurance issues, though I agree that the US healthcare system is very weird and falls short in a lot of ways.
This also isn't specific to mental health: one might retort to donors to AMF that they should be funding improvements in (say) health treatment in general or malaria treatment in particular.
I suspect that if there were a really strong 'pull' for goods/services to be provided, then we would already have 'solved' world poverty, which makes me think distribution is weakly related to innovation.
World poverty has been decreasing a lot since 1990 – some good charts here & here.
M-Pesa and the broad penetration of smartphones are examples of innovations that were quickly distributed. The path from innovation to distribution is probably harder for services.
For finance ministries isn't the key first step some clarity on whether mental health spending improves mental health more than, say, improved housing, social security, children's parks etc?
(Obviously postpartum depression and other specific mental health issues could be an exception.)
My view is at current time there are 3 main and overlapping issues going on ---COVID, global warming, and civil unrest about racism and policing (which sort of started in USA but now is global).
These all will impact 'mental health'.
I agree with another comment that some of the graphs are not that easy to decipher. Its interesting that while most of the 'mechanical ' and 'intuitive' measures agree or correlate, at the end of the list you have some mental interventions in which the mechanical scores are like -1 (unlike the other interventions) while the intuitive ones are still around 7--similar to the other intuitive scores --- (so they anti-correlate ). I wonder why these studies are so different (i can guess).)
I have seen 2 recent very well researched and hence convincing studies regarding the effect of social interventions on COVID pandemic (from teams of researchers in UK--imperial college, oxford, Stanford, Harvard, etc.) which came to opposite conclusions regarding the effect of 'lockdowns'. One study said lockdowns had no effect; the other said they prevented possibly 100,000s of deaths. The graphs in these studies were not easy to interpret either, for me.
Since i dabble in 'complexity theory' , I dislike the use of the term 'mechanical model' here though its well defined---( cost X effectiveness) . i just don't view it as what i call mechanical--though it can be interpreted that way. .
i view 'mechanical ' as referring to a newtonian classical physics type model. Many people into complexity theory (some experts and some amateurs) reject what they call 'mechanical models'. They prefer what they call nonequilibrium, open system models with emergent properties . I personally don't think there is any difference between these. Terms like 'mechanical', 'emergent' or 'intuitive' almost become like labels, brand names, ideologies, or 'races'. Its a fuzzy concept unless you agree on the definitions---like mental illness.
HLI’s Mental Health Programme Evaluation Project - Update on the First Round of Evaluation — EA Forum
HLI’s Mental Health Programme Evaluation Project - Update on the First Round of Evaluation
Authors: Jasper Synowski, with Michael Plant and Clare Donaldson.
Thanks to Florian Kuhlmeier for data visualization, and to Derek Foster, Sonia Vallentin and Lucia Coulter for their valuable feedback. Especially, we would like to thank the whole team for their work on this project.
Summary
Relatively little is known about the cost-effectiveness of mental health programmes in low-resource settings, at least compared to physical health. Yet, given the scale of suffering attributed to mental illness, as well as its relative neglectedness and presumed impact on subjective well-being, these programmes appear promising from an (near-term) effective altruism (EA) perspective. As part of the Happier Lives Institute (HLI), a group of volunteers has begun to identify the most cost-effective giving opportunities tackling mental health conditions globally. This post sets out the methodology used for the first of three evaluation rounds. A team of eight screeners made initial evaluations of 76 programmes listed on the Mental Health Innovation Network (MHIN) website. At least three screeners rated each programme and, based on the screening data, we identified 25 programmes for further evaluation. Lack of information on cost-effectiveness for many programmes on the MHIN was a limitation of the process.
Introduction
In the context of global development, the effective altruism community has generally focused on alleviating poverty and improving physical as opposed to mental health (some exceptions are this 2017 post and Giving What We Can, 2016). This was understandable: if measured via the conventional methods used in health economics, programmes targeting mental health mostly seemed less cost-effective than, for example, GiveWell-recommended programmes (Levin and Chisholm, 2016; Founders Pledge, 2019). However, as Michael Plant (2018), (2019, ch7) argues, if the cost-effectiveness of mental health programmes is assessed using subjective well-being (SWB) scores – individuals’ reports of their happiness and/or life satisfaction – mental health programmes appear relatively more cost-effective than they do on the conventional metrics, and may be roughly on a par with poverty alleviation and physical health interventions.
As yet, there has been limited effort among effective altruists to systematically and transparently evaluate organisations working to improve mental health. The most substantial analysis to date is an evaluation conducted by Founders Pledge, which only examined two mental health organizations – StrongMinds and BasicNeeds – in depth. A more comprehensive evaluation of the potential giving opportunities is therefore warranted.
To shed light on this question, a group of volunteers at the Happier Lives Institute (HLI) is researching the cost-effectiveness of mental health programmes. Specifically, our aim is to identify those programmes which (a) are already being implemented and (b) can use funding to scale up their services. In contrast with Charity Entrepreneurship’s approach, we do not aim to identify interventions that new organisations could implement.
Our method has three steps:
Longlist: Identify programmes targeting mental illness in low-resource settings and make a shallow assessment of their suitability for EA funding, resulting in a “longlist” to be considered further.
Shortlist: Assess the longlisted programmes against relevant criteria to create a shortlist for detailed evaluation.
Recommendations: Carry out in-depth evaluations of the shortlisted programmes, potentially resulting in a list of recommended donation opportunities.
This document sets out to describe our approach and findings related to step (1). Later steps will be discussed in future posts.
Methods
Database for initial screening
As a starting point for our investigation, we chose the database provided by the Mental Health Innovation Network (MHIN). In several conversations with experts in the field of global mental health, it was mentioned as the most comprehensive overview of mental health projects and organizations, particularly those working in low- and middle-income countries (LMICs). We appreciated the focus on LMICs because the treatment gap for mental health conditions is especially high in these countries (WHO Mental Health Atlas, 2017), particularly in low-resource (e.g. rural) settings. Further, costs of treatment are usually lower than in high-income countries. We assessed only those innovations targeting depression, generalized anxiety disorder or stress-related disorders. This is because (a) they are responsible for most of the global burden of disease caused by mental disorders (Whiteford et al., 2013), and because of our prior beliefs that they (b) are very bad for well-being per-person (World Happiness Report, 2017) and (c) are mental health conditions that are relatively cheap and easy to treat (compared to, say, schizophrenia (Levin and Chisholm, 2016)).
The screening process
76 innovations were randomly assigned to eight screeners. Each innovation was screened by three screeners independently and blind to the ratings of others. Screeners used the same standardised framework and were advised to spend roughly 20 minutes evaluating each programme. Screenings were conducted over the months of May and June 2019 based only on information from the MHIN database – no additional literature search on the programmes was conducted at this point.
The screeners
Each of the eight screeners has some academic background relevant to mental health (e.g. was a master’s student of Public Health) and was familiar with the framework used for our ratings. In a first pilot testing of ratings, overall proportion of agreement between screeners was tentatively deemed sufficient (see inter-rater reliability analyses here and here).
The screening framework
The screening framework can be reviewed in detail here. It includes different parameters, such as type of mental disorder targeted, costs per beneficiary (rated 1 to 5 on an exponential scale, with each point increase corresponding to a ten-fold increase in costs) and effectiveness score (rated qualitatively 0 to 5, with 0 meaning no effect and 5 an endured cure of moderate or severe mental illness). Additionally, it includes a question on whether the screened programme can potentially be scaled up – either by means of supporting an already existing organization or through setting up an entirely new one. If this was not the case, the screening process was terminated early. Although the project’s focus is now clearly set on recommending already existing organizations, this was not yet decided when we started the screenings. We therefore assessed both types of programmes in our first round of evaluation.
From cost and effectiveness data, a crude ‘mechanical’ score of cost-effectiveness was generated by multiplying cost and effectiveness score. Additionally, raters provided a 0-10 ‘intuitive score’, which represents a subjective evaluation of the programme “as a scalable intervention that EAs could fund and have strong counterfactual impact”. We included these two different assessments as a robustness check. On the one hand, we wanted raters to make a rough estimation of cost-effectiveness using “objective” data, rather than solely relying on their subjective judgement. However, we also wanted to allow raters to make use of their judgement in order to (a) overcome severe limitations of the cost and effectiveness data (e.g. much of it was from clinical trials, which is unlikely to generalise to “real-world” practice), and (b) integrate other factors that may affect the suitability of the programme for receipt of donations, such as assumptions about its scalability, organisational strength, and room for more funding. This is reflected in the intuitive score.
Identifying programmes to investigate in more detail
It was necessary to establish decision rules determining whether a programme would be examined more closely in the second round of our analysis. We chose to base our decision on a combined rule including mechanical score and intuitive score: if a programme crossed the respective cut-off point for either of the two, it would be investigated in more detail regardless of its score on the other. The cut-off points were decided to be defined based on the screening data, taking into account HLI’s limited resources to investigate programmes in more detail.
Results
Description of screening data
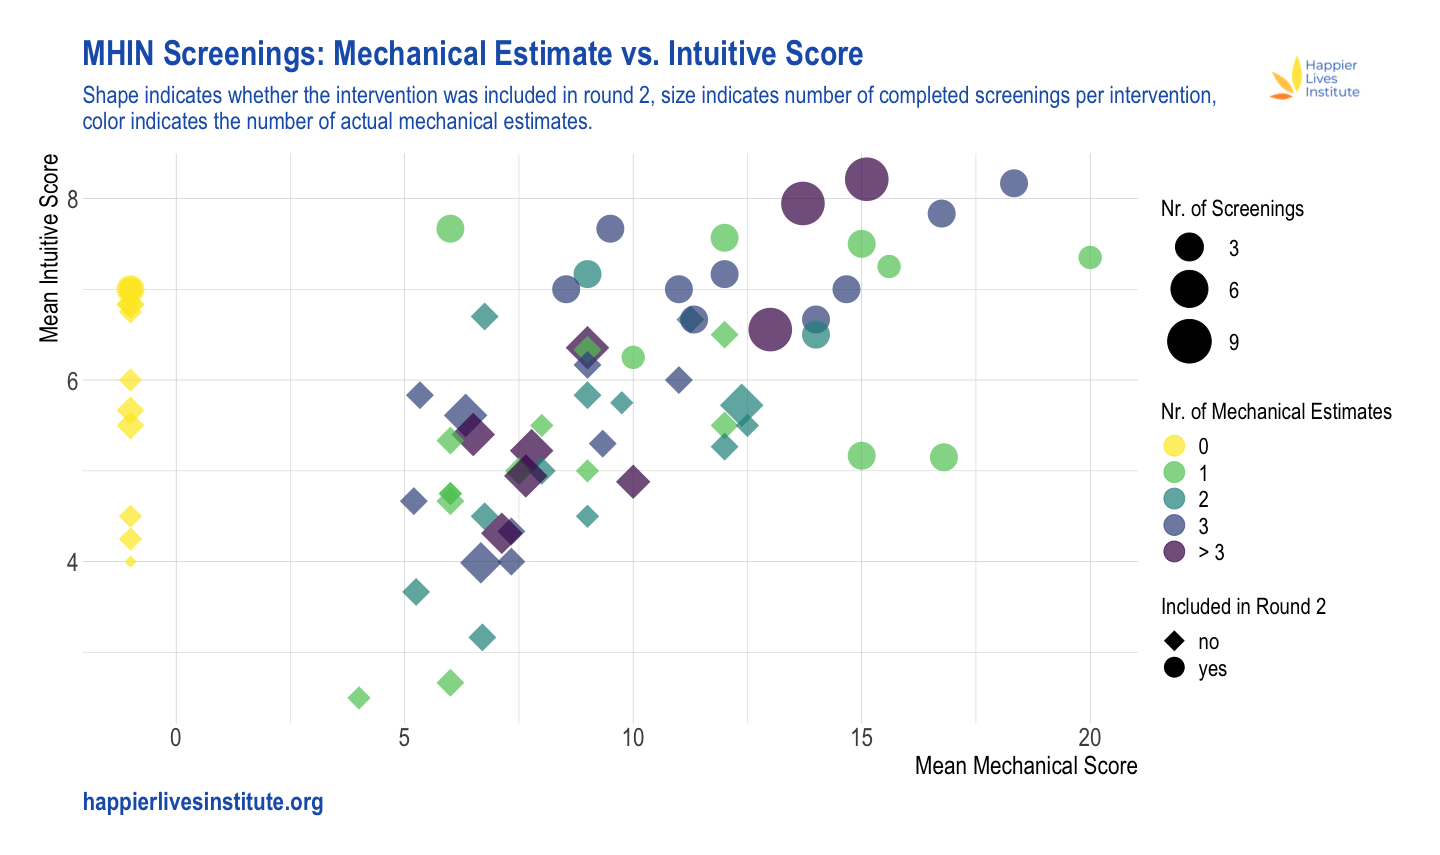
All screening data can be found in the master file (the reader is especially referred to the tab “Screening Outcomes Summary”). Central rating outcomes for each innovation were mean mechanical estimate and mean intuitive estimate, shown in Figure 1.
Figure 1. Mean mechanical estimate vs. mean intuitive estimate. The x-axis represents the mean mechanical estimate, the y-axis the mean intuitive estimate. The size of the symbols represents the number of completed ratings (ranging from 1 to 9), whereas the colours indicate the actual number of mechanical estimates which have been made (these may differ due to insufficient information). NB: (a) If no mechanical estimate could be made at all, this was coded as mechanical estimate of -1; (b) programmes screened for assessing inter-rater reliability received more than 3 ratings (max. 9).
For both mechanical and intuitive scores, the majority of programmes fall in the middle of the scales (~5-13 for mechanical score; ~4-7 for intuitive score). A small proportion of programmes score more highly than this on one or both scales. It should be noted that about one third (34%) of all individual ratings did not result in a mechanical estimate, because screeners deemed the available information insufficient to rate either costs or effectiveness. Consequently, the mean mechanical estimate score was sometimes based on just one or two estimates. In general, mean mechanical estimate and mean intuitive estimate were positively correlated (Spearman’s ⍴ = 0.606), as visible in Fig. 1.
There seems to have been considerable disagreement between screeners on both scores. The median range of the intuitive estimate (that is, the difference between the highest and the lowest score) across all programmes was 2.5, and the median range of the mechanical estimate across programmes was 4.0.
As no clear clustering could be identified, we stipulated that to be considered in round 2, a programme needed to have an intuitive estimate ≥7 and/or a mechanical estimate ≥13. Additionally, we included programmes where there was high disagreement (i.e. a relatively high range of either intuitive estimate or mechanical estimate) and where repeating the highest intuitive estimate or mechanical estimate two times (i.e. adding two hypothetical screenings with this score) resulted in a mean score above the threshold. This decision rule resulted in a total of 26 programmes in round 2, of which one was excluded as typing errors were found to be responsible for a severely distorted mean mechanical estimate. The 25 programmes can be seen in a separate document in Table 1, along with their mean mechanical estimate and intuitive score.
Discussion
76 mental health innovations were screened as a first step in finding the most effective programmes targeting mental ailments worldwide. Using our screening procedure and decision rule, we identified 25 promising programmes for further evaluation.
That a relatively high proportion of screenings could not be given even a rough ‘mechanical’ cost-effectiveness estimate on the basis of cost and effectiveness data indicates the challenges of finding cost-effective mental health programmes. Cost data were particularly likely not to be included. Our inability to even vaguely estimate the cost-effectiveness of particular programmes may be either a result of the information existing but not being listed on MHIN, or its not having been collected so far. This lack of information is reflected in the considerable disagreement between raters when assessing both the intuitive estimate and mechanical estimate, and constitutes a major limitation of our analysis.
Our decision rule defining which programmes will be investigated in more detail imposed necessarily arbitrary cut-offs. While we currently believe that the mechanical estimate and the intuitive estimate offer the most promising combination to identify the most cost-effective programmes, this choice is debatable and so are the respective cut-off points. Hence, we do not have high confidence that all of the programmes we screened out are less cost-effective than those we included in the second round.
There are several other noteworthy limitations. First, screening was based on information from the MHIN database, and the extent to which information was provided varied greatly across programmes. This may have introduced bias towards placing higher ratings on the programmes with more available information. Second, we relied on the intuitive estimate as one of two central indicators determining whether an intervention will be investigated in more detail in the second round of ratings. This score, while presumably aggregating a lot more information than the mechanical estimate, may be prone to bias. For example, knowledge of treatments such as StrongMinds or the Friendship Bench may have led screeners to favour programmes which operate in a similar way over others (e.g. programmes using a task-shifting approach). Nonetheless, we believe that incorporating this judgment is important because it reflects the subject matter knowledge of our screeners as well as all other information collected via the framework. In addition, our impression was that the overall quality of data on costs and effectiveness for most of the programmes was relatively poor, which adds further value to the intuitive score compared to the mechanical estimate. Third, as we relied on the MHIN database, which has not been regularly updated since 2015, we will have missed any programme not included on that. To counter this flaw, we are currently conducting additional expert interviews in order to identify any additional promising programmes.
Next steps
We have already collected more information on the programmes which have made it into the second round of our analysis. Based on a scoring framework that we are developing, we are currently narrowing down the number of programmes to examine in more detail. At the end of round two, we plan to publish a post similar to this one.
Conclusions
At least three screeners attempted both a mechanical estimate of cost-effectiveness and an intuitive rating for each of 76 programmes listed on MHIN, though both assessments were often hampered by a lack of information. From these scores, we identified 25 programmes to evaluate in the second round. Ultimately, we aim to make detailed assessments of the most promising giving opportunities, to shed light on the question of whether any mental health programmes are competitive with GiveWell-recommended programmes in terms of cost-effectiveness.
This is a crosspost from the new Animal Welfare Alignment Newsletter by Anima International. You can subscribe on Substack if you are interested in following these efforts. Audio reading also available on Substack.
The goals of this post are to:
1. Raise a question I see as crucially important to the goal of aligning AI to animal welfare...
Hello! I'm Justin Portela. I got hired by GWWC to make YouTube videos after AI in Context did such a kickass job.
My channel is using that same cinematic, high-production value beauty to talk about everything in the EA universe that isn't AI.
...
I used AI to fix transcription errors, rerrarange the ideas, and suggest tweaks to the title and some sentences.
Three of the most exciting projects to come out of EA in recent years are, in a vague sense, CEA spinouts:
* Kairos is directly a spinout of CEA and now handles most support for university AI safety groups. Basically everyone I've found who knows them is really excited about what they do
* NEST is an opinionated ideas-fi...


Thank you for doing this work! I really admire the rigor of this process. I'm really curious to hear how this work is received by (1) other evaluation orgs and (2) mental health experts. Have you received any such feedback so far? Has it been easy to explain? Have you had to defend any particular aspect of it in conversations with outsiders?
I do have one piece of feedback. You have included a data visualization here that, if you'll forgive me for saying so, is trying to tell a story without seeming to care about the listener. There is simply too much going on in the viz for it to be useful.
I think a visualization can be extremely useful here in communicating various aspects of your process and its results, but cramming all of this information into a single pane makes the chart essentially unreadable; there are too many axes that the viewer needs to understand simultaneously.
I'm not sure exactly what you wanted to highlight in the visualization, but if you want to demonstrate the simple correlation between mechanical and intuitive estimates, a simple scatterplot will do, without the extra colors and shapes. On the other hand, if that extra information is substantive, it should really be in separate panes for the sake of comprehensibility. Here's a quick example with your data (direct link to a larger version here):
I don't think this is the best possible version of this chart (I'd guess it's too wide, and opinions differ as to whether all axes should start at 0), but it's an example of how you might tell multiple stories in a slightly more readable way. The linear trend is visible in each plot, it's easier to make out the screening sizes, and I've outlined the axes delineating the four quadrants of each pane in order to highlight the fact that mostly top-scoring programmes on both measures were included in Round 2.
Feel free to take this with as much salt as necessary. I'm working from my own experience, which is that communicating data has tended to take just as much work on the communication as it does on the data.
Hi Matt. Thanks for your concrete suggestions on the data visualisation. I think we made the mistake of adding more and more information without re-thinking what exactly we’re trying to show.
On how the work is being received by other evaluation orgs: I’m not too sure. I suspect other orgs will be more interested in how we do the final evaluation, rather than the preliminary filtering. Hopefully we’ll also get more feedback this weekend at EAGxVirtual (Jasper is giving a talk).
And from mental health experts: My impression from speaking to several academics is that there’s a real effort in global mental health (GMH) at the moment to show that cost-effective interventions exist (this being important to policy-makers) - see e.g. Levin & Chisholm (2016) and WHO draft menu of cost-effective interventions. We have also had quite a few senior researchers offering their support or advice. We hope that our work on cost-effectiveness of micro-interventions will be useful as part of this wider context. One person we spoke to said that a systematic review, perhaps done in collaboration with a university, would be taken more seriously by academics than our current plan. This seems very likely to be true, with the obvious downside that it would be a lot more work.