Comments
There is much to be admired in this report, and I don't find it intuitively implausible that mental health interventions are several times more cost-effective than cash transfers in terms of wellbeing (which I also agree is probably what matters most). That said, I have several concerns/questions about certain aspects of the methodology, most of which have already been raised by others. Here are just a few of them, in roughly ascending order of importance:
- Outcomes should be time-discounted, for at least two reasons. First, to account for uncertainty as to whether they will obtain, e.g. there could be no counterfactual benefit in 10 years because of social upheaval, catastrophic events (e.g. an AI apocalypse, natural disaster), or the availability of more effective treatments for depression/ill-being/poverty. Second, to account for generally improving circumstances and opportunities for reinvestment: these countries are generally getting richer, people can invest cash transfers, etc. This will be even more important when assessing deworming and other interventions with benefits far in the future. (There is probably no need to discount costs as it seems they are incurred around the time the intervention is delivered in both cases.)
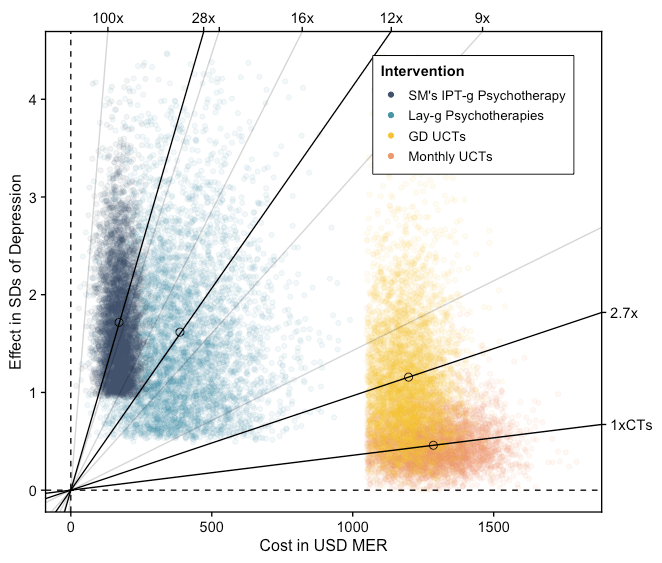
- I've only skimmed the reports, but it isn't clear to me what exactly is included in the costs for StrongMinds, e.g. sometimes capital costs (buildings etc), or overheads like management salaries and rent, are incorrectly left out of cost-effectiveness analyses. If you haven't already, you might also want to consider any costs to the beneficiaries, e.g. if therapy recipients had to travel, pay for materials, miss work, etc. As you note, most of the difference in the cost-effectiveness is determined by the programmes' costs rather than their consequences, so it's important to get this right (which you may well have done).
- You note that both interventions are assessed only in terms of their effect on depression. A couple years ago I summarised the findings of the four available evaluations of GiveDirectly in an unpublished draft post ( see Appendix 2.1, copied below, and the "GiveWell" subsection of section 2.2, the relevant part of which is copied below). The studies recorded data on many other indicators of wellbeing, which were sometimes combined into indices of "psychological wellbeing" with up to 10 components (as well as many non-wellbeing outcomes like consumption and education). Apologies if you explain this somewhere, but why did you only use the data on depression? Was it to facilitate an 'apples to apples' comparison, or something like that? If so, I wonder if it that was loading the dice a bit: at first blush, it seems unfair to compare two interventions in terms of outcome A when one is aimed solely at improving outcome A and the other is aimed at improving outcomes A, B, C, D, E, F, G and H (at least when B–H are relevant, i.e. indicators of subjective wellbeing).
- I share others' concerns about the omission of spillovers. In the draft post I linked above (partly copied below), I recorded my impression that the evidence so far, while somewhat lacking, suggests only null or positive spillovers to other households (at least for the current version of the programme, which 'treats' all eligible households in the village). As part of a separate project I did last year (which I'm not allowed to share), I also concluded that non-recipients within the household benefited considerably: "Only about 1.6 members of each household (average size ~4.3) were surveyed to get the wellbeing results, of which only 1 actually received the money. There was no statistically significant wellbeing difference between the recipients and surveyed non-recipient household members, and there is evidence of many benefits to non-recipients other than psychological wellbeing (e.g. education, domestic violence, child labour). Nevertheless, we expect the effects to be a little lower among non-recipients…" Omitting the inter-household spillovers is perhaps reasonable for the primary analysis, but it seems harder to justify ignoring benefits to others within the household.
- Whatever may be justified for the base case, I don't understand why you haven't done a proper sensitivity analysis. Stochastic uncertainty is captured well by the Monte Carlo simulations, but it is standard practice in many fields (including health economics) to carry out scenario analyses that investigate the effects of contestable structural and methodological assumptions. It should be quite straightforward to adapt the model so as to include/exclude (or vary the values of) spillovers, non-depression data, certain kinds of costs, discount rates, etc. You can present the results of these analyses yourself, but users can also put their own set of assumptions in a well-constructed model to see how that changes things. (Many other analyses are also potentially helpful, especially when the difference in cost-effectiveness between the alternatives is relatively small, e.g. deterministic one-way and two-way analyses that show how the cost-effectiveness ratio changes with high/low values for each parameter; threshold analyses that show what value a parameter must attain for the 'worse' programme to become the more cost-effective; value of information, showing how much it would be worth spending on further studies to reduce uncertainty; and perhaps most usefully in this case, a cost-effectiveness acceptability curve indicating the probability that StrongMinds is cost-effective at a given threshold, such as the 3-8x GiveDirectly that GiveWell is currently using as its bar for new charities. Some examples are here.)
Topic 2.2: (Re-)prioritising causes and interventions
[…]
GiveWell
[…]
Spillover effects
Secondly, there are also potential issues with ‘spillover effects’ of increased consumption, i.e. the impact on people other than the beneficiaries. This is particularly relevant to GiveDirectly, which provides unconditional cash transfers; but consumption is also, according to GiveWell’s model, the key outcome of deworming (Deworm the World, Sightsavers, the END Fund) and vitamin A supplementation (Hellen Keller International). Evidence from multiple contexts suggests that, to some extent, the psychological benefits of wealth are relative: increasing one person’s income improves their SWB, but this is at least partly offset by decreases in the SWB of others in the community, particularly on measures of life satisfaction (e.g. Clark, 2017). If increasing overall wellbeing is the ultimate aim, it seems important to factor these ‘side-effects’ into the cost-effectiveness analysis.
As usual, GiveWell provides a sensible discussion of the relevant evidence. However, it is somewhat out of date and does not fully report the findings most relevant to SWB, so I’ve provided a summary of wellbeing outcomes from the four most relevant papers in Appendix 2.1. In brief:
- All four studies found positive treatment effects, i.e. improvement to the psychological wellbeing of cash recipients, though in two cases this finding was sensitive to particular methodological choices.
- Two studies of GiveDirectly found negative psychological spillovers.
- Two found only null or positive spillovers.
As GiveWell notes, it is hard to aggregate the evidence on spillovers (psychological and otherwise) because of:
- Major differences in study methodology (e.g. components of the psychological wellbeing index, type of control, inclusion/exclusion criteria, follow-up period).
- Major differences in the programs being studied (e.g. size of transfers, proportion of households in a village receiving transfers).
- Absence of key information (e.g. how many non-recipient households are affected by spillover effects for each treated household, how the magnitude of spillovers changes with distance and over time, how they differ among eligible and ineligible households).
Like GiveWell, I suspect the adverse happiness spillovers from GiveDirectly’s current program are fairly small. In order of importance, these are the three main reasons:
- The negative findings were based on within-village analyses, i.e. comparing treated and untreated households in the same village. These may not be relevant to the current GiveDirectly program, which gives money to all eligible households in treated villages (and sometimes all households in the village). The two studies that investigated potential spillovers in untreated villages in the same area as the treated ones found no statistically significant effect.
- Eggers et al. (2019) (the “general equilibrium” study), which found only null or positive spillovers, was by far the largest, seems to have had the fewest methodological limitations, and investigated a version of the program most similar to current practice.
- At least one of the ‘negative’ studies, Haushofer & Shapiro (2018), had significant methodological issues, e.g. differential attrition rates and lack of baseline data on across-village controls (though results were fairly robust to authors’ efforts to address these).
In addition, any psychological harm seems to be primarily to life satisfaction rather than hedonic states. As noted in Haushofer, Reisinger, & Shapiro (2019): “This result is intuitive: the wealth of one’s neighbors may plausibly affect one’s overall assessment of life, but have little effect on how many positive emotional experiences one encounters in everyday life. This result complements existing distinctions between these different facets of well-being, e.g. the finding that hedonic well-being has a “satiation point” in income, whereas evaluative well-being may not (Kahneman and Deaton, 2010).” This is reassuring for those of us who tend to think feelings ultimately matter more than cognitive evaluations.
Nevertheless, I’m not extremely confident in the net wellbeing impact of GiveDirectly.
- Non-trivial comparison effects are found in many other contexts, so it is perhaps reasonable to expect them here too. (I haven’t properly looked at that evidence so I’m not sure how strong my prior should be.)
- As with any metric, there are various potential biases in wellbeing measures that could lead to under- or over-estimation of effects. When assessing the actual effect on wellbeing/welfare/utility (rather than on the specific measures of wellbeing used in the study), we should consider the evidence in the context of other findings that I haven’t discussed here.
- Even a negative spillover with a very small effect size, which seems plausible in this case, could offset much or all of the positive impact. For instance, if recipient households gain 1 happiness point from the transfer, but every transfer causes 10 other households to lose 0.1 points for the same duration, the net effect is neutral.
- I have only summarised the relevant papers; I haven’t tried to critique them in detail. GiveWell has also not analysed the latest versions of some of the key studies, which differ considerably from the working papers, so they might uncover some issues that I haven’t spotted.
A few more notes on interpreting the wellbeing effects of GiveDirectly:
- As with other health and poverty interventions, I suspect the overall, long-run impact will be more sensitive to unmeasured and unmodeled indirect effects (e.g. consumption of factory-farmed meat, population size, CO2 emissions) than to methods for estimating welfare (e.g. SWB instruments vs consumption). But I’m leaving these broader issues with short-termist methodology aside for now.
- The mechanisms of any adverse wellbeing effects have not been established in this case, and may not be pure psychological ‘comparison effects’ (jealousy, reduced status, etc). For instance, they could be mediated through consumption (e.g. poorer households selling goods to richer ones) or through some other, perhaps culture-specific, process.
- Like any metric, SWB measures are imperfect. So even when SWB data are available, an assessment of the SWB effects of an intervention may be improved by taking into account information on other outcomes, plus ‘common sense’ reasoning.
In addition, I would note that the other income-boosting charities reviewed by GiveWell could potentially cause negative psychological spillovers. According to GiveWell’s model, the primary benefit of deworming and vitamin A supplementation is increased earnings later in life, yet no adjustment is made for any adverse effects this could have on other members of the community. As far as I can tell, the issue has not been discussed at all. Perhaps this is because these more ‘natural’ boosts to consumption are considered less likely to impinge on neighbours’ wellbeing than windfalls such as large cash transfers. But I’d like to see this justified using the available evidence.
I make some brief suggestions for improving assessment of psychological spillover effects in the “potential solutions” subsection below.
Four studies investigated psychological impacts of GiveDirectly transfers. Two of these found wellbeing gains for cash recipients (“treatment effects”) and only null or positive psychological spillovers:
- Haushofer & Shapiro (2016) (9-month follow-up)
- 0.26 standard deviation (SD; p<0.01), positive, within-village treatment effect (i.e. comparing treated and untreated households in the same village) on an index of psychological wellbeing with 10 components (Table IV, p. 2011).
- Statistically significant benefits for (in decreasing order of magnitude) Depression, Stress, Life Satisfaction, and Happiness at the 1% level, and Worries at the 10% level. Null effects (at the 10% level) on Cortisol, Trust, Locus of Control, Optimism, and Self-esteem (though point estimates were mostly positive).
- Null, precise, within-village spillover effect on the index of psychological wellbeing; point estimate positive (0.1 SD; Table III, p. 2004).
- 0.26 standard deviation (SD; p<0.01), positive, within-village treatment effect (i.e. comparing treated and untreated households in the same village) on an index of psychological wellbeing with 10 components (Table IV, p. 2011).
- Egger et al. (2019) (the “general equilibrium” study)
- 0.09 SD (p<0.01) within-village treatment effect (i.e. assuming all spillovers are contained within a village) on a 4-item index of psychological wellbeing.
- Driven entirely by Life Satisfaction; no effect on Depression, Happiness, or Stress. (See this table, which the authors kindly sent to me on request.)
- 0.12 SD (p<0.1) “total” treatment effect (both within-village and across-village) on psychological wellbeing.
- Driven by Happiness (0.15 SD; p<0.05); no others significant at the 10% level. (See this table.)
- Null, fairly precise “total” spillover effect (combining within- and across-village effects) on the index of psychological wellbeing (and on every individual component); point estimate small and positive (0.08 SD). (See this table.)
- Note: GiveWell reports a positive, statistically significant within-village spillover effect on psychological wellbeing of about 0.1 SD, based on an earlier draft of the paper. I can’t find this in the published paper; perhaps it was cut because of the authors’ stated preference for the “total” specification.
- 0.09 SD (p<0.01) within-village treatment effect (i.e. assuming all spillovers are contained within a village) on a 4-item index of psychological wellbeing.
However, two studies are more concerning:
- Haushofer & Shapiro (2018) (3-year follow-up; working paper)
- Within-village 0.16 SD (p<0.01) treatment effect on an 8-component index of psychological wellbeing (Table 3, p. 16).
- Driven primarily by improvements to Depression and Locus of Control (p<0.05), followed by Happiness and Life Satisfaction (p<0.1). No statistically significant (at the 10% level) change in Stress, Trust, Optimism, and Self-esteem. (Table B.7, p. 55)
- Null across-village treatment effect on psychological wellbeing (Table 5, p. 22).
- Approx. -0.2 SD (p<0.01) adverse psychological wellbeing spillover on untreated households in treated villages (Table 7, p. 26).
- Driven by Stress (p<0.01), Depression (p<0.05), Happiness (p<0.1), and Optimism (p<0.1). No statistically significant (at the 10% level) change in Life Satisfaction, Trust, Locus of control, or Self-esteem. (Table B.15, p. 63)
- Within-village 0.16 SD (p<0.01) treatment effect on an 8-component index of psychological wellbeing (Table 3, p. 16).
- Haushofer, Reisinger, & Shapiro (2019)
- A 1 SD increase in own wealth causes a 0.13 SD (p<0.01) increase in the psychological well-being index (p.13; Table 3, p. 27).
- At the average change in own wealth of eligible (thatched-roof) households of USD 354, this translates into a treatment effect of 0.09 SD.
- At the average transfer of $709 among treated households, this translates into a treatment effect of 0.18 SD.
- Driven by Happiness and Stress (p<0.01) then Life Satisfaction and Depression (p<0.05). No statistically significant (at the 10% level) effect on Salivary Cortisol. (Table 5, p. 29)
- A 1 SD increase in village mean wealth (i.e. neighbours in one’s own village having a larger average transfer size) causes a decrease of 0.06 SD in psychological well-being over a 15 month period, only significant at the 10% level (p. 14; Table 3, p. 27).
- At the average cross-village change in neighbours’ wealth of $327, this translates into an effect of -0.2 SD.
- Driven entirely by Life Satisfaction (0.14 SD; p<0.01; p. 15; Table 5, p. 29)
- At a change in neighbours’ wealth of $327, this translates into a Life Satisfaction effect of -0.4 SD (which is much larger than the own-wealth benefit, but less precisely estimated).
- Subgroup analysis 1: No statistically significant within-village difference between treated and untreated households in psychological wellbeing effects of a change in neighbours’ wealth. (This suggests that what matters is how much more your neighbours received, not whether you received any transfer.)
- Subgroup analysis 2: No statistically significant within-village difference in the psychological wellbeing effect of a change in neighbours’ wealth between households below versus above the median wealth of their village at baseline. (This suggests poorer households did not suffer more adverse psychological spillovers than wealthier ones.)
- Methodological variations: Broadly similar results using alternative measures of the change in village mean wealth. (See p. 17 and Tables A.9–A.14 for details.)
- A 1 SD increase in own wealth causes a 0.13 SD (p<0.01) increase in the psychological well-being index (p.13; Table 3, p. 27).
- No effect of village-level inequality on psychological wellbeing (holding constant one’s own wealth) over any time period and using three alternative measures of inequality.
Note: GiveWell’s review of an earlier version of the paper reports a “statistically significant negative effect on an index of psychological well-being that is larger than the short-term positive effect that the study finds for receiving a transfer, but the negative effect becomes smaller and non-statistically significant when including data from the full 15 months of follow-up… The authors interpret these results as implying that cash transfers have a negative effect on well-being that fades over time.” I’m not sure why the authors removed those analyses from the final version.


This is amazing work! I have a bunch of thoughts, which I'll number so it's easier for you or others to respond to. Sorry that this comment is a bit long; you can respond to the numbers one-by-one instead of all at once if you'd like:
It will likely take some time before GiveWell would be able to make StrongMinds a top charity, but it would be exciting if StrongMinds (or any mental health charity) could make it to GiveWell's list of recommended charities as early as the end of 2022. It would be nice to hear from GiveWell about the following too if they:
Our goal is to find 1-2 charity ideas that are highly cost-effective to implement in the Philippines (and competitive with StrongMinds), and that Charity Entrepreneurship will be willing to incubate in 2022. These reports of yours will likely be very useful for us, which is why I took the time to read this report and browse through some of the others linked here. And I can see how we can build off and learn from this research in various ways. We'll probably email you within the next couple of weeks to schedule a call with you and/or Joel, with more specific questions about HLI's research and to get advice about our project!
This might make sense as a vision if GiveWell doesn't plan on recommending some charities that do well on improving SWB (i.e. StrongMinds). Hopefully GiveWell does though.
Brian, I am glad to see your interest in our work!
1.) We have discussed our work with GiveWell. But we will let them respond :).
2.) We're also excited to wade deeper into deworming. The analysis has opened up a lot of interesting questions.
3.) I’m excited about your search for new charities! Very cool. I would be interested to discuss this further and learn more about this project.
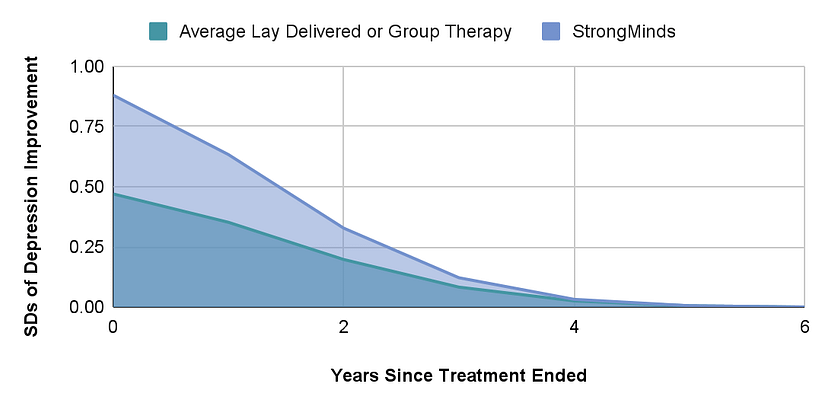
4.) You’re right that in both the case of CTs and psychotherapy we estimate that the effects eventually become zero. We show the trajectory of StrongMinds effects over time in Figure 5. I think you’re asking if we could interpret this as an eventual tendency towards depression relapse. If so, I think you’re correct since most individuals in the studies we summarize are depressed, and relapse seems very common in longitudinal studies. However, it’s worth noting that this is an average. Some people may never relapse after treatment and some may simply receive no effect.
5.) I'll message you privately about this for the time being.
6.) In general we hope to get more people to make decisions using SWB.
7.) I am going to pass the buck on making a comment on this :P. This decision will depend heavily on your view of the badness of death for the person dying and if the world is over or underpopulated. We discuss this a bit more in our moral weights piece. In my (admittedly limited) understanding, the goodness of improving the wellbeing of presently existing people is less sensitive to the philosophical view you take.
Thanks for the flag, Joel.
Brian, our team is working on our own reports on how we view interpersonal group therapy interventions and subjective well-being measures more generally. We expect to publish our reports within the next 3-6 months.
We have spoken to HLI about their work, and HLI has given us feedback on our reports. It’s been really helpful to discuss this topic with Michael, Joel, and the team at HLI. Their work has provided some updates to how we view this topic, even if we do not ultimately end up reaching the same conclusions.
We’re still looking into this area and some of the important questions HLI has raised. While we plan to provide a more detailed view once our reports are published, a few areas where we differ from HLI are below:
We still have a lot of uncertainty about how to compare different interventions like cash transfers and therapy, and making these comparisons is crucial to our decisions on what funding opportunities to recommend to our donors. As a result, we hope to continue to discuss this topic with individuals who have a differing view than us on our moral weights so that we can continue to refine our approach.
We look forward to engaging once we publish a fully vettable report. Until then, I hope this answers the immediate questions you have about where the views of GiveWell and HLI differ.
Before I respond to the details, I’d like to thank GiveWell for engaging with these questions. I’m delighted our research has led to them producing their own reports into group psychotherapy and using subjective wellbeing to determine one's moral weights.
GiveWell kindly shared a draft of their reply with us in advance and we made several comments clarifying our position. However, they decided to publish their original draft unchanged (without offering a further explanation) so we're restating our comments here so that readers can build a better understanding of where our positions differ. I’ll split these up so it’s easier to follow, first quoting the response from GiveWell, then providing our reply.
To clarify, the intervention is not to provide therapy to anyone, it's just to provide it to those who are depressed. I expect that even some depressed people would choose cash over therapy. But it's reasonable to assume people don't always know what's best for them and under/overconsume on certain goods due to lack of information, etc. That's why we need studies to see what truly improves people's subjective well-being.
If one was serious about always giving people what they choose, then you would just give people cash and let them decide. Given that GiveWell claims that bednets and deworming are better than cash, it seems they already accept cash is not necessarily best. Hence, it’s unclear how they could raise this as a problem for therapy without being inconsistent.
What I think might have been overlooked here is that therapy is only being given to people diagnosed with mental illnesses, but the cash transfers go to poor people in general (only some of whom will be depressed). Hence, it's perhaps not so surprising that directly treating the depression of depressed people is more impactful than giving out money (even if those people are poor). If you were in pain but also poor, no one would assume that giving you money would do more for your happiness than morphine would.
We account for this trial in our meta-analysis - if we hadn’t incorporated it, therapy would look even a bit more cost-effective. Of course, the point of meta-analyses is to look at the whole evidence base, rather than just selecting one or two pieces of evidence; one could discount any meta-analysis this way by pointing to the trial with the lowest effect.
We don’t think one study should overshadow the results of a meta-analysis, which aggregates a much wider set of data ("beware the man of only one study" etc). If there was one study finding no impact of bednets, I doubt GiveWell would conclude it would be reasonable to discount all the previous data on bednets.
What is the conversion rate here between DALYs and income increases, and on what is it based? I'm not sure what method could be being used here except by inputting one's intuitions. In which case, it would be good to make that clear, as people may think the conversation rate is an authoritative fact, rather than (just) an opinion. It would be interesting to state how much readers' opinions would need to differ from GiveWell’s to reach alternative conclusions!
To bang a familiar drum, the reason to use subjective wellbeing measures is that we can observe how much health and income changes improve wellbeing, rather than having to guess.
It's not easy to respond to this - it's not stated what the limitations and other factors are.
More generally, there's no reason to think in the abstract that, if you're pluralist rather than monist about value, this changes the relative cost-effectiveness ranking of different actions. You'd need to provide a specific argument about what the different values are, how each intervention relatively does on this, and how the units of value are commensurate.
For example, imagine a scenario where intervention X provides 15 units of happiness/$ but does nothing for autonomy and intervention Y provides 10 units of happiness/$ and 10 units of autonomy/$. If we take one unit of happiness as being as valuable as one unit of autonomy, then Y is better than X. However, someone who only valued happiness would think X is better.
It would be helpful if GiveWell could share what their current best guess is. Even if spillovers are 30% for therapy and 100% for cash, assuming the original 12x multiple and 3 other household members, then the multiple would still be 5.7.
Cash = 1 + (1*3) = 4
Psychotherapy = 12 + ((0.3*12)*3) = 12 + 10.8 = 22.8
Hence, therapy still looks quite a bit better even if the spillover effects are small.
This is definitely not what we think, particularly the assumption it will be proportional across 'any' intervention! I'm sure why someone would believe that.
Our position, as outlined in this twitter thread, is quite a bit more nuanced. There wasn't much evidence we could find on household spillovers - five studies for cash, one for mental health - and in each case it indicated very large spillover effects, i.e. in the range that other household members got 70-100% of the benefitted the recipient did. We didn't include that in the final estimate because there was so little evidence and, if we'd taken it at face value, it would only have modestly changed the results (making therapy 8-10x better). Even in the extreme, and implausible, case where therapy has no household spillovers, it wouldn't have yielded the result that psychotherapy is more cost-effective than cash transfers. We discussed this in the individual cost-effectiveness analysis reports and flagged it as something to come back to for further research.
We agree that the effects of household spillovers from cash are large. Where our priors may diverge is that HLI (and others) think that the spillovers from therapy are also large, whereas GiveWell is very sceptical about this. We are now conducting a thorough search for more evidence on household spillovers, so we are not just swapping priors.
We have published an updated cost-effectiveness comparison of psychotherapy and cash transfers to include an estimate of the effects on other household members. You can read a summary here.
For cash transfers, we estimate that each household member experiences 86% of the benefits experienced by the recipient. For psychotherapy, we estimate the spillover ratio to be 53%.
After including the household spillover effects, we estimate that StrongMinds is 9 times more cost-effective than GiveDirectly (a slight reduction from 12 times in our previous analysis).