Author: Alex Cohen, GiveWell Senior Researcher
In a nutshell
- The Happier Lives Institute (HLI) has argued in a series of posts that GiveWell should use subjective well-being measures in our moral weights and that if we did, we would find StrongMinds, which provides group-based interpersonal psychotherapy (IPT-G), is as or more cost-effective than marginal funding to our top charities.
- This report provides our initial thoughts on HLI's assessment, based on a shallow review of the relevant literature and considerations.
- Our best guess is that StrongMinds is approximately 25% as cost-effective as our marginal funding opportunities. This assessment is based on several subjective adjustments, and we’ve identified limited evidence to discipline these adjustments. As a result, we think a wide range of cost-effectiveness is possible (approximately 5% to 80% as cost-effective as our marginal funding opportunities), and additional research could lead to different conclusions.
- The main factors that cause us to believe StrongMinds is less cost-effective than HLI believes it is—and that we are unsure about—are:
- Spillovers to household members: It’s possible that therapy for women served by StrongMinds benefits other members of their households. Our best guess is that the evidence HLI uses to estimate spillover effects overestimates spillovers, but we think it’s possible that direct evidence on the effect of StrongMinds on non-recipients could lead to a different conclusion.
- Adjustments for internal validity of therapy studies: In our analysis, we apply downward adjustments for social desirability bias and publication bias in studies of psychotherapy. Further desk research and conversation with experts could help inform adjustments for social desirability and publication bias.
- Lower effects outside of trial contexts: Our general expectation is that programs implemented as part of randomized trials are higher quality than similar programs implemented at scale outside of trial settings. We expect forthcoming results from two randomized controlled trials (RCTs) of StrongMinds could provide an update on this question.
- Duration of effects of StrongMinds: There is evidence for long-term effects for some lay-person-delivered psychotherapy programs but not IPT-G, and we’re skeptical that a 4- to 8-week program like StrongMinds would have benefits that persist far beyond a year. We expect one of the forthcoming RCTs of StrongMinds, which has a 2-year follow-up, will provide an update on this question.
- Translating improvements in depression to life satisfaction scores: HLI’s subjective well-being approach requires translating effects of StrongMinds into effects on life satisfaction scores, but studies of psychotherapy generally do not report effects on life satisfaction. We think HLI overestimates the extent to which improvements in depression lead to increases in life satisfaction. However, we think direct evidence on the effect of StrongMinds on life satisfaction scores could update that view.
- Comparing StrongMinds to our top charities relies heavily on one’s moral views about the trade-off between StrongMinds’ program and averting a death or improving a life. As a result, we also think it’s important to understand what HLI’s estimates imply about these trade-offs at a high level, in addition to considering the specific factors above. HLI’s estimates imply, for example, that a donor would pick offering StrongMinds’ intervention to 20 individuals over averting the death of a child, and that receiving StrongMinds’ program is 80% as good for the recipient as an additional year of healthy life. We’re uncertain about how much weight to put on these considerations, since these trade-offs are challenging to assess, but they seem unintuitive to us and further influence our belief that StrongMinds is less cost-effective than HLI’s estimates.
- We may conduct further work on this topic, but we’re uncertain about the timeline because even under optimistic scenarios, StrongMinds is less cost-effective than our marginal funding opportunities. If we did additional work, we would prioritize reviewing two forthcoming RCTs of StrongMinds and conducting additional desk research and conversations with subject matter experts to try to narrow our uncertainty on some of the key questions above.
Background
Group interpersonal psychotherapy (IPT-G) is a time-limited course of group therapy sessions which aims to tackle depression. StrongMinds implements an IPT-G program that specifically targets women with depression and consists of participants meeting with a facilitator in groups of five to ten, on average, for 90 minutes one to two times per week for four to eight weeks.
The Happier Lives Institute (HLI) has argued in a series of reports and posts that if we were to assess charities we recommend funding based on their impact on subjective well-being measures (like life satisfaction scores), StrongMinds’ interpersonal group psychotherapy program would be competitive with Against Malaria Foundation (AMF), one of our top charities.
This report is intended to share our view of HLI’s assessment and StrongMinds’ cost-effectiveness, based on a shallow review of the relevant literature and considerations. It incorporates feedback we’ve received from HLI on a previous (unpublished) draft of our work and follow-up research HLI has done since then.
HLI’s estimate of the cost-effectiveness of StrongMinds
HLI estimates the effect of StrongMinds compared to AMF, one of our top charities, by measuring the impact of both on life satisfaction scores. Life satisfaction scores measure how people respond, on a scale from 0-10, to the question, “All things considered, how satisfied are you with your life as a whole these days?"
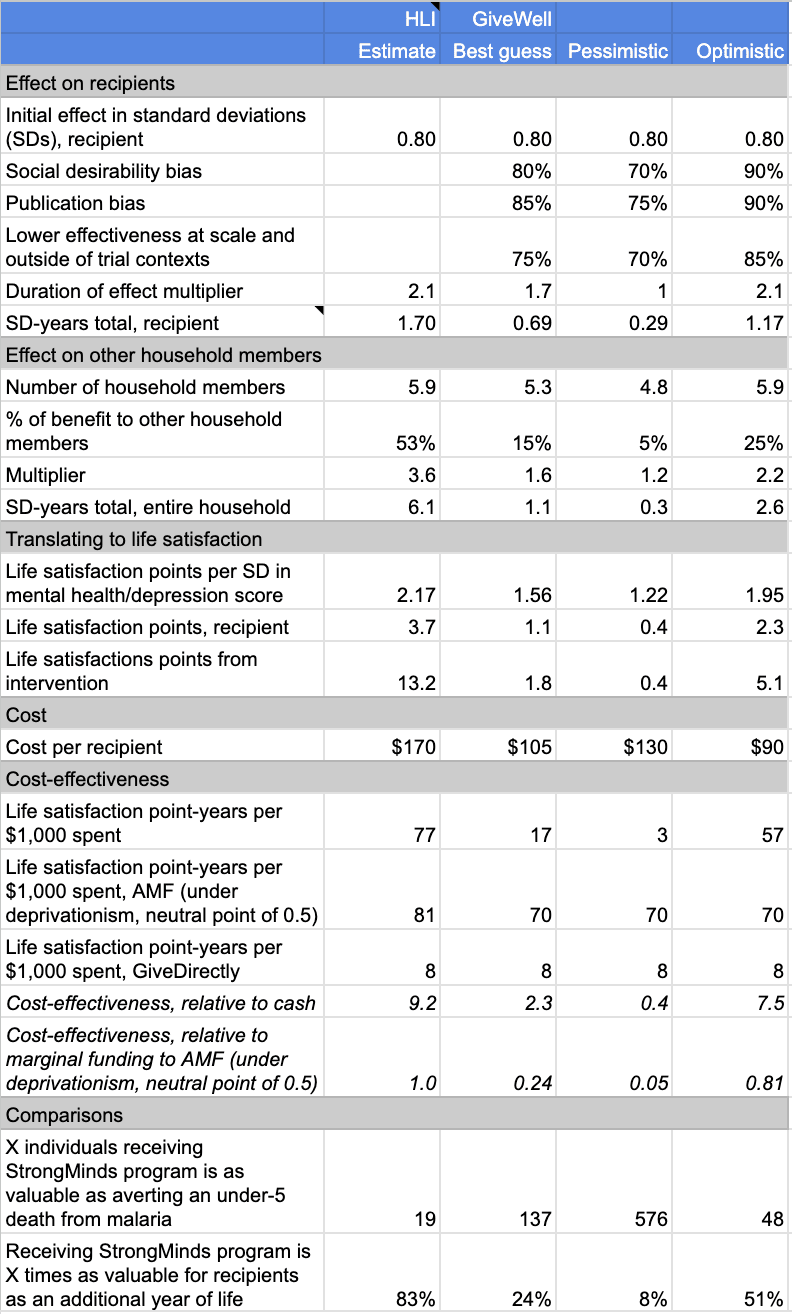
HLI estimates that psychotherapy from StrongMinds creates 77 life satisfaction point-years (or WELLBYs) per $1,000 spent. Summary of its calculations:
- Main effect: It estimates that StrongMinds' program increases mental health scores among recipients of psychotherapy by 1.69 standard deviation (SD)-years. This is based on combining estimates from studies of programs similar to StrongMinds in low- and middle-income countries (Thurman et al. 2017, Bolton et al. 2007, Bolton et al. 2003), studies of StrongMinds, and a meta-regression of indirect evidence.
- Internal and external validity: In its meta-regression of indirect evidence, HLI includes adjustments for internal validity (including publication bias) and external validity (proxied by geographic overlap). These are reported relative to cash transfers studies. It notes that social desirability bias and concerns about effects being smaller at higher scale are excluded. These internal and external validity adjustments lead to a 90% discount for therapy relative to cash transfers.
- Spillovers: HLI estimates that non-recipients of the program in the recipient’s household see 53% of the benefits of psychotherapy from StrongMinds and that each recipient lives in a household with 5.85 individuals. This is based on three studies (Kemp et al. 2009, Mutamba et al. 2018a, and Swartz et al. 2008) of therapy programs where recipients were selected based on negative shocks to children (e.g., automobile accident, children with nodding syndrome, children with psychiatric illness). This leads to a 3.6x multiplier for other household members. The total benefit to the household is 6.06 SD-years.
- Translating depression scores into life satisfaction: To convert improvements in depression scores, measured in SDs, into life satisfaction scores, HLI assumes (i) 1 SD improvement in depression scores is equivalent to 1 SD improvement in life satisfaction scores and (ii) a 1 SD improvement in life satisfaction is 2.17 points. This 2.17 estimate is based on data from low-income countries, which finds an average SD in life satisfaction scores of 2.37, and data from high-income countries, which finds an average SD in life satisfaction scores of 1.86.
- Cost: HLI estimates that StrongMinds costs $170 per recipient.
- Cost-effectiveness: This implies 77 life satisfaction point-years per $1,000 spent.
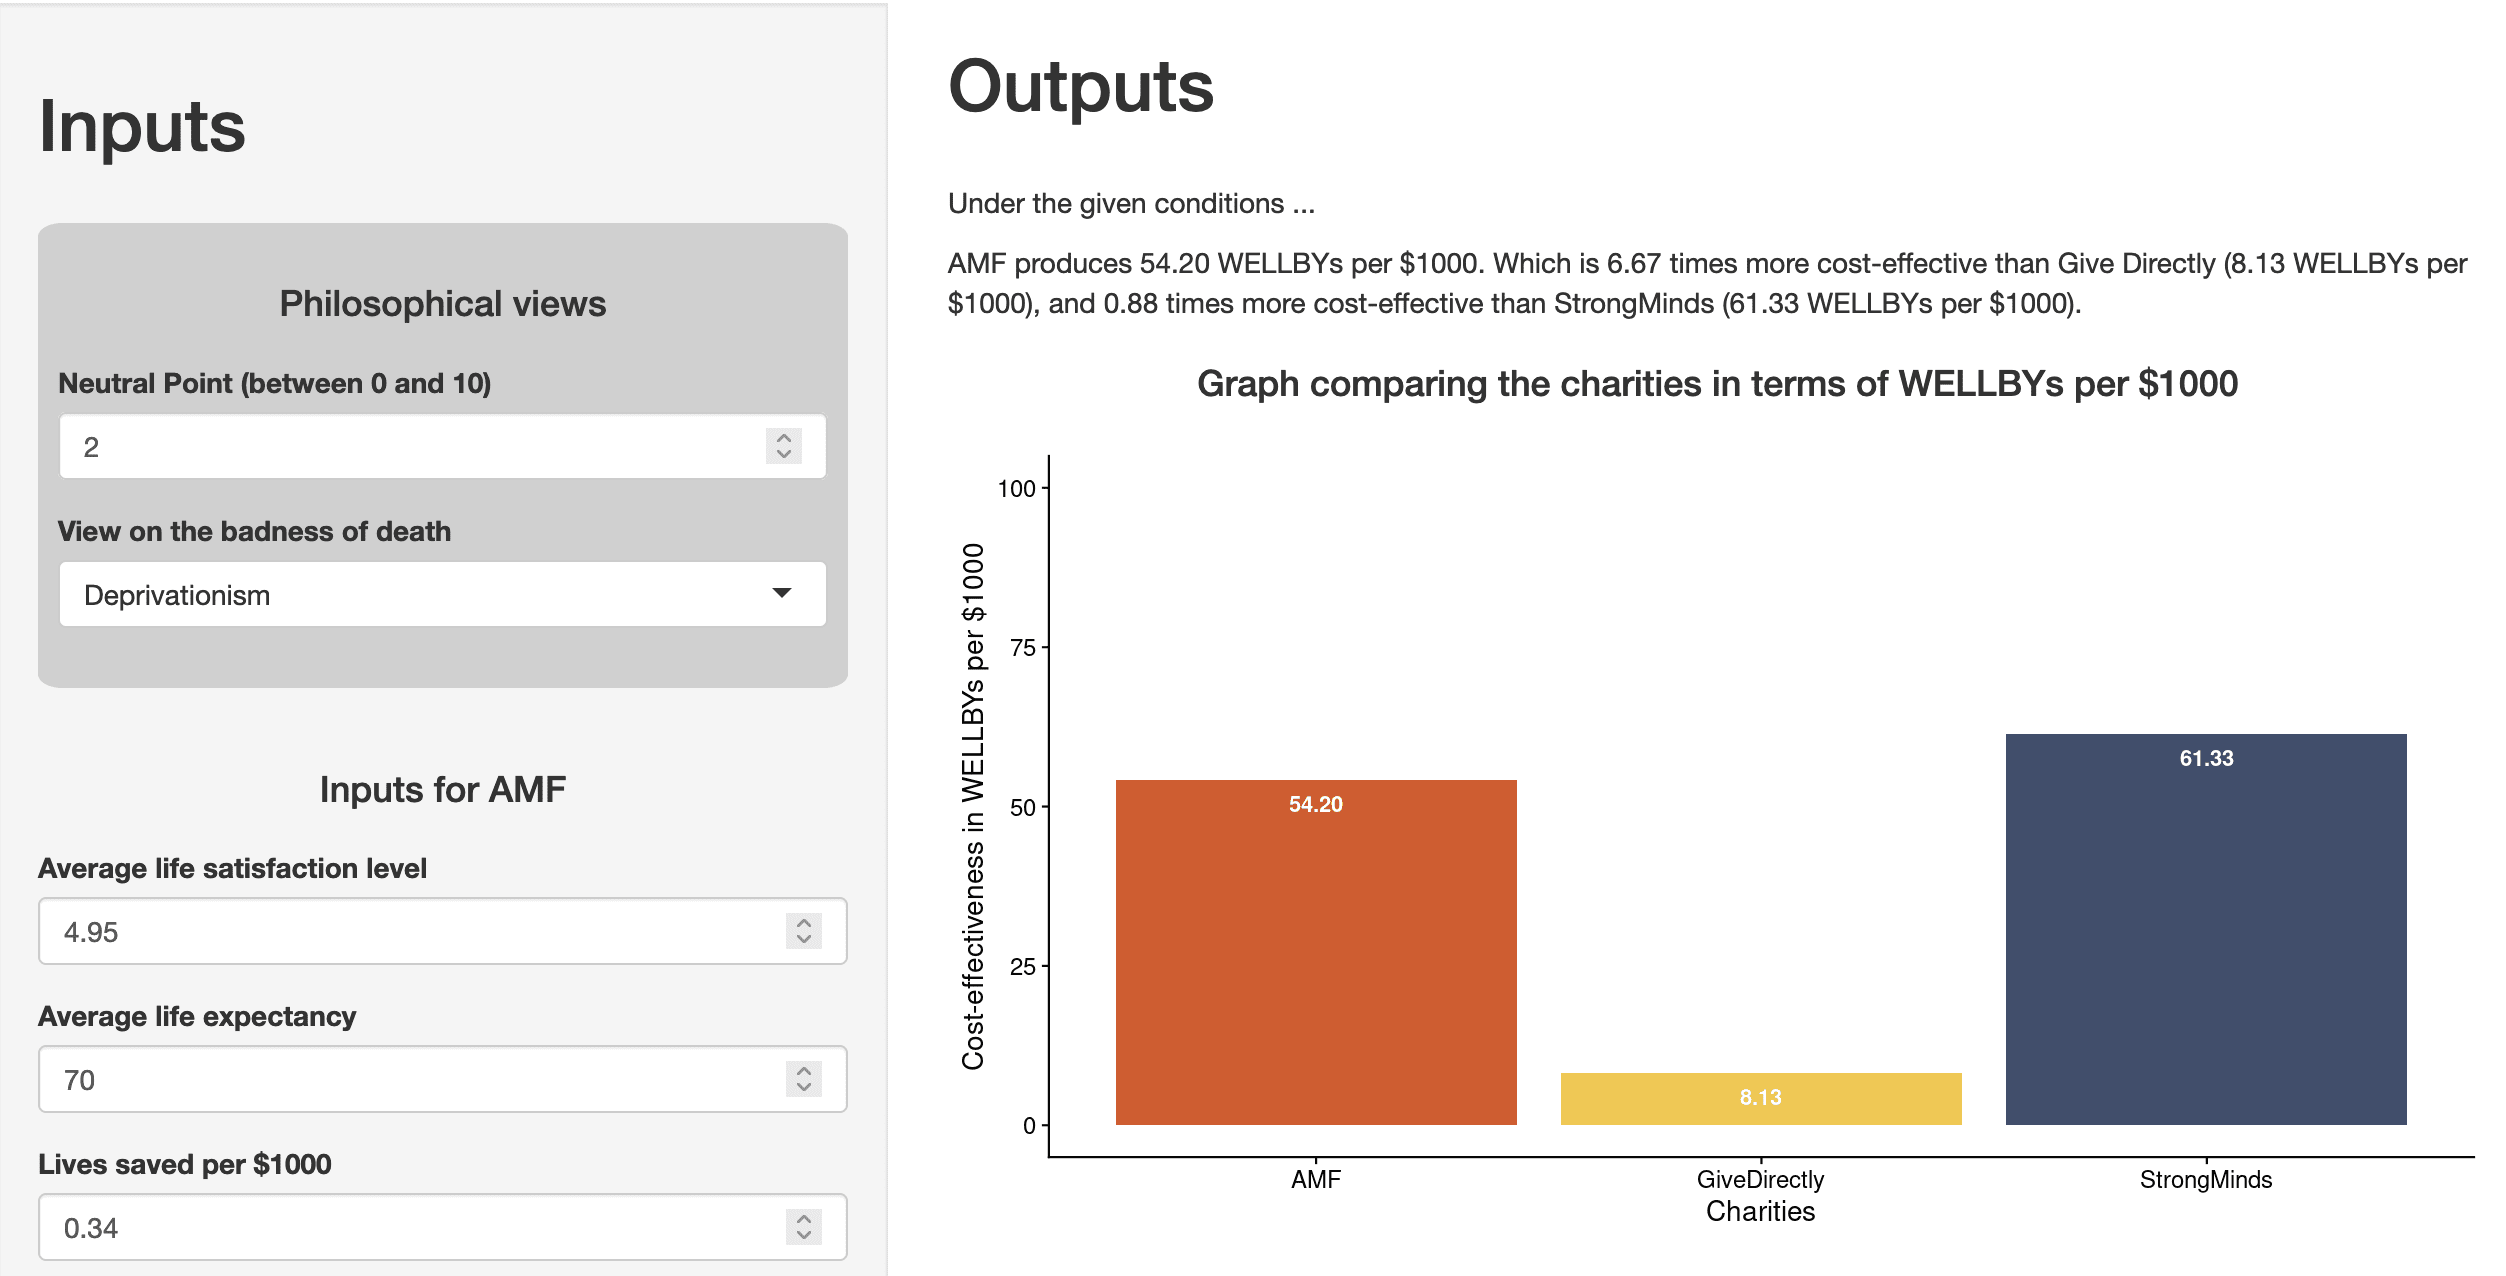
HLI estimates that AMF creates 81 life satisfaction point-years (or WELLBYs) per $1,000 spent. Note: This is under the deprivationist framework and assuming a “neutral point” of 0.5 life satisfaction points. HLI’s report presents estimates using a range of views of the badness of death and range of neutral points. It does not share an explicit view about the value of saving a life. We are benchmarking against this approach, since we think this is what we would use and it seems closest to our current moral weights. Summary of HLI's calculations:
-
Using a deprivationist framework, HLI estimates the value of averting a death using the following formula: ([Average life satisfaction score out of 10 during remaining years of life] minus [Score out of 10 on life satisfaction scale that is equivalent to death]) times [years of life gained due to death being averted].
-
Average life satisfaction is 4.95/10. Average age of death from malaria is 20 and they live to be 70, giving them 50 extra years of life. As a result, WELLBYs gained equal (4.95-neutral point)*(70-20).
-
HLI cites a cost per death averted of $3,000 for AMF.
-
With a neutral point of 0.5, this would be approximately 74 WELLBYs (life satisfaction point-years) per $1,000 spent. (Note: HLI presents a range of neutral points. We chose 0.5 since that’s the neutral point we’re using.)
-
HLI also adds grief effects of 2.4 WELLBYs per $1,000 spent and income-increasing effects of 4 WELLBYs per $1,000 spent.
-
This yields a bottom line of approximately 80 WELLBYs per $1,000 spent for a neutral point of 0.5.
HLI estimates cash transfers from GiveDirectly create 8 life satisfaction point-years (or WELLBYs) per $1,000 spent.
Our assessment
Overall, we estimate StrongMinds is approximately 25% as cost-effective as marginal funding to AMF and our other top charities. However, this is based on several subjective adjustments, and we think a wide range of cost-effectiveness is possible (approximately 5% to 80% as cost-effective as our marginal dollar).
Best guess on cost-effectiveness
We put together an initial analysis of StrongMinds' cost-effectiveness under a subjective well-being approach, based on HLI’s analysis.
We estimate StrongMinds is roughly 25% as cost-effective as our marginal funding to AMF and other top charities. Compared to HLI, we estimate lower spillover effects and stricter downward adjustments for social desirability bias, publication bias, and lower effects at scale. This is partially counterbalanced by estimating lower costs and lower cost-effectiveness of AMF under a subjective well-being approach, compared to HLI.
A summary of HLI’s estimates vs. our view:
Our best guess is that StrongMinds leads to 17 life satisfaction point-years (or WELLBYs) per $1,000 spent. Summary of our calculations:
-
Main effect: HLI’s estimate of the effect of the main effect of IPT-G on SDs in depression scores is roughly similar to our estimate, which was based on a shallower review of the literature. We’re uncertain about these estimates and think it’s possible our estimates could change if we prioritized a more in-depth review. (We describe this further below.)
-
Internal and external validity adjustments: We include downward adjustments for three additional factors that are not incorporated into HLI’s estimates. These are subjective guesses, but we believe they’re worth including to make StrongMinds comparable to top charities and other funding opportunities. These include:
- Lower effectiveness at a larger scale and outside of trial contexts (75% adjustment). (We describe this further below.)
- Social desirability bias due to self-reported outcomes (80% adjustment). (We describe this further below.)
- Publication bias (85% adjustment). (We describe this further below.)
-
Duration of benefits: There is evidence for long-term effects for some lay-person-delivered psychotherapy programs but not IPT-G, and we’re skeptical that a 4- to 8-week program like StrongMinds would have benefits that occur far beyond a year. We also expect some of the internal and external validity adjustments we apply would also lead to shorter duration of effects. We apply an 80% adjustment factor for this. (We describe this further below.)
-
Spillovers: We roughly double the effects to account for spillovers to other household members. This is lower than HLI’s adjustment for spillovers. This reflects our assumption that the evidence HLI uses to estimate spillovers may overestimate spillover effects and household size is lower than HLI estimates. (We describe these further below.)
-
Translating depression scores into life satisfaction: We make a slight discount (90% adjustment) to account for improvements in depression scores translating less than 1:1 to improvements in life satisfaction scores and a discount (80% adjustment) to account for individuals participating in StrongMinds having depression at baseline and therefore having a more concentrated distribution of life satisfaction scores. (We describe this further below.)
-
Cost: StrongMinds cited a figure of $105 per person receiving StrongMinds for 2022. We use that more recent figure instead of the $170 per person figure used by HLI.
-
Cost-effectiveness: This implies 17 life satisfaction point-years per $1,000 spent.
We estimate marginal funding to AMF creates 70 life satisfaction point-years per $1,000 spent. We define marginal funding to AMF as funding that is roughly 10 times as cost-effective as unconditional cash transfers through GiveDirectly (our current bar for funding opportunities). This is similar to marginal funding to our other top charities. Our assumptions are similar to HLI's on life satisfaction point-years per death averted from AMF. When we input this into our current cost-effectiveness analysis, we find an effect of 70 life satisfaction point-years per $1,000 spent.
We also estimate that GiveDirectly creates 8 life satisfaction point-years per $1,000 spent, which is similar to HLI's estimate. This is largely because we rely on HLI’s meta-analysis of the effect of cash transfers on life satisfaction scores.
Key uncertainties and judgment calls that we would like to explore further
The cost-effectiveness of StrongMinds relies on several judgment calls that we’re uncertain about. We would like to explore these further.
Spillover effects to other household members
It’s possible that improvements in well-being of StrongMinds participants lead to improvements in well-being of other individuals in their household. We had excluded these benefits in our initial analysis, and HLI’s work updated us toward believing these could be a substantial part of the benefits of therapy.
To estimate spillover effects of StrongMinds, HLI relies on three studies that measure spillovers from therapy given to caregivers or children with severe health issues:
- Mutamba et al. 2018a: This trial measured the effect of therapy to caregivers of children with nodding syndrome. Spillovers were assessed by comparing the effect of therapy on caregivers and the child with nodding syndrome. The study was non-randomized.
- Kemp et al. 2009: This trial measured the effect of eye movement desensitization and reprocessing for post-traumatic stress disorder from a motor vehicle accident among children 6-12 years old. Spillovers were assessed by comparing mental health among children vs. parents.
- Swartz et al. 2008: This trial measured the effect of interpersonal therapy for mothers of children with psychiatric illness. Spillovers were assessed by comparing effects on mothers to their children.
These three studies find a household member effect of 0.35 SDs (95% confidence interval, -0.04, 074), compared to 0.66 SDs for the recipient (95% confidence interval, 0.35, 0.97), or a benefit that’s 53% as large as the recipient’s benefits.
We think it’s possible this evidence leads to greater spillovers than we would expect from StrongMinds, though these are speculative:
- Mutamba et al. 2008 and Swartz et al. 2008 were oriented specifically toward caregivers having better relationships with children with severe health conditions. As a result, we may expect the effects on those children to be larger than children of StrongMinds recipients, since StrongMinds participants may not focus as intensively on relationships with household members.
- Mutamba et al. 2008 and Swartz et al. 2008 look at therapy provided to caregivers of children with severe health issues and measure spillovers to children. It seems plausible that this would have a larger spillover effect than StrongMinds, since those children may rely on that caregiver more intensively for care, and therefore be more affected by changes in that caregiver’s depression scores, than household members of typical StrongMinds participants.
- In Mutamba et al. 2008 and Swartz et al. 2008, it seems possible children may also experience higher rates of treatment for their psychiatric conditions as a result of caregivers receiving therapy, which would confer direct benefits to non-recipients (in this case, children with nodding syndrome or psychiatric illness).
In addition, a recent blog post points out that the results of Kemp et al. 2009 show that parents' depression scores increased, rather than decreased, which should lower HLI’s estimates. HLI notes in a comment on this post that updating for this error lowers the spillover effect to 38%.
We also did a shallow review of correlational estimates and found a range of 5% to 60% across studies. We haven’t reviewed these studies in depth but view them as illustrative of a range of possible effect sizes.
-
Das et al. 2008 estimates that a one standard deviation change in mental health of household members is associated with a 22% to 59% of a standard deviation change in own mental health, across a sample of low- and middle-income countries.
-
Powdthavee and Vignoles 2008 find a one standard deviation increase in parents' mental distress in the previous year lowers life satisfaction in the current year by 25% of a standard deviation for girls, using a sample from the UK. Effects are smaller for boys.
-
Mendolia et al. 2018 find a standard deviation increase in partner’s life satisfaction leads to a 5% of a standard deviation increase in individual life satisfaction, using data from Australia.
These correlations may overestimate the extent of spillovers if there are shocks that are common to the household driving this correlation, assortative matching based on life satisfaction, or genetic transmission of life satisfaction scores within households. The authors control for some of these (consumption, physical health indicators), but it’s possible there are unobserved differences driving the correlation. These also do not account for assortative matching or genetic transmission of life satisfaction. On the other hand, measurement error in life satisfaction scores could bias the relationship downward.
Our best guess is that spillovers to other household members is 15%, but we don’t feel very confident and think new research could update us a lot.
We think additional research on StrongMinds’ costs could lead us to higher or lower estimates of program cost.
We would be interested in exploring ways to fund further research to understand the extent to which improvements in depression scores or life satisfaction measures of StrongMinds participants lead to improvements in these outcomes for others in the household.
Household size
The extent of spillovers also depends on the number of individuals in StrongMinds participants’ households.
HLI estimates household size using data from the Global Data Lab and UN Population Division. They estimate a household size of 5.9 in Uganda based on these data, which appears to be driven by high estimates for rural household size in the Global Data Lab data, which estimate a household size of 6.3 in rural areas in 2019. A recent Uganda National Household Survey, on the other hand, estimates household size of 4.8 in rural areas.
We’re not sure what’s driving differences in estimates across these surveys, but our best guess is that household size is smaller than the 5.9 estimate HLI is using.
We would also be interested in understanding what may be driving differences in estimates and whether it’s possible to collect data directly on household size for women participating in StrongMinds program, since these data could potentially be collected cheaply and provide a meaningful update on the extent of spillovers.
Effect of depression on life satisfaction
HLI’s estimates of the effect of StrongMinds are in terms of SD-years of improvement in mental health measures like depression scores.
To translate these measures into life satisfaction, HLI assumes that (i) 1 SD improvement in depression scores is equivalent to 1 SD improvement in life satisfaction scores in trials of the effect of psychotherapy programs similar to StrongMinds and (ii) the SD in life satisfaction among StrongMinds recipients is equal to the SD in life satisfaction among a pooled average of individuals in low-, middle-, and high-income countries.
We apply a 90% adjustment to assumption (i) to account for the possibility that improvements in depression scores do not translate 1:1 to improvements in life satisfaction scores. This is based on:
-
HLI’s review of five therapeutic interventions that report effects on subjective well-being measures and depression. This finds a ratio in effects of 0.89 SD.
-
Our prior that there may be conceptual reasons why depression scores and life satisfaction might not map 1:1 onto each other. The highest/worst values on depression scales correspond to the most severe cases of depression. It seems likely that having the highest score on a depression scale would correspond to a life satisfaction score of 0. However, it’s less clear that this applies on the other end of the scale. Those who have low scores on depression scales have an absence of depressive symptoms. These individuals likely have a higher life satisfaction, but it’s not obvious that the absence of depressive symptoms corresponds to a life satisfaction of 10. If absence of depression means people are completely satisfied with their lives, then it makes sense to scale in this way. But if high life satisfaction requires not just the absence of depressive symptoms but something more, then this approach seems less plausible. We’re uncertain about this line of reasoning, though, and would be interested in direct evidence on the effect of IPT-G or similar programs on life satisfaction measures.
We apply an 80% adjustment to assumption (ii). This is because it seems likely that SD in life satisfaction score is lower among StrongMinds recipients, who are screened for depression at baseline and therefore may be more concentrated at the lower end of the life satisfaction score distribution than the average individual.
For both of these adjustments, we’re unsure about any non-linearities in the relationship between improvements in depression and improvements in life satisfaction. For example, it’s possible that going from severely depressed to moderately depressed leads to a larger than 1:1 increase in life satisfaction measures.
Because adjustments here are highly subjective, we would be open to considering collecting more evidence on this question. A potential approach would be to include surveys on life satisfaction, in addition to depression measures and other mental health scores, in subsequent studies of IPT-G. It may also be possible to explore whether existing datasets allow estimating SD in life satisfaction separately for individuals classified as depressed at baseline vs. not.
Effects at scale and outside of trial contexts
HLI does not include discounts for StrongMinds having a smaller effect when implemented at a larger scale and outside of trial contexts.
Our general expectation is that programs implemented as part of randomized trials are higher quality than similar programs implemented at scale. We would guess that the dominant factor here is that it is difficult to maintain quality of services as an organization scales. This seems particularly relevant for a program that relies on trained practitioners, such as interpersonal group therapy. It's plausible that as StrongMinds scales up its program in the real world, the quality of implementation will decrease relative to the academic trials.
For example, HLI notes that StrongMinds uses a reduced number of sessions and slightly reduced training, compared to Bolton (2003), which its program is based on. We think this type of modification could reduce program effectiveness relative to what is found in trials. However, we have not done a side-by-side of training, session duration, or other program characteristics of StrongMinds compared to other programs in HLI’s full meta-analysis.
We can also see some evidence for lower effects in larger trials:
- Thurman et al. 2017 finds no effect of IPT-G and suggests that one reason for this might be that the study was conducted following rapid program scale-up (unlike the Bolton et al. 2017 trials).
- In the studies included in HLI’s meta-analysis, larger trials tend to find smaller effects. This could be consistent with either smaller effects at scale or publication bias.
We would be eager to see studies that measure the effect of StrongMinds, as it is currently implemented, directly and think the ongoing trial from Baird and Ozler will provide a useful data point here. We’re also interested in learning more about the findings from StrongMinds' RCT and how the program studied in that RCT compares to its typical program.
In addition, we would be interested in understanding how StrongMinds’ costs might change if it were to expand (see below).
Social desirability bias
One major concern we have with these studies is that participants might report a lower level of depression after the intervention because they believe that is what the experimenter wants to see (more detail in footnote). This is a concern because the depression outcomes in therapy programs are self-reported (i.e. participants answer questions regarding their own mental health before and after the intervention).
HLI responded to this criticism and noted that studies that try to assess experimenter-demand effects typically find small effects. These studies test how much responses to questions about depression scores (or other mental health outcomes) change when the surveyor says they expect a particular response (either higher or lower score).
We’re not sure these tests would resolve this bias so we still include a downward adjustment (80% adjustment factor).
Our guess is that individuals who have gone through IPT-G programs would still be inclined to report having lower depression scores and better mental health on a survey that is related to the IPT-G program they received. If the surveyor told them they expected the program to worsen their mental health or improve their mental health, it seems unlikely to overturn whatever belief they had about the program’s expected effect that was formed during their group therapy sessions. This is speculative, however, and we don’t feel confident in this adjustment.
We also guess this would not detect bias arising from individuals changing their responses in order to receive treatment subsequently (or allowing others to do so), though we’re unsure how important this concern is or how typical this is of other therapy interventions included in HLI’s meta-analysis.
We would be interested in speaking more to subject matter experts about ways to detect self-reporting bias and understand possible magnitude.
Publication bias
HLI’s analysis includes a roughly 10% downward adjustment for publication bias in the therapy literature relative to cash transfers literature. We have not explored this in depth but guess we would apply a steeper adjustment factor for publication bias in therapy relative to our top charities.
After publishing its cost-effectiveness analysis, HLI published a funnel plot showing a high level of publication bias, with well-powered studies finding smaller effects than less-well-powered studies. This is qualitatively consistent with a recent meta-analysis of therapy finding a publication bias of 25%.
We roughly estimate an additional 15% downward adjustment (85% adjustment) to account for this bias. We may look into this further if we prioritize more work on StrongMinds by speaking to researchers, HLI, and other experts and by explicitly estimating publication bias in this literature.
Main effect of StrongMinds
We undertook a shallow review of the evidence for IPT-G prior to reviewing HLI’s analysis. Because we ended up with a similar best guess on effect size, we did not prioritize further review. There are several key questions we have not investigated in depth:
- How much weight should we put on different studies? In our shallow review, we rely on three RCTs that tested the impact of IPT-G on depression in a low- and middle-income country context (Bolton et al. 2003, Bolton et al. 2007, Thurman et al. 2017) and broader meta-analysis of psychotherapy programs across low-income and non-low-income countries. HLI uses Thurman et al. 2017, Bolton et al. 2007, and Bolton et al. 2003, studies of StrongMinds, and a meta-regression of indirect evidence. We’re not sure how much to weight these pieces of evidence to generate a best guess for the effect of StrongMinds in countries where it would operate with additional funding.
- How do Bolton et al. 2003, Bolton et al. 2006, Thurman et al. 2017, and the programs included in HLI’s meta-analysis vary from StrongMinds program, in terms of the program being delivered and target population, and how should that affect how much we generalize results? A key piece of the assessment of how much weight to put on different trials is the similarity in program type and target population. We have not done a thorough review of study populations (e.g., the extent to which different trials targeted women with depression at baseline, like StrongMinds) and programs (e.g., number of sessions, level of training, group size, etc.).
- What interventions did control groups receive? It’s possible that counterfactual treatment varied across studies. If control groups received some type of effective treatment, this could bias effects downward.
- Would we come to the same conclusions if we replicated HLI’s meta-analysis? We have not vetted its analysis of the studies it uses in its meta-analysis, and it’s possible further work could uncover changes.
We think it’s possible that further review of these questions could lead to changes in our best guess on the main effects of StrongMinds and similar programs on depression scores.
Durability of benefits
HLI estimates durability of benefits by fitting a decay model of the effects of therapy programs over time, based on studies of the effect of therapy at different follow-up periods. HLI estimates that effects persist up to five years, based on programs it deems similar to StrongMinds. To the best of our knowledge, there are no long-term follow-up studies (beyond 15 months) of IPT-G in low-income countries specifically.
We do think it’s plausible that lay-person-delivered therapy programs can have persistent long-term effects, based on recent trials by Bhat et al. 2022 and Baranov et al. 2020.
However, we’re somewhat skeptical of HLI’s estimate, given that it seems unlikely to us that a time-limited course of group therapy (4-8 weeks) would have such persistent effects. We also guess that some of the factors that cause StrongMinds’ program to be less effective than programs studied in trials (see above) could also limit how long the benefits of the program endure. As a result, we apply an 80% adjustment factor to HLI’s estimates.
We view this adjustment as highly speculative, though, and think it’s possible we could update our view with more work. We also expect the forthcoming large-scale RCT of StrongMinds in Uganda by Sarah Baird and Berk Ozler, which will measure follow-up at 2 years, could provide an update to these estimates.
Costs
HLI’s most recent analysis includes a cost of $170 per person treated by StrongMinds, but StrongMinds cited a 2022 figure of $105 in a recent blog post and said it expects costs to decline to $85 per person treated by the end of 2024.
We would be interested in learning more about StrongMinds’ costs and understanding what may be driving fluctuations over time and whether these are related to program impact (e.g., in-person or teletherapy, amount of training).
We are also interested in understanding whether to value volunteers’ time, since StrongMinds relies on volunteers for many of its models.
Additional considerations
-
Potential unmodeled upsides: There may be additional benefits of StrongMinds’ programs that our model is excluding. An example is advocacy for improved government mental health policies by StrongMinds recipients.
-
Implications for cost-effectiveness of other programs: HLI’s analysis has updated us toward putting more weight on household spillover effects of therapy and to consider putting at least some weight on subjective well-being measures in assessing the benefits of therapy. It’s possible that incorporating both of these could cause us to increase our estimates of cost-effectiveness of other morbidity-averting programs (e.g., cataract surgery, fistula surgery, clubfoot), since they may also benefit from within-household spillovers or look better under a subjective well-being approach.
-
Measures of grief: We have not prioritized an in-depth review of the effects of grief on life satisfaction, since this seems relatively unlikely to change the bottom line in our current analysis. We are taking HLI’s estimates at face value for now.
Plausibility
Stepping back, we also think HLI’s estimates of the cost-effectiveness of StrongMinds seem surprisingly large compared to other benchmarks, which gives us some additional reservations about this approach.
Because we’re uncertain about the right way to trade off improvements in subjective well-being from therapy vs. other interventions like cash transfers and averting deaths, we think it’s useful to compare against other perspectives. This includes:
-
Examining the trade-offs between offering StrongMinds, averting a death, and providing unconditional cash transfers: HLI’s estimates imply that offering 17 recipients StrongMinds is as valuable as averting a death from malaria and that offering 19 recipients StrongMinds is as valuable as averting an under-5 death from malaria. HLI’s estimates also imply that providing someone a $1,000 cash transfer would be _less _valuable to them than offering StrongMinds. These feel like unintuitive trade-offs that beneficiaries and donors would be unlikely to want to make. We acknowledge that this type of reasoning has limitations: It’s not obvious we should defer to whatever trade-offs we’d expect individuals to make (even if we knew individuals’ preferences) or that individuals are aware of what would make them the best off (e.g., individuals might not prefer bed nets at the same rate as our cost-effectiveness analysis implies).
-
Comparing the benefits of IPT-G to an additional year of life. HLI’s estimates imply that receiving IPT-G is roughly 40% as valuable as an additional year of life per year of benefit or 80% of the value of an additional year of life total. This feels intuitively high.
-
Comparing HLI’s estimates of grief from deaths averted to impact of StrongMinds: HLI estimates that each death prevented by AMF causes a gain of 7 WELLBYs that would have been lost due to grief. It estimates that StrongMinds causes a gain of 13 WELLBYs. This is nearly twice the benefits of averting the grief over someone’s death, which seems intuitively high. We have not dug deeply into evidence on grief effects on life satisfaction but think the current comparison seems implausible.
We’re uncertain about how much weight to put on these considerations, since these trade-offs are challenging to assess, but they seem unintuitive to us and influence our belief that StrongMinds is less cost-effective than HLI estimates.
Cost-effectiveness using our moral weights, rather than a subjective well-being approach
The above analysis focuses on estimating cost-effectiveness under a subjective well-being approach. Our bottom line is similar if we use our current moral weights.
HLI argues for using subjective well-being measures like life satisfaction scores to compare outcomes like averting a death, increasing consumption, and improving mental health through psychotherapy.
We think there are important advantages to this approach:
-
Subjective well-being measures provide an independent approach to assessing the effect of charities. The subjective well-being approach relies on measures that we have not previously used (i.e., life satisfaction scores) and provides a distinct and coherent methodology for establishing the goodness of different interventions. How we value charities that improve different outcomes, such as increasing consumption or averting death, are one of the most uncertain parts of our process of selecting cost-effective charities, and we believe we will reach more robust decisions if we consider multiple independent lines of reasoning.
-
These measures capture a relevant outcome. We think most would agree that subjective well-being is an important component of overall well-being. Measuring effects that interventions have on changes in life satisfaction may be a more accurate way to assess impacts on subjective well-being than using indirect proxies, such as increases in income.
-
The subjective well-being approach is empirical. It seems desirable for a moral weights approach to be able to change based on new research or facts about a particular context. The subjective well-being approach can change based on, for example, new studies about the effect of a particular intervention on life satisfaction.
We’re unsure what approach we should adopt for morbidity-averting interventions. We’d like to think further about the pros and cons of the subjective well-being approach and also the extent to which disability-adjusted life years may fail to capture some of the benefits of therapy (or other morbidity-averting interventions).
In this case, however, using a subjective well-being approach vs. our current moral weights does not make a meaningful difference in cost-effectiveness. If we use disability-adjusted life years instead of subjective well-being (i.e., effect on life satisfaction scores), we estimate StrongMinds is roughly 20% as cost-effective as a grant to AMF that is 10 times as cost-effective as unconditional cash transfers.
Our next steps
We may prioritize further work on StrongMinds in the future to try to narrow some of our major uncertainties on this program. This may include funding additional studies, conducting additional desk-based research, and speaking with experts.
We should first prioritize the following:
- Reviewing the forthcoming large-scale RCT of StrongMinds in Uganda by Sarah Baird and Berk Ozler, as well as a recent (unpublished) RCT by StrongMinds
- Speaking to StrongMinds, Happier Lives Institute, researchers, and other subject matter experts about the key questions we’ve raised
Beyond that, we would consider:
- Exploring ways to fund research on spillover effects and on effects on life satisfaction directly, potentially as part of ongoing trials or new trials
- Exploring data collection on household size among StrongMinds participants
- Learning more about program costs from StrongMinds
- Conducting additional desk research that may inform adjustments for social desirability bias, publication bias, effects on grief, and duration of benefits of StrongMinds
- Considering whether to incorporate subjective well-being measures directly into our moral weights and how much weight we would put on a subjective well-being approach vs. our typical approach in our assessment of StrongMinds
- Considering how much weight to put on plausibility checks, potentially including additional donor surveys to understand where they fall on questions about moral intuitions
- Considering research to measure effect of StrongMinds or other therapy programs on life satisfaction directly
- Exploring how this might change our assessment of other programs addressing morbidity (because, e.g., they also have spillover effects or they also look more cost-effective under a subjective well-being approach) and consider collecting data on the effect on life satisfaction of those programs as well
Sources
| Title |
Link |
| American Psychological Association, Hamilton Depression Rating Scale (HAM-D) |
https://www.apa.org/depression-guideline/hamilton-rating-scale.pdf |
| Baranov et al. 2020 |
https://doi.org/10.1257/aer.20180511 |
| Bhat et al. 2022 |
https://doi.org/10.1257/rct.3823-1.0 |
| Bolton et al. 2003 |
https://doi.org/10.1001/jama.289.23.3117 |
| Bolton et al. 2007 |
https://doi.org/10.1001/jama.298.5.519 |
| Bright Futures, Center for Epidemiological Studies Depression Scale for Children (CES-DC) |
https://www.brightfutures.org/mentalhealth/pdf/professionals/bridges/ces_dc.pdf |
| Cuijpers et al. 2010 |
https://doi.org/10.1017/S0033291709006114 |
| Cuijpers et al. 2016 |
https://doi.org/10.1176/appi.ajp.2015.15091141 |
| Das et al. 2008 |
https://doi.org/10.1093/wber/lhn010 |
| Donaldson et al. 2020 |
https://forum.effectivealtruism.org/posts/xgxzCkpKQsPwrd5W7/using-subjective-well-being-to-estimate-the-moral-weights-of-2 |
| Driessen et al. 2015 |
https://www.ncbi.nlm.nih.gov/pmc/articles/PMC4589340/pdf/pone.0137864.pdf |
| GiveWell, 2020 update on GiveWell's moral weights |
https://docs.google.com/document/d/1hOQf6Ug1WpoicMyFDGoqH7tmf3Njjc15Z1DGERaTbnI/edit#heading=h.82utnglspame |
| GiveWell, December 2022 copy of HLI's v3 AMF BOTEC (and sensitivity to different views) |
https://docs.google.com/spreadsheets/d/1ESXTA9kD5aYJb8_dKgMsHxJralL1RaS8q7V4zSoOkyY/edit#gid=2083362429&range=D2 |
| GiveWell, edited copy of HLI's TherapyInterventionsData |
https://docs.google.com/spreadsheets/d/11EX5dNZdK9-kNXHhXUXdOnqItaFaO0AA2ITHcM_jr-A/edit#gid=200587636 |
| GiveWell, IPT-G RCTs: Choice of informal meta-analysis weights |
https://docs.google.com/document/d/1gVxVoAeZoRVG2nGeI0B_6h0saJKmjNz_K7cmpSoRCI4/edit |
| GiveWell, Subjective well-being evaluation of StrongMinds [2023] |
https://docs.google.com/spreadsheets/d/1YVDOLOdtSTwOd3fPaGkdl5OOEJlbho-9j9vc7TvX1kk/edit#gid=605819695 |
| GiveWell, SWB 2023 update_Copy of 2022 GiveWell cost-effectiveness analysis — version 5 (public) |
https://docs.google.com/spreadsheets/d/1kjNMZdNVj4cZuTTMAosfAtAtFwxNr-4S_PIgpcWVys8/edit#gid=1070538669 |
| GiveWell, SWB 2023_IPT-G effect size in standard deviations |
https://docs.google.com/spreadsheets/d/1MJbT2P6OQ8n3DkVvCf1ez1XITuhxm0A6KZ7DONalALY/edit#gid=0 |
| GiveWell, SWB_Deaths and life satisfaction BOTEC |
https://docs.google.com/spreadsheets/d/1_GlmfFMTSb-Kj_R1walcyhYYbOgWBlmDV2Ox-1dOPTw/edit#gid=520247736&range=A94 |
| Global Data Lab, Average household size, accessed March 8, 2023. |
https://globaldatalab.org/areadata/table/hhsize/KEN+UGA/?levels=1+2+3 |
| Happier Lives Institute, "Cost-effectiveness analysis: Group or task-shifted psychotherapy to treat depression," 2021 |
https://www.happierlivesinstitute.org/wp-content/uploads/2022/04/Psychotherapy-CEA.pdf |
| Happier Lives Institute, "Cost-effectiveness analysis: StrongMinds," October 2021 |
https://www.happierlivesinstitute.org/wp-content/uploads/2022/04/StrongMinds-CEA.pdf |
| Happier Lives Institute, "Happiness for the whole family: Accounting for household spillovers when comparing the cost-effectiveness of psychotherapy to cash transfers," February 2022 |
https://www.happierlivesinstitute.org/wp-content/uploads/2022/04/Happiness-for-the-whole-family.pdf |
| Happier Lives Institute, "The elephant in the bednet: the importance of philosophy when choosing between extending and improving lives," 2022 |
https://www.happierlivesinstitute.org/report/the-elephant-in-the-bednet/ |
| Happier Lives Institute, Copy of 2022 GiveWell (saving) CEA v4 |
https://docs.google.com/spreadsheets/d/1lDUxIYssnZVWHq3PLjNt2kNw075YfcGiHQoFaNkd5KM/edit#gid=1364064522 |
| Happier Lives Institute, Depression to LS |
https://docs.google.com/spreadsheets/d/1_ErgKPSNinrbc0oFDiJfqDncUI0rtinhw6kGazwAS_o/edit?usp=sharing |
| Happier Lives Institute, TherapyInterventionsData |
https://docs.google.com/spreadsheets/d/1XAGgIazfVGEtxwF_c7IDybyp4xPFJICl1hKdBnMRsYE/edit?usp=sharing |
| Happier Lives Institute, V3 AMF BOTEC (and sensitivity to different views) |
https://docs.google.com/spreadsheets/d/15Mm_wjZCbInW7HlmdRLb_8BB4KXtIZTRrlgaHifx8wY/edit#gid=1045478457 |
| Joel McGuire, Research Analyst, Happier Lives Institute, comment on EA Forum article "Evaluating StrongMinds: how strong is the evidence?", 2023 |
https://forum.effectivealtruism.org/posts/HqEmL7XAuuD5Pc4eg/evaluating-strongminds-how-strong-is-the-evidence?commentId=gtLgSMD8NjohTZtQM |
| Kemp et al. 2009 |
https://doi.org/10.1093/wber/lhn010 |
| Makerere University School of Public Health, "Family Based Group Interpersonal Psychotherapy for Caregivers of Children with Nodding Syndrome," 2014 [video] |
https://www.youtube.com/watch?v=RQ2eYn-J8w8 |
| Mayberry, "AMA: Sean Mayberry, Founder & CEO of StrongMinds," November 2022 |
https://forum.effectivealtruism.org/posts/82heDPsmvhThda3af/ama-sean-mayberry-founder-and-ceo-of-strongminds |
| Mendolia et al. 2018 |
https://docs.iza.org/dp11431.pdf |
| Morina et al. 2017 |
https://DOI.org/10.1002/da.22618 |
| Mutamba et al. 2008 |
https://doi.org/10.1017/S0033291718000193 |
| Mutamba et al. 2018a |
https://doi.org/10.1017/S0033291718000193 |
| Mutamba et al. 2018b |
https://implementationscience.biomedcentral.com/articles/10.1186/s13012-018-0785-y |
| OECD Guidelines on Measuring Subjective Well-Being: Annex A |
https://doi.org/10.1787/9789264191655-en |
| Oswald and Powdthavee 2008 |
https://www.zora.uzh.ch/id/eprint/52349/1/iewwp396.pdf |
| Ozler and Baird, "Using Group Interpersonal Psychotherapy to Improve the Well-Being of Adolescent Girls," (ongoing) |
https://clinicaltrials.gov/ct2/show/NCT03966833 |
| Patient, Patient Health Questionnaire (PHQ-9) |
https://patient.info/doctor/patient-health-questionnaire-phq-9 |
| Plant and McGuire, "Donating money, buying happiness: new meta-analyses comparing the cost-effectiveness of cash transfers and psychotherapy in terms of subjective well-being," 2021 |
https://forum.effectivealtruism.org/posts/mY4pZSwvFCDsjorJX/donating-money-buying-happiness-new-meta-analyses-comparing |
| Powdthavee and Vignoles 2008 |
https://DOI.org/10.1007/s11205-007-9223-2 |
| Snowden, "Why I don’t agree with HLI’s estimate of household spillovers from therapy," February 24, 2023 |
https://forum.effectivealtruism.org/posts/gr4epkwe5WoYJXF32/why-i-don-t-agree-with-hli-s-estimate-of-household |
| StrongMinds, "Big Win For Mental Health in Uganda's schools," 2022 |
https://strongminds.org/big-win-for-mental-health-in-ugandas-schools/?blm_aid=21531 |
| StrongMinds, "Impact Evaluation: End of Phase Two Impact Evaluation for the Treating Depression at Scale in Africa Program in Uganda," July 2015 |
https://strongminds.org/wp-content/uploads/2013/07/StrongMinds-Phase-Two-Impact-Evaluation-Report-July-2015-FINAL.pdf |
| StrongMinds, "Our Model at Work" |
https://strongminds.org/our-model/ |
| StrongMinds, "StrongMinds FAQs" |
https://strongminds.org/strongminds-faqs/ |
| StrongMinds, Q4 2022 Report |
https://strongminds.org/wp-content/uploads/2023/03/2022-Q4-report-8.5x11-FINAL.pdf |
| Swartz et al. 2008 |
https://doi.org/10.1176/appi.ajp.2008.07081339 |
| The GiveWell Blog, "Sequence thinking vs. cluster thinking," 2014 |
https://blog.givewell.org/2014/06/10/sequence-thinking-vs-cluster-thinking/ |
| Thurman et al. 2017 |
https://doi.org/10.1111/camh.12241 |
| Uganda Bureau of Statistics, Uganda National Household Survey 2019/2020 |
https://www.ubos.org/wp-content/uploads/publications/09_2021Uganda-National-Survey-Report-2019-2020.pdf |
| United Nations, Database on Household Size and Composition 2022 |
https://www.un.org/development/desa/pd/data/household-size-and-composition |
Notes

Joel’s response
[Michael's response below provides a shorter, less-technical explanation.]
Summary
Alex’s post has two parts. First, what is the estimated impact of StrongMinds in terms of WELLBYs? Second, how cost-effective is StrongMinds compared to the Against Malaria Foundation (AMF)? I briefly present my conclusions to both in turn. More detail about each point is presented in Sections 1 and 2 of this comment.
The cost-effectiveness of StrongMinds
GiveWell estimates that StrongMinds generates 1.8 WELLBYs per treatment (17 WELLBYs per $1000, or 2.3x GiveDirectly[1]). Our most recent estimate[2] is 10.5 WELLBYs per treatment (62 WELLBYs per $1000, or 7.5x GiveDirectly) . This represents a 83% discount (an 8.7 WELLBYs gap)[3] to StrongMinds effectiveness[4]. These discounts, while sometimes informed by empirical evidence, are primarily subjective in nature. Below I present the discounts, and our response to them, in more detail.
Figure 1: Description of GiveWell’s discounts on StrongMinds’ effect, and their source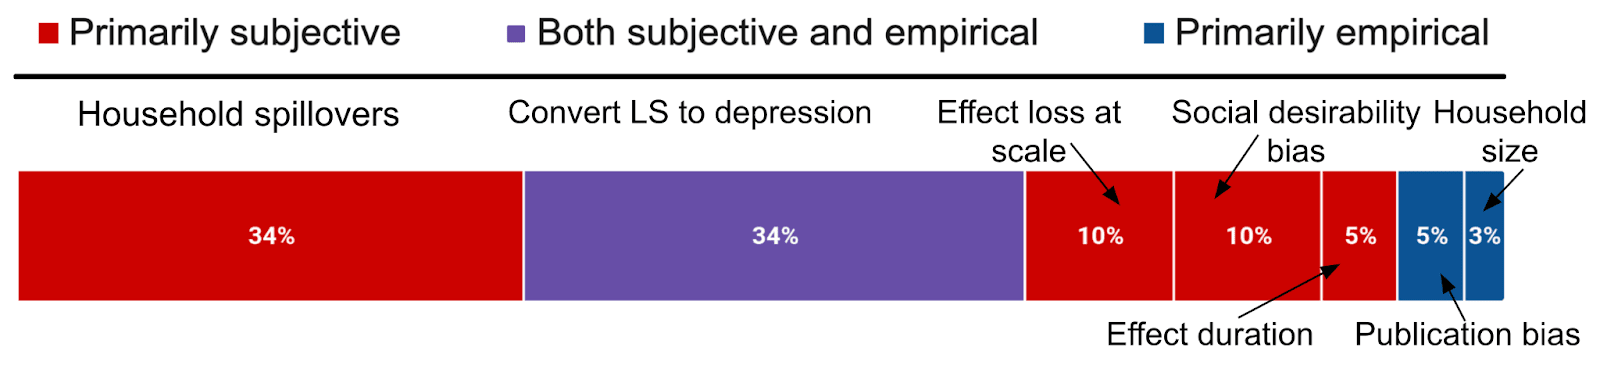
Notes: The graph shows the factors that make up the 8.7 WELLBY discount.
Table 1: Disagreements on StrongMinds per treatment effect (10.5 vs. 1.8 WELLBYs) and cost
How do we assess GiveWell’s discounts? We summarise our position below.
Figure 2: HLI’s views on GiveWell’s total discount of 83% to StrongMind’s effects
However, as Michael mentions in his comment, a general source of uncertainty we have is about how and when to make use of subjective discounts. We will make more precise claims about the cost-effectiveness of StrongMinds when we finalise our revision and expansion.
The cost-effectiveness of AMF
The second part of Alex's post is asking how cost-effective is StrongMinds compared to the Against Malaria Foundation (AMF)? AMF, which prevents malaria with insecticide treated bednets, is in contrast to StrongMinds, a primarily life-saving intervention. Hence, as @Jason rightly pointed out elsewhere in the comments, its cost-effectiveness strongly depends on philosophical choices about the badness of death and the neutral point (see Plant et al., 2022). GiveWell takes a particular set of views (deprivationism with a neutral point of 0.5) that are very favourable to life saving interventions. But there are other plausible views that can change the results, and even make GiveWell’s estimate of StrongMinds seem more cost-effective than AMF. Whether you accept our original estimate of StrongMinds, or GiveWell’s lower estimate, the comparison is still incredibly sensitive to these philosophical choices. I think GiveWell is full of incredible social scientists, and I admire many of them, but I'm not sure that should privilege their philosophical intuitions.
Further research and collaboration opportunities
We are truly grateful to GiveWell for engaging with our research on StrongMinds. I think we largely agree with GiveWell regarding promising steps for future research. We’d be keen to help make many of these come true, if possible. Particularly regarding: other interventions that may benefit from a SWB analysis, household spillovers, publication bias, the SWB effects of psychotherapy (i.e. not just depression), and surveys about views on the neutral point and the badness of death. I would be delighted if we could make progress on these issues, and doubly so if we could do so together.
1. Disagreements on the cost-effectiveness of StrongMinds
HLI estimates that psychotherapy produces 10.5 WELLBYs (or 62 per $1000, 7.5x GiveDirectly) for the household of the recipient, while GiveWell estimates that psychotherapy has about a sixth of the effect, 1.8 WELLBYs (17 per $1000 or 2.3x GiveDirectly[5]). In this section, I discuss the sources of our disagreement regarding StrongMinds in the order I presented in Table 1.
1.1 Household spillover differences
Household spillovers are our most important disagreement. When we discuss the household spillover effect or ratio we’re referring to the additional benefit each non-recipient member of the household gets, as a percentage of what the main recipient receives. We first analysed household spillovers in McGuire et al. (2022), which was recently discussed here. Notably, James Snowden pointed out a mistake we made in extracting some data, which reduces the spillover ratio from 53% to 38%.
GiveWell’s method relies on:
Table 2: HLI and GiveWell’s views on household spillovers of psychotherapy
Variable
HLI
GiveWell
Explains how much difference in SM’s effect (%)
Household spillover ratio for psychotherapy
38%
15%
3 WELLBYs (34% of total gap)
Note: The household spillover for cash transfers we estimated is 86%.
I reassessed the evidence very recently - as part of the aforementioned discussion with James Snowden - and Alex’s comments don’t lead me to update my view further. In my recent analysis, I explained that I think I should weigh the studies we previously used less because they do seem less relevant to StrongMinds, but I’m unsure what to use instead. And I also hold a more favourable intuition about household spillovers for psychotherapy, because parental mental health seems important for children (e.g., Goodman, 2020).
But I think we can agree that collecting and analysing new evidence could be very important here. The data from Barker et al. (2022), a high quality RCT of the effect of CBT on the general population in Ghana (n = ~7,000) contains information on both partners' psychological distress when one of them received cognitive behavioural therapy, so this data can be used to estimate any spousal spillover effects from psychotherapy. I am in the early stage of analysing this data[7]. There also seems to be a lot of promising primary work that could be done to estimate household spillovers alongside the effects of psychotherapy.
1.2 Conversion between measures, data sources, and units
The conversion between depression and life-satisfaction (LS) scores ties with household spillovers in terms of importance for explaining our disagreements about the effectiveness of psychotherapy. We’ve previously assumed that a one standard deviation (SD) decrease in depression symptoms (or affective mental health; MHa) is equivalent to a one SD improvement in life-satisfaction or happiness (i.e., a 1:1 conversion), see here for our previous discussion and rationale.
Givewell has two concerns with this:
Hence, GiveWell applied a 30% discount (see Table 4 below).
Table 3: HLI and GiveWell’s views on converting between SDs of depression and life satisfaction
HLI
GiveWell
Explains what difference in SM’s effect (%)
1 to 1
1 to 0.7
3 WELLBYs (34% of total)
Overall, I agree that there are empirical reasons for including a discount in this domain, but I’m unsure of its magnitude. I think it will likely be smaller than GiveWell’s 30% discount.
1.2.1 Differences between the two measures
First, GiveWell mentions a previous estimate of ours suggesting that mental health (MH) treatments[8] impact depression 11% more than SWB. Our original calculation used a naive average, but on reflection, it seems more appropriate to use a sample-size-weighted average (because of the large differences in samples between studies), which results in depression measures overestimating SWB measures by 4%, instead of 11%.
Results between depression and happiness measures are also very close in Bhat et al. (2022; n = 589), the only study I've found so far that looks at effects of psychotherapy on both types of measures. We can standardise the effects in two ways. Depending on the method, the SWB effects are larger by 18% or smaller by 1% than MHa effects[9]. Thus, effects of psychotherapy on depression appear to be of similar size as effects on SWB. Given these results, I think the discount due to empirical differences could be smaller than 10%, I would guess 3%.
Another part of this is that depression and life satisfaction are not the same concept. So if the scores are different, there is a further moral question about which deserves more weight. The HLI ‘house view’, as our name indicates, favours happiness (how good/bad we feel) as what matters. Further, we suspect that measures of depression are conceptually closer to happiness than measures of life satisfaction are. Hence, if push came to shove, and there is a difference, we’d care more about the depression scores, so no discount would be justified. From our conversation with Alex, we understand that the GiveWell ‘house view’ is to care more about life satisfaction than happiness. In this case, GiveWell would be correct, by their lights, to apply some reduction here.
1.2.2 Differences in variance
In addition to their 11% conversion discount, GiveWell adds another 20% discount because they think a sample of people with depression have a smaller variance in life satisfaction scores.[10] Setting aside the technical topic of why variance in variances matters, I investigated whether there are lower SDs in life satisfaction when you screen for baseline depression using a few datasets. I found that, if anything, the SDs are larger by 4% (see Table 4 below). Although I see the rationale behind GiveWell’s speculation, the evidence I’ve looked at suggests a different conclusion.
Table 4: Life-satisfaction SD depending on clinical mental health cutoff
LS SD for general pop
LS SD for dep pop
SWB SD change (gen → dep)
SWB measure
1.23
1.30
106%
LS 1-10
1.65
1.88
114%
LS 0-10
2.43
2.38
98%
LS 1-10
1.02
1.04
102%
LS (z-score)
Average change
1.58
1.65
104%
Note: BHPS = The British Household Panel Survey, HILDA = The Household Income and Labour Dynamics Survey, NIDS = National Income Dynamics Study. LS = life satisfaction, dep = depression.
However, I’m separately concerned that SD changes in trials where recipients are selected based on depression (i.e., psychotherapy) are inflated compared to trials without such selection (i.e., cash transfers)[11].
Overall, I think I agree with GiveWell that there should be a discount here that HLI doesn’t implement, but I’m unsure of its magnitude, and I think that it’d be smaller than GiveWell’s. More data could likely be collected on these topics, particularly how much effect sizes in practice differ between life-satisfaction and depression, to reduce our uncertainty.
1.3 Loss of effectiveness outside trials and at scale
GiveWell explains their concern, summarised in the table below:
“Our general expectation is that programs implemented as part of randomized trials are higher quality than similar programs implemented at scale. [...] For example, HLI notes that StrongMinds uses a reduced number of sessions and slightly reduced training, compared to Bolton (2003), which its program is based on.48 We think this typeof modification could reduce program effectiveness relative to what is found in trials. [...] We can also see some evidence for lower effects in larger trials…”
Table 5: HLI and GiveWell’s views on an adjustment for StongMind’s losing effectiveness at scale
Explains what difference in SM’s effect (%)
0.9 WELLBYs (10.1% of total gap)
While GiveWell provides several compelling reasons for why StongMinds efficacy will decrease as it scales, I can’t find the reason GiveWell provides for why these reasons result in a 25% discount. It seems like a subjective judgement informed by some empirical factors and perhaps from previous experience studying this issue (e.g., cases like No Lean Season). Is there any quantitative evidence that suggests that when RCT interventions scale they drop 25% in effectiveness? While GiveWell also mentions that larger psychotherapy trials have smaller effects, I assume this is driven by publication bias (discussed in Section 1.6). I’m also less sure that scaling has no offsetting benefits. I would be surprised if when RCTs are run, the intervention has all of its kinks ironed out. In fact, there’s many cases of the RCT version of an intervention being the “minimum viable product” (Karlan et al., 2016). While I think a discount here is plausible, I’m very unsure of its magnitude.
In our updated meta-analysis we plan on doing a deeper analysis of the effect of expertise and time spent in therapy, and to use this to better predict the effect of StrongMinds. We’re awaiting the results from Baird et al. which should better reflect their new strategy as StrongMinds trained but did not directly deliver the programme.
1.4 Disagreements on the durability of psychotherapy
GiveWell explains their concern summarised in the table below, “We do think it’s plausible that lay-person-delivered therapy programs can have persistent long-term effects, based on recent trials by Bhat et al. 2022 and Baranov et al. 2020. However, we’re somewhat skeptical of HLI’s estimate, given that it seems unlikely to us that a time-limited course of group therapy (4-8 weeks) would have such persistent effects. We also guess that some of the factors that cause StrongMinds’ program to be less effective than programs studied in trials (see above) could also limit how long the benefits of the program endure. As a result, we apply an 80% adjustment factor to HLI’s estimates. We view this adjustment as highly speculative, though, and think it’s possible we could update our view with more work.”
Table 6: HLI and GiveWell’s views on a discount to account for a decrease in durability
Explains what difference in SM’s effect (%)
Since this disagreement appears mainly based on reasoning, I’ll explain why my intuitions - and my interpretation of the data - differ from GiveWell here. I already assume that StrongMinds decays 4% more each year than does psychotherapy in general (see table 3). Baranov et al. (2020) and Bhat et al. (2022) both find long-term effects that are greater than what our general model predicts. This means that we already assume a higher decay rate in general, and especially for StrongMinds than the two best long-term studies of psychotherapy suggest. I show how these studies compare to our model in Figure 3 below.
Figure 3: Effects of our model over time, and the only long-term psychotherapy studies in LMICs
Edit: I updated the figure to add the StrongMinds model, which starts with a higher effect but has a faster decay.
Baranov et al. (2020, 16 intended sessions) and Bhat et al. (2022, 6-14 intended sessions, with 70% completion rate) were both time limited. StrongMinds historically used 12 sessions (it may be 8 now) of 90 minutes[12]. Therefore, our model is more conservative than the Baranov et al. result, and closer to the Bhat et al. which has a similar range of sessions. Another reason, in favour of the duration of StrongMinds, which I mentioned in McGuire et al. (2021), is that 78% of groups continued meeting on their own at least six months after the programme formally ended.
Bhat et al. (2022) is also notable in another regard: They asked ~200 experts to predict the impact of the intervention after 4.5 years. The median prediction underestimated the effectiveness by nearly 1/3rd, which makes me inclined to weigh expert priors less here[13].
Additionally, there seems to be something double-county in GiveWell’s adjustments. The initial effect is adjusted by 0.75 for “Lower effectiveness at scale and outside of trial contexts” and the duration effect is adjusted by 0.80, also for “lower effectiveness at scale and outside of trial contexts”. Combined this is a 0.55 adjustment instead of one 0.8 adjustment. I feel like one concern should show up as one discount.
1.5 Disagreements on social desirability bias[14]
GiveWell explains their concern, which is summarised in the table below: “One major concern we have with these studies is that participants might report a lower level of depression after the intervention because they believe that is what the experimenter wants to see [...] HLI responded to this criticism [section 4.4] and noted that studies that try to assess experimenter-demand effects typically find small effects.[...] We’re not sure these tests would resolve this bias so we still include a downward adjustment (80% adjustment factor).”
Table 7: HLI and GiveWell’s views on converting between SDs of depression and life satisfaction
Explains what diff in SM’s effect (%)
Participants might report bigger effects to be agreeable with the researchers (socially driven bias) or in the hopes of future rewards (cognitively driven bias; Bandiera et al., 2018), especially if they recognise the people delivering the survey to be the same people delivering the intervention[15].
But while I also worry about this issue, I am less concerned than GiveWell that response bias poses a unique threat to psychotherapy. Because if this bias exists, it seems likely to apply to all RCTs of interventions with self-reported outcomes (and without active controls). So I think the relevant question is why the propensity to response bias might differ between cash transfers and psychotherapy? Here are some possibilities:
GiveWell responded to the previous evidence I cited (McGuire & Plant, 2021, Section 4.4)[17] by arguing that the tests run in the literature, by investigating the effect of the general propensity towards socially desirable responding or the expectations of surveyor, are not relevant because: “If the surveyor told them they expected the program to worsen their mental health or improve their mental health, it seems unlikely to overturn whatever belief they had about the program’s expected effect that was formed during their group therapy sessions.” But, if participants' views about an intervention seem unlikely to be overturned by what the surveyor seems to want - when what the surveyor wants and the participant’s experience differs - then that’s a reason to be less concerned about socially motivated response bias in general.
However, I am more concerned with socially desirable responses driven by cognitive factors. Bandiera et al. (2018, p. 25) is the only study I found to discuss the issue, but they do not seem to think this was an issue with their trial: “Cognitive drivers could be present if adolescent girls believe providing desirable responses will improve their chances to access other BRAC programs (e.g. credit). If so, we might expect such effects to be greater for participants from lower socioeconomic backgrounds or those in rural areas. However, this implication runs counter to the evidence in Table A5, where we documented relatively homogenous impacts across indices and time periods, between rich/poor and rural/urban households.”
I agree with GiveWell that more research would be very useful, and could potentially update my views considerably, particularly with respect to the possibility of cognitively driven response bias in RCTs deployed in low-income contexts.
1.6 Publication bias
GiveWell explains their concern, which we summarise in the table below: “HLI’s analysis includes a roughly 10% downward adjustment for publication bias in the therapy literature relative to cash transfers literature. We have not explored this in depth but guess we would apply a steeper adjustment factor for publication bias in therapy relative to our top charities. After publishing its cost-effectiveness analysis, HLI published a funnel plot showing a high level of publication bias, with well-powered studies finding smaller effects than less-well-powered studies.57 This is qualitatively consistent with a recent meta-analysis of therapy finding a publication bias of 25%.”
Table 8: HLI and GiveWell’s views on a publication bias discount
Explains what diff in SM’s effect (%)
After some recent criticism, we have revisited this issue and are working on estimating the bias empirically. Publication bias seems like a real issue, where a 10-25% correction like what GiveWell suggests seems plausible, but we’re unsure about the magnitude as our research is ongoing. In our update of our psychotherapy meta-analysis we plan to employ a more sophisticated quantitative approach to adjust for publication bias.
1.7 Household size
GiveWell explains their concern, which we summarise in the table below: “HLI estimates household size using data from the Global Data Lab and UN Population Division. They estimate a household size of 5.9 in Uganda based on these data, which appears to be driven by high estimates for rural household size in the Global Data Lab data, which estimate a household size of 6.3 in rural areas in 2019. A recent Uganda National Household Survey, on the other hand, estimates household size of 4.8 in rural areas. We’re not sure what’s driving differences in estimates across these surveys, but our best guess is that household size is smaller than the 5.9 estimate HLI is using.”
Table 9: HLI and GiveWell’s views on household size of StrongMind’s recipients
Explains what diff in SM’s effect (%)
I think the figures GiveWell cites are reasonable. I favour using international datasets because I assume it means greater comparability between countries, but I don’t feel strongly about this. I agree it could be easy and useful to try and understand StrongMinds recipient’s household sizes more directly. We will revisit this in our StrongMinds update.
1.8 Cost per person of StrongMinds treated
The one element where we differ that makes StrongMinds look more favourable is cost. As GiveWell explains “HLI’s most recent analysis includes a cost of $170 per person treated by StrongMinds, but StrongMinds cited a 2022 figure of $105 in a recent blog post”
Table 10: HLI and GiveWell’s views on cost per person for StrongMind’s treatment
According to their most recent quarterly report, a cost per person of $105 was the goal, but they claim $74 per person for 2022[18]. We agree this is a more accurate/current figure, and the cost might well be lower now. A concern is that the reduction in costs comes at the expense of treatment fidelity – an issue we will review in our updated analysis.
2. GiveWell’s cost-effectiveness estimate of AMF is dependent on philosophical views
GiveWell estimates that AMF produces 70 WELLBYs per $1000[19], which would be 4 times better than StrongMinds. GiveWell described the philosophical assumptions of their life saving analysis as: “...Under the deprivationist framework and assuming a “neutral point” of 0.5 life satisfaction points. [...] we think this is what we would use and it seems closest to our current moral weights, which use a combination of deprivationism and time-relative interest account."
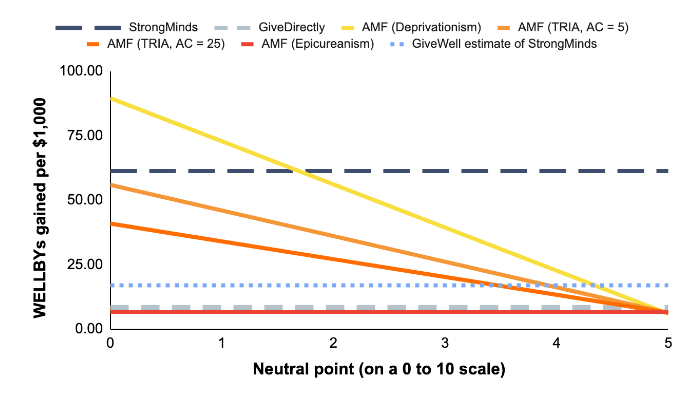
Hence, they conclude that AMF produces 70 WELLBYs per $1000, which makes StrongMinds 0.24 times as cost-effective as AMF. However, the position they take is nearly the most favourable one can take towards interventions that save lives[20]. But there are other plausible views about the neutral point and the badness of death (we discuss this in Plant et al., 2022). Indeed, assigning credences to higher neutral points[21] or alternative philosophical views of death’s badness will reduce the cost-effectiveness of AMF relative to StrongMinds (see Figure 3). In some cases, AMF is less cost-effective than GiveWell’s estimate of StrongMinds[22].
Figure 4: Cost-effectiveness of charities under different philosophical assumptions (with updated StrongMinds value, and GiveWell’s estimate for StrongMinds)
To be clear, HLI does not (yet) take a stance on these different philosophical views. While I present some of my views here, these do not represent HLI as a whole.
Personally, I’d use a neutral point closer to 2 out of 10[23]. Regarding the philosophy, I think my credences would be close to uniformly distributed across the Epicurean, TRIA, and deprivationist views. If I plug this view into our model introduced in Plant et al. (2022) then this would result in a cost-effectiveness for AMF of 29 WELLBYs per $1000 (rather than 81 WELLBYs per $1000)[24], which is about half as good as the 62 WELLBYs per $1000 for StrongMinds. If GiveWell held these views, then AMF would fall within GiveWell’s pessimistic and optimistic estimates of 3-57 WELLBYs per $1000 for StrongMinds’ cost-effectiveness. For AMF to fall above this range, you need to (A) put almost all your credence in deprivationism and (B) have a neutral point lower than 2[25].
Coincidently, this is (barely) within our most recent confidence interval for comparing the cost-effectiveness of StrongMinds to GiveDirectly (95% CI: 2, 100).
This calculation is based on a correction for a mistake in our spillover ratio discussed here (a spillover ratio of 38% instead of 53%). Our previous estimate was 77 WELLBYs per $1000 (Plant et al., 2022; McGuire et al., 2022).
The discount on the effect per $1000 is smaller because GiveWell used a 38% smaller cost figure.
Note that the reduction in cost-effectiveness is only 27% because they also think that the costs are 62% smaller.
Coincidently, this is (barely) within our most recent confidence interval for comparing the cost-effectiveness of StrongMinds to GiveDirectly (95% CI: 2, 100).
The text and the table give different values.
But if you want to accept that the results could be very off, see here for a document with tables with my very preliminary results.
These are positive psychology interventions (like mindfulness and forgiveness therapy) which might not completely generalise to psychotherapy in LMICs.
Psychotherapy improved happiness by 0.38 on a 1-10 score and reduced depression by 0.97 (on the PHQ-9’s 0-27 scale). If we convert the depression score to a 1-10 scale, using stretch transformation, then the effect is a reduction in depression of 0.32. Hence, the SWB changes are 18% larger than MHa changes. If we convert both results to Cohen’s d, we find a Cohen’s d of 0.167 for depression and a Cohen’s d of 0.165 for happiness. Hence changes in MHa are 1% greater than SWB.
“it seems likely that SD in life satisfaction score is lower among StrongMinds recipients, who are screened for depression at baseline46 and therefore may be more concentrated at the lower end of the life satisfaction score distribution than the average individual.”
Sample selection based on depression (i.e., selection based on the outcome used) could shrink the variance of depression scores in the sample, which would inflate standardised effects sizes of depression compared to trials without depression selection, because standardisation occurs by dividing the raw effect by its standard deviation (i.e., standardised mean differences, such as Cohen’s d). To explore this, I used the datasets mentioned in Table 4, all of which also included measures of depression or distress and the data from Barker et al. (2022, n = 11,835). I found that the SD of depression for those with clinically significant depression was 18 to 21% larger than it was for the general sample (both the mentally ill and healthy). This seems to indicate that SD changes from psychotherapy provide inflated SD changes in depression compared to cash transfers, due to smaller SDs of depression. However, I think this may be offset by another technical adjustment. Our estimate of the life-satisfaction SD we use to convert SD changes (in MHa or SWB) to WELLBYs might be larger, which means the effects of psychotherapy and cash transfers are underestimated by 14% compared to AMF. When we convert from SD-years to WELLBYs we’ve used a mix of LMIC and HIC sources to estimate the general SD of LS. But I realised that there’s a version of the World Happiness Report that published data that included the SDs of LS for many countries in LMICs. If we use this more direct data for Sub-Saharan Countries then it suggests a higher SD of LS than what I previously estimated (2.5 instead of 2.2, according to a crude estimate), a 14% increase.
In one of the Bhat et al. trials, each session was 30 to 45 minutes (it’s unclear what the session length was for the other trials).
Note, I was one of the predictors, and my guess was in line with the crowd (~0.05 SDs), and you can’t see others' predictions beforehand on the Social Science Prediction Platform.
Note, this is more about ‘experimenter demand effects’ (i.e., being influenced by the experimenters in a certain direction, because that’s what they want to find) than ‘socially desirability bias’ (i.e., answering that one is happier than they are because it looks better). The latter is controlled for in an RCT. We keep the wording used by GW here.
GiveWell puts it in the form of this scenario “If a motivated and pleasant IPT facilitator comes to your village and is trying to help you to improve your mental health, you may feel some pressure to report that the program has worked to reward the effort that facilitator has put into helping you.” But these situations are why most implementers in RCTs aren’t the surveyors. I’d be concerned if there were more instances of implementers acting as surveyors in psychotherapy than cash transfer studies.
On the other hand, who in poverty expects cash transfers to bring them misery? That seems about as rare (or rarer) as those who think psychotherapy will deepen their suffering. However, I think the point is about what participants think that implementers most desire.
Since then, I did some more digging. I found Dhar et al. (2018) and Islam et al. (2022) which use a questionnaire to test for propensity to answer questions in a socially desirable manner, but find similarly small results of socially motivated response bias. Park et al. (2022) takes an alternative approach where they randomise a subset of participants to self-survey, and argue that this does not change the results.
This is mostly consistent with 2022 expenses / people treated = 8,353,149 / 107,471 = $78.
81 WELLBYs per $1000 in our calculations, but they add some adjustments.
The most favourable position would be assuming deprivationism and a neutral point of zero.
People might hold that the neutral point is higher than 0.5 (on a 0-10 scale), and thereby reduce the cost-effectiveness of AMF. The IDinsight survey GiveWell uses surveys people from Kenya and Ghana but has a small sample (n = 70) for its neutrality question. In our pilot report (n = 79; UK sample; Samuelsson et al., 2023) we find a neutral point of 1.3. See Samuelsson et al. (2023; Sections 1.3 and 6) for a review of the different findings in the literature and more detail on our findings. Recent unpublished work by Julian Jamison finds a neutral point of 2.5 on a sample size of ~1,800 drawn from the USA, Brazil and China. Note that, in all these cases, we recommend caution in concluding that any of these values is the neutral point. There is still more work to be done.
Under GiveWell’s analysis, there are still some combinations of philosophical factors where AMF produces 17 WELLBYs or less (i.e., is as or less good than SM in GiveWell’s analysis): (1) An Epicurean view, (2) Deprivationism with neutral points above 4, and (3) TRIA with high ages of connectivity and neutral points above 3 or 4 (depending on the combination). This does not include the possibility of distributing credences across different views.
I would put the most weight on the work by HLI and Jamison and colleagues, mentioned in above, which finds a neutral point of 1.3/10 and 2.5/10, respectively.
I average the results across each view.
We acknowledge that many people may hold these views. We also want to highlight that many people may hold other views. We encourage more work investigating the neutral point and investigating the extent to which these philosophical views are held.
Zooming out a little: is it your view that group therapy increases happiness by more than the death of your child decreases it? (GiveWell is saying that this is what your analysis implies.)
To be a little more precise:
I.e., is it your view that 4-8 weeks of group therapy (~12 hours) for 20 people is preferable to averting the death of a child?
To be clear on what the numbers are: we estimate that group psychotherapy has an effect of 10.5 WELLBYs on the recipient's household, and that the death of a child in a LIC has a -7.3 WELLBY effect on the bereaved household. But the estimate for grief was very shallow. The report this estimate came from was not focused on making a cost-effectiveness estimate of saving a life (with AMF). Again, I know this sounds weasel-y, but we haven't yet formed a view on the goodness of saving a life so I can't say how much group therapy HLI thinks is preferable averting the death of a child.
That being said, I'll explain why this comparison, as it stands, doesn't immediately strike me as absurd. Grief has an odd counterfactual. We can only extend lives. People who're saved will still die and the people who love them will still grieve. The question is how much worse the total grief is for a very young child (the typical beneficiary of e.g., AMF) than the grief for the adolescent, or a young adult, or an adult, or elder they'd become [1]-- all multiplied by mortality risk at those ages.
So is psychotherapy better than the counterfactual grief averted? Again, I'm not sure because the grief estimates are quite shallow, but the comparison seems less absurd to me when I hold the counterfactual in mind.
I assume people, who are not very young children, also have larger social networks and that this could also play into the counterfactual (e.g., non-children may be grieved for by more people who forged deeper bonds). But I'm not sure how much to make of this point.
Thanks Joel.
My intuition, which is shared by many, is that the badness of a child's death is not merely due to the grief of those around them. So presumably the question should not be comparing just the counterfactual grief of losing a very young child VS an [older adult], but also "lost wellbeing" from living a net-positive-wellbeing life in expectation?
I also just saw that Alex claims HLI "estimates that StrongMinds causes a gain of 13 WELLBYs". Is this for 1 person going through StrongMinds (i.e. ~12 hours of group therapy), or something else? Where does the 13 WELLBYs come from?
I ask because if we are using HLI's estimates of WELLBYs per death averted, and use your preferred estimate for the neutral point, then 13 / (4.95-2) is >4 years of life. Even if we put the neutral point at zero, this suggests 13 WELLBYs is worth >2.5 years of life.[1]
I think I'm misunderstanding something here, because GiveWell claims "HLI’s estimates imply that receiving IPT-G is roughly 40% as valuable as an additional year of life per year of benefit or 80% of the value of an additional year of life total."
Can you help me disambiguate this? Apologies for the confusion.
13 / 4.95
I didn't mean to imply that the badness of a child's death is just due to grief. As I said in my main comment, I place substantial credence (2/3rds) in the view that death's badness is the wellbeing lost. Again, this my view not HLIs.
The 13 WELLBY figure is the household effect of a single person being treated by StrongMinds. But that uses the uncorrected household spillover (53% spillover rate). With the correction (38% spillover) it'd be 10.5 WELLBYs (3.7 WELLBYs for recipient + 6.8 for household).
GiveWell arrives at the figure of 80% because they take a year of life as valued at 4.55 WELLBYs = 4.95 - 0.5 according to their preferred neutral point, and StrongMinds benefit ,according to HLI, to the direct recipient is 3.77 WELLBYs --> 3.77 / 4.55 = ~80%. I'm not sure where the 40% figure comes from.
That makes sense, thanks for clarifying!
If I understand correctly, the updated figures should then be:
For 1 person being treated by StrongMinds (excluding all household spillover effects) to be worth the WELLBYs gained for a year of life[1] with HLI's methodology, the neutral point needs to be at least 4.95-3.77 = 1.18.
If we include spillover effects of StrongMinds (and use the updated / lower figures), then the benefit of 1 person going through StrongMinds is 10.7 WELLBYs.[2] Under HLI's estimates, this is equivalent to more than two years of wellbeing benefits from the average life, even if we set the neutral point at zero. Using your personal neutral point of 2 would suggest the intervention for 1 person including spillovers is equivalent to >3.5 years of wellbeing benefits. Is this correct or am I missing something here?
1.18 as the neutral point seems pretty reasonable, though the idea that 12 hours of therapy for an individual is worth the wellbeing benefits of 1 year of an average life when only considering impacts to them, and anywhere between 2~3.5 years of life when including spillovers does seem rather unintuitive to me, despite my view that we should probably do more work on subjective wellbeing measures on the margin. I'm not sure if this means:
Would be interested in your thoughts on this / let me know if I've misinterpreted anything!
More precisely, the average wellbeing benefits from 1 year of life from an adult in 6 African countries
3.77*(1+0.38*4.85)
I appreciate your candid response. To clarify further: suppose you give a mother a choice between "your child dies now (age 5), but you get group therapy" and "your child dies in 60 years (age 65), but no group therapy". Which do you think she will choose?
Also, if you don't mind answering: do you have children? (I have a hypothesis that EA values are distorted by the lack of parents in the community; I don't know how to test this hypothesis. I hope my question does not come off as rude.)
I don't think that's the right question for three reasons.
The hypothetical mother will almost certainly consider the well-being of her child (under a deprivationist framework) in making that decision -- no one is suggesting that saving a life is less valuable than therapy under such an approach. Whatever the merits of an epicurean view that doesn't weigh lost years of life, we wouldn't have made it long as a species if parents applied that logic to their own young children.
Second, the hypothetical mother would have to live with the guilt of knowing she could have saved her child but chose something for herself.
Finally, GiveWell-type recommendations often would fail the same sort of test. Many beneficiaries would choose receiving $8X (where X = bednet cost) over receiving a bednet, even where GiveWell thinks they would be better off with the latter.
Thanks for your response.
If the mother would rather have her child alive, then under what definition of happiness/utility do you conclude she would be happier with her child dead (but getting therapy)? I understand you're trying to factor out the utility loss of the child; so am I. But just from the mother's perspective alone: she prefers scenario X to scenario Y, and you're saying it doesn't count for some reason? I don't get it.
I think you're double-subtracting the utility of the child: you're saying, let's factor it out by not asking the child his preference, and ALSO let's ADDITIONALLY factor it out by not letting the mother be sad about the child not getting his preference. But the latter is a fact about the mother's happiness, not the child's.
Let's add memory loss to the scenario, so she doesn't remember making the decision.
Yes, and GiveWell is very clear about this and most donors bite the bullet (people make irrational decisions with regards to small risks of death, and also, betnets have positive externalities to the rest of the community). Do you bite the bullet that says "the mother doesn't know enough about her own happiness; she'd be happier with therapy than with a living child"?
Finally, I do hope you'll answer regarding whether you have children. Thanks again.
I'm not Joel (nor do I work for HLI, GiveWell, SM, or any similar organization). I do have a child, though. And I do have concerns with overemphasis on whether one is a parent, especially when one's views are based (in at least significant part) on review of the relevant academic literature. Otherwise, does one need both to be a parent and to have experienced a severe depressive episode (particularly in a low-resource context where there is likely no safety net) in order to judge the tradeoffs between supporting AMF and supporting SM?
Personally -- I am skeptical that the positive effect of therapy exceeds the negative effect of losing one's young child on a parent's own well-being. I just don't think the thought experiment you proposed is a good way to cross-check the plausibility of such a view. The consideration of the welfare of one's child (independent of one's own welfare) in making decisions is just too deeply rooted for me to think we can effectively excise it in a thought experiment.
In any event -- given that SM can deliver many courses of therapy with the resources AMF needs to save one child, the two figures don't need to be close if one believes the only benefit from AMF is the prevention of parental grief. SM's effect size would only need to be greater 1/X of the WELLBYs lost from parental grief from one child death, where X is the number of courses SM can deliver with the resources AMF needs to prevent one child death. That is the bullet that epicurean donors have to bite to choose SM over AMF.
Sorry for confusing you for Joel!
It's good to hear you say this.
Definitely true. But if a source (like a specific person or survey) gives me absurd numbers, it is a reason to dismiss it entirely. For example, if my thermometer tells me it's 1000 degrees in my house, I'm going to throw it out. I'm not going to say "even if you merely believe it's 90 degrees we should turn on the AC". The exaggerated claim is disqualifying; it decreases the evidentiary value of the thermometer's reading to zero.
When someone tells me that group therapy is more beneficial to the mother's happiness than saving her child from death, I don't need to listen to that person anymore. And if it's a survey that tells me this, throw out the survey. If it's some fancy academic methods and RCTs, the interesting question is where they went wrong, and someone should definitely investigate that, but at no point should people take it seriously.
By all means, let's investigate how the thermometer possibly gave a reading of 1000 degrees. But until we diagnose the issue, it is NOT a good idea to use "1000 degrees in the house" in any decision-making process. Anyone who uses "it's 1000 degrees in this room" as a placeholder value for making EA decisions is, in my view, someone who should never be trusted with any levers of power, as they cannot spot obvious errors that are staring them in the face.
We both think the ratio of parental grief WELLBYs to therapy WELLBYs is likely off, although that doesn't tell us which number is wrong. Given that your argument is that an implausible ratio should tip HLI off that there's a problem, the analysis below takes the view more favorable to HLI -- that the parental grief number (for which much less work has been done) is at least the major cause of the ratio being off.
As I see it, the number of WELLBYs preserved by averting an episode of parental grief is very unlikely to be material to any decision under HLI's cost-effectiveness model. Under philosophical assumptions where it is a major contributor to the cost-effectiveness estimate, that estimate is almost always going to be low enough that life-saving interventions won't be considered cost-effective on the whole. Under philosophical assumptions where life-saving programs may be cost-effective, the bulk of the effectiveness will come directly from the effect on the saved life itself. Thus, it would not be unreasonable for HLI -- which faces significant resource constraints -- to have deprioritized attempts to improve the accuracy of its estimate for WELLBYs preserved by averting an episode of parental grief.
Given that, I can see three ways of dealing with parental grief in the cost-effectiveness model for AMF. Ignoring it seems rather problematic. And I would argue that reporting the value one's relatively shallow research provided (with a disclaimer that one has low certainty in the value) is often more epistemically virtuous than
making upadjusting to some value one thinks is more likely to be correct for intuitive reasons, bereft of actual evidence to support that number. I guess the other way is to just not publish anything until one can turn in more precise models . . . but that norm would make it much more difficult to bring new and innovative ideas to the table.I don't think the thermometer analogy really holds here. Assuming HLI got a significantly wrong value for WELLBYs preserved by averting an episode of parental grief, there are a number of plausible explanations, the bulk of which would not justify not "listen[ing] to [them] anymore." The relevant literature on grief could be poor quality or underdeveloped; HLI could have missed important data or modeled inadequately due to the resources it could afford to spend on the question; it could have made a technical error; its methodology could be ill-suited for studying parental grief; its methodology could be globally unsound; and doubtless other reasons. In other words, I wouldn't pay attention to the specific thermometer that said it was much hotter than it was . . . but in most cases I would only update weakly against using other thermometers by the same manufacturer (charity evaluator), or distrusting thermometer technology in general (the WELLBY analysis).
Moreover, I suspect there have been, and will continue to be, malfunctioning thermometers at most of the major charity evaluators and major grantmakers. The grief figure is a non-critical value relating to an intervention that HLI isn't recommending. For the most part, if an evaluator or grantmaker isn't recommending or funding an organization, it isn't going to release its cost-effectiveness model for that organization at all. Even where funding is recommended, there often isn't the level of reasoning transparency that HLI provides. If we are going to derecognize people who have used malfunctioning thermometer values in any cost-effectiveness analysis, there may not be many people left to perform them.
I've criticized HLI on several occasions before, and I'm likely to find reasons to criticize it again at some point. But I think we want to encourage its willingness to release less-refined models for public scrutiny (as long as the limitations are appropriately acknowledged) and its commitment to reasoning transparency more generally. I am skeptical of any argument that would significantly incentivize organizations to keep their analyses close to the chest.
I disagree with you on several points.
The most important thing to note here is that, if you dig through the various long reports, the tradeoff is:
Which is better? Well, right off the bat, if you think mothers would value their children at 60x what they value the therapy sessions, you've already lost.
Of course, the child's life also matters, not just the mother's happiness. But HLI has a range of "assumptions" regarding how good a life is, and in many of these assumptions the life of the child is indeed fairly value-less compared to benefits in the welfare of the mother (because life is suffering and death is OK, basically).
All this is obfuscated under various levels of analysis. Moreover, in HLI's median assumption, not only is the therapy more effective, it is 5x more effective. They are saying: the number of group therapies that equal the averted death of a child is not 60, but rather, 12.
To me that's broken-thermometer level.
I know the EA community is full of broken thermometers, and it's actually one of the reasons I do not like the community. One of my main criticisms of EA is, indeed, "you're taking absurd numbers (generated by authors motivated to push their own charities/goals) at face value". This also happens with animal welfare: there's this long report and 10-part forum series evaluating animals' welfare ranges, and it concludes that 1 human has the welfare range of (checks notes) 14 bees. Then others take that at face value and act as if a couple of beehives or shrimp farms are as important as a human city.
This is not the first time I've had this argument made to me when I criticize an EA charity. It seems almost like the default fallback. I think EA has the opposite problem, however: nobody ever dares to say the emperor has no clothes, and everyone goes around pretending 1 human is worth 14 bees and a group therapy session increases welfare by more than the death of your child decreases it.
I think that it is possible to buy that humans only have 14 times as painful maximum pains/pleasurable maximal pleasure than bees, and still think 14 bees=1 human is silly. You just have to reject hedonism about well-being. I have strong feelings about saving humans over animals, but I have no intuition whatsoever that if my parents' dog burns her paw it hurts less than when I burn my hand. The whole idea that animals have less intense sensations than us seems to me less like a commonsense claim, and more like something people committed to both hedonism and antispeciesism made up to reconcile their intuitive repugnant at results like 10 pigs or whatever=1 human. (Bees are kind of a special case because lots of people are confident they aren't conscious at all.)
Where's the evidence that, e.g., everyone "act[s] as if a couple of beehives or shrimp farms are as important as a human city"?So someone wrote a speculative report about bee welfare ranges . . . if "everyone" accepted that "1 human is worth 14 bees" -- or even anything close to that -- the funding and staffing pictures in EA would look very, very different. How many EAs are working in bee welfare, and how much is being spent in that area?
As I understand the data, EA resources in GH&D are pretty overwhelmingly in life-saving interventions like AMF, suggesting that the bulk of EA does not agree with HLI at present. I'm not as well versed in farmed animal welfare, but I'm pretty sure no one in that field is fundraising for interventions costing anywhere remotely near hundreds of dollars to save a bee and claiming they are effective.
In the end, reasoning transparency by charity evaluators helps the donor better make an informed moral choice. Carefully reading analyses from various sources helps me (and other donors) make choices that are consistent with our own values. EA is well ahead of most charitable movements by explicitly acknowledging that trade-offs exist and at least attempting to reason about them. One can (and should) decline to donate where the charity's treatment of tradeoffs isnt convincing. As I've stated elsewhere on this post, I'm sticking with GiveWell-style interventions at least for now.
Oh, I should definitely clarify: I find effective altruism the philosophy, as well as most effective altruists and their actions, to be very good and admirable. My gripe is with what I view as the "EA community" -- primarily places like this forum, organizations such as the CEA, and participants in EA global. The more central to EA-the-community, the worse I like the the ideas.
In my view, what happens is that there are a lot of EA-ish people donating to GiveWell charities, and that's amazing. And then the EA movement comes and goes "but actually, you should really give the money to [something ineffective that's also sometimes in the personal interest of the person speaking]" and some people get duped. So forums like this one serve to take money that would go to malaria nets, and try as hard as they can to redirect it to less effective charities.
So, to your questions: how many people are working towards bee welfare? Not many. But on this forum, it's a common topic of discussion (often with things like nematodes instead of bees). I haven't been to EA global, but I know where I'd place my bets for what receives attention there. Though honestly, both HLI and the animal welfare stuff is probably small potatoes compared to AI risk and meta-EA, two areas in which these dynamics play an even bigger role (and in which there are even more broken thermometers and conflicts of interest).
Do you think there's a number you would accept for how many people treated with psychotherapy would be "worth" the death of one child?
Yes. There is a large range of such numbers. I am not sure of the right tradeoff. I would intuitively expect a billion therapy sessions to be an overestimate (i.e. clearly more valuable than the life of a child), but I didn't do any calculations. A thousand seems like an underestimate, but again who knows (I didn't do any calculations). HLI is claiming (checks notes) ~12.
To flip the question: Do you think there's a number you would reject for how many people treated with psychotherapy would be worth the death of one child, even if some seemingly-fancy analysis based on survey data backed it up? Do you ever look at the results of an analysis and go "this must be wrong," or is that just something the community refuses to do on principle?
Thank you for this detailed and transparent response!
I applaud HLI for creating a chart (and now an R Shiny App) to show how philosophical views can affect the tradeoff between predominately life-saving and predominately life-enhancing interventions. However, one challenge with that approach is that almost any changes to your CEA model will be outcome-changing for donors in some areas of that chart. [1]
For example, the 53-> 38% correction alone switched the recommendation for donors with a deprivationist framework who think the neutral point is over ~ 0.65 but under 1.58. Given that GiveWell's moral weights were significantly derived from donor preferences, and (0.5, deprivationism) is fairly implied by those donor weights, I think that correction shifted the recommendation from SM to AMF for a significant number of donors even though it was only material to one of three philosophical approaches and about 1 point of neutral-point assumptions.
GiveWell reduced the WELLBY estimate from about 62 (based on the 38% figure) to about 17, a difference of about 45. If I'm simplifying your position correctly, for about half of those WELLBYs you disagree with GiveWell that an adjustment is appropriate. For about half of them, you believe a discount is likely appropriate, but think it is likely less than GiveWell modelled.
If we used GiveWell's numbers for that half but HLI's numbers otherwise, that split suggests that we'd end up with about 39.5 WELLBYs. So one way to turn your response into a donor-actionable statement would be to say that there is a zone of uncertainty between 39.5 and 62 WELLBYs. One might also guess that the heartland of that zone is between about 45 and 56.5 WELLBYs, reasoning that it is less likely that your discounts will be less than 25% or more than 75% of GiveWell's.
The bottom end of that zone of uncertainty (39.5) would pull the neutral point at which a deprivationist approach would conclude AMF = SM up to about 2.9. I suspect few people employing a deprivationist approach have the neutral point that high. AMF is also superior to SM on a decent number of TRIA-based approaches at 39.5 WELLBYs.
So it seems there are two reasonable approaches to donor advice under these kinds of circumstances:
I don't think reaffirming advice on the current model in the interim without any adjustments is warranted, unless you believe the adjustments will be minor enough such that a reasonable donor would likely not find them of substantive importance no matter where they are on the philosophical chart.[2]
In the GiveWell model, the top recommendation is to give to a regranting fund, and there isn't any explicit ranking of the four top charities. So the recommendation is actually to defer the choice of specific charity to someone who has the most up-to-date information when the monies are actually donated to the effective charity. Moreover, all four top charities are effective in very similar ways. Thus, GiveWell's bottom-line messaging to donors is much less sensitive to changes in the CEA for any given charity.
I am not sure how to define "minor." I think whether the change flips the recommendation to the donor is certainly relevant, but wouldn't go so far as to say that any change that flips the recommendation for a given donor's philosophical assumptions would be automatically non-minor. On the other hand, I think a large enough change can be non-minor even if it doesn't flip the recommendation on paper. Some donors apply discounts and bonuses not reflected in HLI's model. For instance, one could reasonably apply a discount to SM when compared to better-studied interventions, on the basis that CEAs usually decrease as they become more complete. Or one could reasonably apply a bonus to SM because funding a smaller organization is more likely to have a positive effect on its future cost-effectiveness. Thus, just because the change is not outcome-determinative on HLI's base model doesn't mean it isn't so on the donor's application of the model. The time-to-update and amount of funds involved are also relevant. All that being said, my gut thinks that the starting point for determining minor vs. non-minor is somewhere in the neighborhood of 10%.
Jason,
You raise a fair point. One we've been discussing internally. Given the recent and expected adjustments to StrongMinds, it seems reasonable to update and clarify our position on AMF to say something like, "Under more views, AMF is better than or on par with StrongMinds. Note that currently, under our model, when AMF is better than StrongMinds, it isn't wildly better.” Of course, while predicting how future research will pan out is tricky, we'd aim to be more specific.
(EDITED)
Is this (other than 53% being corrected to 38%) from the post accurate?
If so, a substantial discount seems reasonable to me. It's plausible these studies also say almost nothing about the spillover, because of how unrepresentative they seem. Presumably much of the content of the therapy will be about the child, so we shouldn't be surprised if it has much more impact on the child than general therapy for depression.
It's not clear any specific number away from 0 could be justified.
I find nothing objectionable in that characterization. And if we only had these three studies to guide us then I'd concede that a discount of some size seems warranted. But we also have A. our priors. And B. some new evidence from Barker et al. Both of point me away from very small spillovers, but again I'm still very unsure. I think I'll have clearer views once I'm done analyzing the Barker et al. results and have had someone, ideally Nathanial Barker, check my work.
[Edit: Michael edited to add: "It's not clear any specific number away from 0 could be justified."] Well not-zero certainly seems more justifiable than zero. Zero spillovers implies that emotional empathy doesn't exist, which is an odd claim.
To clarify what I edited in, I mean that, without better evidence/argument, the effect could be arbitrarily small but still nonzero. What reason do we have to believe it's at least 1%, say, other than very subjective priors?
I agree that analysis of new evidence should help.
I'd point to the literature on time lagged correlations between household members emotional states that I quickly summarised in the last installment of the household spillover discussion. I think it implies a household spillover of 20%. But I don't know if this type of data should over- or -underestimate the spillover ratio relative to what we'd find in RCTs. I know I'm being really slippery about this, but the Barker et al. analysis stuff so far makes me think it's larger than that.
Regarding the question of what philosophical view should be used, I wonder if it would also matter if someone were something like prioritarian rather than a total utilitarian. StrongMinds looks to focus on people who suffer more than typical members of these countries' populations, whilst the lives saved by AMF would presumably cover more of the whole distribution of wellbeing. So a prioritarian may favour StrongMinds more, assuming the people helped are not substantially better off economically or in other ways. (Though, it could perhaps also be argued that the people who would die without AMF's intervention are extremely badly off pre-intervention.)