I don't however think these issues with point estimates are biggest problem with wellbeing research, these issues are important yes for calibration, but a bigger problem is whether reported increases in wellbeing after an intervention are real or biased. I have said this before, apologies for being a stuck record.
These two biases which don't necessarily affect point estimates (like you discuss above) but affect before and after measurements...
Demand/ courtesy bias. Giving higher wellbeing score after the intervention because you think that is what the researcher wants.
"Future hope" bias. Giving higher scores after any intervention, thinking (often rationally and correctly) that the positive report will make you more likely to get other, even different types of help in future. This could be a huge problem in surveys among the poor but there's close to no research on it.
These might be hard to research and are undrafted, but I think it is important to try.
We should keep in mind though these two bias don't only affect wellbeing surveys, but to some degree any self reported survey, for example the majority of give directly's data.
Thanks for pointing out both kinds of biases. These biases can cause a failure of comparability. Concretely, if an intervention causes you to give counterfactually higher scores as a matter of ‘courtesy’ to the researcher, then the intervention changed the meaning of each given response category.
I therefore take it that you don’t think that our particular tests of comparability will cover the two biases you mention. If so, I agree. However, my colleague has given reasons for why we might not be as worried about these sorts of biases.
I don’t think this can be tested in our current survey format, but it might be testable in a different design. We are open to suggestions!
Not only courtesy, but also future hope (which I think may be more important here).
Yeah it's really hard to test. I think validity of point estimates are pretty reasonable for wellbeing surveys and I agree with most of the reasoning on this post.
It's very had to test those biases ethically, but probably possible. Not in this kind of survey anyway.
The reasons he gave for not being worried about those biases were not unreasonable, but based on flimsy evidence. Especially future hope bias which may not have been researched at all.
I enjoyed this a lot. I've been meaning to delve into well-being measurement and this was a nice entry-point into the field.
One thing I'm not clear on is whether vignette anchors (or any of the comparability methods) can correct for non-overlapping well-being scales. You talked about an example like this:
All of the methods we are currently thinking of require that for all respondents i,j the top response threshold for person i must be at least as large as the bottom response threshold for person j. `
However, with the vignettes, I believe that this is in part testable. Suppose that for a given vignette no person selected the top response category, and no person selected the bottom response category. Additionally suppose that the assumptions in section 4.1.1 of the report hold (i.e. that people perceive vignettes similarly, and use the same scale for their own wellbeing as for the vignettes). In that case all respondents’ scales must have at least some overlap with each other.
We have not checked this though I imagine that it would show overlap of scales. Would this kind of test convince you?
As an aside, in section 4.6.1 we show that almost all respondents choose either “The most/least satisfied that any human could possibly be” or “The most/least satisfied that you personally think you could become” as the endpoints of the scale. Since the latter set of endpoints is contained by the former set of endpoints, this evidence also seems to suggest that scales overlap.
Thanks for the response. On second thought, my objection might be different than what I initially suggested. I do think the test of overlap of scales as you mentioned would be an interesting test to run, but it doesn't seem to be capturing the overlap I ultimately care about.
Maybe this comment can captures my complaint better. We don't have any access to what "the most/least satisfied that any human could possibly be". We don't even have access to "the most/least satisfied you personally think you could become".
As a personal example, I would take most of my worst post-therapy days over most of my best pre-therapy days. Younger me has no access to realizing how much satisfied I could be with life, or even how broadly people are in general.
I might be using the language wrong, but I think I'm hinting at differences in the latent scale of well-being or satisfaction... which doesn't feel like it's knowable.
I have a difficulty with this idea of a neutral point, below which it is preferable to not exist. At the very least, this is another baked in assumption - that the worst wellbeing imaginable is worse than non-existence.
There are two reasons for me being troubled with this assumption:
I've been living with a chronic illness for many years, which causes constant suffering. I'm expected to keep living like that for decades to come. I can't accept the idea that there's a point of suffering beyond which I should not live.
Giving such a point will allow one to make decisions about whether people should live or die. As a rule that I personally believe in, we should never make such decisions.
Hello Guy. This is an important, tricky, and often unpleasant, issue to discuss. I'm speaking for myself here: HLI doesn't have an official view on this issue, except that it's complicated and needs more thought; I'm still not sure how to think about this.
I'll respond to your second comment first. You say we should not decide whether people live or die. Whilst I respect the sentiment, this choice is unfortunately unavoidable. Healthcare systems must, for instance, make choices between quality and quantity of lives - there are not infinite resources. The well-worn QALY and DALY measures exist in the hope of making such choices in a more principled way. Charitable donors, when deciding where to give, might support any one of a variety of life-saving charities, or charities that focus on something else - in a sense, they are choosing whether people live or die. Because we have to make such choices anyway, it doesn't depend on where the neutral point is fixed. As we note in section 2.2. of this recent HLI report, QALYs allow states worse than death, whereas DALYs do not. Yet both trade-off quality vs quantity of life.
Turning to your first comment, I note this is a topic about which opinion seems to split. Some people, such as yourself, think existence is always better than non-existence. Others think that life can be worse than death - a life of unrelenting suffering, perhaps - and that people can be rational in seeking to end their own lives. Curiously, I note that people are quite ready to accept that, when it comes to factory farming, those animals would lead bad lives, so it is better that they never exist. That said, I don't think this is an issue we can expect, or need, to find unanimity on. Those who think life is always worth living would, presumably, want to make comparisons differently from those who think life is not always worth living. One way to capture these different views, and explore their implications, is exactly by varying the level of the neutral point.
I'm aware that by prioritising how to use limited resources, we're making decisions about people's lives. But there's a difference between saying "we want to save everyone, but can't" and saying "This group should actually not be saved, because their lives are so bad".
Curiously, I note that people are quite ready to accept that, when it comes to factory farming, those animals would lead bad lives, so it is better that they never exist.
I actually agree! But I don't think it's the same thing. I don't want to kill existing animals; I want to not intentionally create new ones for factory farms. Continued existence is better than death if you already exist. Creating someone just to suffer is a different matter. This isn't symmetric (and as a mathematician, I note that that means it can't be described by just giving some "local" numerical rating to each state of being and comparing them).
Guy - thank you for this comment. I'm very sorry about your suffering.
I think EAs should take much more seriously the views of people like you who have first-hand experience with these issues. We should not be assuming that 'below neutral utility' implies 'it's better not to be alive'. We should be much more empirical about this, and not make strong a priori assumptions grounded in some over-simplified, over-abstracted view of utilitarianism.
We should listen to the people, like you, who have been living with chronic conditions -- whether pain, depression, PTSD, physical handicaps, cognitive impairments, or whatever -- and try to understand what keeps people going, and why they keep going.
AI Use Note: Main body text entirely human written. Claude (Opus 4.8) helped develop models of animal life histories in the appendix.
Cross-posted from Good Structures.
Executive Summary
* Animal advocates sometimes make claims like “there are X of this animal...
Adapted from my Substack, Funding Anthropalypse.
Short version: if you want a share of the coming Anthropic and OpenAI windfall - the $37bn+ that could be in play next year - the way in is to become 'legibly excellent', so the evaluators and donors that frontier lab staff already trust point them to yo...
Disclaimer: Although I work on the Groups Team at CEA, I’m writing this in a personal capacity, and this post does not constitute an endorsement by CEA.
Agency - the realisation that you really can just do things.
TL;DR
Biosecurity needs people (of any background) who are agentic and have a high execution velocity and track record....
Note: This post only contains Sections 1 and 2 of the report. For the full detail of our survey and pilot results, please see the full report on our website.
Summary
Subjective wellbeing (SWB) data, such as answers to life satisfaction questions, are important for decision-making by philanthropists and governments. Such data are currently used with two important assumptions:
Reports are comparable between persons (e.g., my 6/10 means the same as your 6/10)
Reports are linear in the underlying feelings (e.g., going from 4/10 to 5/10 represents the same size change as going from 8/10 to 9/10).
Fortunately, these two assumptions are sufficient for analyses that only involve the quality of people’s lives. However, if we want to perform analyses that involve trade-offs between improving quality and quantity of life, we also need knowledge of the neutral point, the point on a wellbeing scale that is equivalent to non-existence.
Unfortunately, evidence on all three questions is critically scarce. We[1] propose to collect additional surveys to fill this gap.
Our aim with this report is two-fold. First, we give an outline of the questions we plan to field and the underlying reasoning that led to them. Second, we present results from an initial pilot study (n = 128):
Unfortunately, this small sample size does not allow us to provide clear estimates of the comparability of wellbeing reports.
However, across several question modalities, we do find tentative evidence in favour of approximate linearity.
With respect to neutrality, we assess at what point on a 0-10 scale respondents say that they are 'neither satisfied nor dissatisfied' (mean response is 5.3/10). We also probe at what point on a life satisfaction scale respondents report to be indifferent between being alive and being dead (mean response is 1.3/10). Implications and limitations of these findings concerning neutrality are discussed in Section 6.2.
In general, the findings from our pilot study should only be seen as being indicative of the general feasibility of this project. They do not provide definitive answers.
In the hopes of fielding an improved version of our survey with a much larger sample and a pre-registered analysis plan, we welcome feedback and suggestions on our current survey design.
Here are some key questions that we hope to receive feedback on:
Are there missing questions that could be included in this survey (or an additional survey) that would inform important topics in SWB research? Are there any questions or proposed analyses you find redundant?
Do you see any critical flaws in the analyses we propose? Are there additional analyses we should be considering?
Would these data and analyses actually reassure you about the comparability, linearity, and neutrality of subjective wellbeing data? If not, what sorts of data and analyses would reassure you?
What are some good places for us to look for funding for this research?
Of course, any other feedback that goes beyond these questions is welcome, too. Feedback can be sent to [email protected] or to [email protected].
The report proceeds as follows:
In Section 1, we describe the challenges for the use of self-reported subjective wellbeing data, focusing on the issues of comparability, linearity, and neutrality. We highlight the implications of these three assumptions for decision-making about effective interventions.
In Section 2, we describe the general methodology of the survey.
For the following sections, see the full report on our website.
In Section 3, we discuss responses to the core life satisfaction question.
In Sections 4, 5, and 6, we describe how we will assess comparability (Section 4), linearity (Section 5), and neutrality (Section 6). We also discuss our substantive and statistical assumptions (stated informally).
In Section 7, we make some wider comments on the feasibility of fielding a scaled-up version of this survey.
We hope that this work will eventually help us and the wider research community to understand whether, and to what extent, we can reliably use survey data as a cardinal and comparable measure of people’s wellbeing.
1. Linearity, comparability, and neutrality as challenges for wellbeing research
If we want to know how people’s lives are going, an obvious, if not widely used, method is to rely on individuals’ self-reported assessment of their own wellbeing. Philanthropists and policymakers are increasingly using such data in their decision-making (Durand, 2018). Previous research showed that subjective wellbeing measures are reliable (i.e., they give similar results across multiple measurements, OECD, 2013; Tov et al., 2021) and valid (i.e., they succeed in capturing the underlying phenomenon they seek to measure, Kahneman & Krueger, 2006). Still, there are doubts about the reasonableness of using subjective wellbeing reports to evaluate intervention effects on wellbeing and to make interpersonal welfare comparisons. These doubts are largely due to a lack of extensive research about how such reports are generated.
In this post, we engage with three important areas regarding self-reported subjective wellbeing:
The comparability of reports between persons (is my 6/10 the same as your 6/10?).
The linearity of subjective wellbeing reports (is going from 4/10 to 5/10 the same amount of increase as going from 8/10 to 9/10?).
The position of the neutral point (the wellbeing level at which existence and non-existence are equivalent in value).
Comparability and linearity are required to allow for the consistent estimation of relative wellbeing effects of interventions (see, for example, Kaiser, 2022). The neutral point is an additional requirement for estimating trade-offs between the quantity and quality of life (McGuire et al., 2022b). Therefore, we believe these three issues to be particularly important. For an overall theoretical analysis and a review of the existing (limited) empirical literature, see Plant (2020) who tentatively concludes we can assume SWB scales are comparable and linear.
We will be fielding a large-scale survey to evaluate comparability, linearity, and neutrality from multiple perspectives. As a first step in this process, we have fielded a small-scale pilot, from which we will report some initial results.
Whether SWB scales are interpreted in a linear and comparable manner is an open question. Should it turn out that SWB scales are not (approximately) linear and comparable, knowledge about the ways in which these assumptions fail will allow us to correct for these deviations in subsequent analyses. Below, we discuss some of the previous work on these issues.
1.1 Comparability
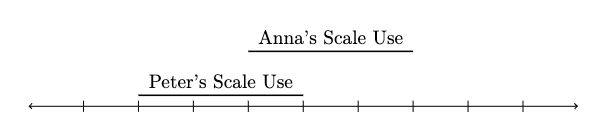
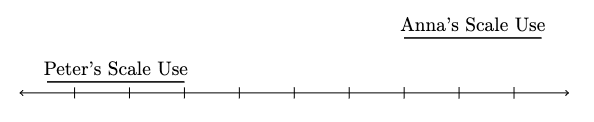
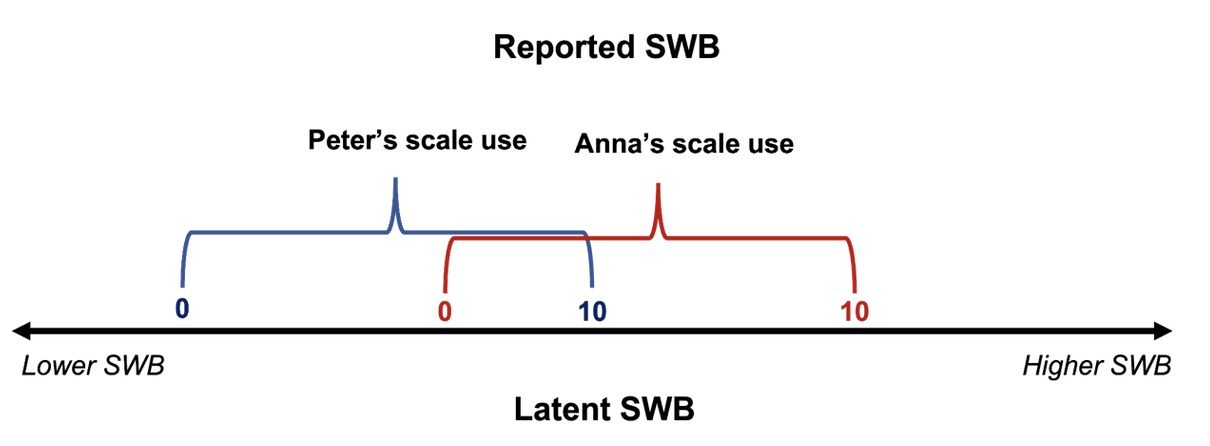
With “comparability” we here mean that identical SWB reports refer to identical levels of SWB, regardless of the person and time. One way to think about comparability is in terms of common scale-use. Suppose we give you a scale for you to rate your life satisfaction between 0 and 10. In order for you to render a judgement about which digit best represents your life satisfaction, you need to decide where the threshold for each digit is. You then have to match your subjective feeling of life satisfaction to a number on the scale. Because this is a complicated cognitive process, we may expect that people will differ in their scale-use (see Figure 1). If differences in scale-use were random, they would ‘wash-out’ in sufficiently large samples and would not bias subsequent analyses.
Figure 1. An illustration of differences in scale-use for wellbeing reports
Note: For a given level of underlying wellbeing, Peter will use larger numbers than Anna. Equivalently, a given response (e.g., a 6/10) corresponds to a lower level of wellbeing for Peter than for Anna. Peter’s and Anna’s scale-use, therefore, differs.
However, if scale-use differed systematically, so that there were differences in scale-use between groups, then any reported differences in life satisfaction between groups would be confounded by differences in scale-use. In the literature, differences in scale-use are sometimes referred to as scale shifts, which may either occur between people or between points in time for a given person. Although most research assumes comparability, that assumption has been doubted. One reason for this are observed changes in response behaviour that are caused by factors that are unrelated to the content of the survey questions (Bertrand & Mullainathan, 2001). For example, question order, differences in the phrasing of questions, and ordering of answer options can yield substantial differences in responses between randomised groups of respondents.
Other researchers have argued that incomparability may explain counterintuitive differences between groups with similar objective circumstances. For example, French respondents tend to report surprisingly low life satisfaction (Angelini et al., 2014; Kahneman et al., 2004); women report higher life satisfaction than men despite having worse outcomes on many objective measures (Montgomery, 2022); and ageing populations report higher life satisfaction despite having poorer health and more loneliness.
Similarly, apparent inconsistencies in how respondents rate their current SWB, their improvement in SWB, and their memories of past SWB across time suggest that intrapersonal scale shifts occur (i.e., people change the scale they use over time; Fabian, 2022; Kaiser, 2022; Prati & Senik, 2020). Intrapersonal scale shifts may be an explanation of the well-known Easterlin paradox, which states that long-term country-wide increases in GDP do not improve wellbeing, despite the fact that income is robustly correlated with wellbeing at an individual level (Kahneman & Deaton, 2010; Jebb et al., 2018; McGuire et al., 2022a).
However, even if SWB reports are incomparable, that need not be the end of subjective wellbeing data. For example, researchers have used vignettes, short descriptions of (fictional) persons to which people should give common answers, to estimate the differences in scale-use between groups, and to subsequently correct for these differences (e.g., Montgomery, 2022; Angelini et al., 2014; Wand, 2012; King et al., 2004). Of course, this test for comparability relies on the assumption that respondents have a common perception of the wellbeing of the persons described in the vignettes. This assumption may not always hold, and may depend on the design of vignettes. Similar methods have been suggested for intrapersonal scale shifts using data on memories (Kaiser, 2022). Generally, these studies find that survey responses are not perfectly comparable, but that biases arising from such non-comparability are typically too small to, for example, impact estimates of the sign of an effect. That said, the validity of current methods for assessing comparability has been questioned, and there is a lack of cross-method validation; namely, do the results from different methods, which have different underlying assumptions, converge?
1.2 Linearity
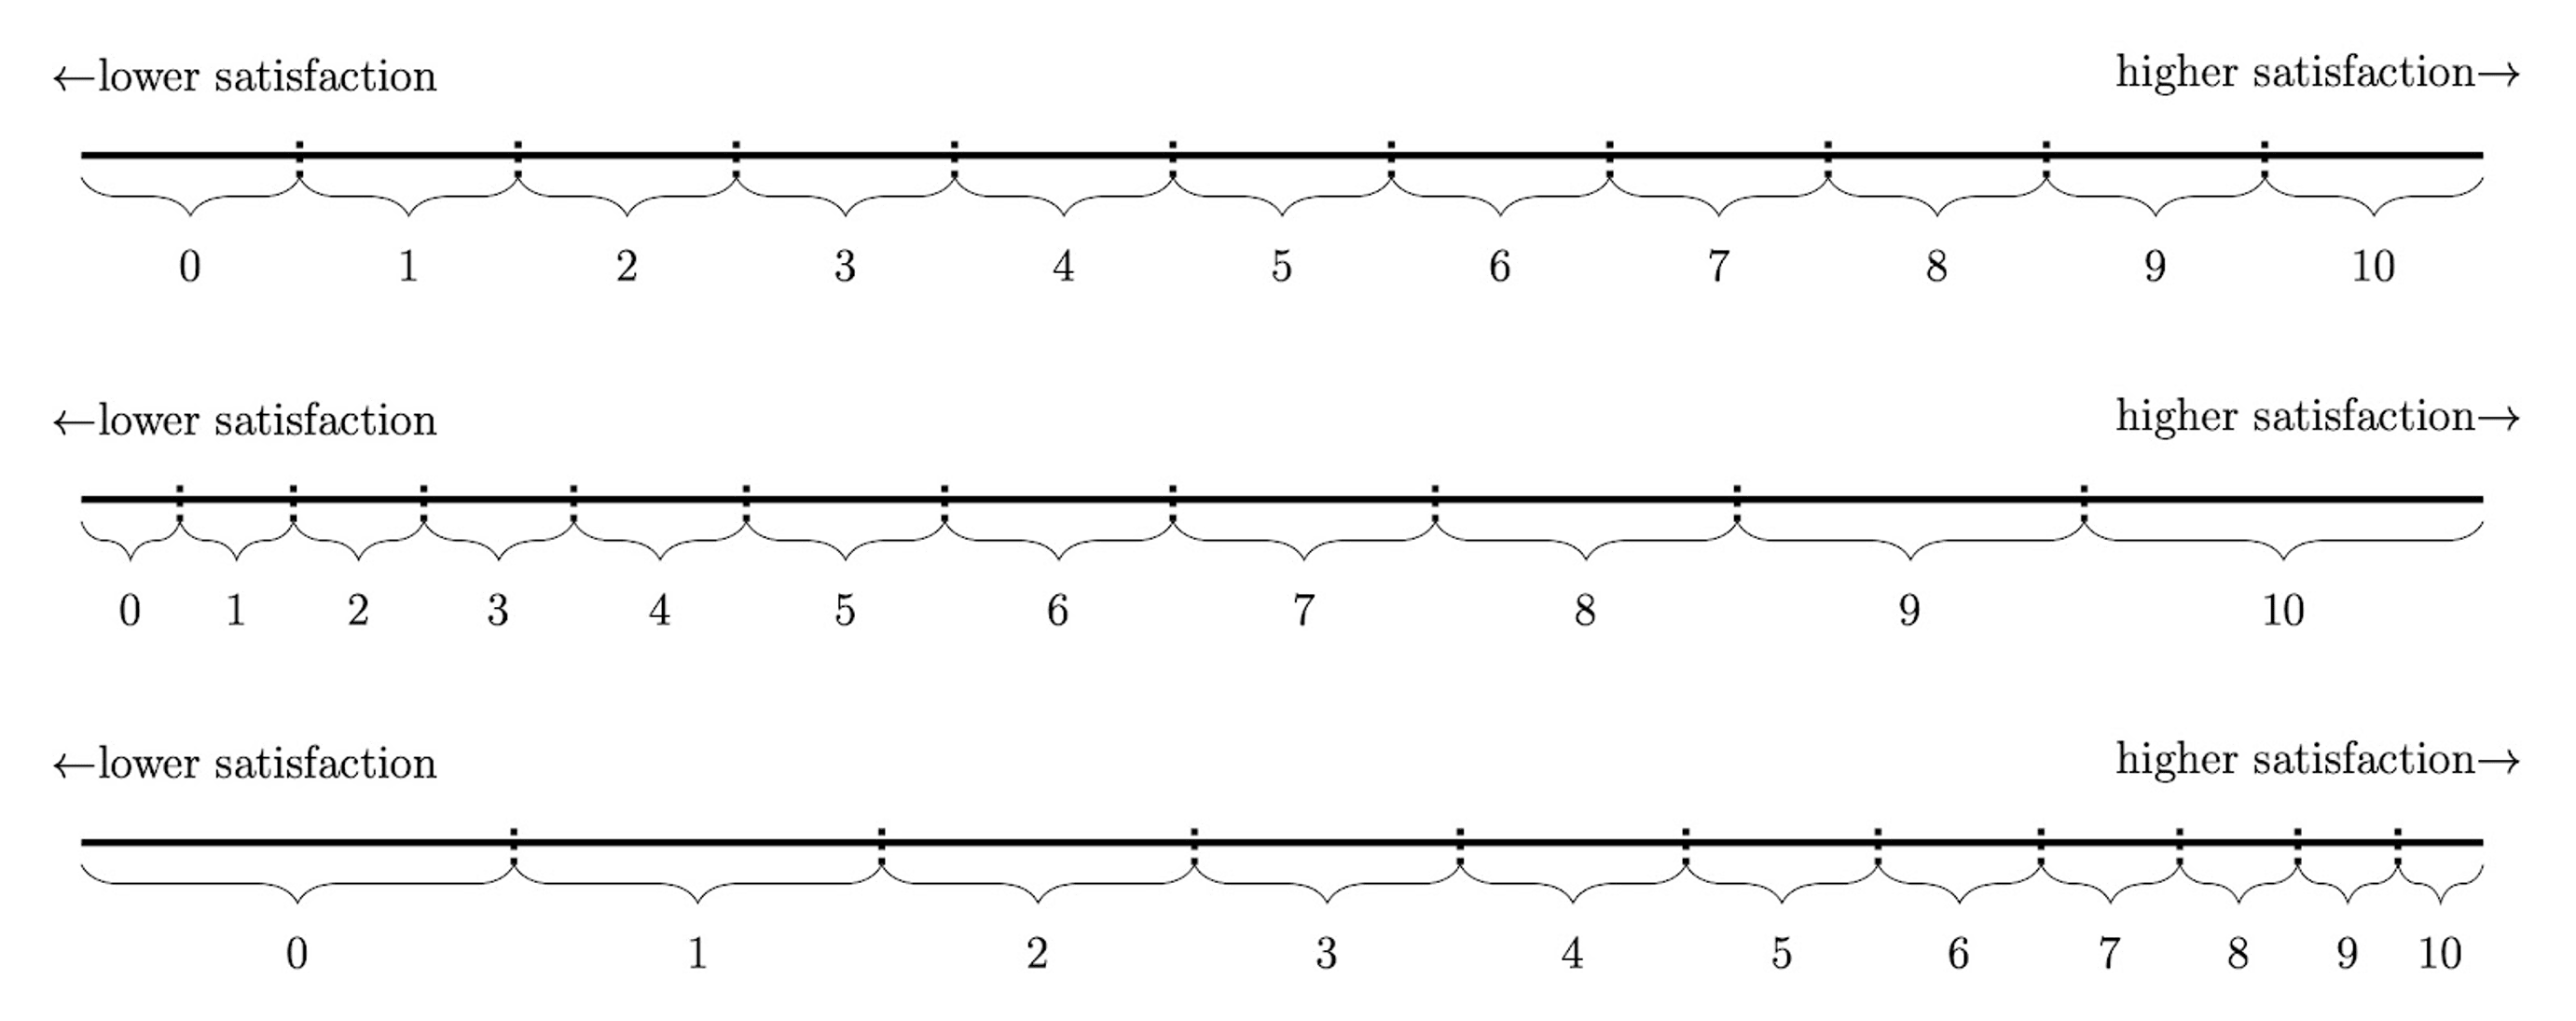
As we use the term, “linearity” refers to the assumption that the relationship between latent and reported SWB is linear, so that any step on a SWB scale indicates the same increase or decrease of latent SWB, regardless of where on the scale the person is. To illustrate, consider Figure 2 which shows a linear, convex, and concave relationship between latent and reported SWB.
Currently, most researchers treat SWB data as though the linearity assumption was met. As in the case of comparability, violations of this assumption would bias analyses of SWB data, and could even reverse conclusions – as shown in several pieces of recent work (Bond & Lang, 2019; Schröder & Yitzhaki, 2017).
In response to this, Kaiser and Vendrik (2021) demonstrated that non-linear transformations of SWB scales would have to strongly deviate from linearity in order for such reversals to occur, and such strong deviations seem improbable. Few papers have sought to quantify how non-linear scale-use is. As one example, Oswald (2008) showed that the relationship between objectively measured and subjectively reported height is roughly linear. However, it remains unclear whether these initial results generalise sufficiently well to justify the linearity assumption for wellbeing data. Our survey design seeks to test this.
Figure 2. Linear, convex, and concave relationships between latent and reported life satisfaction (as one example of SWB)
Note: The top of the figure shows a linear relationship between reported and latent wellbeing. In the middle, a convex relationship is shown. That is, the difference in latent wellbeing is larger between the higher response options than between the lower response options. The opposite concave pattern is shown in the bottom of the figure.
1.3 Neutrality
The neutral point refers to the level on a SWB scale at which existence has a neutral value, compared to non-existence for that person (assuming this state is perpetual and considering only the effects on that person). Above this point life is ‘better than death’; below it life is ‘worse than death’. This is conceptually distinct, but possibly closely related, to what we call the zero point: the level on a SWB scale at which that type of SWB is overall neither positive nor negative (e.g., someone is neither overall satisfied or dissatisfied). A natural thought is that the zero point and the neutral point coincide: if life is good(/bad) for us when it has positive(/negative) wellbeing, so a life has neutral value if it has zero wellbeing.[2]
Locating the neutral point is essential in some decision-making contexts, such as prioritising healthcare, where we must compare the relative value of improving the quality of life with the value of increasing the quantity of life.[3] To date the location of the neutral point remains an open question. We think that potential answers can be informed by a combination of theoretical reasoning and empirical research.
To motivate the problem, consider two interventions A and B. For simplicity, assume that we simply seek to maximise total wellbeing. Under intervention A, 100 people’s wellbeing is raised from a baseline score of 6/10 to 8/10 for a single year, but there is no change in each person’s length of life. Under intervention B, there is no change in each person’s baseline wellbeing level, but each person’s length of life is increased by one year.
Define one ‘Wellbeing Adjusted Life-Year’ - a WELLBY - as a one point gain on the 0-10 wellbeing scale for one year. Intervention A yields 2*1*100=200 WELLBYs. We can do this without reference to the neutral point, because we know the counterfactual: without the intervention, they will live at 6/10.
For B, we need to assign a neutral point (i.e., a score equivalent to non-existence). Suppose we place the neutral point at 0/10. Under intervention B, we count a gain of 6*1*100=600 WELLBYs. Hence, intervention B seems more effective than intervention A. Now instead assume that the neutral point is located at 5/10. Under intervention B, we now merely gain (6-5)*100=100 WELLBYs. Under this alternative assumption, intervention A seems more effective. Hence, the location of the neutral point matters when attempting to decide between life-extending and life-improving interventions.
In previous works, the neutral point has been chosen in an ad hoc manner (also seePlant et al., 2022,for discussion).Layard et al. (2020), for example, set the neutral point at 0/10. However, in this case there would be no way of reporting a level of latent wellbeing below the neutral point. This violates the intuition that people can ever have overall bad lives (i.e., overall negative wellbeing), or lives where it would be rational for them to wish to die. One might instead think that the neutral point is at 5/10 (c.f.Diener et al. 2018). This, however, would counterintuitively imply that a vast proportion of the world’s population lives below the neutral point (as many report life satisfaction levels below 5/10;Our World In Data, 2020).
Hence, there is no obvious and uncontroversial a priori choice here. The limited research done so far indicates that people place the neutral point somewhere between 0 and 5 on SWB scales. A small (n = 75) survey in the UK found that, on average, respondents would prefer non-existence over a life satisfaction level of about 2/10 (Peasgood et al., unpublished, as referenced in Krekel & Frijters, 2021). The IDinsight Beneficiary Preferences Survey (2019, p. 92; n = 70), estimated the neutral point to be 0.56. The think-tank Rethink Priorities (unpublished) ran pilot studies about the neutral point using a 0-100 scale (from the worst pain, suffering and unhappiness to the best pleasure, positive experience, and happiness[4]). When participants (n = 35) are asked at what level they prefer to be alive rather than dead, the mean answer is 24.9/100.
It is unclear what to make of these answers. An important first step is to get a better understanding of what respondents believe and why. To be clear, this is only a first step: decision-makers will not necessarily want to take such beliefs at face value if they seem mistaken or irrelevant. We consider limitations of our measures in Section 6.2.
As noted, a natural thought is that the neutral point and zero point will coincide.[5] We test whether respondents put the neutral point and zero point for life satisfaction in the same place, and whether respondents interpret the zero point for life satisfaction as somewhere between 0 and 5. If respondents do both, that would provide an explanation of previous works’ findings. However, there are several reasons why respondents might not believe that the neutral point and the zero point coincide. Some of these issues are discussed in Section 6.2.
With these preliminaries in place, we next outline the general features of our pilot survey.
2. General outline of the survey
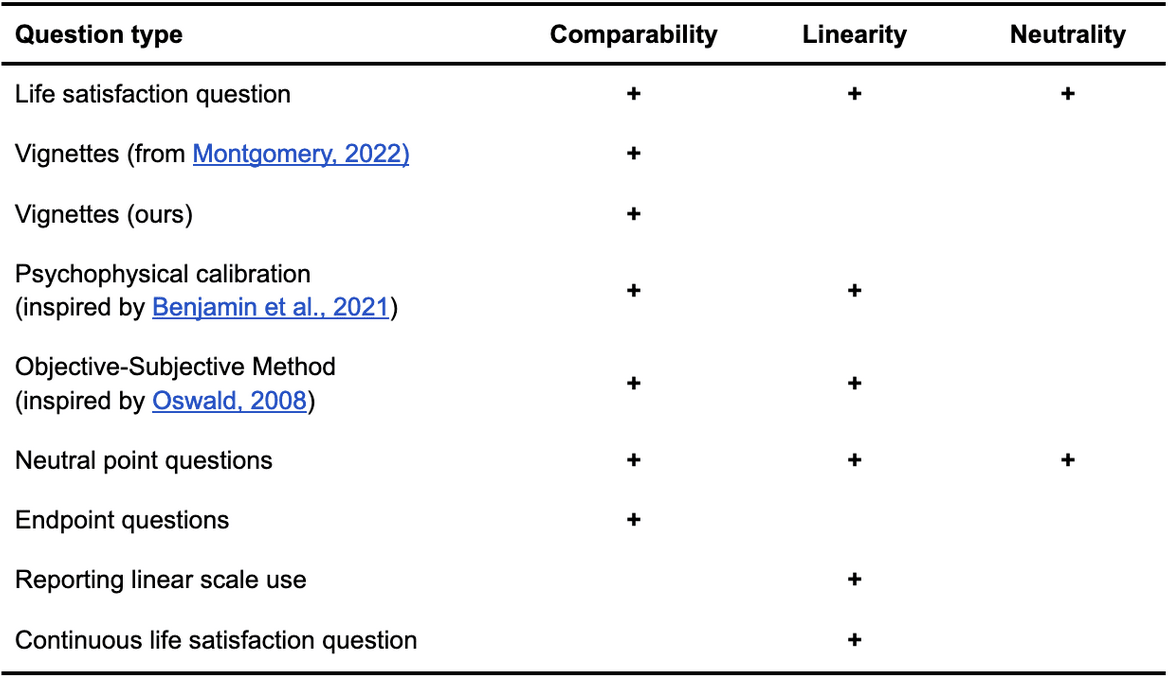
The survey contains 50 questions, which can be found in this external appendix with the questions. We list the different types of questions used and the topics they address in Table 1 below.
We ran a pilot of the survey using Qualtrics for the implementation and Prolific Academic for the recruitment (chosen for its reasonably high data quality, see Peer et al., 2022). We used Prolific filters to recruit participants who lived in the UK, who spoke English as their first language, and had a Prolific Score between 95 and 100 (i.e., they were rarely rejected from studies). We used the balancing option from Prolific to recruit a similar number of men and women.
We recruited 128 participants. The median time to complete the survey was 9.82 minutes. In our sample, 64 participants report being females, 63 males, and 3 others. The mean age was 39.15 years old (median = 35.00, SD = 14.26). For additional summary statistics, see our external Appendix A.
Table 1: Different question types and how we use them
See our website for the full report. We present the life satisfaction question we asked participants then we discuss our questions on comparability, linearity, and neutrality. Throughout, we report some tentative and preliminary results.
Author note: Conrad Samuelsson, Samuel Dupret, and Caspar Kaiser contributed to the conceptualization, methodology, investigation, analysis, data curation, and writing (original as well as review and editing) of the project. Michael Plant contributed to the conceptualization, supervision, and writing (review and editing) of the project.
A standard philosophical explanation for what makes death bad for us (assuming it can be bad for us) is deprivationism, which says that death is bad because and to the extent it deprives us of the goods of life. Hence, death is bad for us if we would have had a good life and, conversely, death is good for us if we would have had a bad life. Here we take it that a good(/bad/neutral) life is one with overall positive(/negative/neutral) wellbeing. See, for example, Nagel (1970).
The need to, and difficulty of, assigning values to both various states of life and to death is also a familiar challenge for measures of quality- and disability-adjusted life years (QALYs and DALYs). For discussion, see, for example, Sassi (2006).
This is entailed by, for instance, a standard formulation of utilitarianism. In classical utilitarianism, the value of an outcome is the sum total of wellbeing in it, where wellbeing consists in happiness. On this view, ceteris paribus, extending an overall happy life is good, whereas extending an overall unhappy life is bad. ‘Good’ and ‘bad’ are understood either in terms of being good/bad for the person or good/bad ‘for the world’. We are not endorsing classical utilitarianism here, but merely point out that aligning the neutral point with the zero point on the appropriate wellbeing scale (whatever that happens to be) would be a textbook view in ethics.


Thanks for this, it is interesting and important.
I don't however think these issues with point estimates are biggest problem with wellbeing research, these issues are important yes for calibration, but a bigger problem is whether reported increases in wellbeing after an intervention are real or biased. I have said this before, apologies for being a stuck record.
These two biases which don't necessarily affect point estimates (like you discuss above) but affect before and after measurements...
Demand/ courtesy bias. Giving higher wellbeing score after the intervention because you think that is what the researcher wants.
"Future hope" bias. Giving higher scores after any intervention, thinking (often rationally and correctly) that the positive report will make you more likely to get other, even different types of help in future. This could be a huge problem in surveys among the poor but there's close to no research on it.
These might be hard to research and are undrafted, but I think it is important to try.
We should keep in mind though these two bias don't only affect wellbeing surveys, but to some degree any self reported survey, for example the majority of give directly's data.
Hi Nick,
Thanks for pointing out both kinds of biases. These biases can cause a failure of comparability. Concretely, if an intervention causes you to give counterfactually higher scores as a matter of ‘courtesy’ to the researcher, then the intervention changed the meaning of each given response category.
I therefore take it that you don’t think that our particular tests of comparability will cover the two biases you mention. If so, I agree. However, my colleague has given reasons for why we might not be as worried about these sorts of biases.
I don’t think this can be tested in our current survey format, but it might be testable in a different design. We are open to suggestions!
Not only courtesy, but also future hope (which I think may be more important here).
Yeah it's really hard to test. I think validity of point estimates are pretty reasonable for wellbeing surveys and I agree with most of the reasoning on this post.
It's very had to test those biases ethically, but probably possible. Not in this kind of survey anyway.
The reasons he gave for not being worried about those biases were not unreasonable, but based on flimsy evidence. Especially future hope bias which may not have been researched at all.