Samuel Dupret
Posts 12
Comments23
Thank you for taking the time to reply. Your responses to 1a and 1b make sense to me. 2 I'm still exploring and turning these ideas around in my mind - thank you for the paper. I wonder if some of this can be tested by asking people about their number of desires, general life satisfaction, % life satisfaction/desires fulfilled.
If I may, I'd like to expand a bit on number 1.
- It seems like in terms of extending lives minimalist views have an Epicurean view of the badness of death / value of life? The good of saving a life is only the spillovers (what the person would do to the wellbeing of others, the prevented grief, etc).
- If we narrow the scope to improving existing lives, is the general conclusion of minimalist wellbeing theories that we should deliver interventions that prevent/reduce suffering rather than add wellbeing?
Thank you for presenting these views! This was very interesting.
I have some questions of interest to me - apologies if I've missed something and for these being slightly outside of scope.
- Can one use these views in a quantification exercise (e.g., cost-effectiveness of interventions in terms of wellbeing), and if so, how would this work?
- How distinct would minimalism be from prioritarianism / views focused on reducing suffering?
- Couldn't someone still be an offsetter but dislike the roller-coaster life compared to a more neutral life because they add a discount for variance?
- To me, antifrustrationism doesn't sound too different from non-minimalist preferentialism. Can you help me understand, please. All the desires I have can create a frustration if not satisfied, whether that desire is to have more board games or to have less pain. Say I have both of these desires satisfied, I've removed 2 units of frustration from the leger / satisfied 2 desires, right? I've resolved the same % of preferences on both views. Or is that me already thinking in minimalist terms that preferentialism is a % of things to resolve?
Excited to see more work on mental health charities! Thank you for this. I will need a bit of time to read before I comment I could comment in more detail.
What's stopping me from have a good overview of your results is that the cost-effectiveness of each proposed intervention is on a different mental-health outcome. If I am not mistaken, these have different scale sizes. Do you have results converted in effect sizes (Cohen's d)? This would mean all the outcomes are converted to the same unit, standard deviations. This makes it easier to compare and allows you to compare them to other interventions that are also evaluated in affect/wellbeing (e.g., McGuire et al., 2022).
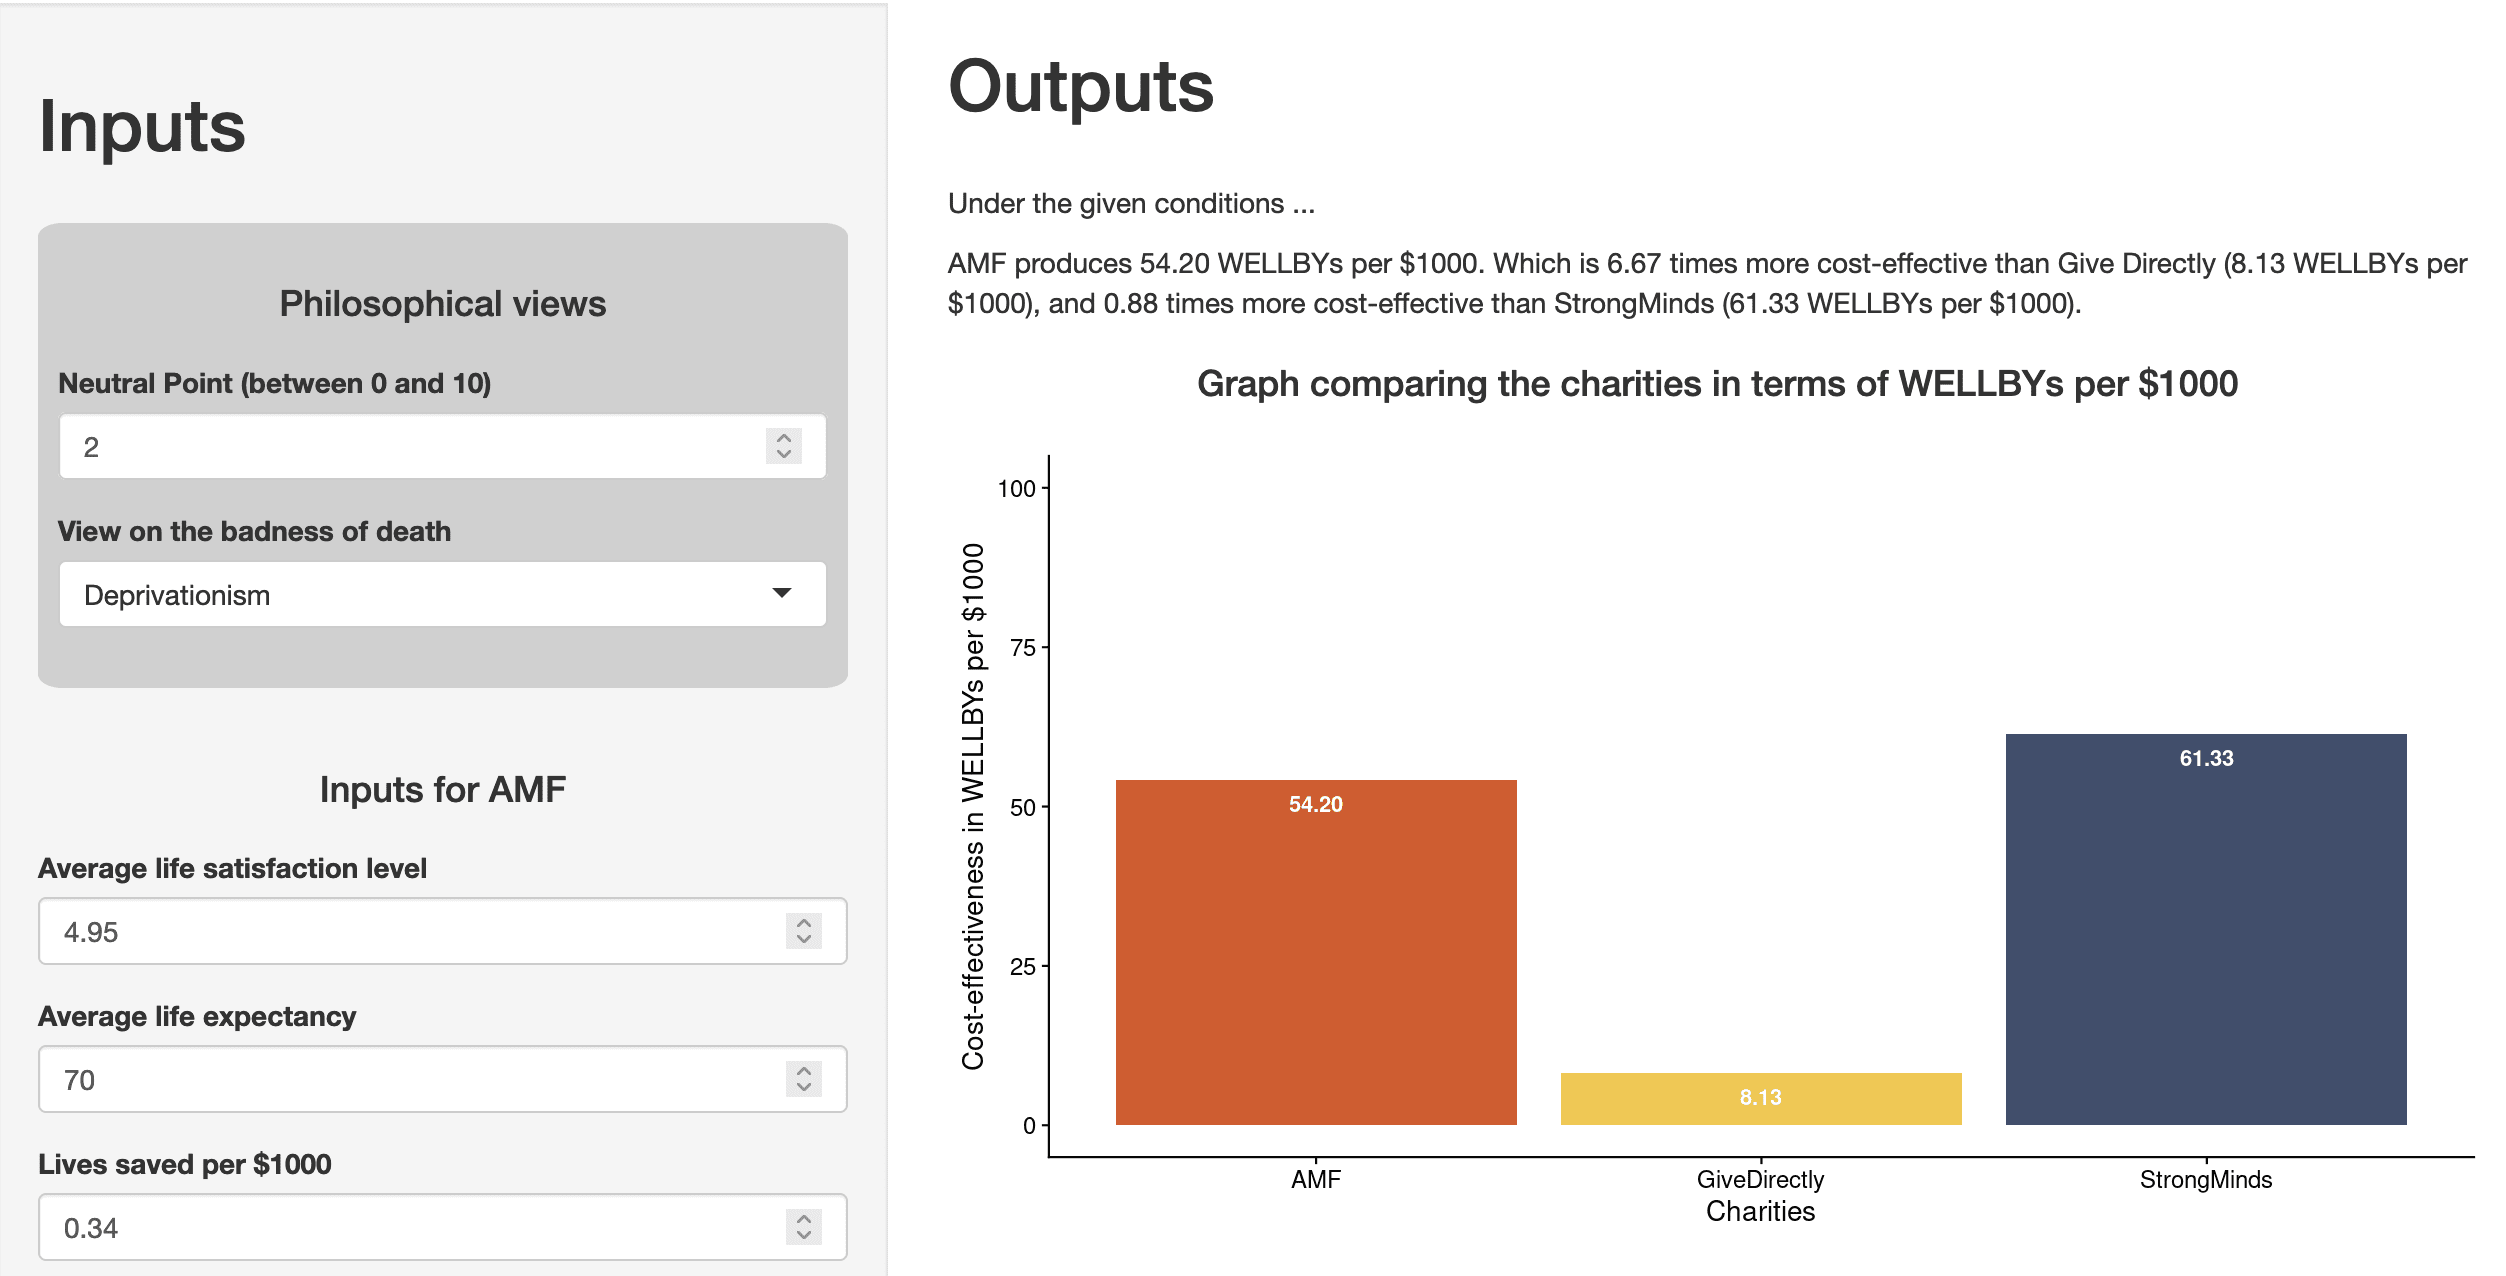
As my colleagues have mentioned in their responses (Michael's general response, Joel's technical response), the WELLBYs per $1000 that GiveWell put forward for AMF are dependent on philosophical choices about the badness of death and the neutral point. There are a range of plausible possible choices and these can affect the results. HLI does not hold a view.
We've whipped up an R Shiny app so that you, the reader, can play around with these choices and see how your views affect the comparison between StrongMinds and AMF.
Please note that this is a work in progress and was done very quickly. Also, I'm using the free plan for hosting the app so it might be a bit slow/limited in monthly bandwidth.
Hi Nick,
Thanks for pointing out both kinds of biases. These biases can cause a failure of comparability. Concretely, if an intervention causes you to give counterfactually higher scores as a matter of ‘courtesy’ to the researcher, then the intervention changed the meaning of each given response category.
I therefore take it that you don’t think that our particular tests of comparability will cover the two biases you mention. If so, I agree. However, my colleague has given reasons for why we might not be as worried about these sorts of biases.
I don’t think this can be tested in our current survey format, but it might be testable in a different design. We are open to suggestions!
Hello Henry,
Thank you for presenting this thought experiment.
The core here is about whether groups like the Sentinelese who do not have the same levels of development as others would give similar levels of SWB. I think the other comments here have done a great job at pointing out possible explanations.
- if Sentinelese have => wellbeing
- maybe their lifestyle works really well for their wellbeing (as Charlie mentions, we might not want to be too quick to dismiss this possibility). It would be a cool area to research.
- maybe there are issues of interpersonal comparability in scale use, which is what we are exploring with our pilot.
- maybe they have access to factors (e.g., social ties) that improve wellbeing without being affected as much by reference frames (e.g., the benefit I get from a higher income is relative to other people) or hedonic adaptation (as pointed out by Alex).
- if Sentinelese have < wellbeing
- As Nick pointed out, countries with lower levels of development tend to have lower levels of LS. [edit: adding this figure here because it represents this well and supports the validity of SWB scales]
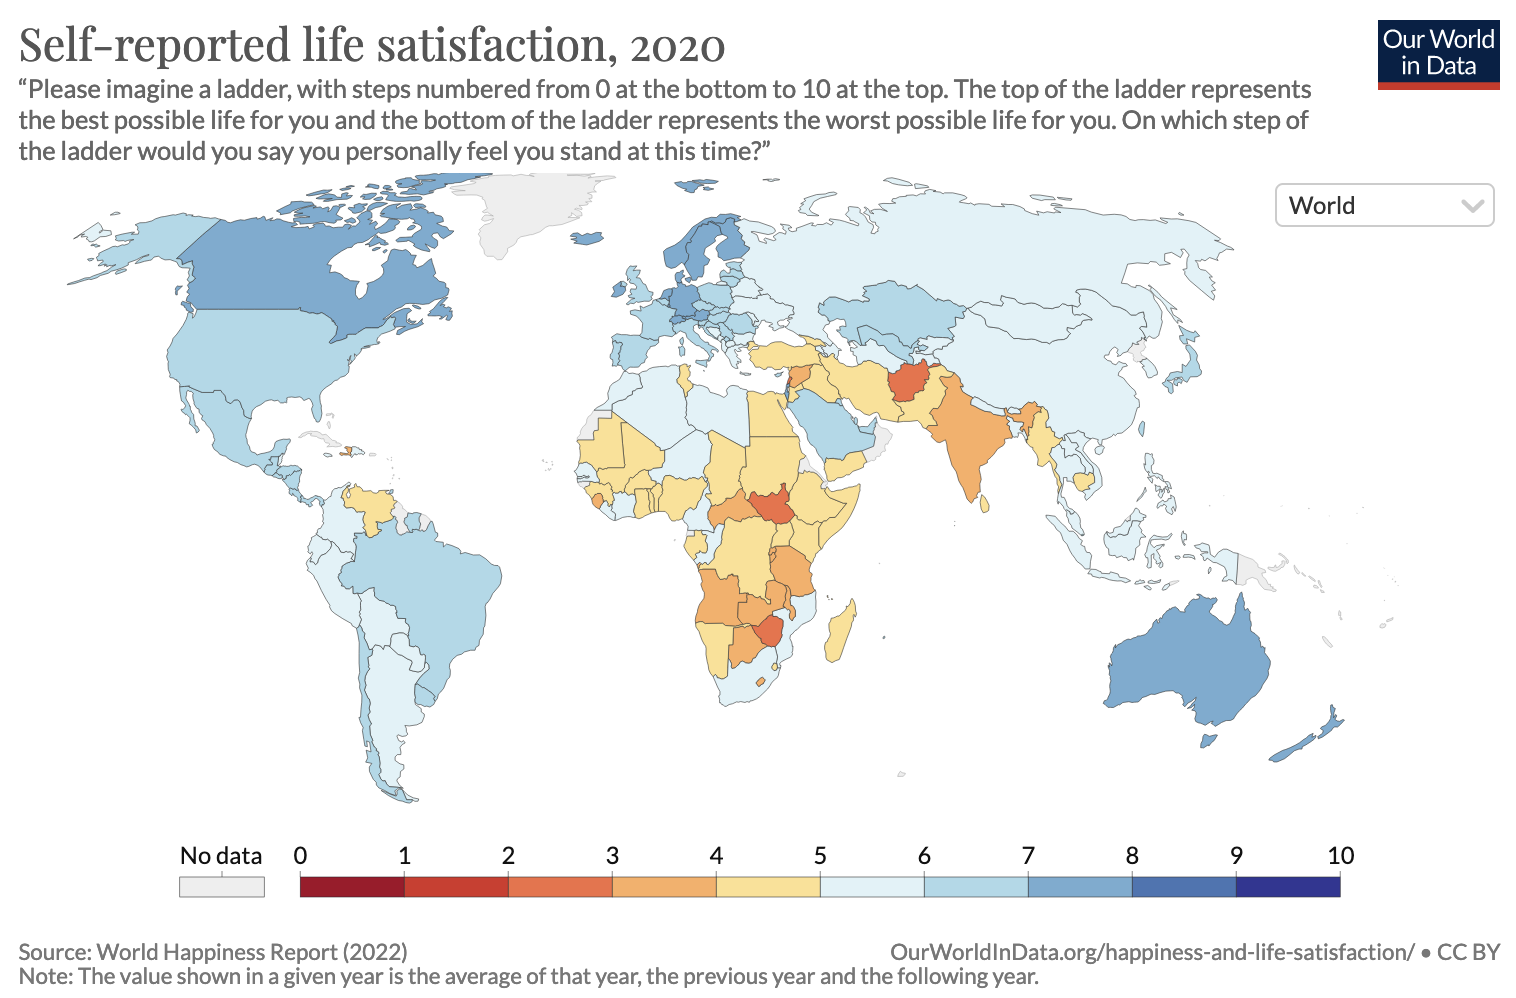
- It might be well worth the investment (especially as Vasco pointed out, it can increase the number of humans and life expectancy)
- It is possible that whilst our development reached a point where we have higher wellbeing, it did so through inefficient periods and our task now is to think more carefully about how to do (and whether there are adverse consequences like climate change, x-risks, etc.)
- As Nick pointed out, countries with lower levels of development tend to have lower levels of LS. [edit: adding this figure here because it represents this well and supports the validity of SWB scales]
Some briefs answers / pointers. Many of these things have been discussed in more details elsewhere.
- The estimate for grief is shallow [edit: I want to make this point a bit stronger - this was a quick estimate and it is a tad unfair to compare it to the SM estimate which represents hundreds of hours of work and meta-analyses] but important in making the difficult work of live-saving vs life-improving accurate. You can see some discussion about it from my colleague. I, personally, wouldn't be too surprised if we found a higher estimate in the future but there is some reasoning as to why this might not be as big.
- I don't think there are 'objective' measures of health widely used. DALYs and QALYs are not objective, they rely on humans reports - and contrary to SWB, these are reports about things humans are know to struggle to report on. In DALYs it is people (who do not have the conditions!) making binary judgements about which conditions are more or less healthy. In QALYs it generally involves people forecasting how their life will be in the future. See To WELLBY or not to WELLBY where we discuss the strengths and weaknesses of SWB.
- health, wealth, education, are all instrumental. Why do we want these? Because they contribute to what we believe is ultimately good for humans. Most charity evaluators give there answer in some form of wellbeing / good, either by measuring SWB as directly as possible (HLI) or converting lives and income into the moral weights of the evaluators (GW).
- There is extensive debate about the relationship between SWB and growth through the lens of the Easterlin Paradox
It's unpublished, but I actually have access to a version of it. I would have to ask Peasgood to share with anyone.