Your "best guess" is that the effect of a deworming treatment on happiness is a sudden benefit followed by a slow decline relative to no treatment? Do you have any theory of action that explains why this would be the case?
Trying to draw conclusions from such a dramatically underpowered study (with regard to this question) strikes me as absurd.
Our takeaway from this data is that there is not evidence of an effect (positive or negative).
We take these data to be our best guess because there are no prior studies of the effect of deworming on SWB, and the evidence of impact on other outcomes is very uncertain. However, all the effects are non-significant. We don’t have a theory of action because we think the overall evidence points to there being no effect (or at least just a very small one).
We ran the cost-effectiveness analysis as an exercise to see how deworming would look if we took the data at face-value. The point estimate was negative, but the confidence interval was so wide that the results were essentially uninformative, which converges with our conclusion that there is not a substantial effect of deworming on long-term wellbeing.
That being said, we can make assumptions that are favorable to deworming, such as assuming the effect cannot be negative. This, of course, involves overriding the data with prior beliefs — prior beliefs that we lack strong reasons to hold. In any case, we explore the results under these favorable assumptions in Appendix A2. In all plausible cases, deworming is still less cost-effective than StrongMinds, so even these exploratory analyses —which, again, we don’t endorse— don’t change our conclusion to not recommend deworming over StrongMinds.
Regarding power
Trying to draw conclusions from such a dramatically underpowered study (with regard to this question) strikes me as absurd.
It is unclear what evidence you use to claim the study is underpowered. As Joel mentioned in his comment to MichaelStJules (repasted below), we had 98% power to detect effect sizes of 0.08 SDs, the effect size that would make deworming more cost-effective than StrongMinds .
Assuming (generously) that the effects of deworming couldn't become negative, then the initial would need to be 0.08 SDs for deworming to beat StrongMinds, which we had 98% power to detect.
In brief, we used Harrer et al.’s (2021) R library and their function for the power of a meta-analysis. With this, we computed the power we had to detect an initial effect (the intercept) of .08 SDs which was 97.88%. This uses the average sample sizes and the number of effect sizes.
We selected .08 as our smallest effect size of interest based on the results from our ‘optimistic’ model (see the Appendix A1)—which assumes the effect of deworming cannot be negative (not a model we endorse). The initial effect was .04 and the total cost-effectiveness was half that of StrongMinds. So, the effect would need to be twice as large to equal the cost-effectiveness of StrongMinds.
First a minor note here on this reponse here "We take these data to be our best guess because there are no prior studies of the effect of deworming on SWB, and the evidence of impact on other outcomes is very uncertain. However, all the effects are non-significant. We don’t have a theory of action because we think the overall evidence points to there being no effect (or at least just a very small one)."
Where data is as bad as this, it's better to say that there is not enough meaningful data to draw a conclusion, rather than saying "with the best evidence we have (which is bad), conclusion is X". It's better to not use bad evidence at all, and say there is no meaningful evidence available, than to try and draw weak conclusions from it like you do here.
My major point - as the effect on each individual from deworming is so tiny, I don't think you're ever going to find a significant increase in self reported happiness on a blunt 3 point scale (like ths one) , even if deworming does cause people to be a little happier
Imagine that deworming really does increase 1000 recipient's happiness by 2% each. This won't tip them over the line from "happy" to "very happy" so people will report the same level of happiness. Wheras the same amount of money for Strongminds MIGHT increase 10 people's happiness by 30% each so they would all report a higher score. So even though deworming's small increase in happiness for more people would make deworming more WELLBY effective than Strongminds, the blunt 3 point scale can't possibly show this. Sorry if you discussed this already and I missed it.
On the bigger WELLBY picture, the more I think about it, I think the Happier Lives institute should prioritise funding a WELLBY measured RCT of StrongMinds vs. cash transfers A.S.A.P performed by an independent organisation, to answer 2 questions. 1. If StrongMinds really are superior to cash on the WEllBY front? 2. If before and after wellbeing scores can be valid, and not spoiled by the effects I've discussed earlier
I was super disappointed that the current StongMinds trial doesn't test this. I don't like to be cynical, but I wonder if there might be fear around what the potential result of that trial might be, leading to that research not happening. At this stage StrongMinds have FAR more to lose than to gain from a head to head trial vs. cash...
About your major point first. If it was up to us (we didn’t collect this data), we would use a nicer 0-10 scale. However, this is the only SWB data we are aware of. There are other measures of wellbeing in the data (including a 1-10 scale, some 1-6 frequency scales, and some binary scales) but the 3-point scale is the only measure that was collected across all three KLPS rounds. None of the other measures are significant. Some are negative, some are positive. In Appendix A3.1 we conduct an analysis where we use the effect sizes of all the other measures, and we obtain very similar results, which gives us more confidence about this measure.
Imagine that deworming really does increase 1000 recipient's happiness by 2% each. This won't tip them over the line from "happy" to "very happy" so people will report the same level of happiness
I’m not sure this is completely true. Some people will be tipped over the line; namely, all the people that are 2% away from changing between categories (the people who answer ‘not happy’ but will be close to answering ‘happy’).
Where data is as bad as this, it's better to say that there is not enough meaningful data to draw a conclusion, rather than saying "with the best evidence we have (which is bad), conclusion is X". It's better to not use bad evidence at all, and say there is no meaningful evidence available, than to try and draw weak conclusions from it like you do here.
Both the literature (that does not contain SWB data; Section 1.3) and this SWB data (the only we could find) do not give us good grounds to recommend deworming. For completeness, we go through many considerations that we present in Section 2.3 (alternative analyses, Bayes factors, cost-effectiveness, converting GiveWell’s analysis to WELLBYs, etc.). As we note in the report, this evidence does not prove the effect is zero, but these converging lines of evidence support the conclusion that the effect is zero or very small. If strong SWB evidence that deworming is more cost-effective than StrongMinds is produced, then we would change our minds. Yes, collecting this data will be expensive, but we’d prefer some of the money going to deworming serves to nail down the effect of deworming (on SWB because we think this is what ultimately matters).
On the bigger WELLBY picture, the more I think about it, I think the Happier Lives institute should prioritise funding a WELLBY measured RCT of StrongMinds vs. cash transfers A.S.A.P performed by an independent organisation, to answer 2 questions.
1. If StrongMinds really are superior to cash on the WEllBY front?
2. If before and after wellbeing scores can be valid, and not spoiled by the effects I've discussed earlier
Just to clarify for people reading this (I know you are not saying this, it is just that I know that people too often misunderstand this): StrongMinds gives depression treatment for people in LMIC (who happen to also be poor). GiveDirectly transfers cash to people in poverty (some of which might be depressed). If you want to increase WELLBYs, StrongMinds will produce more WELLBYs per dollar than GiveDirectly. We are not suggesting that psychotherapy treats poverty nor that psychotherapy should be given to non-depressed poor people. The reasons why psychotherapy can help in LMICs are (1) the lower costs and (2) the counterfactual that there are many people there who need help with mental health and that LMICs rarely have any infrastructure to help (and sometimes, when they do have some, it involves actively hurting people - like chaining people up). There is a bidirectional relationship between poverty and mental health that is complex and fascinating (Ridley et al., 2020).
With that out of the way (sorry, I know this wasn’t your point), the RCT you propose would be testing whether giving the StrongMinds sessions helps their depressed patients more than giving them the cash equivalent of that session. This is, admittedly, very interesting and can provide extra data about the effect of cash on people with depression and using a very special kind of active control. We do not have the funding to do something like that for now. Additionally, I think there might be other areas that are more in need of investigation (e.g., more research on household spillovers). Resources permitting we would be interested in conducting more RCTs with partners
Thank you for engaging with our work, I hope our answers help.
Because the effect of deworming is small and becomes negative over time, our best guess finds that the overall cost-effectiveness of deworming is negative. Even under more generous assumptions (but still plausible according to this data), deworming is less cost-effective than StrongMinds. Therefore, we do not recommend any deworming charities at this time. To overturn this conclusion, proponents of deworming would either need to (1) appeal to different SWB data (we’re not aware of any) or (2) appeal to a non-SWB method of comparison which concludes that deworming is more cost-effective than StrongMinds.
Couldn't you estimate the causal effects of deworming on consumption (or income or wealth) and combine with the causal effects of consumption on SWB? (Did HLI do this before?) My best guess would still be that the effect is positive, but the study here was underpowered.
Maybe an alternative analysis would be to estimate the smallest positive effect size on SWB that should have been detectable with a study of this size and design (with a given p-value cutoff), and use that to get an approximate upper bound estimate on the cost-effectiveness of deworming on SWB.
Couldn't you estimate the causal effects of deworming on consumption (or income or wealth) and combine with the causal effects of consumption on SWB? (Did HLI do this before?) My best guess would still be that the effect is positive, but the study here was underpowered.
We did this in section 3.4 of the Appendix. Converting from economic benefits to SWB came up with 28 WELLBYs per $1000. This is better than GiveDirectly (8 WELLBYs per $1000) but less than StrongMinds (77 WELLBYs per $1000).
Maybe an alternative analysis would be to estimate the smallest positive effect size on SWB that should have been detectable with a study of this size (with a given p-value cutoff, say 5% or lower), and use that as an approximate upper bound for the cost-effectiveness of deworming.
We did a variant of this in a previous version of the report (it didn't seem to make it into the final cut), where we estimated whether we could detect if deworming in the KLPS had a large enough effect to be more cost-effective than StrongMinds. Assuming (generously) that the effects of deworming couldn't become negative, then the initial would need to be 0.08 SDs for deworming to beat StrongMinds, which we had 98% power to detect.
I don't see why you used a linear regression over time. It seems implausible that the trend over time would be (non-flat) linear, and the three data points have enough noise to make the estimate of the trend extremely noisy.
Our main conclusion is that these data don’t demonstrate there is an effect of deworming, as all the point estimates are all non-significant (see further discussion in Section 2.3).
We conducted the cost-benefit analysis as an exercise to see what the effects look like. We took the trend in the data at face value because the existing literature is so mixed and doesn’t provide a strong prior.
Thank you for your engagement with our research. Our research team is going on winter break so we might not respond to additional comments until after the holidays.
The point is to form a view on whether we recommend deworming. What matters to us are effects on subjective wellbeing. We would like to restate that this is the only SWB data on deworming that we could find, and this the only SWB analysis that we know of. The effects are non-significant, so this data does not give us good grounds to recommend deworming (see Section 4). The broader literature on outcomes other than SWB (reviewed in Section 1.3) is so mixed that our results do not strike us as particularly surprising – it’s just one null result amongst many.
We could just stop there, but because this is a novel analysis and dealing with non-significant findings isn’t easy, we aired on the side of being overly-thorough. For completeness, we discuss many other considerations in Section 2.3 (alternative analyses, Bayes factors, cost-effectiveness, converting GiveWell’s analysis to WELLBYs, etc. - cost-effectiveness being one of them). These converging lines of evidence all fail to provide good grounds to recommend deworming. Of course, non-significant findings do not prove there is no effect, and we discuss limitations of the data in section 5 that highlight key uncertainties about the results. In section 6, we discuss future research that could help address these limitations.
If strong evidence is produced showing that deworming is more cost-effective than StrongMinds for SWB, then we would change our recommendation. Collecting this data could be expensive, but given the insufficient evidence we think it is necessary for proponents to clarify the effect of deworming on SWB (which we think is what ultimately matters).
Have a nice end of the year and keep doing good folks.
If I recall correctly, the impacts of deworming were supposed to be through transition to higher paying jobs like textile manufacturing (but it's been a while since I looked into this, so may be misremembering). Maybe the work pays better and people voluntarily choose it, but is actually less pleasant (harder, more stressful, etc.?) than what they would be doing otherwise?
Hi Michael, Thank you for trying to connect the non-sig wellbeing findings and the non-sig wealth findings of the KLPS. Indeed, Baird et al. (2016) found an increase in people from the treatment condition having manufacturing jobs (see their Table III). However, they only used the KLPS 2 round. Hamory et al. (2021) use KLPS 2, 3, and 4 and find a tiny, negative, non-significant decrease in manufacturing jobs for the treatment condition. What they do find is fewer hours worked in agriculture and more hours worked in non-agriculture. I don’t read much into any of these.
A low reliability outcome measure attenuates the measured effect size. So if researchers measure the effect of one intervention on a high-quality outcome measure, and they measure the effect of another intervention on a lower-quality outcome measure, the use of different measures will inflate the apparent relative impact of the intervention that got higher-quality measurement. Converting different scales into number of SDs puts them all on the same scale, but doesn't adjust for this measurement issue.
For example, if you have a continuous outcome measure and you dichotomize it by taking a median split (so half get a score of zero and half get a score of one), that will shrink your effect size (number of SDs) to about 80% of what it would've been on the continuous measure. So if you would've gotten an effect size of 0.08 SDs on the continuous measures, you'll find an effect size of .064 SDs on this binary measure.
I think that using a three point scale to measure happiness should produce at least as much attenuation as taking a continuous measure and then carving it up into three groups. Here are some sample calculations to estimate how much that attenuates the effect size. I believe the best case scenario is if the responses are trichotomized into three equally sized groups, which would shrink the effect size to about 89% of what it would've been on the continuous measure, e.g. from .08 to .071. At a glance I don't see descriptive statistics for how many people selected each option on the happy123 measure in this study, so I can't do a calculation that directly corresponds to this study. (I also don't know how you did the measurement for the study of StrongMinds, which would be necessary for comparing them head-to-head.)
This is an interesting topic, but we’d need more time to look into it. We would like to look into this more when we have more time.
We agree that the 3-point measure is not optimal. However, we think our general conclusion still holds when we examine the effect using other measures of subjective wellbeing in the data (including a 1-10 scale, some 1-6 frequency scales). None of the other measures are significant, and we get a similar result (see Appendix A3.1).
Are you suggesting that this (1-.89 = .11) 11% shrinkage would justify increasing the cost-effectiveness of deworming by 11%? If so, even such an adjustment applied to our ‘optimistic’ model (see Appendix A1) would not change our conclusion that deworming is not more cost-effective than StrongMinds (and even if it did, it wouldn’t change the larger problem that the evidence here is still very weak and noisy).
(I also don't know how you did the measurement for the study of Stronger Minds, which would be necessary for comparing them head-to-head.)
The StrongMinds analysis is based on a meta-analysis of psychotherapy in LMICs combined with some studies relevant to the StrongMinds method. This includes a lot of different types of measures with varying scale lengths.
I think the correct adjustment would involve multiplying the effect size by something like 1.1 or 1.2. But figuring out the best way to deal with it should involve some combination of looking into this issue in more depth and/or consulting with someone with more expertise on this sort of statistical issue.
This sort of adjustment wouldn't change your bottom-line conclusions that this point estimate for deworming is smaller than the point estimate for StrongMinds, and that this estimate for deworming is not statistically significant, but it would shift some of the distributions & probabilities that you discuss (including the probability that StrongMinds has a larger well-being effect than deworming).
This is a crosspost from the new Animal Welfare Alignment Newsletter by Anima International. You can subscribe on Substack if you are interested in following these efforts. Audio reading also available on Substack.
The goals of this post are to:
1. Raise a question I see as crucially important to the goal of aligning AI to animal welfare...
“How long have you been v*g*n?”
This is one of the most common icebreakers at animal protection events. It’s a baseline assumption, and it mostly holds true: if you’re out advocating for animals not to be tortured or abused, realistically these days you are v**n, or close. And it makes for good conversation. It seems fairly safe to assume when you meet strangers.
But this assumption is hurting the movement in a way which we don’t always notice: someone new comes into the sp...
Summary
Back in November 2023 I posted here to launch Spiro and raise our first $198k. Two and a half years later this is an update and a fundraiser for the next step.
The short version: we've now reached over-5,900 people with TB preventive medicine, including over 3,000 children under five years old. Our early results have held up well an...
Mass deworming, where many people are provided drugs to treat parasitic worms, has long been considered a highly cost-effective intervention to improve lives in low-income countries. GiveWell directed over $163 million to deworming charities since 2010. Nevertheless, there are long-running debates about its impact and cost-effectiveness. In this report, we summarise the debate about the efficacy of deworming, present the first analysis of deworming in terms of subjective wellbeing (SWB), and compare the cost-effectiveness of deworming to StrongMinds (our current top recommended charity).
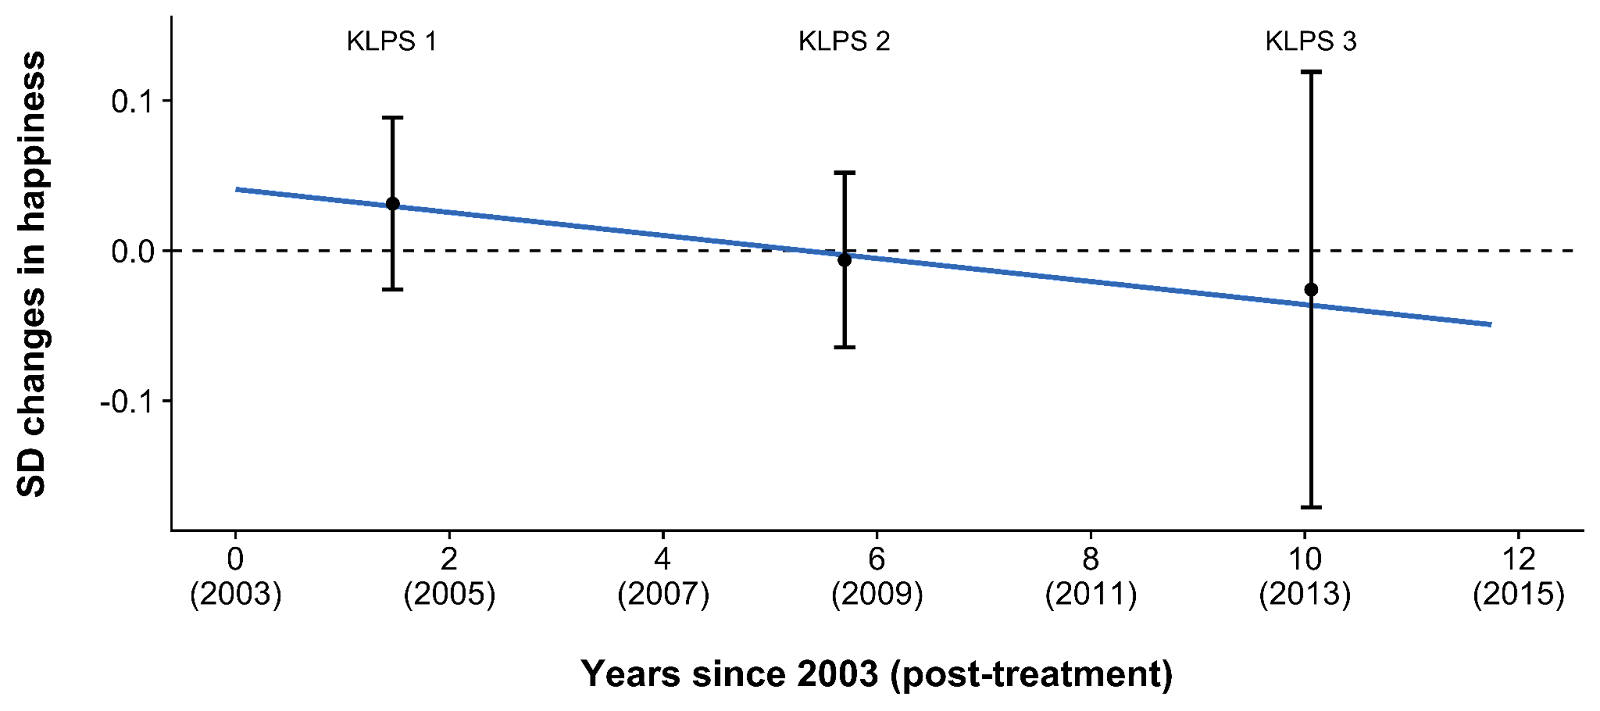
Analysing SWB data from the Kenyan Life Panel Survey (KLPS; Hamory et al., 2021), we find that deworming has a small, statistically non-significant effect on long-term happiness that seems (surprisingly) to become negative over time (see Figure 1). We conclude that the effect of deworming in the KLPS is either non-existent or too small to estimate with certainty. Typically, an academic analysis could stop here and not recommend deworming. However, the non-significant effects of deworming could be cost-effective in practice because it is extremely cheap to deliver. Because the effect of deworming is small and becomes negative over time, our best guess finds that the overall cost-effectiveness of deworming is negative. Even under more generous assumptions (but still plausible according to this data), deworming is less cost-effective than StrongMinds. Therefore, we do not recommend any deworming charities at this time. To overturn this conclusion, proponents of deworming would either need to (1) appeal to different SWB data (we’re not aware of any) or (2) appeal to a non-SWB method of comparison which concludes that deworming is more cost-effective than StrongMinds.
Figure 1: Differences in happiness between treatment and control groups over time
Note. The point estimates show the difference (in Cohen’s d) in happiness between the treatment and control group at each time point. The bars represent 95% confidence intervals. The regression line shows the trend of the difference between treatment and control over time.
1. Background and literature
In this section, we present the motivation for this analysis, the work by GiveWell that preceded this, and the broader literature on deworming. We then present the details and context of the dataset we use for this analysis – the Kenyan Life Panel Survey (KLPS).
1.1 Our motivation for this analysis
The Happier Lives Institute evaluates charities and interventions in terms of subjective wellbeing (SWB) - how people think and feel about their lives. We believe that wellbeing is what ultimately matters and we take self-reports of SWB to be the best indicator of how much good an intervention does. If deworming improves people’s lives, those treated for deworming should report greater SWB than those who aren’t. SWB should capture and integrate the overall benefits from all of the instrumental goods provided by an intervention.[1] For example, if deworming makes people richer, and this makes them happier, they will report higher SWB (the same is true for improvements to health or education). Although we are not the first to use SWB as an outcome for decision-making (e.g., UK Treasury, Frijters et al., 2020,Birkjaer et al., 2020,Layard & Oparina, 2021), we are the first to use it to compare the impact of charities. See McGuire et al. (2022b) for more detail about why we prefer the SWB approach to evaluate charities.
To determine whether the SWB approach changes which interventions we find the most cost-effective, we have been re-evaluating the charity recommendations of GiveWell (a prominent charity evaluator that recommends charities based on their mortality and economic impacts). For a review of our recent research, see this post. We present our findings in wellbeing-adjusted years (WELLBYs), where 1 WELLBY is the equivalent of a 1-point change on a 0-10 SWB measure.
1.2 GiveWell’s history with deworming
From 2010 until August 2022, GiveWell’s list of top charities included four charities that provide mass deworming.[2] However, deworming does not fulfil their new criteria for top charities because it does not have “a high likelihood of substantial impact”. Although GiveWell “no longer accept donations on behalf of […] the four deworming programs previously on our top charity list”, they still provide funding to these charities through their All Grants Fund.
GiveWell’s (2018) analysis of the long-term effects of deworming is based on a single dataset, the Kenyan Life Panel Survey (KLPS; Hamory et al., 2021), which follows recipients from a deworming program in Kenya (see Section 1.3.3 for more details). They treat the primary benefits of deworming as the relative income and consumption benefits accumulated in the 20 years following treatment (Hamory et al., 2021). GiveWell has investigated deworming for much longer than we have and we rely on some of their work (e.g., worm burden adjustments and charity costs) in our analysis. Nevertheless, we aim to improve on this earlier analysis in two ways:
Adequately accounting for total effects over time. GiveWell focuses on economic effects and assumes that these do not decay over time. In an earlier reanalysis of the economic effects, we pointed out that this was not justified by the relevant data: the KLPS study shows a decay over time, which substantially reduces the total effects (see our detailed critique).
Measuring the effects of deworming on SWB, not wealth. Contrary to GiveWell, we make use of the SWB data available in the KLPS. As noted, we believe ours is the first attempt to assess the cost-effectiveness of deworming in terms of SWB.
1.3 What is deworming and what are the arguments over its effectiveness?
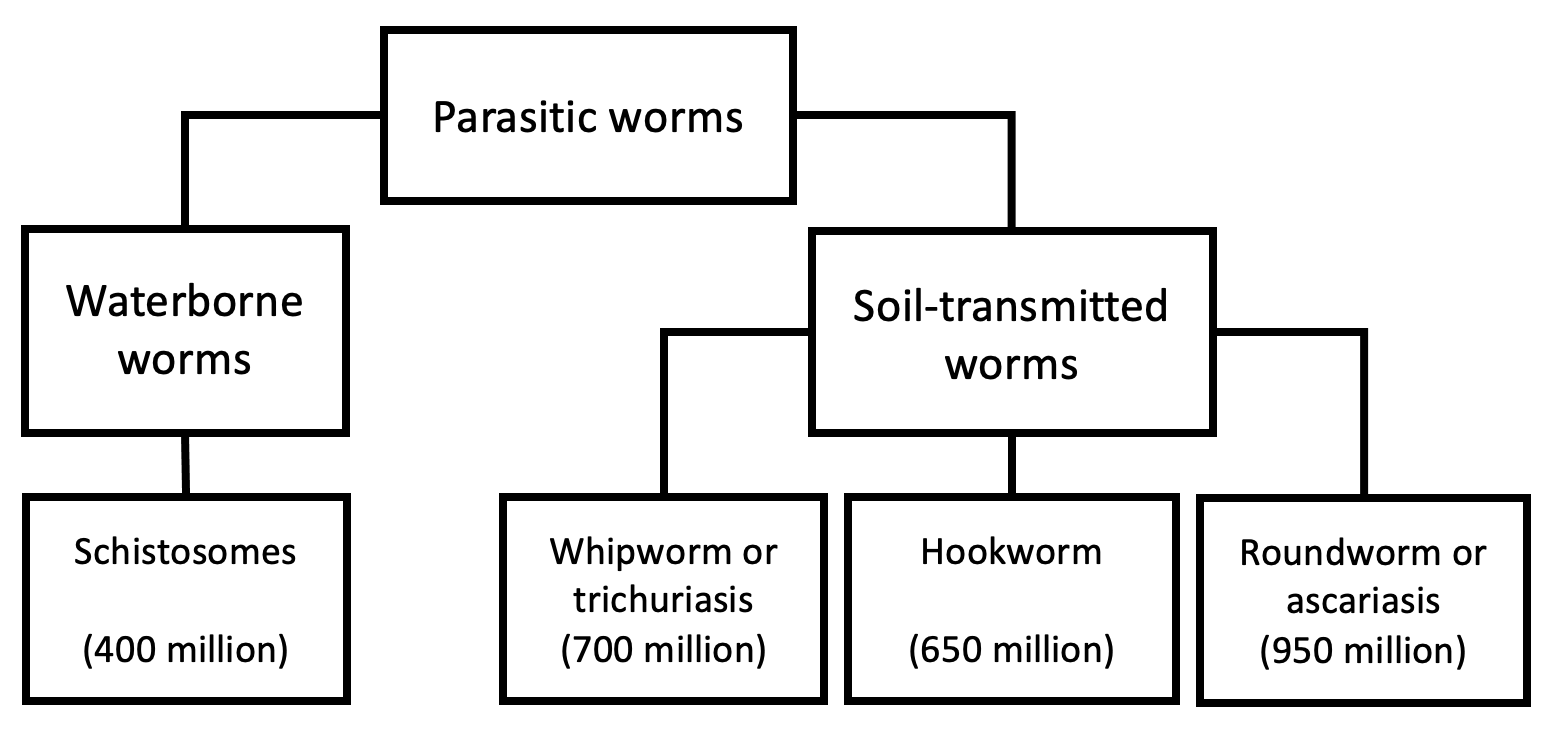
Parasitic infections from worms affect around a billion people in mostly low- and middle-income countries (see Figure 2), and cause a range of health problems (Else et al., 2020; WHO, 2011). Lack of proper sanitation or health behaviours increases the risk of transmission because infected individuals can contaminate soil and water via their waste. These infections can cause a range of urinary, intestinal, nutritional, cognitive, and developmental problems.
Figure 2: Overview of parasitic worm types targeted by deworming and their global prevalence
Note. This description and data is adapted from GiveWell’s (2018) report on deworming.
The World Health Organisation (WHO) recommends mass deworming as treatment for parasitic worms: providing anti-parasite drugs to a general (unscreened) population, usually school children, to control the prevalence of worms in an area (Else et al., 2020; WHO, 2006, 2011, 2020). Testing for worm infection is expensive but the drugs are cheap and unlikely to cause side effects[3] so they are provided to individuals without prior testing. Mass deworming decreases worm loads (e.g., Danso‐Appiah et al., 2008), although the efficacy depends on the type of parasitic worm (Else et al., 2020). Despite the general success of deworming at removing the parasites, evidence of improvements to general health or other benefits is weak.
1.3.1 The worm wars: short-term RCT evidence of deworming
The short-term effects of deworming on children’s health, cognition, and education are subject to a long and ongoing academic controversy related to the quality of its evidence bases and the significance of its results. The core of the debate centres around a series of meta-analyses of randomised controlled trials (RCTs).
Taylor-Robinson et al. (first version: 2012, latest version: 2019) argue in a Cochrane review that:
[deworming does] not appear to improve height, haemoglobin, cognition, school performance, or mortality. We do not know if there is an effect on school attendance, since the evidence is inconsistent and at risk of bias, and there is insufficient data on physical fitness. Studies conducted in two settings over 20 years ago showed large effects on weight gain, but this is not a finding in more recent, larger studies. We would caution against selecting only the evidence from these older studies as a rationale for contemporary mass treatment programmes as this ignores the recent studies that have not shown benefit.
Welch et al. (2016, 2019), in a Campbell collaboration, replicate and concur with the Cochrane review. In a meta-analysis focused on mortality, anaemia[4], and growth for children, Thayer et al. (2017) finds similarly inconsistent benefits. A meta-analysis focusing on the cognitive effects of deworming (Pabalan et al., 2018) echoed the null results of the Campbell and Cochrane reviews. In most cases, this would be the last word on the issue as Cochrane and Campbell are often regarded as the gold standard for systematic reviews across many fields. And it probably would have been – if it weren’t for the recent work of Croke and colleagues.
Croke et al. (first version: 2016, latest version: 2022), a team of economists including a Nobel laureate, meta-analysed the literature on deworming using a broader set of studies and different statistical techniques. They find - contrary to the Cochrane and Campbell reviews - that deworming has a small but statistically significant effect on weight, thus reopening the debate about the potential benefits of deworming.[5]
Proponents of deworming argue that even if the effects of deworming are small, it may still be cost-effective because deworming can be incredibly cheap ($1 per person per year of treatment according to GiveWell’s analysis). Taking Croke et al.’s figures at face value, Ahuja et al. (2018) calculated that deworming is 40 times more cost-effective at increasing children’s weight than standard school food programmes.
If we rely solely on evidence from RCTs on short-term effects, then there are no consistently detectable effects, and the evidence is debated amongst experts. However, there are quasi-experimental and experimental studies of long-term effects to consider.
1.3.2 Long-term quasi-experimental evidence of deworming
The meta-analyses discussed above only considered RCTs of short-term outcomes. We found three (there may be more) historical quasi-experimental studies that also attempt to measure the causal impact of deworming. These studies examine the long-term impact of permanent deworming ‘eradication’ - instead of yearly deworming ‘control’ - in eras and contexts that are different to those where mass deworming is commonly deployed. These studies cover deworming eradication campaigns in1920s USA (Bleakley, 2007), 1950s China (Liu & Liu, 2019), and early 2000s Nigeria (Makamu et al., 2018). These natural experiments have a combined sample size of more than a million participants (comparable to all of the RCTs combined). They find more precise and more consistently positive outcomes for the long-term effects on income (Liu & Liu, 2019; Bleakley, 2007), education (Liu & Liu, 2019; Bleakley, 2007; Makamu et al., 2018), and cognition (Liu & Liu, 2019).
If we include quasi-experiments of deworming eradication, deworming appears more promising. However, we are unsure how relevant this historical evidence is to current deworming programmes which have pursued a ‘control’ rather than ‘elimination’ strategy, operated in different countries, and operated in environments with different worm burdens. For someone to argue that these studies generalise to the modern context of today’s deworming charities, they need to demonstrate that the features that differ between contexts aren’t relevant to the outcomes of interest.[6] Vetting the sensibility of this extrapolation ourselves - and converting these effects into SWB effects - is beyond the scope of this report. Because historical deworming eradication and modern mass deworming campaigns differ substantially, the quasi-experimental evidence only weakly updates our views. However, the main data used for cost-effectiveness analyses of deworming is the KLPS, which is more relevant to today’s charities, and which we present below.
1.3.3 Long-term experimental evidence: the KLPS data
Experimental evidence of the long-term effects of interventions that aim to control (instead of eradicate) the burden of parasitic worms comes primarily from one study: the Kenya Life Panel Survey (KLPS; Baird et al., 2016; Hamory et al., 2021).[7] The KLPS follows a subset of participants from one deworming program, the Primary School Deworming Project (PSDP; Miguel & Kremer, 2004). GiveWell’s (2018, 2022) estimate of the effect of deworming primarily relies on the long-term earnings and consumption gains observed from this study. Since the KLPS is the sole source of evidence on economic effects that GiveWell uses, and the sole source of SWB data we could find, we explain the study and its follow-up data in detail below.
The PSDP was implemented in southern Busia in Kenya by Internationaal Christelijk Steunfonds Africa (a Dutch NGO) and the Busia District Ministry of Health office. They pseudo-randomised 75 schools (32,565 pupils) into three groups of 25 which received deworming[8] and health education[9] starting at different times across 1998-2003. Group 1 received ~6 years of deworming treatment (starting in 1998), Group 2 received ~5 years of deworming treatment (starting in 1999), and Group 3 received ~3 years of deworming treatment (starting in 2001). Hence, Groups 1 and 2 received, on average, 2.41 extra years of deworming than Group 3. Groups 1 and 2 are considered ‘treatment’ groups (50 schools) and Group 3 is considered a ‘control’ group (25 schools). Hence, when we mention ‘the effect of deworming’ we are really talking about ‘the effect of more deworming’. Although there is no ‘true’ control who did not receive deworming, the existing control group should provide a conservative reference group.
The data comes from the KLPS which follows a sample of ~7,500 PSDP participants with tracking rates of ~84% from 2003-2019 (Baird et al., 2016; Hamory et al., 2021). There are four rounds of the KLPS: KLPS 1 (2003-2005), KLPS 2 (2007-2009), KLPS 3 (2011-2014), and KLPS 4 (2017-2019). Rounds 1-3 are available online. KLPS 4 is not available online yet, but replication materials for Hamory et al.’s (2021) economic analyses of that dataset are available online.
In early surveys of PSDP recipients, Miguel and Kremer (2004) found that deworming significantly increased school participation in 1999 (but not test scores or weight, nor reduced anaemia).[10] Baird et al. (2016) and Hamory et al. (2021) focus on the long-term benefits of deworming using the KLPS. Note that the previously discussed meta-analyses focused on the short-term effects of deworming, so they included findings from Miguel and Kremer but not from Baird et al. and Hamory et al.[11] At the 10-year follow-up (KLPS 2), Baird et al. (2016) found that deworming significantly increased economic and educational outcomes for some subsets of the population. Hamory et al. (2021) found that deworming produced a non-significant increase in earnings and consumption from the 10-year to the 20-year follow-up (KLPS 2 to KLPS 4). GiveWell’s analysis is based on the estimated relative earnings and consumption benefits for recipients of deworming. GiveWell (2016, 2018) argues that deworming is likely to be cost-effective on the grounds that, even after discounting the effect by almost 99%, the effect still suggests that deworming has high (albeit uncertain) expected value in terms of economic benefits.
Before our analysis of the wellbeing data, we present potential pathways through which deworming can improve wellbeing in the section below.
1.3.4 Potential causal pathways
In Figure 3, we illustrate a simple model of the potential pathways for deworming to influence wellbeing (inspired by Taylor-Robinson et al., 2019). To give one example of the many pathways, deworming in childhood may lead to improved cognitive abilities, which increases education, which in turn yields a greater income later in life, which ultimately benefits wellbeing. But again, we think the evidence that deworming impacts any of these outcomes is uncertain.
Figure 3: Diagram of causal mechanisms for deworming to impact wellbeing
2. Wellbeing analysis
In this section, we present our modelling of the impact of deworming on wellbeing. In Section 2.1 we present the wellbeing data we use. In Section 2.2 we present our non-significant results for the effect of deworming on happiness. In Section 2.3 we interpret these non-significant results.
2.1 The KLPS wellbeing data
Although there are multiple measures of SWB in the KLPS data, only one measure (hereafter, happy123) was included across all three available follow-ups.[12]happy123 asked respondents: “Taking everything together, would you say you are somewhat happy, very happy or not happy? (very happy, somewhat happy, not happy, don’t know)”.[13] In Appendix A3.1, we conduct a version of this analysis where we combine all the available measures and find similar results, which suggests that the analysis using happy123 is consistent with the other measures.
In Table 1, we show how many responses were provided for each condition. Note that the KLPS tracks 7,527 respondents - 2,564 in the control condition and 4,963 in the treatment condition.[14]
Table 1: Number of responses to happy123 across the follow-ups
KLPS Round
1
2
3
Respondents to happy123 in the control condition
1,783
1,707
276
Respondents to happy123 in the treatment condition
3,417
3,380
539
Total respondents to happy123
5,200
5,087
815
Total respondents in data
5,209
5,094
5,259
Note. The response rate to happy123 was 69% at KLPS 1, 68% at KLPS 2, and 62% at KLPS 3. The response rates were nearly identical in the treatment and control groups at each time point, suggesting that differential attrition by group was not an issue in the study.
2.2 Non-significant effects of deworming on happiness
The goal of our primary analysis is to calculate the total effect of deworming on wellbeing over time. To do so, we standardise the mean difference in happiness between the control and the treatment group with Cohen’s d (Lakens, 2013). We do this for each follow-up round of the KLPS. Then we use a meta-regression[15] to estimate the trajectory of the effect over time. We present a summary of the data we use for the meta-regression in Table 2.
Table 2: Summary of happy123 data used in the meta-regression
Note. The SD pooled is the standard deviation for the mean difference. It is used to calculate Cohen’s d. The standard error (SE) of d is the error around Cohen's d which is used for the 95 CI interval and to determine statistical significance.
To model the effects over time we need to define two parameters: the initial effect and the rate at which the effect decays. In our previous analyses (McGuire et al., 2022a), we’ve defined the initial effect as the effect when the treatment ends. In this case, both the treatment and the control conditions finish receiving their deworming treatment in 2003, which is also when the KLPS 1 data collection starts.
To determine the decay rate, we estimate the average difference in happiness across each KLPS round at their average follow-up in years since 2003. The earliest follow-up responses are on average 1.47 years after treatment ended (the middle of 2004).[17] Hence, the trendline for the decay is being extrapolated backwards a year and a half to estimate the initial effect. This is the same approach we took in our cost-effectiveness analysis of cash transfers (McGuire & Plant, 2021a). As we explain in Section 3, the total effect is very sensitive to exactly when we specify that the effects start and end.
The outcome of our model is reported in Table 3 and illustrated in Figure 4. The intercept is the initial effect (the effect post-treatment). The decay is how much the effect changes each year. According to this model, participants in the treatment group reported being 0.041 SDs happier than participants in the control group right after treatment, and this difference decayed by -0.008 SDs each year. The regression line predicts that the effect reaches zero and turns negative after 0.041 / 0.008 = 5.3 years. However, none of these effects are statistically significant (i.e., they are not distinguishable from 0) and the effects after 6 years (KLPS 2) and 10 years (KLPS 3) are - if anything - negative, so it is unclear if any of these effects are meaningful or just statistical noise. We discuss this in detail in the next section.
Table 3: Results of the meta-regression showing treatment effect on happiness over time
Term
Estimate (in SDs)
Standard Error
t-value
p-value
Intercept ('initial effect')
0.041
0.036
1.121
.463
Years since 2003 ('decay')
-0.008
0.008
-1.015
.495
Figure 4: Differences in happiness between treatment and control groups over time (repeated)
Note. The point estimates show the difference (in Cohen’s d) in happiness between the treatment and control group at each time point. The bars represent 95% confidence intervals. The regression line shows the trend of the differences between treatment and control over time.
2.3. Interpreting the results and non-significant effects
Although the effects of deworming were not significant at any point in our analysis, a statistically non-significant effect does not prove that the effect is zero; instead, it suggests that the effect is not estimated precisely enough to distinguish it from zero (for more detail see Goodman, 2008; Greenland et al., 2016). However, we have converging reasons to believe that in the present KLPS data there is no meaningful effect of deworming on long-term SWB.
The happiness effects are small, non-significant, and distributed around zero (e.g., the effect in KLPS 1 is positive but negative at KLPS 2 and KLPS 3). Similarly, the alternative SWB measures from the KLPS are also distributed around zero (with negative and positive effects at every follow-up; see Appendix A3.1). This pattern of results is consistent with a very small or non-existent effect.
A statistically non-significant effect does not prove the null hypothesis (i.e., that the effect is zero), but we can use Bayes factors to convey the probability that the effects of deworming are zero (Wagenmakers et al., 2010). Bayes factors compare the probability of hypotheses within the prior belief versus within the posterior belief (the new belief once the data is included with the prior belief). Using Bayes factors, we calculate that, if you come to this data with a weak (very uncertain) prior view of the effectiveness of deworming, then you will believe that the odds of the initial effect being zero (rather than not zero) are much more likely (4 to 15 times) after incorporating this evidence. We expand on this technical topic in Appendix A4.
Comparing Group 1 to Group 2 (instead of Groups 1 and 2 to Group 3) finds a non-significant, negative initial effect which becomes (non-significantly) positive over time. We don’t have good reasons to believe this pattern of effects and it seems problematic for deworming that Group 1 which receives 6 years of deworming would fare worse than Group 2 which receives 5 years of deworming. This reinforces our belief that there is no effect on happiness from deworming in this data. See Appendix A3.2 for more details.
We can see if these effects are meaningful by running a cost-effectiveness analysis to see if the per dollar effect is large enough to be cost-effective relative to other interventions we’ve reviewed. But as we show in the next section, without making some very strong assumptions, the total effect and cost-effectiveness of deworming also look null.
We also find null results using other statistical approaches. In our primary analysis, we use a meta-regression, which calculates the effects independently at each time point using summary statistics (see Section 2). In a robustness test, we also analysed the individual-level data using a linear mixed effects model, which can produce more precise estimates when participants complete surveys multiple times or have missing data. Using this method, we also find small, non-significant results. The results also predict that the effects will reach zero and turn negative by around 5-6 years. We prefer the meta-regression model because it is consistent with our prior cost-effectiveness analyses for other interventions, the estimated effects are easier to convert to WELLBYs, and the results are more interpretable. See Appendix A3.3 for more details.
While we find this null effect somewhat surprising if we take the income results of the KLPS seriously[18], it is less surprising if we consider how mixed the general literature is. If deworming did have an effect, it would be unclear what causal story explains the results. For example, if deworming really did make people richer, then you’d expect them to be happier too. The literature (see Section 1.3) yields many non-significant results for the short- and long-term outcomes of health, cognition, and education – so it’s unclear by what channel SWB would be improved.
3. Cost-effectiveness analyses
As mentioned in the previous section, we can use cost-effectiveness analyses to determine whether small effects are large on a per dollar basis. In this section, we explore how cost-effective deworming is based on our model. We believe our cost-effectiveness methods are relatively uncontroversial and we explain the process in detail in Appendix A1.[19] In this section, we only discuss the controversial part: how we calculate the total effect (i.e., the effect integrated over time) of deworming treatment. After that, we present the resulting cost-effectiveness. We also consider more speculative models of the cost-effectiveness.
3.1 A ‘face value’ cost-effectiveness model
We calculate the total effect by integrating the estimated initial effect (0.04 SDs) over time, while assuming the effect decays by -0.008 SDs each year. However, this requires us to decide when the effect begins and ends. These decisions are not straightforward, due to the following issues:
When does the effect start? The average follow-up time of the responses from the first KLPS survey is mid-2004. However, deworming treatment for all groups ended - and data collection started - during 2003. It is unclear which precise point to use for the start of the effect.
Recipients received deworming treatment for up to six years before the intervention. It is plausible they experienced a benefit during that time. However, there is no data for the wellbeing effect during that time. Do we implicitly assume the short-term benefit is zero, which may seems like an unreasonable assumption, or do we estimate the benefit in a completely speculatory manner?
The effect of deworming also has an unclear duration. Normally, we would assume that an intervention’s benefit will decay until it reaches zero. However, two out of the three follow-ups to the KLPS show deworming has negative effects.[20] It doesn’t seem sensible to ignore most of the data by preventing the integration from turning negative - at least, absent some compelling causal story that we lack.
We do not have strong prior beliefs about the effect of deworming, so we think the best approach is to model the data at ‘face value’ by treating seriously our meta-regression model and the positive and negative effects across the data collection period. In this ‘face value’ model, we define the start of the effect as the time that treatment ended (i.e., 2003) - which is consistent with our analyses of other programs - and we define the end of the effect as the latest individual response in the data (i.e., just before 2015). Thus, the total duration of the effect is 11.75 years. Integrating over a longer time period would involve speculation beyond the data, and integrating over a shorter time period (e.g., stopping when the effect reaches zero) would ignore the negative effects at KLPS 2 and 3. While it seems plausible that we are missing short-term benefits of deworming on happiness that occur before treatment ends, this would involve speculating over periods in which we have no data. In general, we prefer the simplest, least speculative model that fits with the data and we believe the ‘face value’ model matches that idea. However, changing the assumptions of the model can strongly affect the cost-effectiveness results.
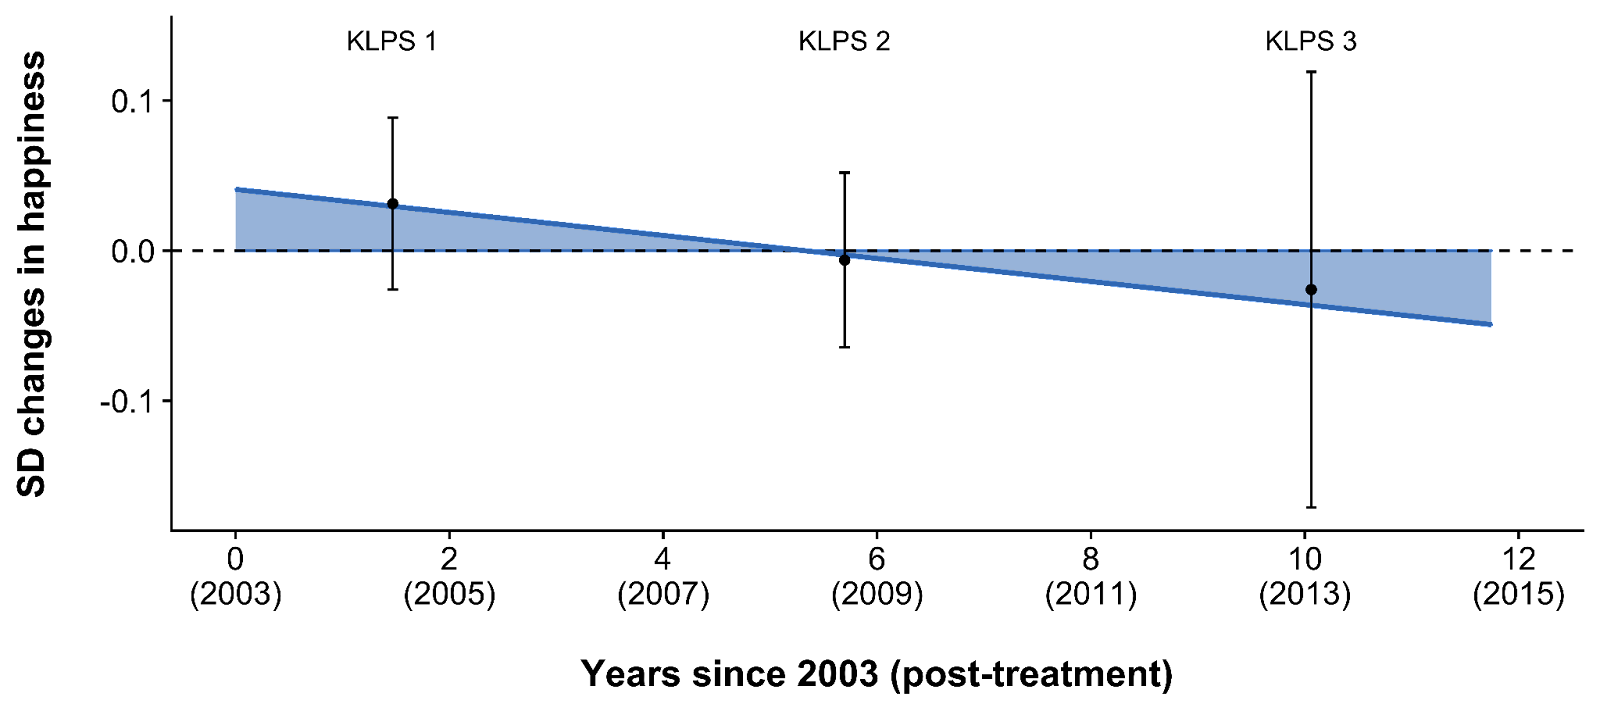
We present the total effect of the ‘face value’ model based on the decisions made above (illustrated below in Figure 5). Notably, the size of the benefit (area above zero) is roughly comparable to the size of the harm (area below zero). This results in a small, negative total effect of -0.05 (95% CI[21]: -1.35, 1.24) SD-years which converts to -0.11 (95% CI: -2.92, 2.69) WELLBYs.[22] This reinforces our belief that there is no effect.
Figure 5: The total effect if we integrate over the data but no further
Note. The point estimates show the difference (in Cohen’s d) in happiness between the treatment and control group at each time point. The bars represent 95% confidence intervals. The blue area is the integrated total effect.
The resulting total effect is overall negative, which results in a negative cost-effectiveness estimate of -18 (95% CI: -613, 436) WELLBYs per $1,000 donated to Deworm the World (one of the four charities). Thus, the expected value shows that deworming is not as cost-effective as StrongMinds (77 WELLBYs per $1,000). This -18 WELLBYs looks like a large negative effect, but this is driven by the small costs of deworming: even small effects, when paired with low costs, can lead to large negative or positive cost-effectiveness estimates. The confidence intervals (built from Monte Carlo simulations; see Appendix A5 for more details), show that the cost-effectiveness of Deworm the World is incredibly uncertain – unsurprisingly because it incorporates imprecise inputs – to the point we consider it practically uninformative. Whatever prior view one held, it doesn’t seem that this evidence should update that view. As mentioned in Section 2.3, this cost-effectiveness analysis converges with our belief that there is no meaningful effect of deworming on long-term wellbeing. We illustrate the uncertainty around the cost-effectiveness of Deworm the World alone in Figure 6, and jointly with the other charities we’ve reviewed (which are all much less uncertain) in Figure 7.
Figure 6: Cost-effectiveness distribution of Deworm the World
Note. The density plot shows the results of Monte Carlo simulations which estimate the uncertainty distributions. The distribution is skewed because the simulation contains cost estimates close to zero, resulting in a few large negative and positive cost-effectiveness figures.
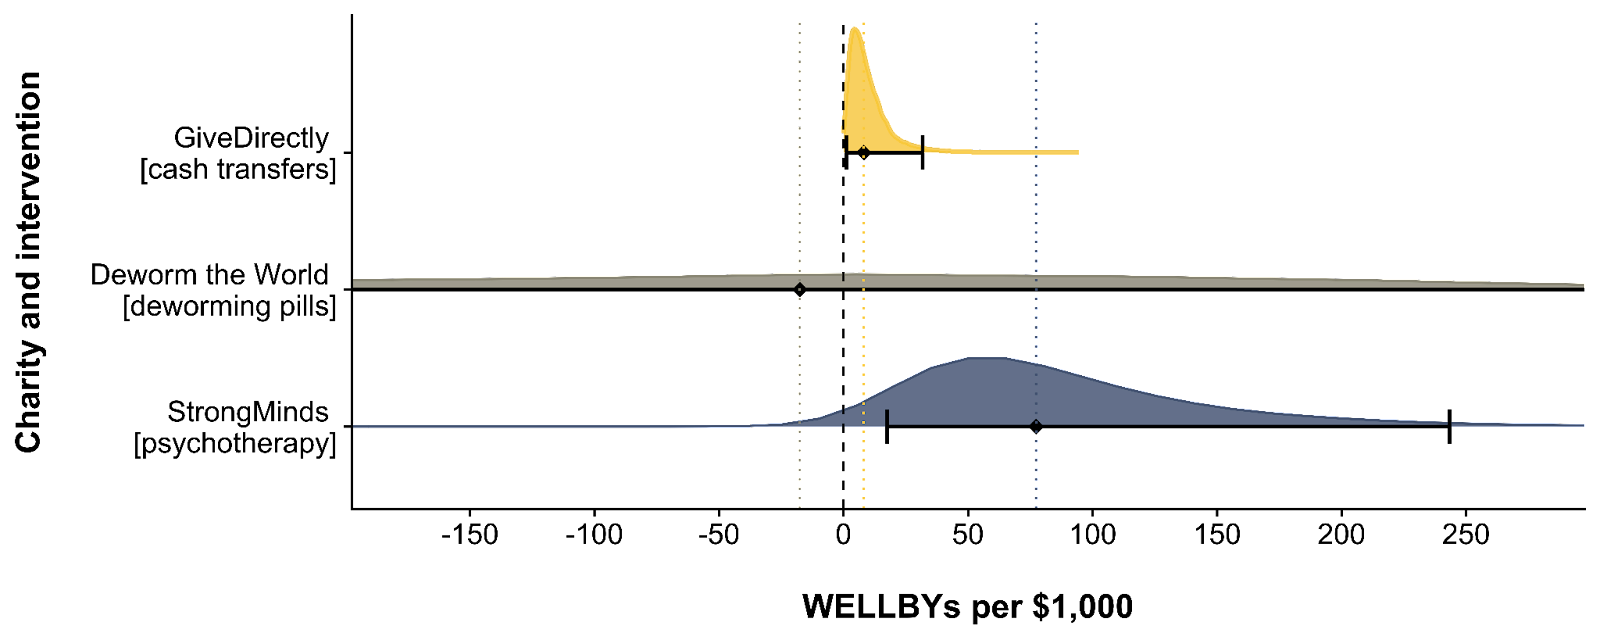
Figure 7: Cost-effectiveness distributions of Deworm the World, GiveDirectly, and StrongMinds
Note. The dashed line represents zero. The dotted lines represent the point estimates of the cost-effectiveness of the different charities. The density plots show the results of Monte Carlo simulations which estimate the uncertainty distributions. The distributions are skewed because the simulation contains cost estimates close to zero, resulting in a few large cost-effectiveness figures. The Deworm the World distribution appears less skewed because a tiny cost can lead to both large positive and negative cost-effectiveness figures, and because its probability density is much more spread out. The distribution of Deworm the World is cropped because it is extremely wide and uncertain.
3.2 Alternative specifications
The negative effect sizes may strike some as implausible, but we don’t think that this is obvious. There are tangible reasons that deworming could cause harm (see GiveWell’s section on the potential negative effects of mass deworming). An in-depth analysis of these reasons is beyond the scope of this report, but the ones mentioned in GiveWell’s report that seem the most important to us are: disrupting routine healthcare, side effects of drugs, and increasing the risk of malaria infections (the process by which this might occur is unclear).
Nevertheless, some readers might have strong beliefs that there are no negative effects and that effects at KLPS 2 and KLPS 3 are just zero. To us, it seems unacceptably ad hoc to take the positive effect at face value but discard the negative evidence entirely. Nevertheless, we present an ‘optimistic’ (but still constrained) model choice for such readers (see Appendix A1), which suggests that Deworm the World produces 39 (95% CI: -149, 188) WELLBYs per $1,000 donated. Hence, StrongMinds is 2 times more cost-effective than the ‘optimistic’ model.
Another concern could be that we are not considering potential short-term benefits between 1998 and 2003. There is no SWB data that we know of for this period, so any modelling choice adding those effects would be extremely speculative. We present a range of possible speculative modelling choices in Appendix A2. Averaging all of these together (we’re unsure if this approach is defensible - we do it for simplicity) we find that the models result in a cost-effectiveness of 31 WELLBYs per $1,000. Hence, StrongMinds is still 2.5 times more cost-effective.
4. Our recommendation for donors
We recommend charities that meet both of the following two conditions:
There is strong evidence for the effectiveness of the intervention.[23]
The charity is more cost-effective than the best charity we've found so far. At the time of writing, our recommended charity is StrongMinds which generates 77 WELLBYs per $1,000 (McGuire et al., 2022b).
According to our analysis of the KLPS data, deworming charities do not satisfy either condition.
As we mentioned in Section 2.3, there are several reasons why we interpret the KLPS results as indicating that deworming has no effect. The pattern of the results (tiny positive and negative effects) and alternative analyses (Bayes Factors, comparing Groups 1 and 2, and an individual-level analysis) provide converging evidence that there is no meaningful effect of deworming on happiness in the KLPS.
Despite the uncertainty of the effect, we examined how cost-effective deworming would be if we took our model and the data seriously (see Section 3). This also suggests that there is no effect of deworming on happiness in the KLPS. Our other methods for calculating the cost-effectiveness (which are all more speculative) also suggest that deworming is less cost-effective than StrongMinds (see Appendix A1 and A2). This increases our confidence in abstaining from recommending deworming.
Even if our cost-effectiveness model had concluded that Deworm the World is as cost-effective as the best charity we’ve found so far - StrongMinds - we would be extremely hesitant to recommend it. Our general prior is that most interventions are less cost-effective than giving people cash (although we haven’t defended this formally). Ideally, our cost-effectiveness analyses rely on large meta-analyses of independent, rigorous studies. In this case, the available data comes from a single study with a number of limitations (see Section 5). Furthermore, the broader literature on deworming (see Section 1.3) is filled with mixed results and fails to provide a consistent causal story to inform our understanding of how deworming might improve wellbeing. Thus, to shift our prior, we would want to see more rigorous evidence documenting the benefits of deworming on subjective wellbeing.
Although we do not recommend deworming at this time, more evidence could change our minds in the future. When the effects of an intervention are so uncertain, and based on a single study, it is relatively easier for new evidence to shift our view.
5. Limitations
Our analysis of the KLPS data has several limitations that make us uncertain about the results, in rough order of importance:
Our analysis is based on data from a single study, the KLPS. We have much greater confidence when effects are replicated in multiple studies, ideally randomised controlled trials with preregistered analysis plans. The lack of additional evidence makes us very uncertain about these results. Furthermore, more research tends to reduce effect sizes (e.g., because of publication bias), so there might be some bias in relying on only one study.
The follow-up data were collected years after deworming treatment was received, and only after both the treatment and control groups had received some treatment. As a result, we do not know if there are short-term effects of deworming on SWB, which means we may be underestimating the effects of deworming (if they exist). However, as we discussed in Section 1, the evidence of other short-term effects on health and education is mixed and widely debated, so it is unclear if short-term effects should be expected.
The KLPS data does not include a high-quality measure of SWB, which could make our results less reliable. The happy123 question is face valid, but measures with fewer than five options are not optimally reliable (Krosnik, 2009). As discussed in Appendix A3.1, we attempted to address this by including all the measures of SWB into a single model and found similar results. However, it would be ideal to have a measure that includes multiple items capturing happiness and life satisfaction, on a 0-10 scale where the endpoints afford clear socially comparable anchors (i.e., “(0) 10 indicates as extremely (dis)satisfied as a human can reasonably be”).
The PDSP does not contain a strict control group (i.e., none of the groups received no deworming), so we do not have a clear estimate of the difference between no deworming and some deworming. It is possible that this comparison could show that deworming has a stronger effect if additional deworming has diminishing returns to wellbeing.
6. Future research to address limitations
We think the best way to address the limitations of the KLPS data is to find or collect more evidence of the impact of deworming on wellbeing. If no wellbeing data can be obtained, an alternative approach could model the effects of deworming on wellbeing via other outcomes (such as income or mortality and fertility effects). A further topic of research is to improve how we adjust for potential bias from relying on a single study. We discuss each of these approaches in more detail below.
6.1 Including more data
We see two ways to incorporate new data into our analysis.
First, we would be most excited to see new experimental studies that include high-quality SWB outcome measures.[24] We recommend using a SWB measure with the same 0-10 scale over multiple follow-ups, and measuring potential spillovers on the household and community. These studies do not need to be long-term. Collecting SWB data from the very beginning of the deworming process or even before the start of treatment could provide more insight into the short-term impacts of deworming and greater power to detect small benefits from treatment.
Second, it is possible that the historical quasi-experimental analyses of the lifetime impact of deworming eradication - those done by Liu and Liu (2019), Bleakley (2007), and Makamu et al. (2018) - could be extended to include SWB as an outcome. These studies combined data from different sources across time, and it might be possible to match their data with panel surveys that contain SWB. We haven’t looked into this yet.
6.2 Including more outcomes (and converting them to WELLBYs)
Since we started writing this report, new research came out indicating that deworming in the PDSP significantly reduced mortality for the children of the recipients of deworming (Walker et al., 2022). We haven't had time to review this work in sufficient detail to incorporate it into this report which only considers the life-improving effect of deworming. Extending life could generate WELLBYs but mortality effects are complex to model. At the technical level, we would have to model how fertility and mortality rates interact. Additionally, the value of life extension depends on difficult philosophical questions – a topic we discuss in depth in Plant et al. (2022). With this comes an additional layer of philosophical questions about saving the lives of people who do not yet exist (i.e., the next generation).
In the absence of more wellbeing data, one could indirectly estimate the life-improving effects of deworming on wellbeing through intermediate pathways such as by looking at how deworming affects education and then estimating how that change would affect wellbeing. We illustrated these potential pathways in Figure 3 in Section 1.3.4. However, we have not pursued this approach because the effects on these pathways are uncertain (each pathway is heavily debated, as we presented in Section 1.3) and conducting this type of research is time-consuming.[25]
6.3 Correcting for bias from limited data
The analysis of deworming raises two general issues with estimating the cost-effectiveness of very cheap interventions with small and highly uncertain effects.
The first issue is that it is very expensive to research interventions with small effects because they require much more data to distinguish their effects from zero.
The second issue is that it’s better to rely on multiple studies than a single study because more studies make the estimates more precise, but also because replication studies tend to find much smaller effect sizes (e.g., Klein et al., 2018).[26] Given the latter consideration, it is plausible to imagine discounting our cost-effectiveness figures for deworming - because they come from only one study - to address some of this tension.[27] We have not yet formed a principled approach to applying replicability adjustments. In this case, we have already concluded that the data are too uncertain to recommend deworming, so any additional adjustments would only reinforce our conclusion. However, we think that more research on this topic is important.
7. Conclusion
As far as we know, this is the first analysis of the effects of deworming on subjective wellbeing. Using long-term follow-up data from the KLPS, we found that deworming had small, non-significant effects on subjective wellbeing, leading us to conclude the effect of deworming is either non-existent or too small to estimate with certainty. We found converging evidence of a null effect across a variety of robustness tests and in a cost-effectiveness analysis. These null results are also consistent with the literature on the effects of deworming on other outcomes, which consists of mixed and uncertain findings. Even with more speculative cost-effectiveness analyses that were generous to deworming, we found that deworming charities were still less cost-effective than StrongMinds (our current top charity recommendation). Taking all this evidence together, we do not recommend deworming charities. The most important next step for proponents of deworming would be to find or collect more data on the effects of deworming on subjective wellbeing.
Note that a large body of research shows that changes to one’s life circumstances are reflected in people’s self-reports (Clark et al., 2018;Dolan et al., 2008; Kahneman & Krueger, 2006; Kaiser & Oswald, 2022). Hence, to see if something works, we can often just ‘short-cut’ straight to the subjective wellbeing data, rather than looking at other instrumental outcomes (e.g., economic benefits).
They also did not find an effect of deworming on anaemia for women in their meta-analysis. In slight contrast, Salam et al.’s (2019) individual participant level meta-analysis found that deworming significantly reduces anaemia in pregnant women, but does not affect birthweight or likelihood of preterm birth for their children.
For simplicity, we do not delve into the details of this debate, which centre around nuanced methodological details that are not relevant for this report. The key point is that the effects of deworming are debated among experts.
We touch on some of the difficulties with extrapolating from historical quasi-experiments to modern intervention contexts in a recent essay (McGuire et al., 2022d).
On average, children would receive 2.25 deworming pills in a year of treatment for both soil- and water-transmitted worms (depending on local prevalence). This is not accounting for the fact that uptake was not exactly 100% for treatment and 0% for control in a year where they are not supposed to receive treatment. Indeed, there was about 75% uptake of some medication (at least one) for the treatment in a given year and 5% for the control (Baird et al., 2016; Miguel & Kremer, 2004).
Students in the treatment group also received health education, which involved “regular public health lectures, wall charts and training of teachers” (p. 169, Miguel & Kremer 2004). It emphasised hand washing, wearing shoes, and avoiding swimming in freshwater. An obvious concern is that any effects we see could be partially or completely driven by the health education, not the deworming medication. Miguel and Kremer (2004; Table 5) argue, in our view convincingly, that this was not the case because there was zero difference in observed and self-reported health behaviours between conditions.
The analysis by Miguel and Kremer (2004) has been the object of multiple replications and debates - including a correction to the anaemia result which was first reported as significant (Humphreys, 2015; Miguel et al., 2015). Replication works include, amongst others: Aiken et al. (2015), Davey et al. (2015), and Humphreys (2015). See the authors reply (Miguel et al., 2015) and GiveWell’s (2015) summary for more details. We use the KLPS, which is not the data Miguel and Kremer analyse, so this does not affect our analysis.
Baird et al. (2016) was excluded from the Cochrane (2019) review because it was deemed “at risk of substantial methodological bias” (p. 14). Hamory et al. (2021) came out after the Cochrane review.
Other measures available include a 1-10 happiness measure for a sub-sample of KLPS 2, 1-6 frequency measures of different affective states for KLPS 3, and a range of binary measures of affective states.
Fewer than 7,527 participants respond at each round because of attrition. In KLPS 3, the researchers only administered happy123 to a subset of participants. We do not think this is problematic because (1) the user guide for the data mentions that the subset (1,312 individuals) was designed to be representative of the rest of the sample, and (2) whilst this makes for a smaller sample at KLPS 3, we use a meta-analysis which will weight data from KLPS 3 less because of this loss in precision.
A meta-analysis standardises and averages multiple effect sizes (across studies usually, but also across measures and follow-ups). Meta-regressions are a special form of meta-analysis and regression that explain how the effect sizes vary according to characteristics related to the effect sizes. Meta-regressions differ in a few technical ways from regressions that do not affect its interpretation. Typically, we use a meta-regression to summarise and explain effect sizes across multiple studies and time points (e.g., McGuire et al., 2022a). In our case, we use a meta-regression on the KLPS data - a single study with three effect sizes over time - where we explain the effect on happiness across multiple time points since treatment ended. See Harrer et al. (2021), for more detail on meta-regressions.
When we convert GiveWell’s estimate of the economic benefits of deworming into WELLBYs, we find that deworming produces 28 WELLBYs per $1,000 donated. This is sizable but still 3 times less cost-effective than StrongMinds. See Appendix A3.4 for more details.
The steps include: getting the total effect; annualising the effects; extrapolating the effect from the PSDP context to the context of the charities by adjusting for worm burden, costs, and household size; adding speculative household spillovers; and getting the cost-effectiveness ratio.
We did not have to address this issue in our previous analyses of psychotherapy and cash transfers because the initial effects and decay rates were statistically significant, and it was clear that there were no negative effects. This made estimating the total effect straightforward: the total effect was essentially the area of a triangle with its height at the initial effect and its base at the estimated duration that the intervention’s benefits lasted (i.e., until the effect reached zero). It seemed implausible that the benefits of psychotherapy and cash transfers decayed over time into harm, given that there were very few negative effect sizes (none of which were statistically significant) and many statistically significant positive effects.
We obtain 95% confidence intervals by running 10,000 Monte Carlo simulations. For our simulations we use normal distributions with the parameter estimate as the mean and the standard error as the standard deviation. Monte Carlo simulations allow us to propagate uncertainty from the effects to the cost-effectiveness ratio. For more details on this method, see Appendix A5.
An effect in SD-years is the number of standard deviation changes across the years (e.g., 1 SD-year can be a change of 1 SD over a year or two SDs over two years). Having effects in SDs is useful because the findings from different measures are all in the same units. This is the standard method for meta-regression. However, these findings are difficult to interpret. We convert our results to WELLBYs by treating WELLBYs as point changes on a 0-10 life satisfaction scale. If we know the typical standard deviation on such a scale, then we can make the conversion. We use a conversion rate of 2.17, which is an average of the typical standard deviations found in the literature. So 0.11 SD-years * 2.17 = 0.24 WELLBYs.
We have not yet formalised our criteria for “strong evidence”, but we take into account factors like the extent of the evidence (the number of studies and number of participants), the rigour of the research methods, and the execution of the studies, and the precision of the effect size estimates.
There’s another follow-up to the PDSP study, the KLPS 4, which is expected to become available in the next year. This data will provide more insight into the long-term effects of deworming, but we don’t expect it will add much more clarity to our analysis. The KLPS 4 will have the same limitations as the current data and, if it had a large (statistically significant) effect on SWB, that would be hard to square with the rest of the data from the study.
This would require four analyses to estimate the effect of deworming on health, cognitive abilities, income and education, and then four more to estimate the effect of health, cognitive ability, income and education on wellbeing. Not counting the mediating pathways such as deworming -> cognitive -> income -> wellbeing.
For example, large, multi-lab replications of classical psychological science findings led to lower effect sizes 75% of the time, where, on average, the effect sizes were 1 - (0.15/0.60) = 75% smaller after replication (Klein et al., 2018).
For example, GiveWell discounts their estimates of the economic benefits of deworming by 87%. Our understanding is that GiveWell applies this replicability adjustment to the results so they align with their prior that the effects are much smaller. They determine the size of the adjustment based on a combination of subjective and empirical approaches (see here and here for details). See also SoGive’s exploration of this adjustment.


Your "best guess" is that the effect of a deworming treatment on happiness is a sudden benefit followed by a slow decline relative to no treatment? Do you have any theory of action that explains why this would be the case?
Trying to draw conclusions from such a dramatically underpowered study (with regard to this question) strikes me as absurd.
Hi Charles,
Our takeaway from this data is that there is not evidence of an effect (positive or negative).
We take these data to be our best guess because there are no prior studies of the effect of deworming on SWB, and the evidence of impact on other outcomes is very uncertain. However, all the effects are non-significant. We don’t have a theory of action because we think the overall evidence points to there being no effect (or at least just a very small one).
We ran the cost-effectiveness analysis as an exercise to see how deworming would look if we took the data at face-value. The point estimate was negative, but the confidence interval was so wide that the results were essentially uninformative, which converges with our conclusion that there is not a substantial effect of deworming on long-term wellbeing.
That being said, we can make assumptions that are favorable to deworming, such as assuming the effect cannot be negative. This, of course, involves overriding the data with prior beliefs — prior beliefs that we lack strong reasons to hold. In any case, we explore the results under these favorable assumptions in Appendix A2. In all plausible cases, deworming is still less cost-effective than StrongMinds, so even these exploratory analyses —which, again, we don’t endorse— don’t change our conclusion to not recommend deworming over StrongMinds.
Regarding power
It is unclear what evidence you use to claim the study is underpowered. As Joel mentioned in his comment to MichaelStJules (repasted below), we had 98% power to detect effect sizes of 0.08 SDs, the effect size that would make deworming more cost-effective than StrongMinds .
"we had 98% power to detect effect sizes of 0.08 SDs" How did you calculate this? This seems unlikley on a 3 point categorical scale like ths,
In brief, we used Harrer et al.’s (2021) R library and their function for the power of a meta-analysis. With this, we computed the power we had to detect an initial effect (the intercept) of .08 SDs which was 97.88%. This uses the average sample sizes and the number of effect sizes.
We selected .08 as our smallest effect size of interest based on the results from our ‘optimistic’ model (see the Appendix A1)—which assumes the effect of deworming cannot be negative (not a model we endorse). The initial effect was .04 and the total cost-effectiveness was half that of StrongMinds. So, the effect would need to be twice as large to equal the cost-effectiveness of StrongMinds.