Logarithmic Scales of Pleasure and Pain: Rating, Ranking, and Comparing Peak Experiences Suggest the Existence of Long Tails for Bliss and Suffering — EA Forum
I would like to suggest that Logarithmic Scales of Pleasure and Pain (“Log Scales” from here on out) presents a novel, meaningful, and non-trivial contribution to the field of Effective Altruism. It is novel because even though the terribleness of extreme suffering has been discussed multiple times before, such discussions have not presented a method or conceptual scheme with which to compare extreme suffering relative to less extreme varieties. It is meaningful because it articulates the essence of an intuition of an aspect of life that deeply matters to most people, even if they cannot easily put it into words. And it is non-trivial because the inference that pain (and pleasure) scales are better understood as logarithmic in nature does require one to consider the problem from multiple points of view at once that are rarely, if ever, brought together (e.g. combining deference analysis, descriptions of pain scales by their creators, latent-trait analysis, psychophysics, and so on).
Fundamentally, we could characterize this article as a conceptual reframe that changes how one assesses magnitudes of suffering in the world. To really grasp the significance of this reframe, let’s look back into how Effective Altruism itself was an incredibly powerful conceptual reframe that did something similar. In particular, a core insight that establishes the raison d'etre of Effective Altruism is that the good that you can do in the world with a given set of resources varies enormously depending on how you choose to allocate it: by most criteria that you may choose (whether it’s QALYs or people saved from homelessness), the cost-effectiveness of causes seem to follow much more closely (at least qualitatively) a long-tail rather than a normal distribution (see: Which world problems are the most pressing to solve? by Benjamin Todd). In turn, this strongly suggests that investigating carefully how to invest one’s altruistic efforts is likely to pay off in very large ways: choosing a random charity versus a top 1% charity will lead to benefits whose scale differs by orders of magnitude.
Log Scales suggests that pain and pleasure themselves follow a long-tail distribution. In what way, exactly? Well, to a first approximation, across the entire board! The article (and perhaps more eloquently the subsequent video presentation at the NYC EA Meetup on the same topic) argues that when it comes to the distribution of the intensity of hedonic states, we are likely to find long-tails almost any way we choose to slice or dice the data. This is analogous to, for example, how all of the following quantities follow long-tail distributions: avalanches per country, avalanches per mountain, amount of snow in mountains, number of avalanche-producing mountains per country, size of avalanches, number of avalanches per day, etc. Likewise, in the case of the distribution of pain, the arguments presented suggest we will find that all of the following distributions are long-tails: average pain level per medical condition, number of intensely painful episodes per person per year, intensity of pain per painful episode, total pain per person during one’s life, etc. Thus, that such a small percentage of cluster headache patients accounts for the majority of episodes per year would be expected (see: Cluster Headache Frequency Follows a Long-Tail Distribution), and along with it, the intensity of such episodes themselves would likely follow a long-tail distribution.
This would all be natural, indeed, if we consider neurological phenomena such as pain to be akin to weather phenomena. Log Scales allows us to conceptualize the state of a nervous system and what it gives rise to as akin to how various weather conditions give rise to natural disasters: a number of factors multiply each other resulting in relatively rare, but surprisingly powerful, black swan events. Nervous systems such as those of people suffering from CRPS, fibromyalgia, and cluster headaches are like the Swiss Alps of neurological weather conditions… uniquely suited for ridiculously large avalanches of suffering.
Log Scales are not just of academic interest. In the context of Effective Altruism, they are a powerful generator for identifying new important, neglected, and tractable cause areas to focus on. For instance, DMT for cluster headaches, microdose ibogaine for augmentation of painkillers in sufferers of chronic pain, and chanca piedra for kidney stones (writeup in progres) are all what we believe to be highly promising interventions (of the significant, neglected, and tractable variety) that might arguably reduce suffering in enormous ways and that would not have been highlighted as EA-worthy were it not for Log Scales. (See also: Get-Out-Of-Hell-Free Necklace). On a personal note, I’ve received numerous thank you notes by sufferers of extreme pain for this research. But the work has barely begun: with Log Scales as a lens, we are poised to tackle the world’s reserves of suffering with laser-focus, assured in the knowledge that preventing a small fraction of all painful conditions is all that we need to abolish the bulk of experiential suffering.
But does Log Scales make accurate claims? Does it carve reality at the joints? How do we know?
The core arguments presented were based on (a) the characteristic distribution of neural activity, (b) phenomenological accounts of extreme pleasure and pain, (c) the way in which the creators of pain scales have explicitly described their meaning, and (d) the results of a statistical analysis of a pilot study we conducted where people ranked, rated, and assigned relative proportions to their most extreme experiences. We further framed this in terms of comparing qualitative predictions from what we called the Normal World vs. Lognormal World. In particular, we stated that: “If we lived in the ‘Lognormal World’, we would expect: (1) That people will typically say that their top #1 best/worst experience is not only a bit better/worse than their #2 experience, but a lot better/worse. Like, perhaps, even multiple times better/worse. (2) That there will be a long-tail in the number of appearances of different categories (i.e. that a large amount, such as 80%, of top experiences will belong to the same narrow set of categories, and that there will be many different kinds of experiences capturing the remaining 20%). And (3) that for most pairs of experiences x and y, people who have had both instances of x and y, will usually agree about which one is better/worse. We call such a relationship a ‘deference’. More so, we would expect to see that deference, in general, will be transitive (a > b and b > c implying that a > c).” And then we went ahead and showed that the data was vastly more consistent with Lognormal World than Normal World. I think it holds up.
An additional argument that since has been effective at explaining the paradigm to newcomers has been in terms of exploring the very meaning of Just-Noticeable Differences (JNDs) in the context of the intensity of aspects of one’s experience. Indeed, for (b), the depths of intensity of experience simply make no sense if we were to take a “Just-Noticeable Pinprick” as the unit of measurement and expect a multiple of it to work as the measuring rod between pain levels in the 1-10 pain scale. The upper ends of pain are just so bright, so immensely violent, so as to leave lesser pains as mere rounding errors. But if on each step of a JND of pain intensity we multiply the feeling by a constant, sooner or later (as Zvi might put it) “the rice grains on the chessboard suddenly get fully out of hand” and we enter hellish territory (for a helpful visual aid of this concept: start at 6:06 of our talk at the 2020 EAGxVirtual Unconference on this topic).
From my point of view, we can now justifiably work under the assumption that the qualitative picture painted by Log Scales is roughly correct. It is the more precise quantitative analysis which is a work in progress that ought to be iterated over in the coming years. This will entail broadening the range of people interviewed, developing better techniques to precisely capture and parametrize phenomenology (e.g. see our tool to measure visual tracers), use more appropriate and principled statistical methods (e.g. see the comment about the Bradley-Terry model and extreme value theory), experimental work in psychophysics labs, neuroimaging research of peak experiences, and the search for cost-effective pragmatic solutions to deal with the worst suffering. I believe that future research in this area will show conclusively the qualitative claims, and perhaps there will be strong consilience on the more precise quantitative claims (but in the absence of a true Qualiascope, the quantitative claims will continue to have a non-negligible margin of error).
Ok, you may say, but if I disagree about the importance of preventing pain, and I care more about e.g. human flourishing, why should I care about this? Here I would like to briefly address a key point that people in the EA sphere have raised in light of our work. The core complaint, if we choose to see it that way, is that one must be a valence utilitarian in order to care about this analysis. That only if you think of ethics in terms of classical Benthamite pain-minimization and pleasure-maximization should we be so keen on mapping the true distribution of valence across the globe.
But is that really so?
Three key points stand out: First, that imperfect metrics that are proxies for aspects of what you care about (even when not all that you care about) can nonetheless be important. Second, that if you cared a little about suffering already, then the post-hoc discovery that suffering is actually thatfreakingskewed really ought to be a major update. And third, there really are reasons other than valence maximization as a terminal goal to care about extreme suffering: suffering is antithetical to flourishing since it has long-term sequelae. More so, even if confined to non-utilitarian ethical theories, one can make the case that there is something especially terrible about letting one’s fellow humans (and non-humans) suffer so intensely without doing anything about it. And perhaps especially so if stopping such horrors turn out to be rather easy.
Let’s tackle each in turn.
(1) Perhaps here we should bring a simple analogy: GDP. Admittedly, there are very few conceptions of the good in which it makes sense for GDP to be the metric to maximize. But there are also few conceptions of the good where you should disregard it altogether. You can certainly be skeptical of the degree to which GDP captures all that is meaningful, but in nearly all views of economic flourishing, GDP will likely have a non-zero weight. Especially if we find that, e.g. some interventions we can do to the economy would cause a 99.9% reduction in a country’s GDP, one should probably not ignore that information (even if the value one assigns to GDP is relatively small compared to what other economists and social scientists assign it). Likewise for extreme suffering. There might be only a few conceptions of the good where that is the only thing we ought to work on. But avoiding hellish states is a rather universally desired state for oneself. Why not take it at least somewhat into account?
In truth, this is not something that classical questions in Effective Altruism pre-Log Scales could overcome either. For instance, as far as I am aware, in practice QALYs are used more as a guide than as an absolute; their value within EA comes from the fact that in practice interventions are orders of magnitude different when it comes to their cost-effectiveness when assessed with QALYs. So even though the vast majority of EAs are not QALY absolutists, the differences in QALYs saved between interventions are large enough that as an approximate guide, the metric still generates huge amounts of consilience.
(2) In turn, the post-hoc finding that hellish states are much, much worse than one would intuitively believe really should at least rebalance one’s priorities somewhat. Is there really no amount of suffering that would do so? Unless one has a utility function akin to a ReLu activation function, going far enough down into the depths of hell ought to count for something. And…
(3) Speaking candidly, in order to fully articulate the true significance of this finding will take us to philosophically polemical territory: philosophy of personal identity where person-affecting views will see the situation quite differently than person-moment-affecting views, philosophy of mind where the ontological status of pleasure and pain are questioned, and intricate questions that arise at the interface between the views of virtue ethicists, deontologists, negative and classical utilitarians. Of course a negative utilitarian who believes in Empty Individualism and Eternalism at the same time will likely be especially horrified by this information. But I would suggest that there are good reasons to care no matter how antithetical one’s view is to philosophical hedonism.
In particular, I would argue that deontologists and virtue ethicists should still take note. The cultivation of virtue requires a minimum of wellbeing in order to maintain motivation to live. And perhaps deontologists might find extreme suffering particularly egregious from the point of view of “things so horrible that ought not to be''. Really, the people we interviewed for the cluster headache writeup told us that experiencing such levels of hellish suffering causes profound psychological transformations (e.g. one interviewee told us that experiencing the higher end of pain in a cluster headache feels like a profound “spiritual violation” from which you may never recover - a feeling most certainly aggravated by the seeming indifference of people at large about their plight). Virtue ethicists and deontologists might as well recognize this cause area as work that is unconscionable not to perform, regardless of arguments based on precise mathematical optimization for the prevention of negative valence.
And finally, in all seriousness, as the cognitive intelligentsia of the world begins to see clearly the nature of the distribution of pleasure and pain, we can expect there to be a big social benefit to being the one who destroys hell. Right now there isn’t a huge social reward to be obtained by working on this cause, but I predict this will change. And, pragmatically, it is sensible to present this cause in a motivating rather than depressing light: indeed, let’s give honor, glory, and endless admiration to whoever makes tangible progress in tearing hell down. And to all of the millionaires and billionaires reading this: this could be you! You could be the one who took on the mantle of preventing all future cluster headaches, established the field of anti-tolerance drugs for severe chronic pain, or got rid of kidney stones (and you did it before it was cool!). Let’s get to work!
Hi Andrés. How would you quantitatively compare the intensity of subjetive experiences across species? Do you have any thoughts on Bob Fischer's book about comparing welfare across species? What would be a good proxy for the (expected) welfare range under electromagnetic (EM) field theories of consciousness?
"...the bulk of suffering is concentrated in a small percentage of experiences..."
This seems like your core implication. But it requires an argument about intensity distribution and frequency distribution. There's only arguments about the first one if I haven't missed anything? To illustrate, I have mild discomfort about 8000s/day on average but extreme pain perhaps 0.02s/day, if I get 1h of extreme pain in my life (and many people don't get any at all).
The article does focus on the long-tail of intensity and quality of both pleasure and pain rather than frequency. That said, it discusses the Lognormal World as a general principle, which would also predict that the frequency of pain or pleasure would follow a long-tail in addition to their intensity and quality.
This is backed up by the previous article "Cluster Headache Frequency Follows a Long-Tail Distribution", where we analyzed a survey about Cluster Headache frequency among sufferers, and showed it followed a long-tail (with statistics like "The bottom 80% accounts for 17% of incidents and the bottom 90% accounts for 30% of incidents", and values ranging from 1 Cluster Headache a year all the way to more than 1,000). We should collect data on e.g. kidney stone, migraine, etc. frequency per individual to see if they also follow a long-tail. Given the general pattern, we suspect they probably do.
Thanks. I was actually asking about a different frequency distribution. You're talking about the frequency of extreme pain among people with extreme pain which has no bearing on the quote above. I'm talking about the frequency of extreme pain experiences among all pain experiences (i. e. is extreme pain it lmuch less prevalent). Hence the example about mild discomfort.
The short answer is - extreme pain is vastly more common than is generally believed. Statistics such as 20% of people in the USA experience chronic pain, with 8% experiencing high-impact chronic pain (interferes with most aspects of life). If indeed we live in Lognormal World, we can expect that the median person will probably have relatively low acquaintance with extreme suffering (until old age), but that the people in the top 10% of sufferers will have 10X the amount, and people in the 99% will have 100X the amount. If we take a person-neutral point of view (i.e. Empty or Open Individualism) and care about "moments of experience" it does not really matter who gets to experience it, at least not morally. There are no diminishing returns per person when it comes to the negative value of suffering (once adaptation has been taken into account).
As with other long-tails, it may seem hard to believe that "...the bulk of suffering is concentrated in a small percentage of experiences...". But so it is hard to imagine that there are billionaires out there if all one knows about is the income of one's family and small circle of friends. Millionaires are rare, but not that rare (about 3% of the population), and we have that in the case of income the bulk of capital is concentrated in a small percent of people (e.g. ~20% of the population controlling ~80% of the wealth, and the top 1% controlling ~45% of it).
Likewise, the research presented here would suggest that in the case of suffering there are "suffering billionaires" out there, and that they account for a much larger % of total suffering than we intuitively would imagine.
Related; I think people do directly make choices that hint at this. Examples would include spending large numbers of resources on drugs and sex on the positive side, and (I'd expect) large numbers of resources to avoid torture / short-duration-but-painful situations.
Listening to the Feeling Good podcast, one common thing is that many people in America have deep fears of becoming homeless, and work very hard to avoid that specific outcome. Much of this is irrational, but some quite justified.
To the second half of your comment, I agree that extreme suffering can be very extreme and I think this is an important contribution. Maybe we have a misunderstanding about what 'the bulk' of suffering refers to. To me it means something like 75-99% and to you it means something like 45% as stated above? I should also clarify that by frequency I mean the product of 'how many people have it', 'how often' and 'for how long'.
"the people in the top 10% of sufferers will have 10X the amount, and people in the 99% [I assume you mean top 1%?] will have 100X the amount"
I'm confused, you seem to be suggesting that every level of pain accounts for the _same_ amount of total suffering here.
To elaborate, you seem to be saying that at any level of pain, 10x worse pain is also 10x less frequent. That's a power law with exponent 1. I.e. the levels of pain have an extreme distribution, but the frequencies do too (mild pains are extremely common). I'm not saying you're wrong - just that I've seen also seems consistent with extreme pain being less than 10% of the total. I'm excited to see more data :)
Hi! Thank you for elaborating on what your question is :)
"Bulk" is indeed a very ambiguous term. Would you say 80% is "the bulk"? And 20% is "a small percentage"? If so we would be in agreement. If not, it is more of a wording issue than a matter of substance, I think.
Good catch that the numbers I provided would suggest a power law that just keeps going (e.g. similar to St. Petersburg paradox?). If we use the Cluster Headache dataset, the numbers are:
50% percentile experiences 70 CH/year
80% percentile experiences 365 CH/year
90% percentile experiences 730 CH/year
98% percentile experiences 2190 CH/year
So at least in this case the 90th percentile does get 10X the amount of the 50th percentile. But the 98th and 99th percentile is not as high as 100X, and more like 20 to 50x. So not quite the numbers I used as an example, but also not too far off.
I should also clarify that by frequency I mean the product of 'how many people have it', 'how often' and 'for how long'.
Here is the main idea: In Lognormal World, you would see a lognormal distribution for "amount of suffering per person", "peak suffering per person", "how long suffering above a certain threshold lasts for each person", etc.
To illustrate this point, let's say that each person's hedonic tone per each second of their life is distributed along a lognormal with an exponent that is a Gaussian with mean x and sd of y. We would then also have that x, across different people, is distributed along a Gaussian with a mean of z and sd of t. Now, if you want to get the global distribution of suffering per second across people, you would need to convolve two Gaussians on the logarithmic pain scale (which represent the exponents of the lognormal distributions). Since convolving two Gaussians gives you another Gaussian, we would then have that the global distribution of suffering per second is also a lognormal distribution! So both at the individual, and the global scale the lognormal long-tails will be present. Now, for you to appreciate the "bulk" of the suffering, you would need to look at the individuals who have the largest means for the normal distribution in the exponent (x in this case). Hence why looking at one's own individual % of time in extreme pain does not provide a good idea of how much of it there is in the wild across people (especially if one is close to the median; i.e. a pretty happy person).
Your 4 cluster headache groups contribute about equally to the total number of cluster headaches if you multiply group size by # of CH's. (The top 2% actually contribute a bit less). That's my entire point. I'm not sure if you disagree?
I would disagree for the following reason. For a group to contribute equally it needs to have both its average and its size be such that when you multiply them you get the same value. While it is true that people at the 50% percentile get 1/10 of the people at the 90% (and ~1/50 of the 99%), these do not define groups. What we need to look at instead is the cumulative distribution function:
The bottom 50% accounts for 3.17% of incidents
The bottom 90% accounts for 30% of incidents
The bottom 95% accounts for 43% of incidents
What I am getting at is that for a given percentile, the contribution from the group "this percentile and lower" will be a lot smaller than the value at that percentile multiplied by the fraction of the participants below that level. This is because the distribution is very skewed, so for any given percentile the values below it quickly decrease.
Another way of looking at this is by assuming that each percentile has a corresponding value (in the example "number of CHs per year") proportional to the rarity of that percentile or above. For simplicity, let's say we have a step function where each time we divide the group by half we get twice the value for those right above the cut-off:
0 to 50% have 1/year
50 to 75% have 2/year
75 to 87.5% have 4/year
and so on...
Here each group contributes equally (size * # of CH is the same for each group). Counter-intuitively, this does not imply that extremes account for a small amount. On the contrary, it implies that the average is infinite (cf. St. Petersburg paradox): even though you will have that for any given percentile, the average below it is always finite (e.g. between 0 and 40% it's 1/year), the average (and total contribution) above that percentile is always infinite. In this idealized case, it will always be the case that "the bulk is concentrated on a tiny percentile" (and indeed you can make that percentile as small as you want and still get infinitely more above it than below it).
The empirical distribution is not so skewed that we need to worry about infinity. But we do need to worry about the 57% accounted for by the top 5%.
That fair, I made a mathematical error there. The cluster headache math convinces me that a large chunk of total suffering goes to few people there due to lopsided frequencies. Do you have other examples? I particularly felt that the relative frequency of extreme compared to less extreme pain wasn't well supported.
TL;DR I don't think this post provides an argument that we should interpret pleasure/pain scales as logarithmic. What's more, whether or not this is true is not necessary for post's practical claim - which is roughly that "the best/worst things are much better/worse than most people think".
Thanks for writing this up; sorry not to have got around to it sooner.
I think there are two claims that need be to carefully distinguished.
(A) that the relationship between actual and reported pleasure(/pain) is not linear but instead follows some other relationship, e.g. a logarithmic function where a 1-unit increase in self-reported pleasure represents a ten-fold increase in actual pleasure.
(B) whether the best/worst experiences that some people have are many times more intense than other people (who haven't had those experiences) assume they are.
I point this out because you say
the best way to interpret pleasure and pain scales is by thinking of them as logarithmic compressions of what is truly a long-tail. The most intense pains are orders of magnitude more awful than mild pains (and symmetrically for pleasure). [...]
Since the bulk of suffering is concentrated in a small percentage of experiences, focusing our efforts on preventing cases of intense suffering likely dominates most utilitarian calculations.
The idea, I take it, is that if we thought the relationship between self-reported and actual pleasure(/pain) was linear, but it turns out it was logarithmic, then the best(/worse) experiences are much better(/worse) that we expected they were because we'd be using the wrong scale.
However, I don't think you've provided (any?) evidence that (A) is true (or that it's true but we thought it was false). What's more, (B) is actually quite plausible by itself and you can claim (B) is true without needing (A) to be true.
Let me unpack this a bit.
(A) is a claim about how people choose to use self-reported scales. The idea is that people have experiences of a certain intensity they can distinguish for themselves in cardinal units, e.g. you can tell (roughly) how many perceivable increments of pleasure one experience gives you vs the next. A further question is how people choose to report these intensities when people give them a scale, say a 0-10 scale.
This reporting could be linear, logarithmic, etc. Indeed, people could choose to report anyway they want to. It seems most likely people use a linear reporting function because that's the helpful way to use language to convey how you feel to the person asking you how you feel. I won't get stuck into this here, but I say more about it in my PhD thesis at chapter 4, section 4.
Hence, on your pleasure/pain scales when you contrast 'intuitive' to 'long-tailed' scales, what I think you mean is that the intuitive scale is really 'reported' pleasure and the 'long-tailed' scale is 'actual' pleasure i.e. your claim is that there is a logarithmic relationship between reported and actual pleasure. I note you don't provide evidence that people generally use scales this way. Regarding the stings scale, that just is a logarithmic scale by construction, where going from a 1 to 2 on the scale represent a 10 times increase in actual pain. That doesn't show we have to report pleasure using log scales, or that we do, just that the guy who constructed that scale chose to build it that way. In fact, we can only use log pleasure/pain scales if we can somehow measure pain/pleasure on an arithmetic scale in the first place, and then convert from those numbers to a log scale, which requires that people are able to construct arithmetic pleasure/pain scales anyway.
(You might wonder if people can know, on an arithmetic scale, how much pleasure/pain they feel. However, if people really have no idea about this, then it follows they can't intelligibly report their pleasure/pain at all, whatever scale they are using.)
Regarding (B), note that claims such as "the worst stings are 1000x worse than the average person expects they are" can be true without it needing to be the case that people have misunderstood how other people tend to use pleasure/pain scale. For instance, I could alternatively claim that the relationship between reported pleasure/pain and actual pain is linear, but that people's predictions are just misinformed - e.g. torture is actually more worse than they thought. For comparison, if I claim "the heaviest building in the world weighs 1000x more than most people think it weighs" I don't need to say anything about the relationship between reports of perceived weight and actual weight.
Hence, if you want to claim "experiences X and Y are much better/worse than we thought", just claim that without getting into distracting stuff about reported vs actual scale use!
(P.S. The Fechner-Weber stuff is a red-herring: that's about the relationship between increases in an objective quantity and in subjective perceptions of increases in that quantity. That's different from talking about the relationship between a reported subjective quantity and the actually experienced subjective quantity. Plausibly the former relationship is logarithmic, but one shouldn't directly infer from that that the latter relationship is logarithmic too).
Thank for commenting. First of all I agree that the claims of (A) and (B) do need to be distinguished, and I admit I didn't make that conceptual distinction very clear in the article. I agree that the most important takeaway from the piece is (B), and I also think that this alone is already enough to challenge EA's prioritization methods (i.e. ultra-painful experiences are completely flying under the radar from the point of view of QALYs and similar metrics; reducing the incidence of cluster headaches, migraines, kidney stones, etc. could be an extremely cost-effective EA objective).
With that said, I would claim that (1) the article does actually provide evidence for (A), (2) taking this seriously clarifies a lot of puzzling facts about experience and how it is reported, and (3) understanding that pain and pleasure follows a long-tail (most likely a log-normal distribution) gives us a new principled way to approach cause prioritization.
I understand the fact that the pain scales of stings and cluster headaches are *by construction* logarithmic. But you have to understand that such a scale would only ever be "filled to the top" if experiences actually differed in intensity also by the same amount. The article (and presentation, which I strongly recommend you watch) explain that all of the following are consistent with the pain scales (as reported!) are actually logarithmic:
(a) the characteristic distribution of neural activity is log-normal, and under the modest assumption that intensity of experience is roughly proportional (or at least polynomially proportional) to intensity of experience, that entails the distribution of intensity is also log-normal.
(b) the above can be further understood as a kind of "neuronal weather" (see the "avalanches" metaphor in the video presentation)
(c) the predictions of the log-normal world are held by the data, and in particular:
(c1) there are few categories of experiences that capture most of the extremely good and extremely bad sensations
(c2) there is consistency in the deference judgements of the quality of experience (as seen in the deference graph), and importantly
(c3) The ratio of "1st worst or best experience vs. 2nd worst or best experience" fits a log-normal distribution and it does not fit a normal distribution.
For the above reasons, bringing up the Fechner-Weber is not, I would claim, a red-herring. Rather, I think it ties together the whole argument. Here is why:
I understand that Fechner-Weber's law maps physical intensity to subjective intensity, and that valence is not externally driven a lot of the time. But you may have missed the argument I'm making here. And that is that in one interpretation of the law, a pre-conscious process does a log transform on the intensity of the input and that by the time we are aware of it, what we become aware of are the linear differences in our experience. In the alternate interpretation of the law, which I propose, the senses (within the window of adaptation) translate the intensity of the input into an equivalent intensity of experience. And the reason *why* we can only detect multiplicative differences in the input *is because* we can only notice consciously multiplicative differences in the intensity of experience. Do you see what I am saying? In this account, the fact that people would naturally and spontaneously use a logarithmic scale to report their level of pain is a simple implication of the fact that you can only definitively tell that "the pain got worse" when it got 10% worse and not when it became 1 unit worse (which soon becomes hard to notice when you talk about experiences with e.g. 1000 pain units per second).
In other words, the scales are logarithmic because we can only notice with confidence multiplicative increments in the intensity of experience. And while this is fine and does not seem to have strong implications on the lower end of the scale, it very quickly escalates, to the point where by the time you are in 7/10 pain you live in a world with orders of magnitude more pain units per second than you did when you were in 2/10 pain.
Finally, you really need the logarithmic scales to make room for the ultra-intense levels of pleasure and pain that I highlighted in the "existence of extremes" section. If people reported their pain on a linear scale, they would quickly run into the problem that they cannot describe even something as painful as a broken bone, let along something like a cluster headache.
Based on the definitions given by the Welfare Footprint Project here (search for "definitions") for various types of pain, do you have any guesses for how bad is excruciating pain relative to annoying, hurtful and disabling pain? I guess:
Excruciating pain is 1 k times as bad as disabling pain.
Disabling pain is 100 times as bad as hurtful pain, and therefore excruciating pain is 100 k times as bad as hurtful pain.
Hurtful pain is 10 times as bad as annoying pain, and therefore excruciating pain is 1 M times as bad as annoying pain.
Aside from my concern about extreme pain being rarer than ordinary pain, I also would find the conclusion that
"...the bulk of suffering is concentrated in a small percentage of experiences..."
very surprising. Standard computational neuroscience decision-making views such as RL models would say that if this is true, animals would have to spend most of their everyday effort trying to avoid extreme pain. But that seems wrong. E. g. we seek food to relieve mild hunger and get a nice taste and not because we once had a an extreme hunger experience that we learned from.
You could argue that the learning from extreme pain doesn't track the subjective intensity of pain. But then people would be choosing e. g. a subjectively 10x worse pain over a <10x longer pain. In this cause I'd probably say that the subjective impression is misguided or ethically irrelevant, though that's an ethical judgment.
Hm.. I'm somewhat new to this "RL perspective on animal behavior," but from what I understand about it, I see a few caveats:
Probably not all suffering is related to learning in the same way. Depression certainly comes with a subjective wish for betterment, but often lacks any motivation to seek betterment.
Probably the animal first needs to experience traumatic pain for it to become preoccupied with it? This means that if extreme pain is rare, the claim in the OP could still be compatible with your observation that most animals aren't preoccupied with avoiding it.
You could argue that the learning from extreme pain doesn't track the subjective intensity of pain. But then people would be choosing e. g. a subjectively 10x worse pain over a <10x longer pain. In this cause I'd probably say that the subjective impression is misguided or ethically irrelevant, though that's an ethical judgment.
I share your intuition for very clear-cut choice situations about two painful experiences. But you could imagine cases where a person chooses one thing (i.e., display some revealed preference), but feels like there's an important sense in which they'd rather be the sort of person who chooses the other thing. I'm not sure this example applies to pure pain-vs.-pain comparisons, but it's a reason I'm not on board with normative evaluations that focus solely on decisions taken after having become acquainted with certain experiences. For example, if I'm presented with either staying in bed or leaving bed + being subjected to electro shock + getting rewarded, I'm sure you can make the reward high enough that, after a few forced trials, I'll start voluntarily choosing "leaving the bed" over "staying" every time. In this new situation, I'd now be waking up with intense longings for reward, longings painful enough that I'd prefer electro shocks followed by satisfaction over continuation of those longings. Note that this is an altogether different thought experiment compared to the original situation where I was waking up without longings. As you indicate, it seems like a further question whether, in the newer version (after acquaintance with shock + reward), we want to look at this as choosing the thing we learned is better, or as choosing something other than we would have chosen initially because we developed some type of addiction.
More generally, the observation I'd like to add to this (and similar) discussions is that humans seem to have two very different "modes" for selecting actions. The mode where I'm laying in bed comfortably but alert and agenty enough to decide how to spend my morning is a different, more "system-2-heavy" mode from one where I'm having hard-to-control longings (or aversions). In the more system-2-heavy mode, people may care about things that are very different from maximization of expected experienced reward. This can skew one's revealed preferences about pain (or pleasure) tradeoffs in all kinds of ways, making it complicated (to say the least) to take this RL perspective (which I view as being primarily focused – at least in the sense that it's "purer" there – on the more system-1-like mode) as the basis of normative evaluation.
As you say, such normative evaluation (assuming we are right about the descriptive features that make up the option space) comes down to subjective judgment calls, and I can see why you might have different intuitions from me.
(BTW I also found the claims in the OP surprising; and I'm not sure yet whether I agree with them.)
Adding to what Lucas mentioned (how we are motivated in part by longing/addiction for strong rewards): Suffering and negative reinforcement are correlated but are by no means the same thing. In the case of extreme suffering, there seems to be a point where the pain has already maxed out in terms of negative reinforcement capacity, and anything above it is just senseless suffering. Cluster headaches would not cause any less behavioral suppression if they were 10 or even 100 times less painful. Likewise, our ability to reason about pain and pleasure is limited by our state-dependent ability to imagine it. As I argued in the article, our ability to imagine any pain or pleasure that goes beyond our ability to extrapolate with the qualia accessible to us at the moment is very limited.
The bliss of 5-MeO-DMT or epileptic temporal lobe seizures is as Dostoevsky said "a happiness unthinkable in the normal state and unimaginable for anyone who hasn’t experienced it". Likewise for extreme pain. So you wouldn't be able to infer that these states exist (and are much more prevalent than one intuitively believes) merely from observing the patterns of reinforcement from a third-person point of view.
2019-09-04 Update: Since posting this I've learned about the Bradley-Terry model for obtaining latent traits based on sets of rankings (https://en.wikipedia.org/wiki/Bradley%E2%80%93Terry_model) and also that there are libraries to do this (e.g. https://pypi.org/project/choix/).
Additionally, I've learned about "extreme value theory", which describes the statistical distribution of extreme values (e.g. https://en.wikipedia.org/wiki/Generalized_extreme_value_distribution) and seen some applications to other long-tail events (see: https://blog.givewell.org/2015/07/13/geomagnetic-storms-using-extreme-value-theory-to-gauge-the-risk/).
I will use those two new key statistical approaches to analyze this pilot dataset and also future iterations of this study (focused more on people who've experienced extremes of valence like cluster headaches or 5-MeO-DMT states). I am currently busy working on a number of other projects critical for the Qualia Research Institute, so doing this is currently on the back-burner (though of course I'm happy to hear if anyone is interested in taking on this challenge as a volunteer project).
You mention the Jhanas and metta meditation as both being immensely pleasurable experiences. Since these come from meditation, they seem like they might be possible for people to do "at home" at very little risk (save for the opportunity costs from the time investment). Do you have any thoughts on encouraging meditation aimed towards achieving these highly pleasurable states specifically as a cause area and/or something we should be doing personally?
According to "Right Concentration: A Practical Guide to the Jhanas" by L. Brasington and "The Mind Illuminated" by Culadasa, it is feasible to achieve Jhana states within two years of dedicated practice. This entails a few hours of meditation a day and attending at least one 9-day retreat over the course of this time period. The books explain in detail how to get there in a very practical and no-nonsense way.
I personally have yet to invest that time into this task, but I know that one of the other core members of the Qualia Research Institute, Romeo Stevens, is now able to achieve Jhanas thanks to his meditation practice. I do intend to do this in the near future.
Also, we are looking into doing EEG and fMRI studies on people who can enter those states as a means to test the CDNS approach to valence quantification, which is a core part of our research plan.
It's particularly noteworthy how closely related two of the key events are: the wonders of Birth of Children vs the pain of Childbirth. I wonder if this suggests that targeting childbirth would be particularly effective, as it might 'unlock' a bit more of one of the key pleasures in a way that they other key pains do not. It seems like there might be some low hanging fruit here - in particular there are a lot of medications which have not been tested for use in pregnant women, where a clinical trial might increase women's options. I could see there being cases where it is doesn't make sense for pharma companies to do the trials (because the number of additional patients is small) but would be for us (because these patients matter a lot more, even though they would only pay the same amount for the drug).
Unrelatedly, another reason to expect Death of Father to be over-represented vs Death of Mother is that on average older men marry younger women.
Do you think your claims would apply to broader measures of subjective wellbeing, e.g. questions like "Overall, how satisfied are you with your life?" and "Overall, how happy were you yesterday?" (often on a 0-10 scale)? Or even to more specific measures of valenced experience, like depression (e.g. PHQ-9)?
Because I've been wondering whether:
(a) the Weber-Fechner law is limited to perception of clear physical stimuli (weight, pain, spicyness, etc), as distinct from 'internal' states and cognitive evaluations (though the internal/external distinction may not make sense here).
(b) a log scale is less useful/accurate when considering long periods of time (a day, a year, a lifetime), over which the variance in average wellbeing in a population will be lower than the variance in the intensity of specific events.
A worry I have about your model is the conflation of 'pain' and 'negative value of experience'.
On a superficial level: pain asymbolia exists, masochism exists, many people actively enjoy spicy food (and keep very-hot sauce around to put on their own food on a regular basis out of enjoyment, not just as a novelty), et cetera. There are people who don't experience pain as negatively-valenced, or do so only in limited circumstances, and running those people's pain together with more direct emotional-state-related concerns such as grieving or depression is going to lead to confused results.
But let's grant that pain asymbolia and masochism and so forth are unusual and probably not direct factors in most people's feelings about most pain. Still, their existence points at an important deeper truth: there are cognitive indirection-layers between sensory experiences and the values placed thereupon. And thus there's room for the logarithm to be re-flattened to some extent—albeit not necessarily all the way—through those indirection-layers. It's possible for someone to be in ten times as much pain-as-sensory-experience without experiencing ten times as much unpleasantness from it, even if they're still experiencing more unpleasantness from it. And my default intuition is to expect that abstract structure to be far more widespread than its particularly-extreme instantiations might be.
(For one thing, the entire concept of the hedonic treadmill rests on that sort of indirection-layer existing—change in valenced response to a stimulus with repetition even as the stimulus holds constant—and as far as I know the hedonic treadmill is somewhere close-ish to a human universal. So it seems very unlikely that there's any large fraction of the population for which such an indirection-layer doesn't exist.)
Similar-but-milder concerns apply to conflation of 'pleasure' and 'positive value of experience'; I suspect those might cause sexual experiences to be overweighted in your sample, because a common use of 'pleasure' is to refer, not to positively-valenced experience in the abstract, but rather to specific sorts of sensory experience commonly associated with sex, and then the same "there's an indirection between the sensory experience and its emotional impact in which the logarithmic curve can be re-flattened to some extent" issue is likely to apply to those cases.
Very good points. QRI has a lot to say about all of these points, so I won't repeat myself too much. I'll address a couple points, but note there is a lot more to say that you can dig into in the provided links:
I think that pain is a particular manifestation of negative valence. It can trigger positive valence indirectly via e.g. energizing the system and then triggering neural annealing - nice waves of euphoria that are secondary and after the fact which are the reinforcing bits. Pain sans this secondary element is just unpleasant and bad, albeit perhaps not as bad as what you get when you mix both emotional and low level sensory negative valence together.
Importantly: mixed valence certainly complicates the picture, but above a certain intensity of sensation pain overwhelms whetever else is going on.
Shinzen Young's concept of equanimity as not resisting sensations is a critical modifier on the valence of experience. That said, I'd say this modifies valence of the whole experience, and doesn't necessarily take care of the low-level sensory negative valence. Stil, the bulk of a person's valence under normal circumstances might be the result of how much they resist their current experience (even if pleasant otherwise). Extreme levels of equanimity, I'm convinced, can drastically lower the negative valence effects of pain.
This, however, has a limit. Even highly attained meditators (the "Buddha" included) would describe extreme pain as still a cause of suffering. Daniel Ingram, for example, can tolerate broken bones and all kinds of very intense painful sensations without them turning into suffering, so to speak. But when he has a kidney stone then that overwhelms the system and even his meditation attainments aren't enough to counter-balance it. He still suffers intensely with kidney stones when they happen.
Lastly, most intense forms of pain tend to have a strong emotional component by default. Cluster headaches, for example, typically come with a powerful sense of doom along with the pain. It's just part of the package it seems.
Do you have any thoughts on whether valenced experience is asymmetrical, i.e. whether the most negative experiences (e.g. 10/10 on some suitable pain scale) are more bad than the most positive ones (e.g. 10/10 on some suitable pleasure scale) are good?
My hunch is that the worst experiences are more intense, at least if you exclude weird/rare things like Jhanas and 5-MeO-DMT trips, e.g. I'd give up days or weeks of 'maximum happiness' to avoid being burned alive for a minute. But not everyone shares this intuition, and I'm not sure how to settle the debate (at least until you prove and operationalise your symmetry theory of valence).
Logarithmic Scales of Pleasure and Pain: Rating, Ranking, and Comparing Peak Experiences Suggest the Existence of Long Tails for Bliss and Suffering
This is a crosspost from the new Animal Welfare Alignment Newsletter by Anima International. You can subscribe on Substack if you are interested in following these efforts. Audio reading also available on Substack.
The goals of this post are to:
1. Raise a question I see as crucially important to the goal of aligning AI to animal welfare...
“How long have you been v*g*n?”
This is one of the most common icebreakers at animal protection events. It’s a baseline assumption, and it mostly holds true: if you’re out advocating for animals not to be tortured or abused, realistically these days you are v**n, or close. And it makes for good conversation. It seems fairly safe to assume when you meet strangers.
But this assumption is hurting the movement in a way which we don’t always notice: someone new comes into the sp...
AI Use Note: Main body text entirely human written. Claude (Opus 4.8) helped develop models of animal life histories in the appendix.
Cross-posted from Good Structures.
Executive Summary
* Animal advocates sometimes make claims like “there are X of this animal...
Based on: the characteristic distribution of neural activity, personal accounts of intense pleasure and pain, the way various pain scales have been described by their creators, and the results of a pilot study we conducted which ranks, rates, and compares the hedonic quality of extreme experiences, we suggest that the best way to interpret pleasure and pain scales is by thinking of them as logarithmic compressions of what is truly a long-tail. The most intense pains are orders of magnitude more awful than mild pains (and symmetrically for pleasure).
This should inform the way we prioritize altruistic interventions and plan for a better future. Since the bulk of suffering is concentrated in a small percentage of experiences, focusing our efforts on preventing cases of intense suffering likely dominates most utilitarian calculations.
An important pragmatic takeaway from this article is that if one is trying to select an effective career path, as a heuristic it would be good to take into account how one’s efforts would cash out in the prevention of extreme suffering (see: Hell-Index), rather than just QALYs and wellness indices that ignore the long-tail. Of particular note as promising Effective Altruist careers, we would highlight working directly to develop remedies for specific, extremely painful experiences. Finding scalable treatments for migraines, kidney stones, childbirth, cluster headaches, CRPS, and fibromyalgia may be extremely high-impact (cf. Treating Cluster Headaches and Migraines Using N,N-DMT and Other Tryptamines, Using Ibogaine to Create Friendlier Opioids, and Frequency Specific Microcurrent for Kidney-Stone Pain). More research efforts into identifying and quantifying intense suffering currently unaddressed would also be extremely helpful. Finally, if the positive valence scale also has a long-tail, focusing one’s career in developing bliss technologies may pay-off in surprisingly good ways (whereby you may stumble on methods to generate high-valence healing experiences which are orders of magnitude better than you thought were possible).
Introduction
Weber’s Law
Weber’s Law describes the relationship between the physical intensity of a stimulus and the reported subjective intensity of perceiving it. For example, it describes the relationship between how loud a sound is and how loud it is perceived as. In the general case, Weber’s Law indicates that one needs to vary the stimulus intensity by a multiplicative fraction (called “Weber’s fraction”) in order to detect a just noticeable difference. For example, if you cannot detect the differences between objects weighing 100 grams to 105 grams, then you will also not be able to detect the differences between objects weighing 200 grams to 210 grams (implying the Weber fraction for weight perception is at least 5%). In the general case, the senses detect differences logarithmically.
There are two compelling stories for interpreting this law:
In the first story, it is the low-level processing of the senses which do the logarithmic mapping. The senses “compress” the intensity of the stimulation and send a “linearized” packet of information to one’s brain, which is then rendered linearly in one’s experience.
In the second story, the senses, within the window of adaptation, do a fine job of translating (somewhat) faithfully the actual intensity of the stimulus, which then gets rendered in our experience. Our inability to detect small absolute differences between intense stimuli is not because we are not rendering such differences, but because Weber’s law applies to the very intensity of experience. In other words, the properties of one’s experience could follow a long-tail distribution, but our ability to accurately point out differences between the properties of experiences is proportional to their intensity.
We claim that, at least for the case of valence (i.e the pleasure-pain axis), the second story is much closer to the truth than the first. Accordingly, this article rethinks the pleasure-pain axis (also called the valence scale) by providing evidence, arguments, and datapoints to support the idea that how good or bad experiences feel follows a long-tail distribution.
The concrete line of argument we will present is based on the following:
Phenomenological accounts of intense pleasure and pain (w/ accounts of phenomenal time and space expansion),
The way in which pain scales are described by those who developed them, and
The analytic results of a pilot study we conducted which investigates how people rank, rate, and assign relative proportions to their top 3 best and worst experiences
Why This Matters
Even if you are not a strict valence utilitarian, having the insight that the valence scale is long-tailed is still very important. Most ethical systems do give some weight to the prevention of suffering (in addition to the creation of subjectively valuable experiences), even if that is not all they care about. If your ethical system weighted slightly the task of preventing suffering when believing in a linear valence scale, then learning about the long-tailed nature of valence should in principle cause a major update. If indeed the worst experiences are exponentially more negative than originally believed by one’s ethical system, which nonetheless still cared about them, then after learning about the true valence scale the system would have to reprioritize. We suggest that while it might be unrealistic to have every ethical system refocus all of its energies on the prevention of intense suffering (and subsequently on researching how to create intense bliss sustainably), we can nonetheless expect such systems to raise this goal on their list of priorities. In other words, while “ending all suffering” will likely never be a part of most people’s ethical system, we hope that the data and arguments here presented at least persuade them to add “…and prevent intense forms of suffering” to the set of desiderata.
Indeed, lack of awareness about the long-tails of bliss and suffering may be the cause of an ongoing massive moral catastrophe (notes by Linch). If indeed the degree of suffering present in experiences follows a long-tail distribution, we would expect the worst experiences to dominate most utilitarian calculus. The biggest bang for the buck in altruistic interventions would therefore be those that are capable of directly addressing intense suffering and generating super-bliss.
General Ideas
The Non-Linearity of Pleasure and Pain
Caption: True long-tail pleasure scale (warning: psychedelics increase valence variance – the values here are for “good/lucky” trips and there is no guarantee e.g. LSD will feel good on a given occasion). Also: Mania is not always pleasant, but when it is, it can be super blissful.
Caption: True long-tail pain scale
As we’ve briefly discussed in previous articles (1, 2, 3), there are many reasons to believe that both pleasure and pain can be felt along a spectrum with values that range over possibly orders of magnitude. Understandably, someone who is currently in a state of consciousness around the human median of valence is likely to be skeptical of a claim like “the bliss you can achieve in meditation is literally 100 times better than eating your favorite food or having sex.” Intuitively, we only have so much space in our experience to fit bliss, and when one is in a “normal” or typical state of mind for a human, one is forced to imagine “ultra blissful states” by extrapolating the elements of one’s current experience, which certainly do not seem capable of being much better than, say, 50% of the current level of pleasure (or pain). The problem here is that the very building blocks of experiences that enable them to be ultra-high or ultra-low valence are themselves necessary to imagine accurately how they can be put together. Talking about extreme bliss to someone who is anhedonic is akin to talking about the rich range of possible color experiences to someone who is congenitally fully colorblind (cf. “What Mary Didn’t Know“).
“Ok”, you may say, “you are just telling me that pleasure and pain can be orders of magnitude stronger than I can even conceive of. What do you base this on?”. The most straightforward way to be convinced of this is to literally experience such states. Alas, this would be deeply unethical when it comes to the negative side, and it requires special materials and patience for the positive side. Instead, I will provide evidence from a variety of methods and conditions.
Personal Accounts
I’ve been lucky to not have experienced major pain in my life so far (the worst being, perhaps, depression during my teens). I have, however, had two key experiences that gave me some time to introspect on the non-linear nature of pain. The first one comes from when I accidentally cut a super-spicy pepper and touched it with my bare hands (the batch of peppers I was cutting were mild, but a super-hot one snuck into the produce box). After a few minutes of cutting the peppers, I noticed that a burning heat began to intensify in my hands. This was the start of experiencing “hot pepper hands” for a full 8 hours (see other people’s experiences: 1, 2, 3). The first two to three hours of this ordeal were the worst, where I experienced what I rated as a persistent 4/10 pain interspersed with brief moments of 5/10 pain. The curious thing was that the 5/10 pain moments were clearly discernible as qualitatively different. It was as if the very numerous pinpricks and burning sensations all over my hands were in a somewhat disorganized state most of the time, but whenever they managed to build-up for long enough, they would start clicking with each other (presumably via phase-locking), giving rise to resonant waves of pain that felt both more energetic, and more aversive on the whole. In a way, this jump from what I rated as 4/10 to 5/10 was qualitative as well as quantitative, and it gave me some idea of how something that is already bad can become even worse.
My second experience involves a mild joint injury I experienced while playing Bubble Soccer (a very fun sport no doubt, and a common corporate treat for Silicon Valley cognotariats, but according to my doctor it is also a frequent source of injuries among programmers). Before doing physical therapy to treat this problem (which mostly took care of it), I remember spending hours introspecting on the quality of the pain in order to understand it better. It wasn’t particularly bad, but it was constant (I rated it as 2/10 most of the time). What stuck with me was how its constant presence would slowly increase the stress of my entire experience over time. I compared the experience to having an uncomfortable knot stuck in your body. If I had a lot of mental and emotional slack early in the day, I could easily take the stress produced by the knot and “send it elsewhere” in my body. But since the source of the stress was constant, eventually I would run out of space, and the knot would start making secondary knots around itself, and it was in those moments where I would rate the pain at a 3/10. This would only go away if I rested and somehow “reset” the amount of cognitive and emotional slack I had available.
The point of these two stories is to highlight the observation that there seem to be phase-changes between levels of discomfort. An analogy I often make is with the phenomenon of secondary coils when you twist a rope. The stress induced by pain- at least introspectively speaking- is pushed to less stressed areas of your mind. But this has a limit, which is until your whole world-simulation is stressed to the point that the source of stress starts creating secondary “stress coils” on top of the already stressed background experience. This was a very interesting realization to me, which put in a different light weird expressions that chronic pain patients use like “my pain now has a pain of its own” or “I can’t let the pain build up”.
Caption: DNA coils and super-coils as a metaphor for pain phase-changes?
Consciousness Expansion
What about more extreme experiences? Here we should briefly mention psychedelic drugs, as they seem to be able to increase the energy of one’s consciousness (and in some sense “multiply the amount of consciousness“) in a way that grows non-linearly as a function of the dose. An LSD experience with 100 micrograms may be “only” 50% more intense than normal everyday life, but an LSD experience with 200 micrograms is felt as 2-3X as intense, while 300 micrograms may increase the intensity of experience by perhaps 10X (relative to normal). Usually people say that high-dose psychedelic states are indescribably more real and vivid than normal everyday life. And then there are compounds like 5-MeO-DMT, which people often describe as being in “a completely different category”, as it gives rise to what many describe as “infinite consciousness”. Obviously there is no such thing as an experience with infinite consciousness, and that judgement could be explained in terms of the lack of “internal boundaries” of the state, which gives the impression of infinity (not unlike how the surface of a torus can seem infinite from the point of view of a flatlander). That said, I’ve asked rational and intelligent people who have tried 5-MeO-DMT in non-spiritual settings what they think the intensity of their experiences was, and they usually say that a strong dose of 10mg or more gives rise to an intensity and “quantity” of consciousness that is at least 100X as high as normal everyday experiences. There are many reasons to be skeptical of this, no doubt, but the reports should not be dismissed out of hand.
Caption: Secondary knots and links as a metaphor for higher bliss
As with the above example, we can reason that one of the ways in which both pain and pleasure can be present in *multiples* of one’s normal hedonic range is because the amount of consciousness crammed into a moment of experience is not a constant. In other words, when someone in a typical state of consciousness asks “if you say one can experience so much pain/pleasure, tell me, where would that fit in my experience? I don’t see much room for that to fit in here”, one can respond by saying that “in other states of consciousness there is more (phenomenal) time and space within each moment of experience”. Indeed, at Qualia Computing we have assembled and interpreted a large number of experiences of high-energy states of consciousness that indicate that both phenomenal time, and phenomenal space, can drastically expand. To sum it up – you can fit so much pleasure and pain in peak experiences precisely because such experiencesmake room for them.
Let us now illustrate the point with some paradigmatic cases of very high and vey low valence:
Peak Pleasure States: Jhanas and Temporal Lobe Seizures
On the pleasure side, we have Buddhist meditators who experience meditative states of absorption (aka. “Jhanas”) as extremely, and counter-intuitively, blissful:
The experience can include some very pleasant physical sensations such as goose bumps on the body and the hair standing up to more intense pleasures which grow in intensity and explode into a state of ecstasy. If you have pain in your legs, knees, or other part of the body during meditation, the pain will actually disappear while you are in the jhanas. The pleasant sensations can be so strong to eliminate your painful sensations. You enter the jhanas from the pleasant experiences exploding into a state of ecstasy where you no longer “feel” any of your senses. – 9 Jhanas, Dhamma Wiki
There are 8 (or 9, depending on who you ask) “levels” of Jhanas, and the above is describing only the 1st of them! The higher the Jhana, the more refined the bliss becomes, and the more detached the state is from the common referents of our everyday human experience. Ultra-bliss does not look at all like sensual pleasure or excitement, but more like information-theoretically optimal configurations of resonant waves of consciousness with little to no intentional content (cf. semantically neutral energy). I know this sounds weird, but it’s what is reported.
Caption: “Streamlines from the insula to the cortex” – the insula (in red) is an area of the brain intimately implicated in the super-bliss that sometimes precedes temporal lobe epilepsy (source)
Another example I will provide about ultra-bliss concerns temporal lobe epilepsy, which in a minority of sufferers gives rise to extraordinarily intense states of pleasure, or pain, or both. Such experiences can result in Geschwind syndrome, a condition characterized by hypergraphia (writing non-stop), hyper-religiosity, and a generally intensified mental and emotional life. No doubt, any experience that hits the valence scale at one of its extremes is usually interpreted as other-worldly and paranormal (which gives rise to the question of whether valence is a spiritual phenomenon or the other way around). Famously, Dostoevsky seems to have experienced temporal lobe seizures, and this ultimately informed his worldview and literary work in profound ways. Here is how he describes them:
“A happiness unthinkable in the normal state and unimaginable for anyone who hasn’t experienced it… I am then in perfect harmony with myself and the entire universe.”
– From a letter to his friend Nikolai Strakhov.
…
“I feel entirely in harmony with myself and the whole world, and this feeling is so strong and so delightful that for a few seconds of such bliss one would gladly give up 10 years of one’s life, if not one’s whole life. […] You all, healthy people, can’t imagine the happiness which we epileptics feel during the second before our fit… I don’t know if this felicity lasts for seconds, hours or months, but believe me, I would not exchange it for all the joys that life may bring.”
– from the character Prince Myshkin in Dostoevsky’s novel, The Idiot, which he likely used to give a voice to his own experiences.
Dostoevsky is far from the only person reporting these kinds of experiences from epilepsy:
As Picard [a scientist investigating seizures] cajoled her patients to speak up about their ecstatic seizures, she found that their sensations could be characterised using three broad categories of feelings (Epilepsy & Behaviour, vol 16, p 539). The first was heightened self-awareness. For example, a 53-year-old female teacher told Picard: “During the seizure it is as if I were very, very conscious, more aware, and the sensations, everything seems bigger, overwhelming me.” The second was a sense of physical well-being. A 37-year-old man described it as “a sensation of velvet, as if I were sheltered from anything negative”. The third was intense positive emotions, best articulated by a 64-year-old woman: “The immense joy that fills me is above physical sensations. It is a feeling of total presence, an absolute integration of myself, a feeling of unbelievable harmony of my whole body and myself with life, with the world, with the ‘All’,” she said.
– from “Fits of Rapture”, New Scientist (January 25, 2014) (source)
All in all, these examples illustrate the fact that blissful states can be deeper, richer, more intense, more conscious, and qualitatively superior to the normal everyday range of human emotion.
Now, how about the negative side?
Logarithmic Pain Scales: Stings, Peppers, and Cluster Headaches
“The difference between 6 and 10 on the pain scale is an exponential difference. Believe it or not.” – Insufferable Indifference, by Neil E. Clement (who experiences chronic pain ranging between 6/10 to 10/10, depending on the day)
(1) Justin O. Schmidt stung himself with over 80 species of insects of the Hymenoptera order, and rated the ensuing pain on a 4-point-scale. About the scale, he had to say the following:
4:28 – Justin Schmidt: The harvester ant is what got the sting pain scale going in the first place. I had been stung by honeybees, yellow jackets, paper wasps, etc. the garden variety stuff, that you get bitten by various beetles and things. I went down to Georgia, which has the Eastern-most extension of the harvester ant. I got stung and I said “Wooooow! This is DIFFERENT!” You know? I thought I knew everything there was about insect stings, I was just this dumb little kid. And I realized “Wait a minute! There is something different going on here”, and that’s what got me to do the comparative analysis. Is this unique to harvester ants? Or are there others that are like that. It turns out while the answer is, now we know much later – it’s unique! [unique type of pain]. […] 7:09 – Justin Schmidt: I didn’t really want to go out and get stung for fun. I was this desperate graduate student trying to get a thesis, so I could get out and get a real job, and stop being a student eventually. And I realized that, oh, we can measure toxicity, you know, the killing power of something, but we can’t measure pain… ouch, that one hurts, and that one hurts, and ouch that one over there also hurts… but I can’t put that on a computer program and mathematically analyze what it means for the pain of the insect. So I said, aha! We need a pain scale. A computer can analyze one, two, three, and four, but it can’t analyze “ouch!”. So I decided that I had to make a pain scale, with the harvester ant (cutting to the chase) was a 3. Honey bees was a 2. And I kind of tell people that each number is like 10 equivalent of the number before. So 10 honey bee stings are equal to 1 harvester ant sting, and 10 harvester ant stings would equal one bullet ant sting. […] 11:50 – [Interviewer]: When I finally worked up the courage to [put the Tarantula Hawk on my arm] and take this sting. The sting of that insect was electric in nature. I’ve been shocked before, by accidentally taking a zap from an electrical cord. This was that times 10. And it put me on the ground. My arm seized up from muscle contraction. And it was probably the worst 5 minutes of my life at that point. Justin Schmidt: Yeah, that’s exactly what I call electrifying. I say, imagine you are walking along in Arizona, and there is a wind storm, and the power line above snaps the wire, and it hits you, of course that hasn’t happened to me, but that’s what you imagine it feels like. Because it’s absolutely electrifying, I call it debilitating because you want to be macho, “ah I’m tough, I can do this!” Now you can’t! So I tell people lay down and SCREAM! Right? [Interviewer]: That’s what I did! And Mark would be like, this famous “Coyote, are you ok? Are you ok?” Justin Schmidt: No, I’m not ok! [Interviewer]: And it was very hard to try to compose myself to be like, alright, describe what is happening to your body right now. Because your mind goes into this state that is like blank emptiness. And all you can focus on is the fact that there’s radiating pain coming out of your arm. Justin Schmidt: That’s why you scream, because now you’re focusing on something else. In addition to the pain, you’re focusing on “AAAAAAHHHHH!!!” [screams loudly]. Takes a little bit of the juice off of the pain, so maybe you lower it down to a three for as long as you can yell. And I can yell for a pretty long time when I’m stung by a tarantula hawk.
If we take Justin’s word for it, a sting that scores a 4 on his pain scale is about 1,000 times more painful than a sting that scores a 1 on his scale. Accordingly, Christopher Starr (who replicated the scale), stated that any sting that scores a 4 is “traumatically painful” (source). Finally, since the scale is restricted to stings of insects of the Hymenoptera order, it remains possible that there are stings whose pain would be rated even higher than 4. A 5 on the sting pain index might perhaps be experienced with the stings of the box jellyfish that produces Irukandji syndrome, and the bite of the giant desert centipede. Needless to say, these are to be avoided.
(2) The Scoville scale measures how spicy different chili peppers and hot sauces are. It is calculated by diluting the pepper/sauce in water until it is no longer possible to detect any spice in it. The number that is associated with the pepper or sauce is the ratio of water-to-sauce that makes it just barely possible to taste the spice. Now, this is of course not itself a pain scale. I would nonetheless anticipate that taking the log of the Scoville units of a dish might be a good approximation for the reported pain it delivers. In particular, people note that there are severalqualitative jumps in the type and nature of the pain one experiences when eating hot sauces of different strengths (e.g. “Fuck you Sean! […] That was a leap, Sean, that was a LEAP!” – Ken Jeong right after getting to the 135,000 Scoville units sauce in the pain porn Youtube series Hot Ones). Amazon reviews of ultra-hot sauces can be mined for phenomenological information concerning intense pain, and the general impression one gets after reading such reviews is that indeed there is a sort of exponential range of possible pain values:
I know it may be fun to trivialize this kind of pain, but different people react differently to it (probably following a long-tail too!). For some people who are very sensitive to heat pain, very hot sauce can be legitimately traumatizing. Hence I advise against having ultra-spicy sauces around your house. The novelty value is not worth the probability of a regrettable accident, as exemplified in some of the Amazon reviews above (e.g. a house guest assuming that your “Da’Bomb – Beyond Insanity” bottle in the fridge can’t possibly be that hot… and ending up in the ER and with PTSD).
I should add that media that is widely consumed about extreme hot sauce (e.g. the Hot Ones mentioned above and numerous stunt Youtube channels) may seem fun on the surface, but what doesn’t make the cut and is left in the editing room is probably not very palatable at all. From an interview: “Has anyone thrown up doing it?” (interviewer) – “Yeah, we’ve run the gamuts. We’ve had people spit in buckets, half-pass out, sleep in the green room afterwards, etc.” (Sean Evans, Hot Ones host). T.J. Miller, when asked about what advice he would give to the show while eating ultra-spicy wings, responded: “Don’t do this. Don’t do this again. End the show. Stop doing the show. That’s my advice. This is very hot. This is painful. There’s a problem here.”
Caption: Trigeminal Neuralgia pain scale – a condition similarly painful to Cluster Headaches
(3) Finally, we come to the “KIP scale”, which is used to rate Cluster Headaches, one of the most painful conditions that people endure:
The KIP scale KIP-0 No pain, life is beautiful KIP-1 Very minor, shadows come and go. Life is still beautiful KIP-2 More persistent shadows KIP-3 Shadows are getting constant but can deal with it KIP-4 Starting to get bad, want to be left alone KIP-5 Still not a “pacer” but need space KIP-6 Wake up grumbling, curse a bit, but can get back to sleep without “dancing” KIP-7 Wake up, sleep not an option, take the beast for a walk and finally fall into bed exhausted KIP-8 Time to scream, yell, curse, head bang, rock, whatever works KIP-9 The “Why me?” syndrome starts to set in KIP-10 Major pain, screaming, head banging, ER trip. Depressed. Suicidal. The duration factor is multiplied by the intensity factor, which uses the KIP scale in an exponential way – a KIP 10 is not just twice as bad as a KIP 5, it’s ten times as intense. Source: Keeping Track, by Cluster Busters
As seen above, the KIP scale is acknowledged by its creator and users to be logarithmic in nature.
In summary: We see that pleasure comes in various grades and that peak experiences such as those induced by psychedelics, meditation, and temporal lobe seizures seem to be orders of magnitude more energetic and better than everyday sober states. Likewise, we see that across several categories of pain, people report being surprised by the leaps in both quality and intensity that are possible. More so, at least in the case of the Schmidt Index and the Kip Scale, the creators of the scale were explicit that it was a logarithmic mapping of the actual level of sensation.
While we do not have enough evidence (and conceptual clarity) to assert that the intensity of pain and pleasure does grow exponentially, the information presented so far does suggest that the valence of experiences follows a long-tail distribution.
Deference-type Approaches for Experience Ranking
The above considerations underscore the importance of coming up with a pleasure-pain scale that tries to take into account the non-linearity and non-normality of valence ratings. One idea we came up with was a “deference”-type approach, where we ask open-ended questions about people’s best and worst experiences and have them rank them against each other. Although locally the data would be very sparse, the idea was that there might be methods to integrate the collective patterns of deference into an approximate scale. If extended to populations of people who are known to have experienced extremes of valence, the approach would even allow us to unify the various pain scales (Scoville, Schmidt, KIP, etc.) and assign a kind of universal valence score to different categories of pain and pleasure.* That will be version 2.0. In the meantime, we thought to try to get a rough picture of the extreme joys and affections of members of the general public, which is what this article will focus on.
Normal World vs. Lognormal World
There is a world we could call the “Normal World”, where valence outliers are rare and most types of experiences affect people more or less similarly, distributed along a Gaussian curve. Then there is another, very different world we could call the “long-tailed world” or if we want to make it simple (acknowledging uncertainty) “Lognormal World”, where almost every valence distribution is a long-tail. So in the “Lognormal World”, say, for pleasure (and symmetrically for pain), we would expect to see a long-tail in the mean pleasure of experiences between different categories across all people, a long-tail in the amount of pleasure within a given type of experience across people, a long-tail for the number of times an individual has had a certain type of pleasure, a long-tail in the intensity of the pleasure experienced with a single category of experience within a single person, and so on. Do we live in the Normal World or the Lognormal World?
Predictions of Lognormal World
If we lived in the “Lognormal World”, we would expect:
That people will typically say that their top #1 best/worst experience is not only a bit better/worse than their #2 experience, but a lot better/worse. Like, perhaps, even multiple times better/worse.
That there will be a long-tail in the number of appearances of different categories (i.e. that a large amount, such as 80%, of top experiences will belong to the same narrow set of categories, and that there will be many different kinds of experiences capturing the remaining 20%).
That for most pairs of experiences x and y, people who have had both instances of x and y, will usually agree about which one is better/worse. We call such a relationship a “deference”. More so, we would expect to see that deference, in general, will be transitive (a > b and b > c implying that a > c).
To test the first and second prediction does not require a lot of data, but the third does because one needs to have enough comparisons to fill a lot of triads. The survey results we will discuss bellow are congruent with the first and second prediction. We did what we could with the data available to investigate the third, and tentatively, it seems to hold up (with ideas like deference network centrality analysis, triadic analysis, and tournament-style approaches).
Survey Setup
The survey asked the following questions: current level of pleasure, current level of pain, top 3 most pleasurable experiences (in decreasing order) along with pleasure ratings for each of them and the age when they were experienced, and the same for the top 3 most painful experiences. I specifically did not provide a set of broad categories (such as “physical” or “emotional”) or a drop-down menu of possible narrow categories (e.g. going to the movies, aerobic exercise, etc.). I wanted to see what people would say when the question was as open-ended as possible.
I also included questions aimed more directly at probing the long-tailed nature of valence: I asked participants to rate “how many times more pleasant was the #1 top experience relative to the #2 top experience” (and #2 relative to #3, and the same for the top most painful experiences).
I also asked them to describe in more detail the single most pleasant and unpleasant experiences, and added a box for comments at the end in order to see if anyone complained about the task (most people said “no comment”, many said they enjoyed the task, and one person said that it made them nostalgic). I also asked about basic demographics (age and gender). Participants earned $1.75 for the task, which seems reasonable given the time it took to complete in most cases.
Mechanical Turk: Participant Composition
The survey was run on Mechanical Turk. I requested “Masters” qualifications for 90/110 of the survey responses. To be a Mechanical Turk Master you need to have a good track record of task approval, which I reasoned would increase the rate of well thought-out high-quality responses (this turned out to be true). The participants’ genders were fairly balanced (50/97 women, 47/97 men), and the average age was 36.5 years (sd = 10):
Bots (easy to spot – unless extremely sophisticated)
While reading the responses I discovered that some of them seemed to be generated by bots. Apparently task requesters started noticing the presence of bots a couple of years ago. This is obviously a problem for academics trying to use the service for their research, and for machine learning professionals using the service for data-tagging. Having been both of those things in the past, I can say that a few years ago I did not see any submissions that looked suspiciously bot-like. Though low-quality rushed responses did seem to be relatively common back then, I never observed bot-like responses to open-ended questions. Unfortunately this time I was able to spot several responses clearly written by bots. For example, one respondent answered the question “write a brief essay about your #1 best experience” with:
The reason these types of assignments are given so often is that anyone can write about their own experience and it doesn’t require any outside resources or research. However, even though anyone can tell a story about their life, that does not mean anyone can write a good essay about that experience. As a professor and teacher for 30 years, I’ve read thousands of essays and can tell you there is a distinct difference from telling a story about yourself and writing an excellent personal experience essay. The difference between good and great:
And it ends that way, with a colon indicating that the respondent is about to explain what the difference between good and great is. But it never does it. This answer, great, it is not.
In most cases the difference between a genuine response and a bot response was very obvious. That said, I erred on the side of caution for filtering bots and I got rid of answers even if they seemed just a little suspicious. This left me with 97 out of the 110 original responses. The following analysis was conducted on those 97 responses.
Preprocessing
Since the responses were open-ended I had to tag each of them with an experience category. To do this I read each response and identified the key theme in them and classified them with a label that was specific enough to distinguish it from nearby experiences (e.g. different types of fractures), but not so specific that we would never get more than one response per category (e.g. “breaking the middle finger in elementary school”). In general, most responses fell into very unambiguous categories (e.g. “When my father passed away” and “Watching my father die and take his last few breaths.” were both classified as “Father death”). About 10% of the responses were relatively ambiguous: it wasn’t clear what the source of the pain or pleasure was. To deal with those responses I used the label “Unspecified”. When some detail was present but ambiguity remained, such as when a broad type of pain or pleasure was mentioned but not the specific source I tagged it as “Unspecified X” where X was a broad category. For example, one person said that “broken bones” was the most painful experience they’ve had, which I labeled as “Unspecified fracture”.
Results
I should preface the following by saying that we are very aware of the lack of scientific rigor in this survey; it remains a pilot exploratory work. We didn’t specify the time-scale for the experiences (e.g. are we asking about the best minute of your life or the best month of your life?) or whether we were requesting instances of physical or psychological pain/pleasures. Despite this lack of constraints it was interesting to see very strong commonalities among people’s responses:
Appearance Base Rates
There were 77 and 124 categories of pleasure and pain identified, respectively. On the whole it seemed like there was a higher diversity of ways to suffer than of ways to experience intense bliss. Summoning the spirit of Tolstoy: “Happy families are all alike; every unhappy family is unhappy in its own way.”
Here are the raw counts for each category with at least two appearances:
Caption: Best experiences appearances (with at least two reports)
Caption: Worst experience appearances (with at least two reports)
For those who want to see the full list of number of appearances for each experience mentioned see the bottom of the article (I also clarify some of the more confusing labels there too)**.
A simple way to try to incorporate the information about the ranking is to weight experiences rated as top #1 with 3 points, those as top #2 with 2 points, and those as the top #3 with 1 point. If you do this, the experiences scores are:
Caption: Weighted appearances of best experiences (#1 – 3 points, #2 – 2 points, #3 – 1 point)
Given the relatively small sample size, I will only report the mean rating for pain and pleasure (out of 10) for categories of experience for which there were 6 or more respondents:
For pain:
Father death (n = 19): mean 8.53, sd 2.3
Childbirth (n = 16): mean 7.94, sd 2.16
Grandmother death (n = 13): mean 8.12, sd 2.5
Mother death (n = 11): mean 9.4, sd 0.62
Car accident (n = 9): mean 8.42, sd 1.52
Kidney stone (n = 9): mean 5.97, sd 3.17
Migraine (n = 9): mean 5.36, sd 3.11
Romantic breakup (n = 9): mean 7.11, sd 1.52
Broken arm (n = 6): mean 8.28, sd 0.88
Broken leg (n = 6): mean 7.33, sd 2.02
Work failure (n = 6): mean 5.88, sd 3.57
(Note: the very high variance for kidney stones and migraine is partly explained by the presence of some very low responses, with values as low as 1.1/10 – perhaps misreported, or perhaps illustrating the extreme diversity of experiences of migraines and kidney stones).
And for pleasure:
Falling in love (n = 42): mean 8.68, sd 1.74
Children born (n = 41): mean 9.19, sd 1.64
Marriage (n = 21): mean 8.7, sd 1.25
Sex (n = 19): mean 8.72, sd 1.45
College graduation (n = 13): mean 7.73, sd 1.4
Orgasm (n = 11): mean 8.24, sd 1.63
Alcohol (n = 8): mean 6.84, sd 1.59
Vacation (n = 6): mean 9.12, sd 0.73
Getting job (n = 6): mean 7.22, sd 1.47
Personal favorite sports win (n = 6): mean 8.17, sd 1.23
Deference Graph of Top Experiences
We will now finally get to the more exploratory and fun/interesting analysis, at least in that it will generate a cool way of visualizing what causes people great joy and pain. Namely, the idea of using people’s rankings in order to populate a global scale across people and show it in the form of a graph of deferences. While the scientific literature has some studies that compare pain across different categories (e.g. 1, 2, 3) I was not able to find any dataset that included actual rankings across a variety of categories. Hence why it was so appealing to visualize this.
The simplest way of graphing experience deferences is to assign a node to each experience category and add an edge between experiences with deference relationships with a weight proportional to the number of directed deferences. For example, if 4 people have said that A was better than B, and 3 people have said that B was better than A, then there will be an edge from A to B with a weight of 4 and an edge from B to A with a weight of 3. Additionally, we can then run a graph centrality algorithm such as PageRank to see where the “deferences end up pooling”.
The images below do this: the PageRank of the graph is represented with the color gradient (darker shades of green/red representing higher PageRank values for good/bad experiences). In addition, the graphs also represent the number of appearances in the dataset for each category with the size of each node:
Caption: Best experiences deferences – edge thickness based on number of deferences, node size based on number of appearances, and color scheme based on PageRank
Caption: Worst experiences deferences – edge thickness based on number of deferences, node size based on number of appearances, and color scheme based on PageRank
The main problem with the approach above is that it double (triple?) counts experiences that are very common. Say that, for example, taking 5-MeO-DMT produces a consistently higher-valence feeling relative to having sex. If we only have a couple of people who report both 5-MeO-DMT and sex as their top experiences, the edge from sex to 5-MeO-DMT will be very weak, and the PageRank algorithm will underestimate the value of 5-MeO-DMT.
In order to avoid the double counting effect of commonly-reported peak experiences we can instead add edge weights on the basis of the proportion with which an experience defers to the other. Let’s say that f(a, b) means “number of times that b is reported as higher than a”. Then the proportion would be f(a, b) / (f(a, b) + f(b, a)). Now, this introduces another problem, which is that pairs of experiences that appear together very infrequently might get a very high proportion score due to a low sample size. In order to prevent this we use Laplace smoothing and modify the equation to (f(a, b) + 1) / (f(a, b) + f(b, a) + 2). Finally, we transform this proportion score from the range of 0 to 1 to the range of -1 to 1 by multiplying by 2 and subtracting one. We call this a “rebalanced smoothed proportion” w(a, b):
I should note that this is not based on any rigorous math. The equation is based on my intuition for what I would expect to see in such a graph, namely a sort of confidence-weighted strength of directionality, but I do not guarantee that this is a principled way of doing so (did I mention this is a pilot small-scale low-budget ‘to a first approximation’ study?). I think that, nonetheless, doing this is still an improvement upon merely using the raw deference counts as the edge weights. To visualize what w(a, b) looks like I graphed its values for a and b in the range of 0 to 20 (literally typing the equation into the google search bar):
Caption: Rebalanced smoothed proportion equation w(a, b)
To populate the graph I only use the positive edge weights so that we can run the PageRank algorithm on it. This now looks a lot more reasonable and informative as a deference graph than the previous attempts:
Caption: Best experiences deference graph: Edge weights based on the rebalanced smoothed proportions, size of nodes is proportional to number of appearances in the dataset, and the color tracks the PageRank of the graph. Edge color based on source node.
Caption: Worst experiences deference graph: Edge weights based on the rebalanced smoothed proportions, size of nodes is proportional to number of appearances in the dataset, and the color tracks the PageRank of the graph. Edge color based on source node.
By taking the PageRank of these graphs (calculated with NetworkX) we arrive at the following global rankings:
Caption: PageRank of the graph of best experiences with edge weights computed with the rebalanced smoothed proportion equation
Caption: PageRank of the graph of worst experiences with edge weights computed with the rebalanced smoothed proportion equation
Intuitively this ranking seems more aligned with what I’ve heard before, but I will withhold judgement on it until we have much more data.
Triadic Analysis
With a more populated deference graph we can analyze in detail the degree to which triads (i.e. sets of three experiences such that each of the three possible deferences are present in the graph) show transitivity (cf. Balance vs. Status Theory).
In particular, we should compare the prevalence of these two triads:
The triads above are 030T, which is transitive, and 030C, which is a loop. The higher the degree of agreement between people and the higher the probability of the existence of an underlying shared scale, we would expect to see more triads of the type 030T relative to 030C. That said, a simple ratio is not enough, since the expected proportion between these two triads can be an artifact of the way the graph is constructed and/or its general shape (and hence the importance of comparing against randomized graphs that preserve as many other statistical features as possible). With our graph, we noticed that the very way in which the edges were introduced generated an artifact of a very strong difference between these two types of triads:
In the case of pain there are 105 ‘030T’, and 3 ‘030C’. And for the pleasure questions there were 98 ‘030T’, and 9 ‘030C’. That said, many of these triads are the artifact of taking into account the top three experiences, which already generates a transitive triad by default when n = 1 for that particular triad of experiences. To avoid this artifact, we filtered the graph by only adding edges when a pair of experiences appeared at least twice (and discounting the edges where w(a, b) = 0). With this adjustment we got 2 ‘030T’, and 1 ‘030C’ for the pain questions, and 1 ‘030T’, and 0 ‘030C’ for the pleasure question. Clearly there is not enough data to meaningfully conduct this type of analysis. If we extend the study and get a larger sample size, this analysis might be much more informative.
Latent Trait Ratings
A final approach I tried for deriving a global ranking of experiences was to assume a latent parameter for pain or pleasure of different experiences and treating the rankings as the tournament results of participants with skill equal to this latent trait. So when someone says that an experience of sex was better than an experience of getting a new bike we imagine that “sex” had a match with “getting bike” and that “sex” won that match. If we do this, then we can import any of the many tournament algorithms that exist (such as the Elo rating system) in order to approximate the latent “skill” trait of each experience (except that here it is the “skill” to cause you pleasure or pain, rather than any kind of gaming ability).
Interestingly, this strategy has also been used in other areas outside of actual tournaments, such as deriving university rankings based on the choices made by students admitted to more than one college (see: Revealed Preference Rankings of US Colleges and Universities).
I should mention that the fact that we are asking about peak experiences likely violates some of the assumptions of these algorithms, since the fact that a match takes place is already information that both experiences made it into the top 3. That said, if the patterns of deference are very strong, this might not represent a problem.
To come up with this tournament-style ranking I decided to go for a state-of-the-art algorithm. The one that I was able to find and use was Microsoft Research’s algorithm called TrueSkill (which is employed to rank players in Xbox LIVE). According to their documentation, to arrive at a conservative “leaderboard” that balances the estimated “true skill” and the uncertainty around it, they recommend ranking by the expected skill level minus three times the standard error around this estimate. If we do this, we arrive at the following experience “leaderboards”:
Caption: Conservative TrueSkill scores for best experiences (mu – 3*sigma)
Caption: Conservative TrueSkill scores for worst experiences (mu – 3*sigma)
Long-tails in Responses to “How Many Times Better/Worse” Question
The survey included four questions aimed at comparing the relative hedonic values of peak experiences: “Relative to the 1st most pleasant experience, how many times better was the 2nd most pleasant experience?” (This was one, the other three were the permutations of also asking about 2nd vs. 3rd and about the bad experiences):
(Note: I’ll ignore the responses to the comparison between the 2nd and 3rd worst pains because I messed up the question -I forgot to substitute “better” for “worse”).
I would understand the skepticism about these graphs. But at the same time, I don’t think it is absurd that for many people the worst experience they’ve had is indeed 10 or 100 times worse than the second worst. For example, someone who has endured a bad Cluster Headache will generally say that the pain of it is tens or hundreds of times worse than any other kind of pain they have had (say, breaking a bone or having skin burns).
The above distributions suggest a long-tail for the hedonic quality of experiences: say that the hedonic quality of each day is distributed along a log-normal distribution. A 45 year old has experienced roughly 17,000 days. Let’s say that such a person’s experience of pain each day is sampled from a log-normal distribution with a Gaussian exponent with a mean of 10 and a standard deviation of 5. If we take 100 such people, and for each of them we take the single worst and the second worst days of their lives, and then take the ratio between them, we will have a distribution like this (simulated in R):
If you smooth the empirical curves above you would get a distribution that looks like these simulations. You really need a long-tail to be able to get results like “for 25% of the participants the single worst experience was at least 4 times as bad as the 2nd worst experience.” Compare that to the sort of pattern that you get if the distribution was normal rather than log-normal:
As you can see (zooming in on the y-axis), the ratios simply do not reach very high values. With the normal distribution simulated here, we see that the highest ratio we achieve is around 1.3, as opposed to the empirical ratios of 10+.*** If you are inclined to believe the survey responses- or at least assign some level of credibility to the responses in the 90th-percentile and below-, the data is much more consistent with a long-tail distribution for hedonic values relative to a normal distribution.
Discussion
Key Pleasures Surfaced
Birth of children
I have heard a number of mothers and father say that having kids was the best thing that ever happened to them. The survey showed this was a very strong pattern, especially among women. In particular, a lot of the reports deal with the very moment in which they held their first baby in their arms for the first time. Some quotes to illustrate this pattern:
The best experience of my life was when my first child was born. I was unsure how I would feel or what to expect, but the moment I first heard her cry I fell in love with her instantly. I felt like suddenly there was another person in this world that I cared about and loved more than myself. I felt a sudden urge to protect her from all the bad in the world. When I first saw her face it was the most beautiful thing I had ever seen. It is almost an indescribable feeling. I felt like I understood the purpose and meaning of life at that moment. I didn’t know it was possible to feel the way I felt when I saw her. I was the happiest I have ever been in my entire life. That moment is something that I will cherish forever. The only other time I have ever felt that way was with the subsequent births of my other two children. It was almost a euphoric feeling. It was an intense calm and contentment. ————— I was young and had a difficult pregnancy with my first born. I was scared because they had to do an emergency c-section because her health and mine were at risk. I had anticipated and thought about how the moment would be when I finally got to hold my first child and realize that I was a mother. It was unbelievably emotional and I don’t think anything in the world could top the amount of pleasure and joy I had when I got to see and hold her for the first time. ————— I was 29 when my son was born. It was amazing. I never thought I would be a father. Watching him come into the world was easily the best day of my life. I did not realize that I could love someone or something so much. It was at about 3am in the morning so I was really tired. But it was wonderful nonetheless. ————— I absolutely loved when my child was born. It was a wave of emotions that I haven’t felt by anything before. It was exciting and scary and beautiful all in one.
No luck for anti-natalists… the super-strong drug-like effects of having children will presumably continue to motivate most humans to reproduce no matter how strong the ethical case against doing so may be. Coming soon: a drug that makes you feel like “you just had 10,000 children”.
Falling in Love
The category of “falling in love” was also a very common top experience. I should note that the experiences reported were not merely those of “having a crush”, but rather, they typically involved unusually fortunate circumstances. For instance, a woman reported being friends with her crush for 7 years. She thought that he was not interested in her, and so she never dared to confess her love for him… until one day, out of the blue, he confessed his love for her. Other experiences of falling in involve chance encounters with childhood friends that led to movie-deserving romantic escapades, forbidden love situations, and cases where the person was convinced the lover was out of his or her league.
Travel/Vacation
The terms “travel” and “vacation” may sound relatively frivolous in light of some of the other pleasures listed. That said, these were not just any kind of travel or vacation. The experiences described do seem rather extraordinary and life-changing. For example, talking about back-packing alone in France for a month, biking across the US with your best friend, or a long trip in South East Asia with your sibling that goes much better than planned.
MDMA/LSD/Psilocybin
It is significant that out of 97 people four of them listed MDMA as one of the most pleasant experiences of their lives. This is salient given the relatively low base rate of usage of this drug (some surveys saying about 12%, which is probably not too far off from the base rate for Mechanical Turk workers using MDMA). This means that a high percentage of people who have tried MDMA will rate it as as one of their top experiences, thus implying that this drug produces experiences sampled from an absurdly long-tailed high-valence distribution. This underscores the civilizational significance of inventing a method to experience MDMA-like states of consciousness in a sustainable fashion (cf. Cooling It Down To Partying It Up).
Likewise, the appearance of LSD and psilocybin is significant for the same reason. That said, measures of the significance of psychedelic experiences in psychedelic studies have shown that a high percentage of those who experience such states rate them among their top most meaningful experiences.
Games of Chance Earnings
Four participants mentioned earnings in games of chance. These cases involved earning amounts ranging from $2,000 all the way to a truck (which was immediately sold for money). What I find significant about this is that these experiences are at times ranked above “college graduation” and other classically meaningful life moments. This brings about a crazy utilitarian idea: if indeed education is as useless as many people in the intellectual elite are saying these days (ex. The Case Against Education) we might as well stop subsidizing higher education and instead make people participate in opt-out games of chance rigged in their favor. Substitute the Department of Education for a Department of Lucky Moments and give people meaningful life experiences at a fraction of the cost.
Key Pains Surfaced
Kidney Stones and Migraines
The fact that these two medical issues were surfaced is, I think, extremely significant. This is because the lifetime incidence of kidney stones is about 10% (~13% for men, 7% for women) and for migraines it is around 13% (9% for men, 18% for women). In the survey we saw 9/93 people mentioning kidney stones, and the same number of people mentioning migraines. In other words, there is reason to believe that a large fraction of the people who have had either of these conditions will rate them as one of their top 3 most painful experiences. This fact alone underscores the massive utilitarian benefit that would come from being able to reduce the incidence of these two medical problems (luckily, we have some good research leads for addressing these problems at a large scale and in a cost-effective way: DMT for migraines, and frequency specific microcurrent for kidney stones)
Childbirth
Childbirth was mentioned 16 times, meaning that roughly 30% of women rate it as one of their three most painful experiences. While many people may look at this and simply nod their heads while saying “well, that’s just life”, here at Qualia Computing we do not condone that kind of defeatism and despicable lack of compassion. As it turns out, there are fascinating research leads to address the pain of childbirth. In particular, Jo Cameron, a 70 year old vegan schoolteacher, described her childbirth by saying that it “felt like a tickle”. She happens to have a mutation in the FAAH gene, which is usually in charge of breaking down anandamine (a neurotransmitter implicated in pain sensitivity and hedonic tone). As we’ve argued before, every child is a complete genetic experiment. In the future, we may as well try to at least make educated guesses about our children’s genes associated with low mood, anxiety, and pain sensitivity. In defiance of common sense (and the Bible) the future of childbirth could indeed be one devoid of intense pain.
Car accidents
Car accidents are extremely common (the base rate is so high that by the age of 40 or so we can almost assume that most people have been in at least one car accident, possibly multiple). More so, it seems likely that the health-damaging effects of car accidents, by their nature, follow a long-tail distribution. The high base rate of people mentioning car accidents in their top 3 most painful experiences underscores the importance of streamlining the process of transitioning into the era of self-driving cars.
Death of Father and Mother
This one does not come as a surprise, but what may stand out is the relatively higher frequency of mentions of “death of father” relative to “death of mother”. I think this is an artifact of the longevity difference between men and women. This is in agreement with the observed effect of age: about 15% vs. 25% of people under and over 40 had mentioned the death of their father, as opposed to a difference of 5% vs. 25% for death of mother. The reason why the father might be over-represented might simply be due to the lower life expectancy of men relative to women, and hence the father, on average, dying earlier. Thus, it being reported more frequently by a younger population.
Future Directions for Methodological Approaches:
Graphical Models with Log-Normal Priors
After trying so many analytic angles on this dataset, what else is there to do? I think that as a proof of concept the analysis presented here is pretty well-rounded. If the Qualia Research Institute does well in the funding department, we can expect to extend this pilot study into a more comprehensive analysis of the pleasure-pain axis both in the general population and among populations who we know have endured or enjoyed extremes of valence (such as cluster headache sufferers or people who have tried 5-MeO-DMT).
In terms of statistical models, an adequate amount of data would enable us to start using probabilistic graphical models to determine the most likely long-tail distributions for all of the key parameters of pleasure and pain. For instance, we might want to develop a model similar to Item Response Theory where:
Each participant samples experiences from a distribution.
Each experience category generates samples with an empirically-determined base rate probability (e.g. chances that it happens in a given year), along with a latent hedonic value distribution.
A “discrimination function” f(a, b) that gives the probability that experience of hedonic value a is rated as more pleasant (or painful) relative an experience with a hedonic value of b.
And a generative model that estimates the likelihood of observing experiences as the top 3 (or top x) based on the parameters provided.
In brief, with an approach like the above we can potentially test the model fit for different distribution types of hedonic values per experience. In particular, we would be able to determine if the model fit is better if the experiences are drawn from a Gaussian vs. a log-normal (or other long-tailed) distribution.
Finally, it might be fruitful to explicitly ask about whether participants have had certain experiences in order to calibrate their ratings, or even have them try a battery of standardized pain/pleasure-inducing stimuli (capsaicin extract, electroshocks, stings, massage, orgasm, etc.). We could also find the way to combine (a) the numerical ratings, (2) the ranking information, and (3) the “how many times better/worse” responses into a single model. And for best results, restrict the analysis to very recent experiences in order to reduce recall biases.
Closing Thoughts on the Valence Scale
To summarize, I believe that the case for a long-tail account of the pleasure-pain axis is very defensible. This picture is supported by:
The long-tailed nature of neuronal cascades,
The phenomenological accounts of intense pleasure and pain (w/ phenomenological accounts of time and space expansion),
The way in which pain scales are constructed by those who developed them, and
The analytic results of the pilot study we conducted and presented here.
In turn, these results give rise to a new interpretation of psychophysical observations such as Weber’s Law. Namely, that Just Noticeable Differences may correspond to geometric differences in qualia, not only in sensory stimuli. That is, that the exponential nature of many cases where Weber’s Law appears are not merely the result of a logarithmic compression on the patterns of stimulation at the “surface” of our sense organs. Rather, the observations presented here suggest that these long-tails deal directly with thequalityandintensityof conscious experience itself.
Additional Material
Dimensionality of Pleasure and Pain
Pain and pleasure may have an intrinsic “dimensionality”. Without elaborating, we will merely state that a generative definition for the “dimensionality of an experience” is the highest “virtual dimension” implied by the patterns of correlation between degrees of freedom. The hot pepper hands account I related suggested a kind of dimensional phase transition between 4/10 and 5/10 pain, where the patterns of a certain type (4/10 “sparks” of pain) would sometimes synchronize and generate a new type of higher-dimensional sensation (5/10 “solitons” of pain). To illustrate this idea further:
First, in Hot Ones, Kumail Nanjiani describes several “leaps” in the spiciness of the wings, first at around 30,000 Scoville (“this new ghost that appears and only here starts to visit you”), and second at around 130k Scoville (paraphrasing: “like how NES to Super Nintendo felt like a big jump, but then Super Nintendo to N64 was an even bigger leap” – “Now we are playing in the big leagues motherfucker! This is fucking real!”). This hints at a change in dimensionality, too.
And second, Shinzen Young‘s advice about dealing with pain involves not resisting it. He discusses how suffering is generated by the coordination between emotional, cognitive, and physical mental formations. If you can keep each of these mental formations happening independently and don’t allow their coordinated forms, you will avoid some of what makes the experience bad. This also suggests that higher-dimensional pain is qualitatively worse. Pragmatically, training to do this may make sense for the time being, since we are still some years away from sustainable pain-relief for everyone.
Mixed States
We have yet to discuss in detail how mixed states come into play for a log-normal valence scale. The Symmetry Theory of Valence would suggest that most states are neutral in nature and that only processes that reduce entropy locally such as neural annealing would produce highly-valenced states. In particular, we would see that high-valence states have very negative valence states nearby in configuration space; if you take a very good high-energy state and distort it in a random direction it will likely feel very unpleasant. The points in between would be mixed valence, which account for the majority of experiences in the wild.
Qualia Formalism
Qualia Formalism posits that for any given system that sustains experiences, there is a mathematical object such that the mathematical features of that object are isomorphic to the system’s phenomenology. In turn, Valence Structuralism posits that the hedonic nature of experience is encoded in a mathematical feature of this object. It is easier to find something real if you posit that it exists (rather than try to explain it away). We have suggested in the past that valence can be explained in terms of the mathematical property of symmetry, which cashes out in the form of neural dissonance and consonance.
In contrast to eliminativist, illusionist, and non-formal approaches to consciousness, at QRIwe simply start by assuming that experience has a deep ground truth structure and we see where we can go from there. Although we currently lack the conceptual schemes, science, and vocabulary needed to talk in precise terms about different degrees of pleasure and pain (though we are trying!), that is not a good reason to dismiss the first-person claims and indirect pieces of evidence concerning the true amounts of various kinds of qualia bound in each moment of experience. If valence does turn out to intrinsically be a mathematical feature of our experience, then both its quality and quantity could very well be precisely measurable, conceptually crisp, and tractable. A scientific fact that, if proven, would certainly have important implications in ethics and meta-ethics.
Notes:
* It’s a shame that Coyote Peterson didn’t rate the pain produced by the various wings he ate on the Hot Ones show relative to insect stings, but that sort of data would be very helpful in establishing a universal valence scale. More generally, stunt-man personalities like the L.A. Beast who subject themselves to extremes of negative valence for Internet points might be an untapped gold mine for experience deference data (e.g. How does eating the most bitter substance known compare with the bullet ant glove? Asking this guy might be the only way to find out, without creating more casualties).
[('Falling in love', 42), ('Children born', 41), ('Marriage', 21), ('Sex', 19), ('College graduation', 13), ('Orgasm', 11), ('Alcohol', 8), ('Vacation', 6), ('Getting job', 6), ('Personal favorite sports win', 6), ('Nature scene', 5), ('Owning home', 5), ('Sports win', 4), ('Graduating highschool', 4), ('MDMA', 4), ('Getting paid for the first time', 4), ('Amusement park', 4), ('Game of chance earning', 4), ('Job achievement', 4), ('Getting engaged', 4), ('Cannabis', 3), ('Eating favorite food', 3), ('Unexpected gift', 3), ('Moving to a better location', 3), ('Travel', 3), ('Divorce', 2), ('Gifting car', 2), ('Giving to charity', 2), ('LSD', 2), ('Won contest', 2), ('Friend reunion', 2), ('Winning bike', 2), ('Kiss', 2), ('Pet ownership', 2), ('Children', 1), ('First air trip', 1), ('First kiss', 1), ('Public performance', 1), ('Hugs', 1), ('Unspecified', 1), ('Recovering from unspecified kidney problem', 1), ('College party', 1), ('Graduate school start', 1), ('Financial success', 1), ('Dinner with loved one', 1), ('Feeling supported', 1), ('Children graduates from college', 1), ('Family event', 1), ('Participating in TV show', 1), ('Psychedelic mushrooms', 1), ('Opiates', 1), ('Having own place', 1), ('Making music', 1), ('Becoming engaged', 1), ('Theater', 1), ('Extreme sport', 1), ('Armed forces graduation', 1), ('Birthday', 1), ('Positive pregnancy test', 1), ('Feeling that God exists', 1), ('Belief that Hell does not exist', 1), ('Getting car', 1), ('Academic achievement', 1), ('Helping others', 1), ('Meeting soulmate', 1), ('Daughter back home', 1), ('Winning custody of children', 1), ('Friend stops drinking', 1), ('Masturbation', 1), ('Friend not dead after all', 1), ('Child learns to walk', 1), ('Attending wedding of loved one', 1), ('Children safe after dangerous situation', 1), ('Unspecified good news', 1), ('Met personal idol', 1), ('Child learns to talk', 1), ('Children good at school', 1)]
For clarity – “Personal favorite sports win” means that the respondent was a participant in the sport as opposed to a spectator (which was labeled as “Sports win”). The difference between “Sex” and “Orgasm” is that Sex refers to the entire act including foreplay and cuddles whereas Orgasm refers to the specific moment of climax. For some reason people would either mention one or the other, and emphasize very different aspects of the experience (e.g. intimacy vs. physical sensation) so I decided to label them differently.
*** It is possible that some fine-tuning of parameters could give rise to long-tail ratios even with a normal distribution (especially if the mean is, say, a negative value and the standard deviation is very wide). But in the general case a normal distribution will have a fairly narrow range for the ratios of the “top value divided by the second top value”. So at least as a general qualitative argument, I think, the simulations do suggest a long-tailed nature for the reported hedonic values.

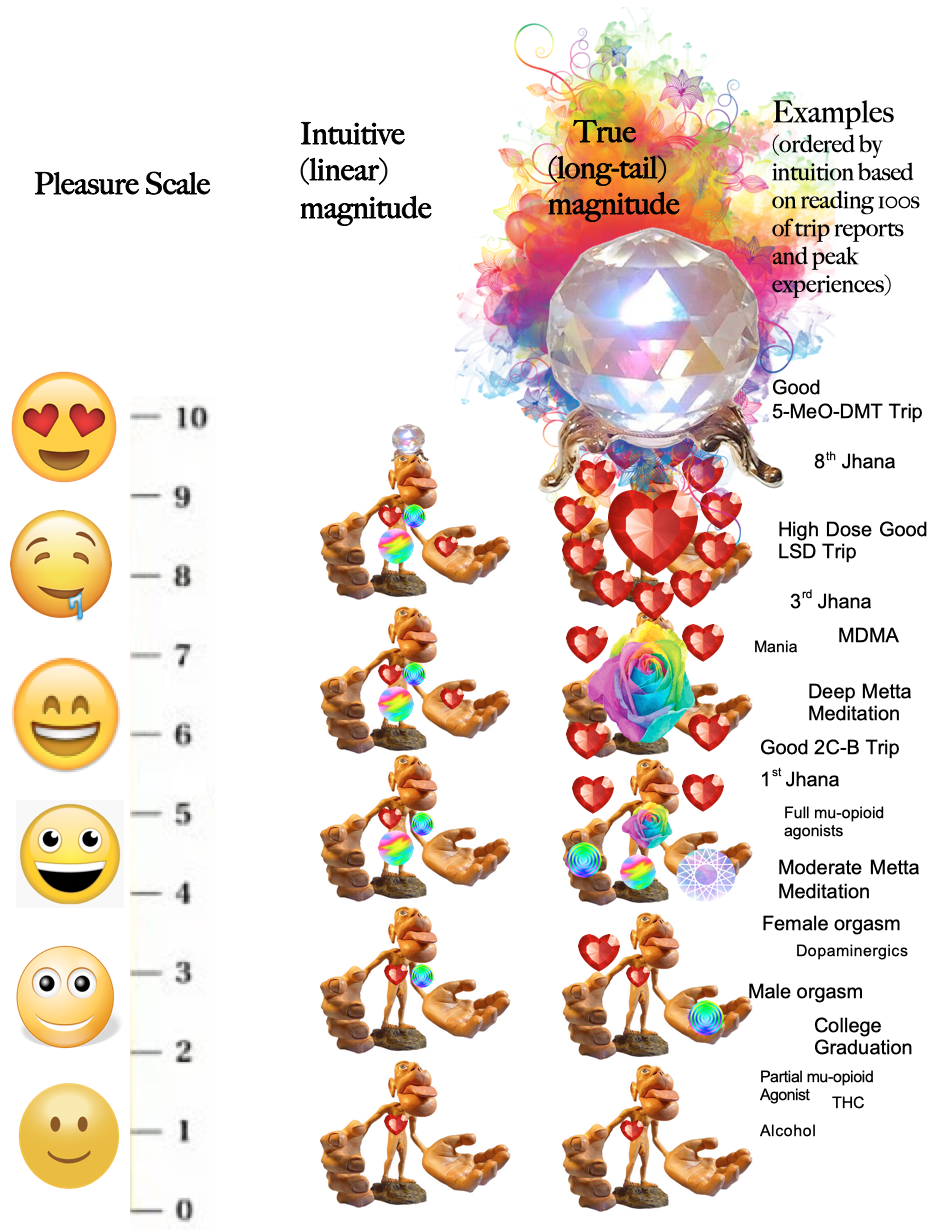
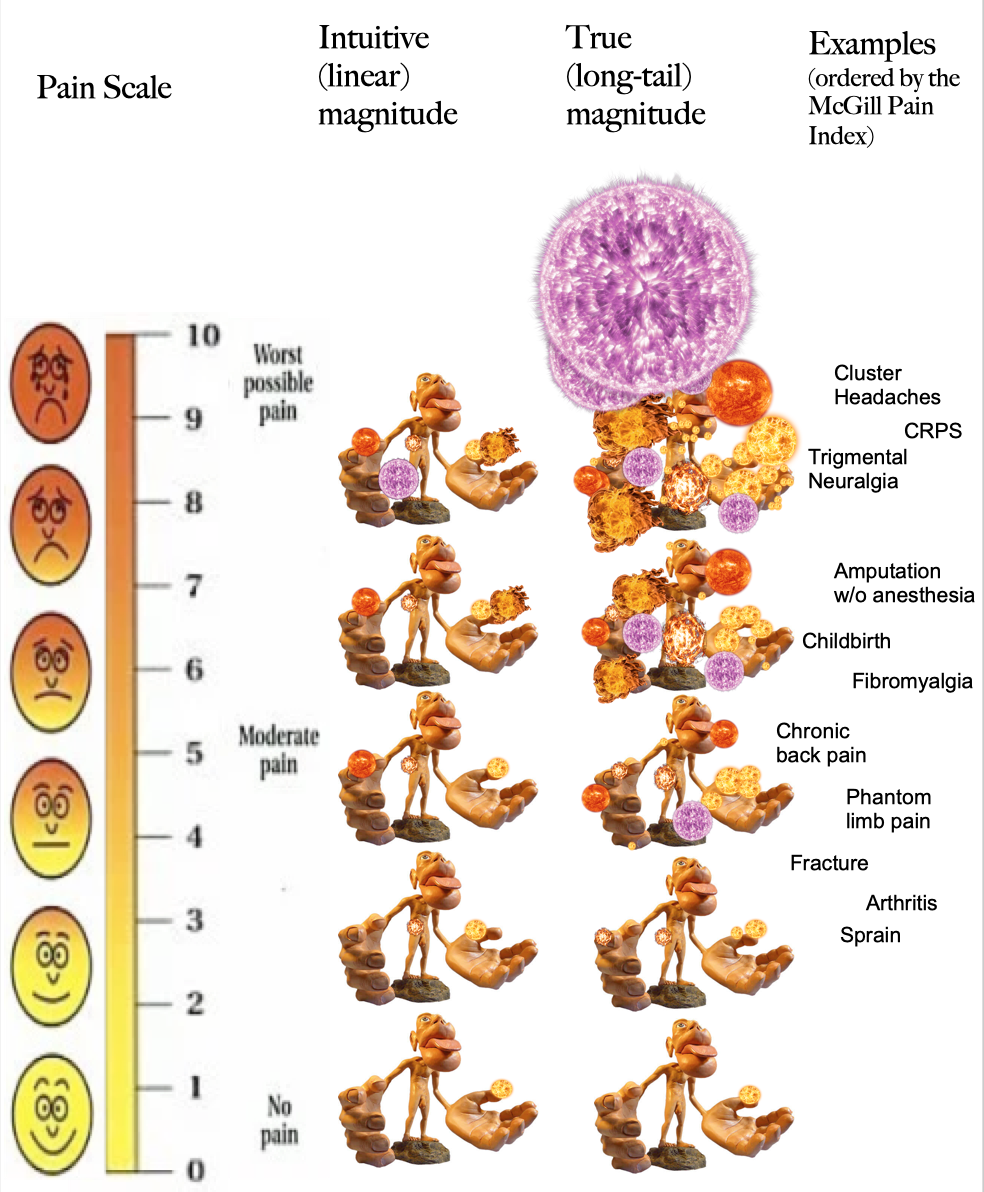
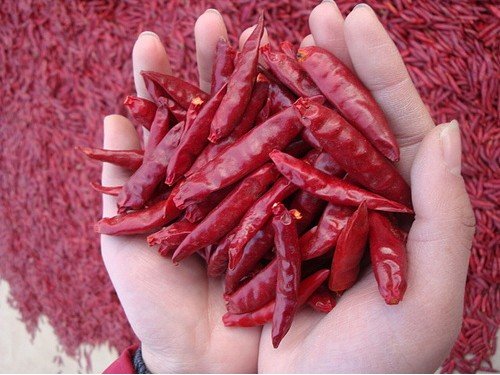
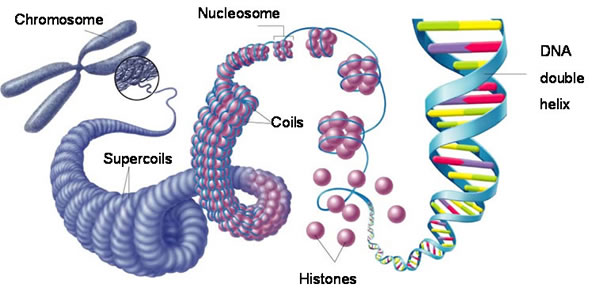
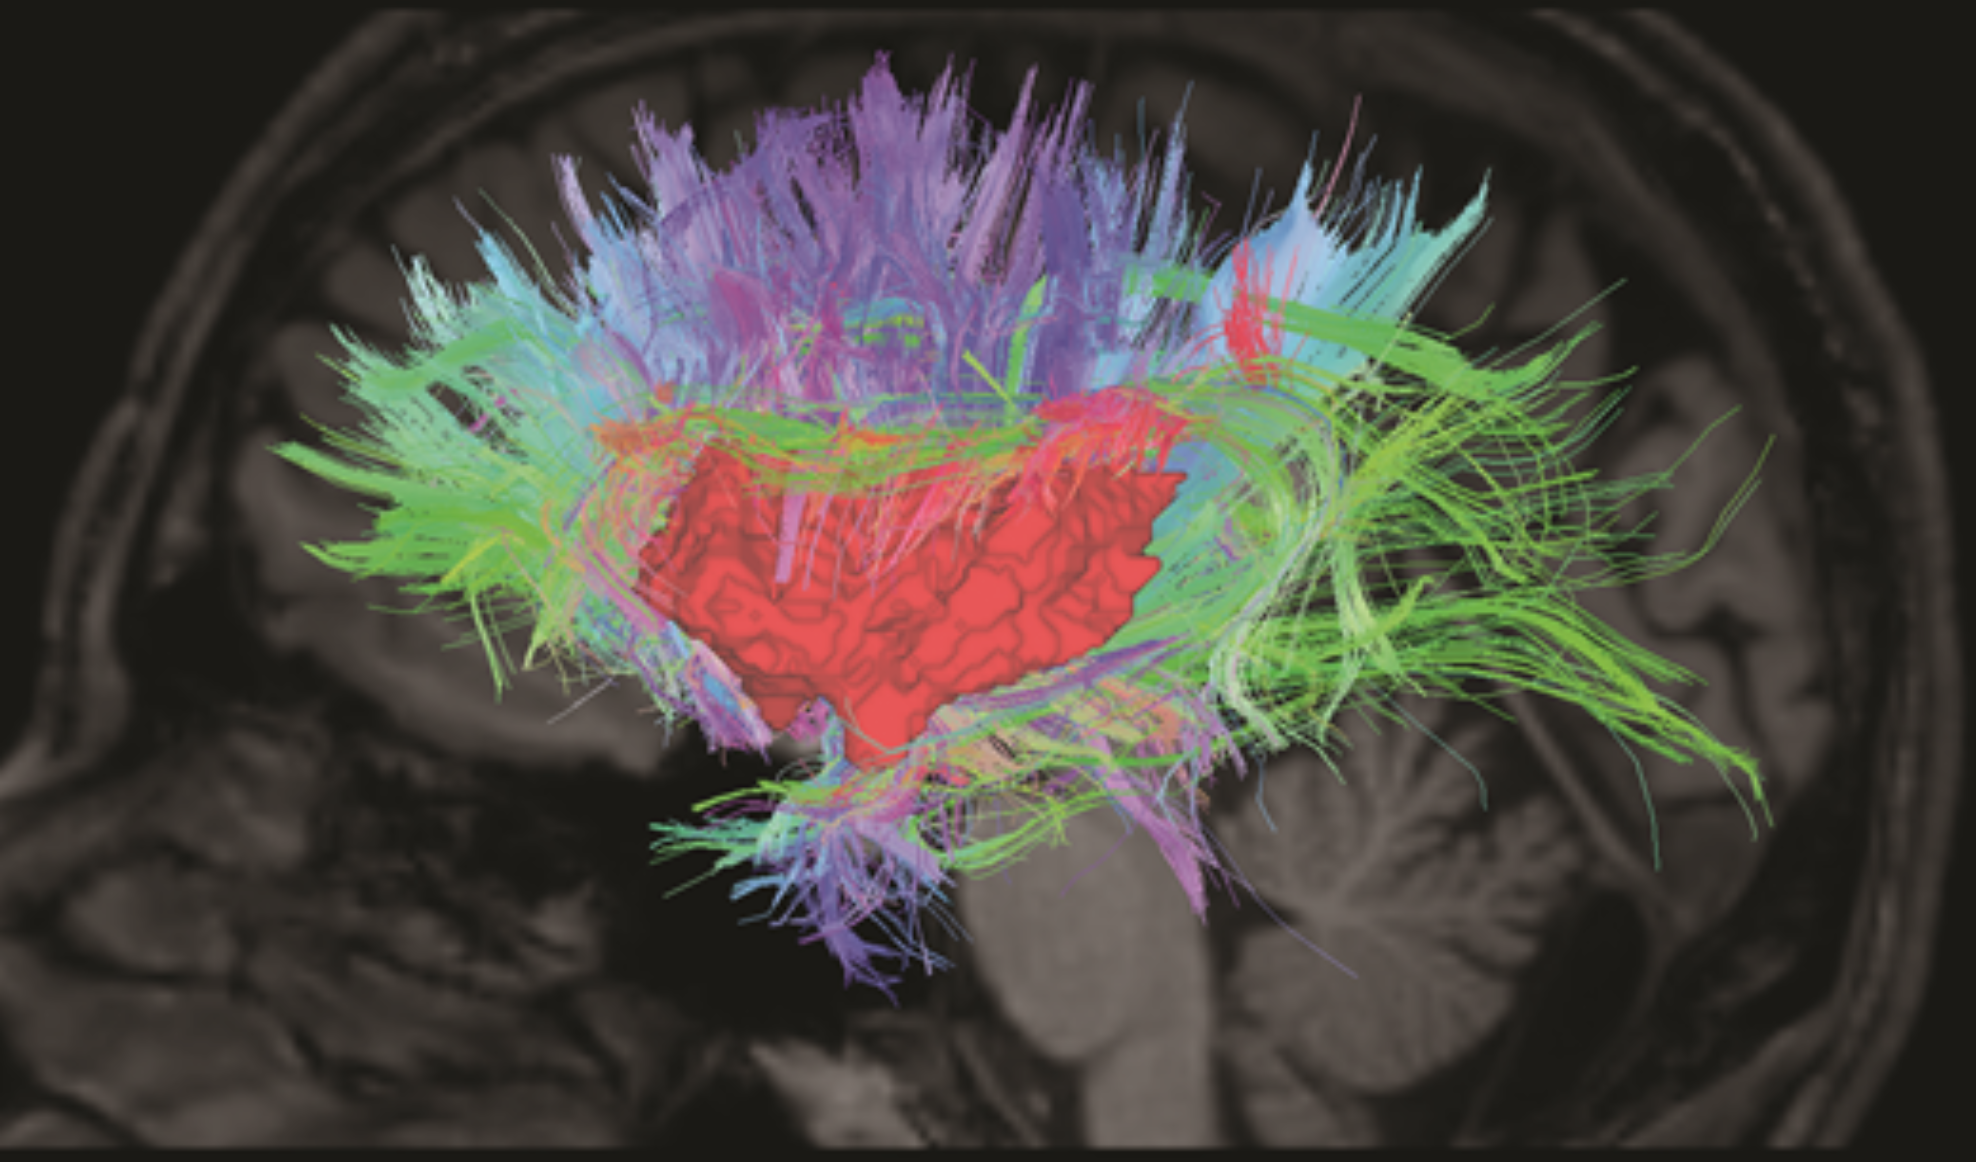

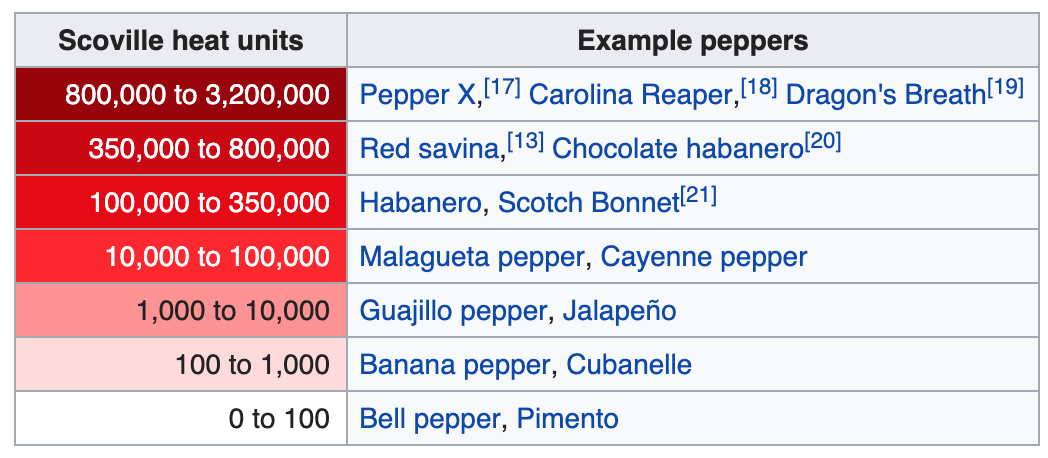
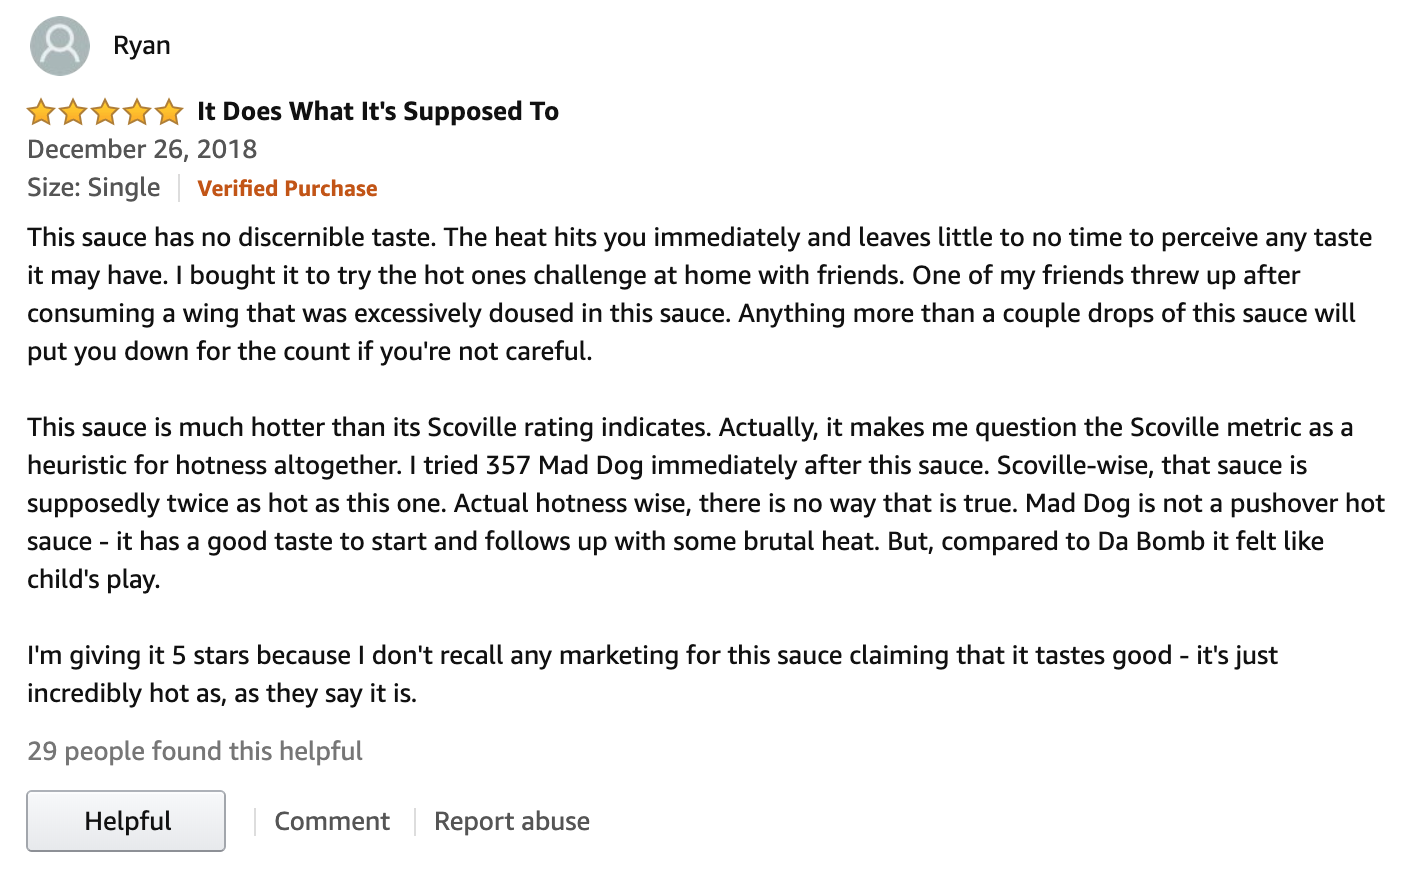

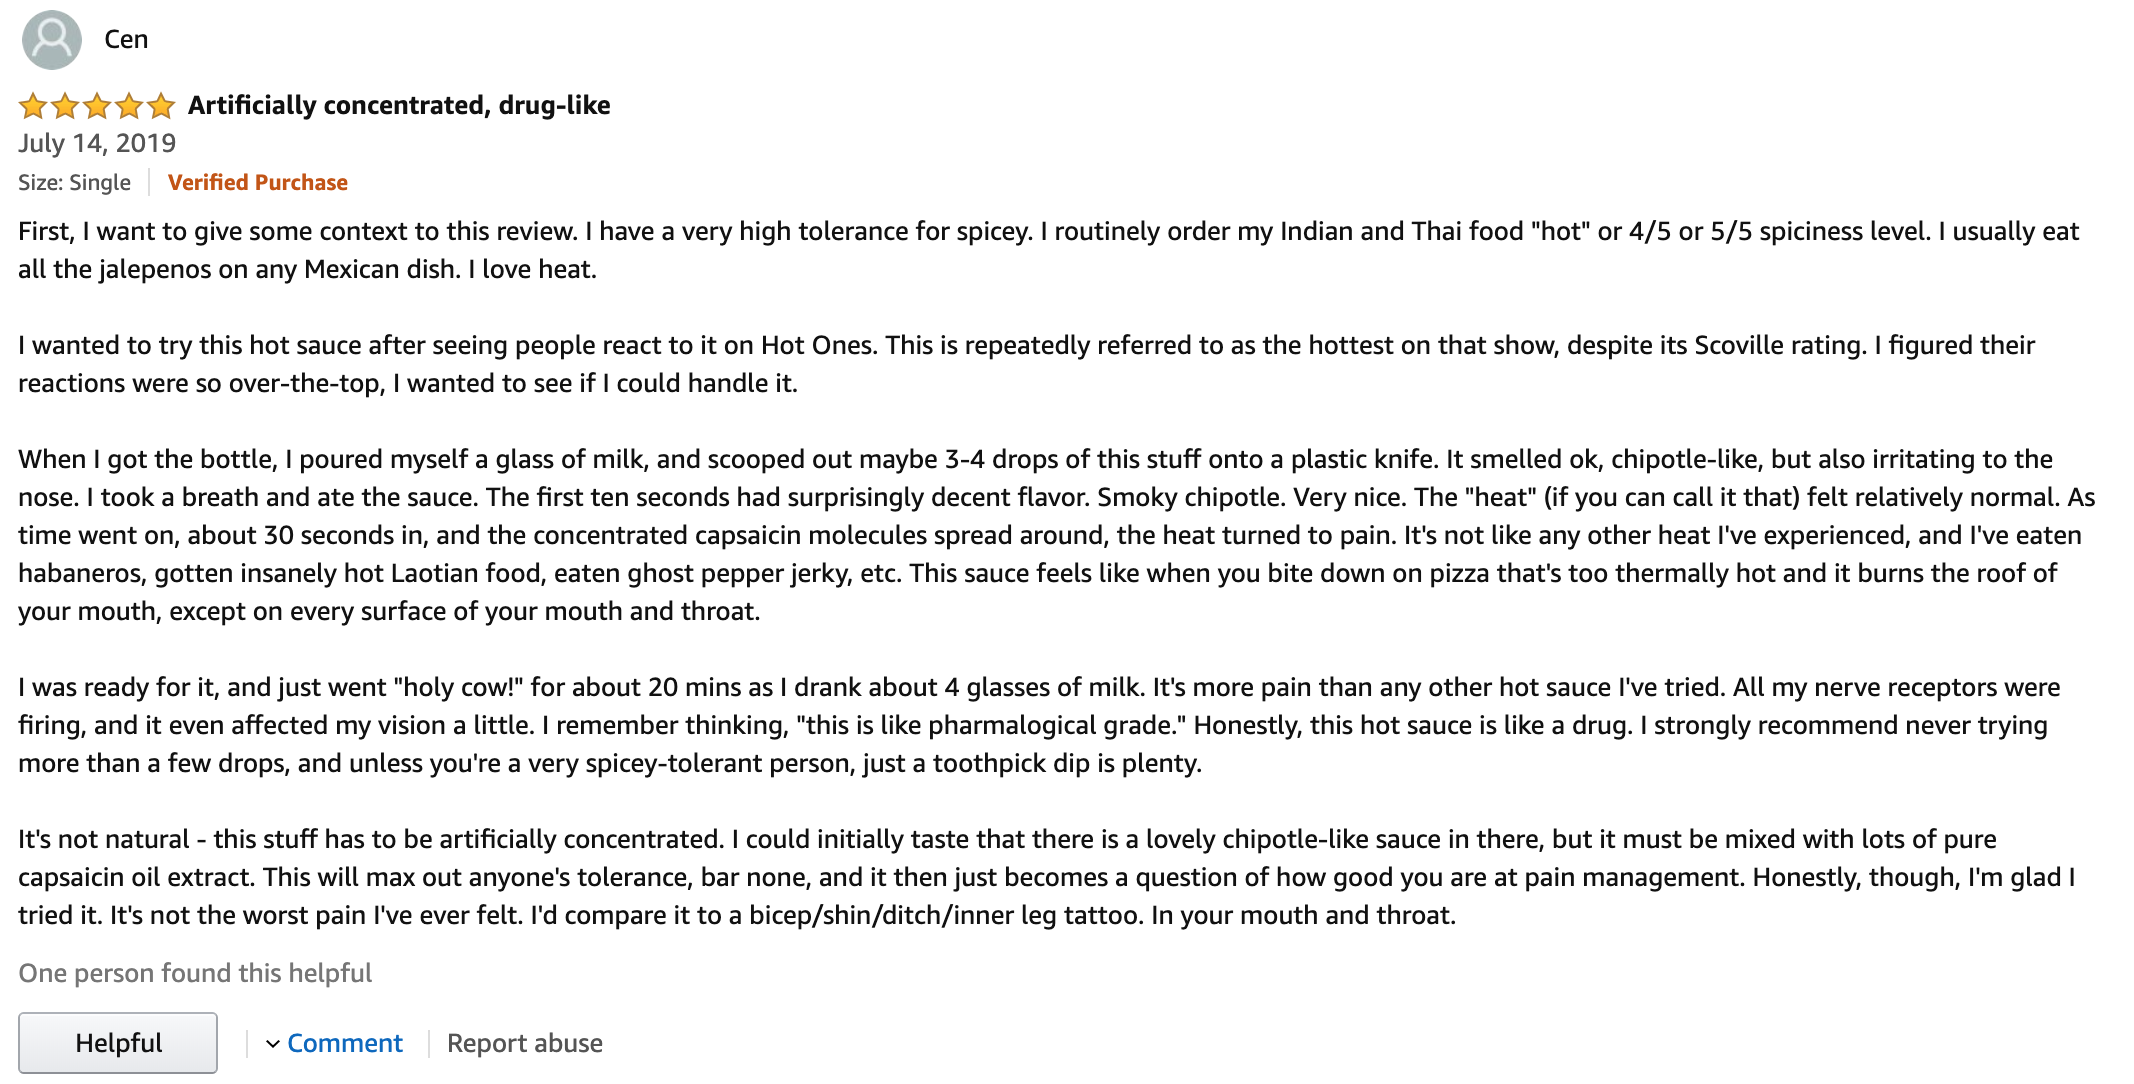


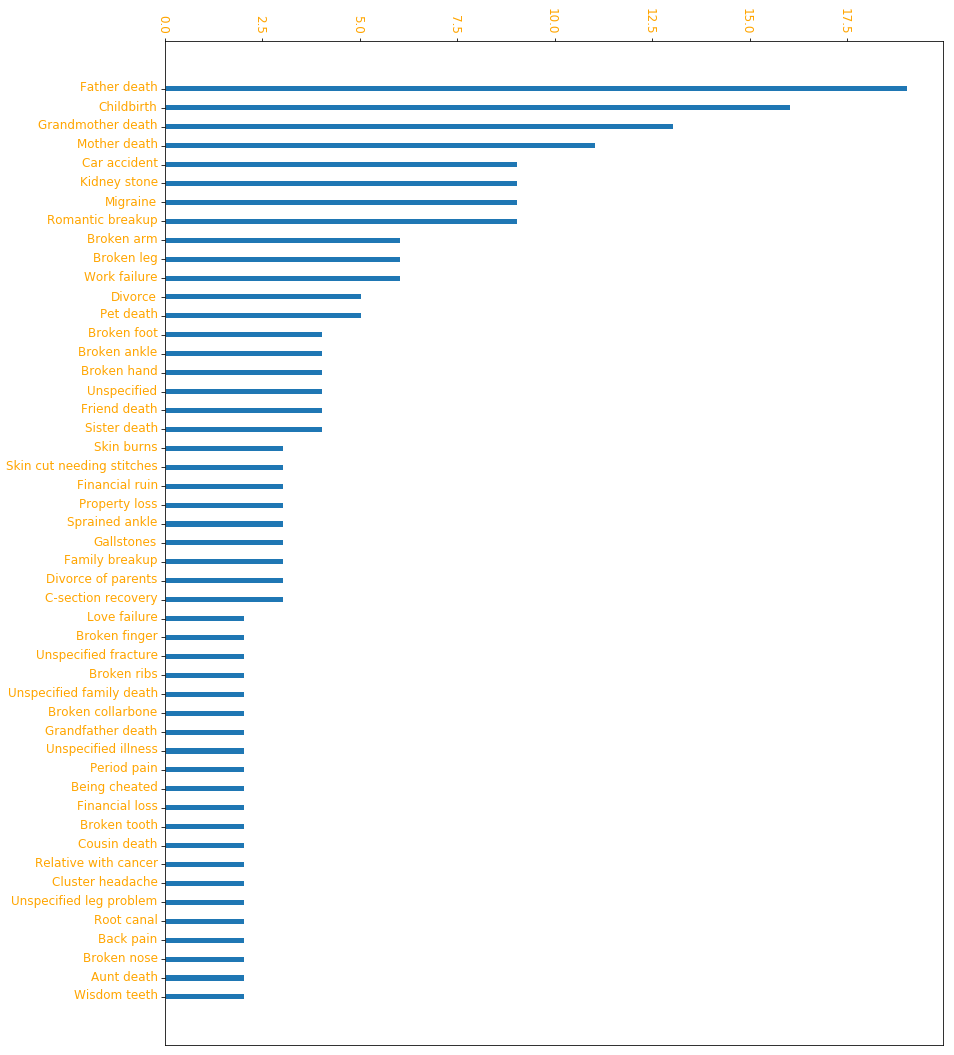
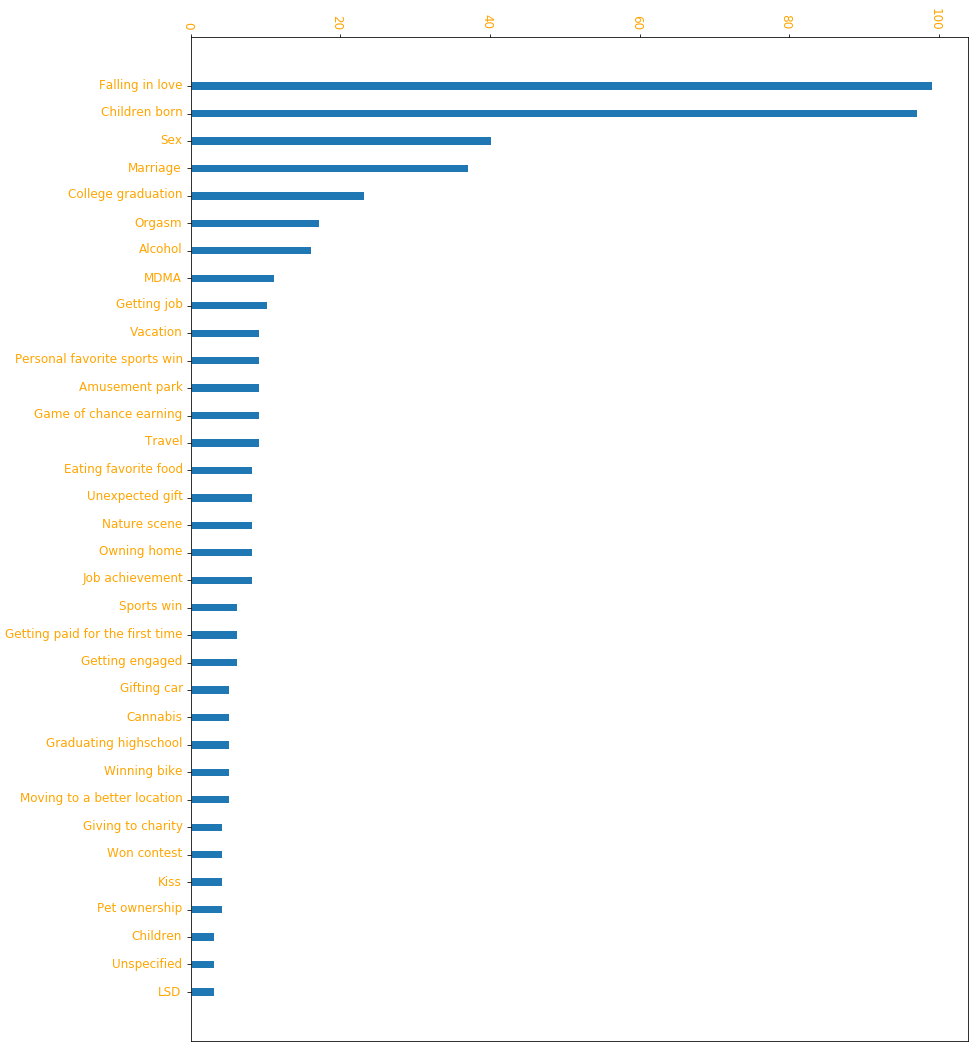

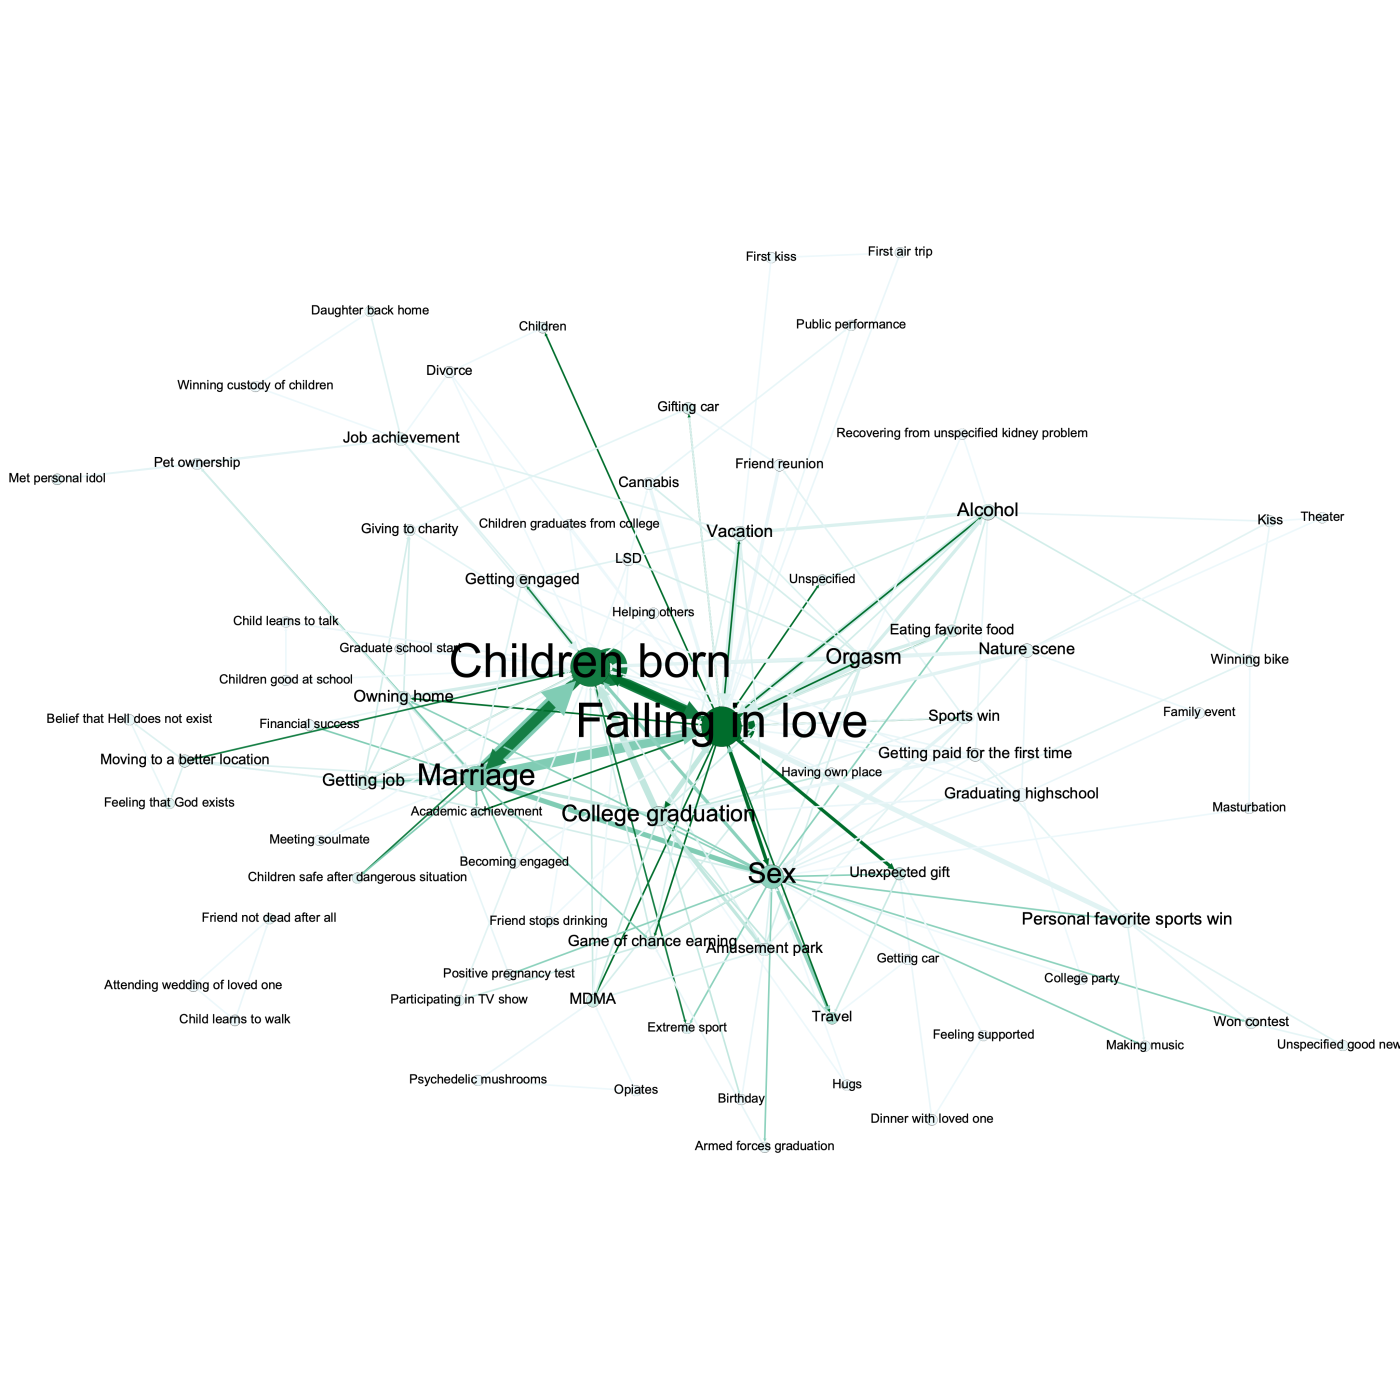


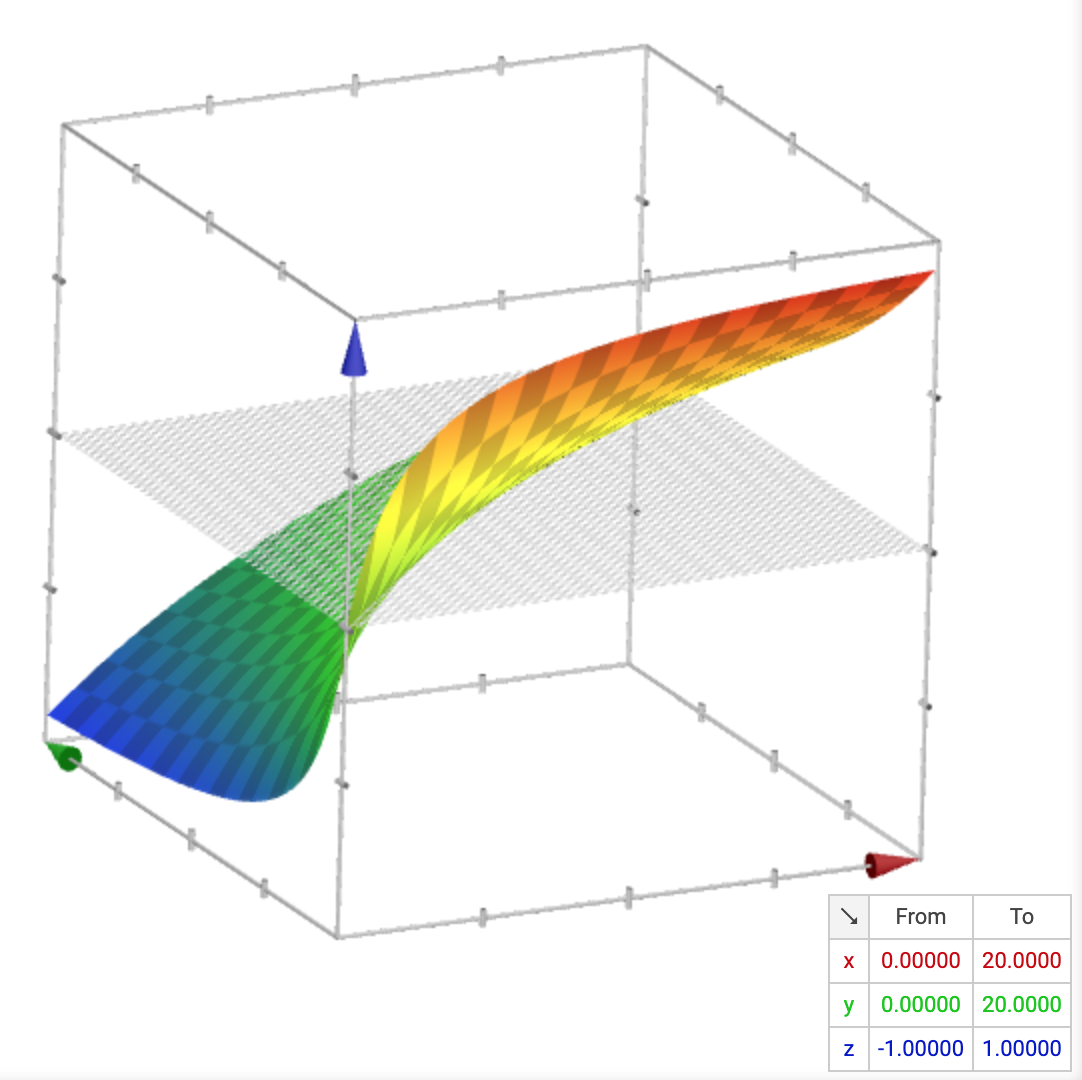
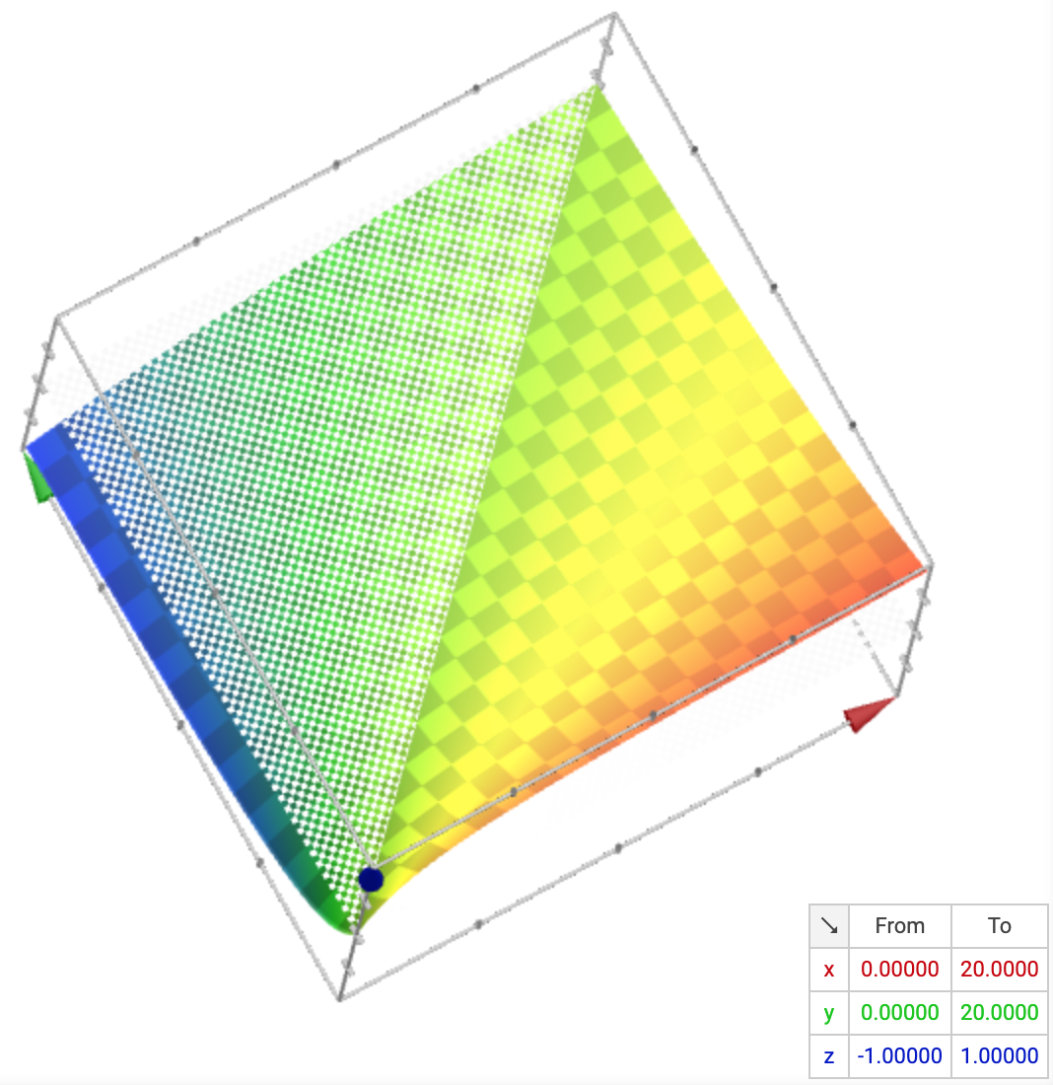

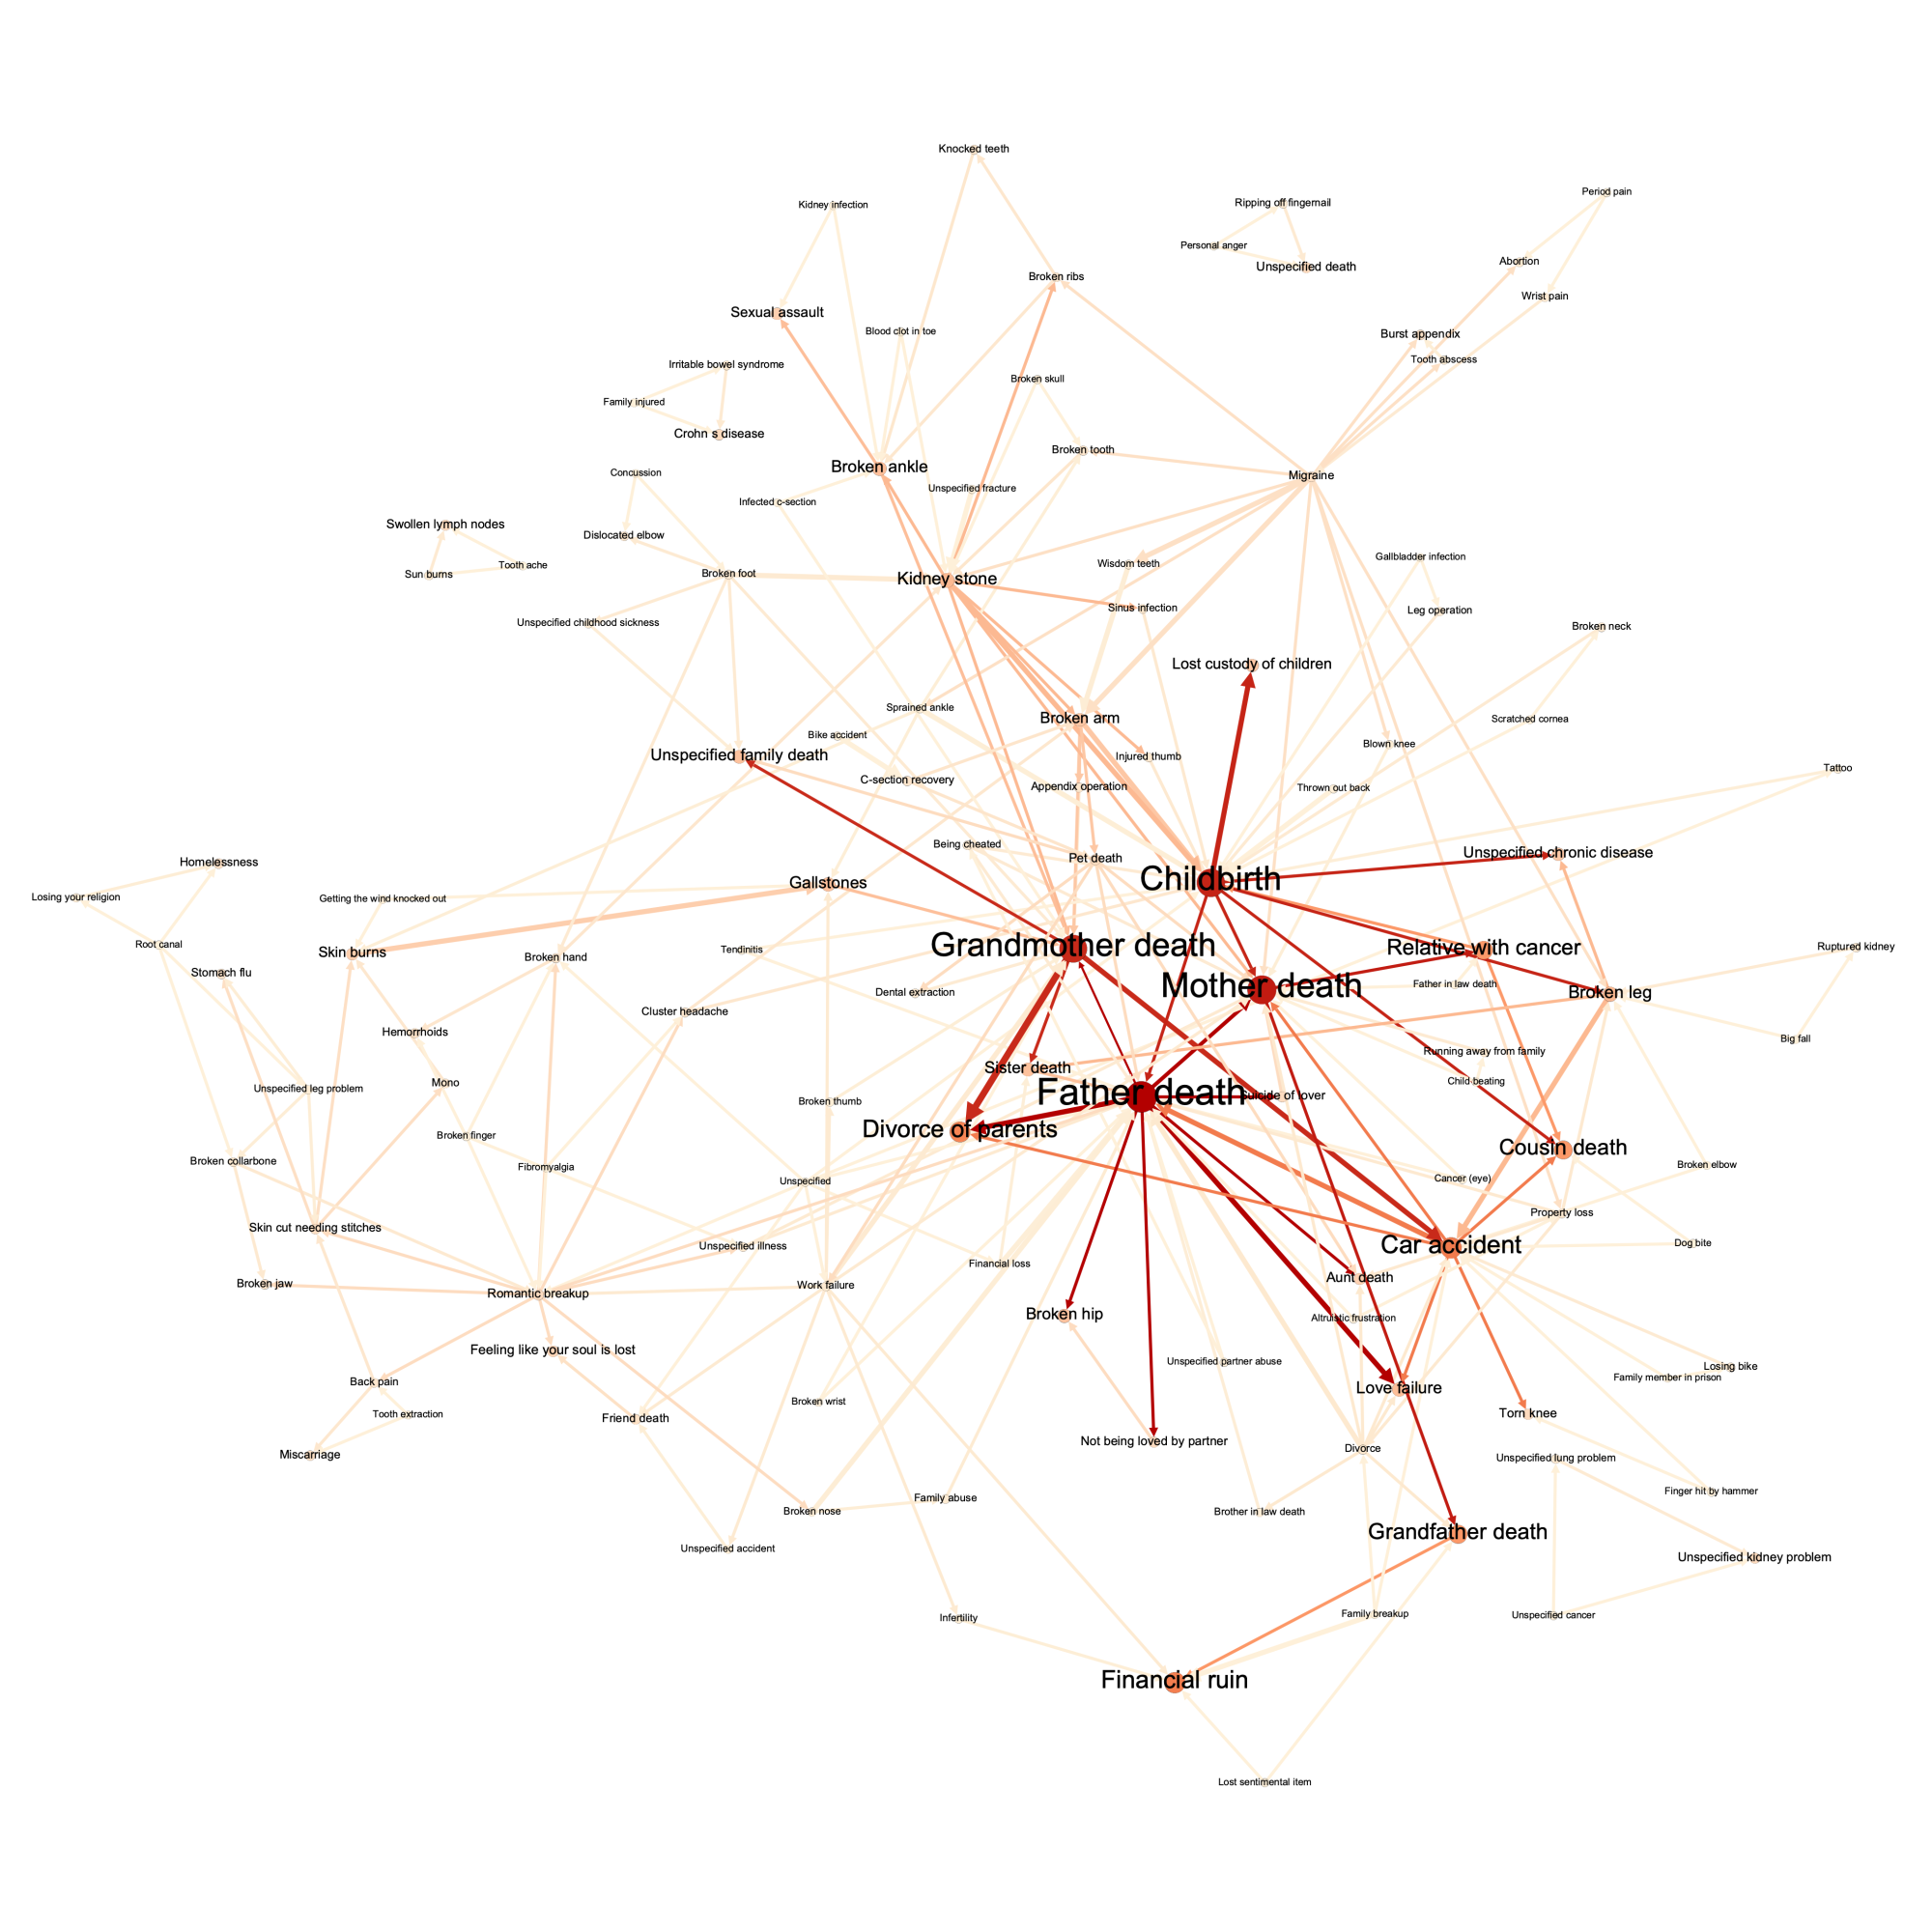

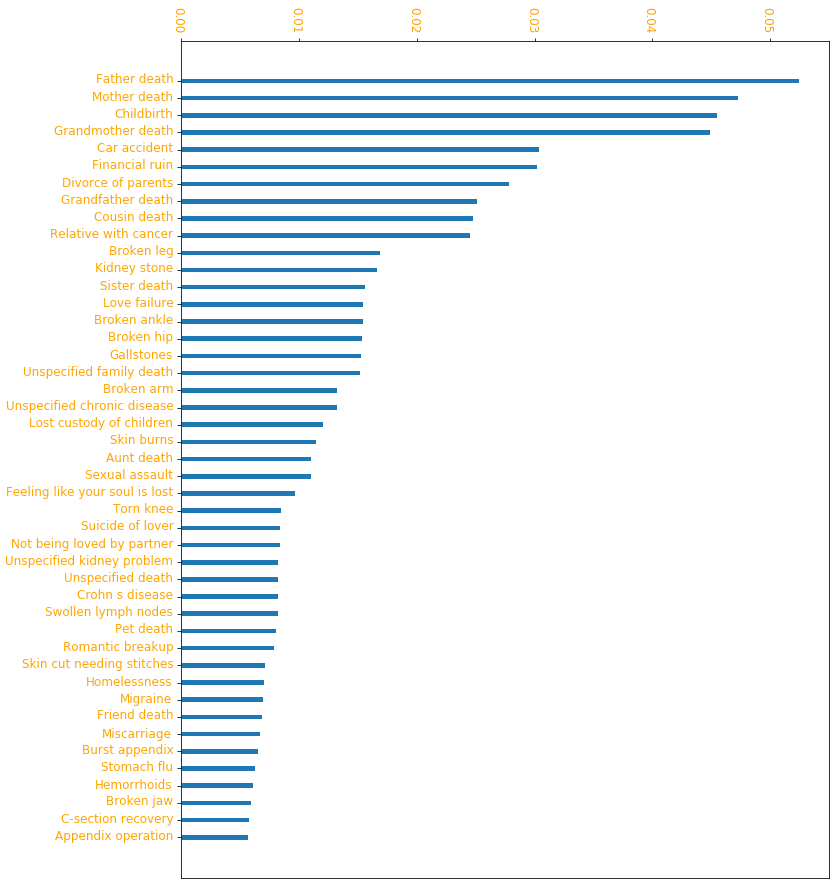
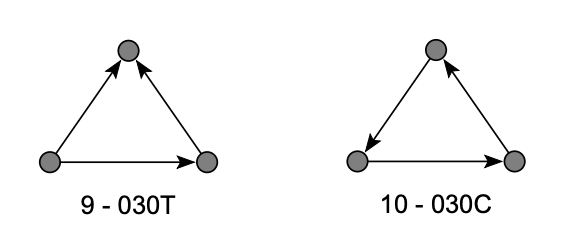
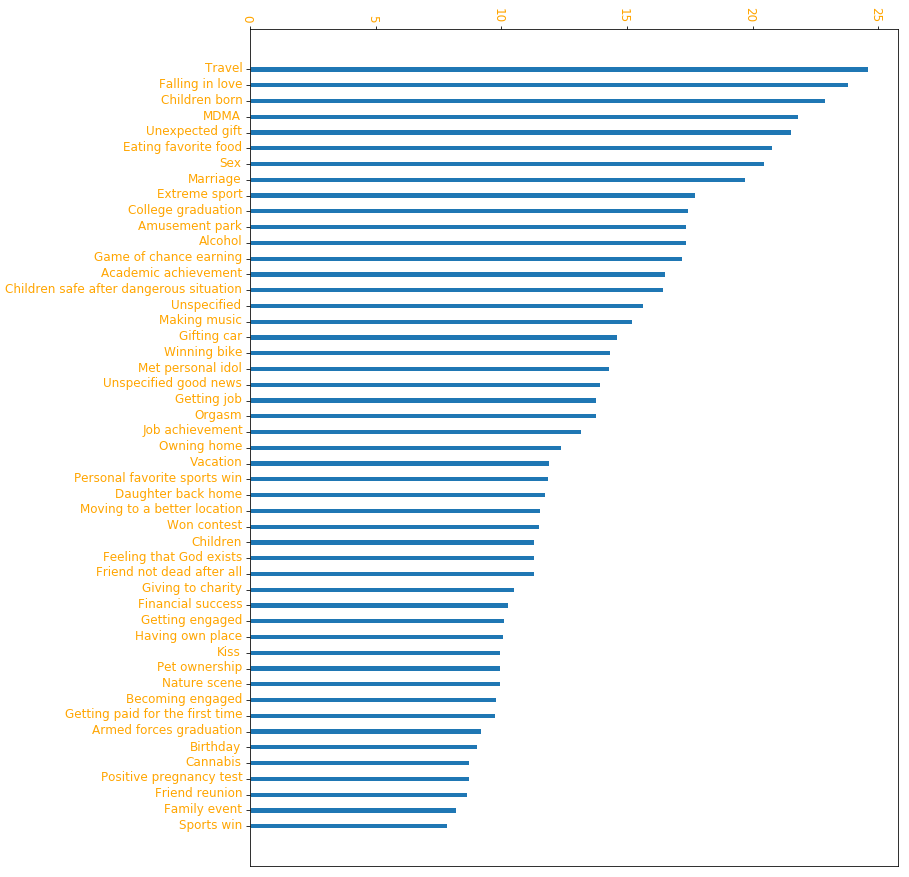
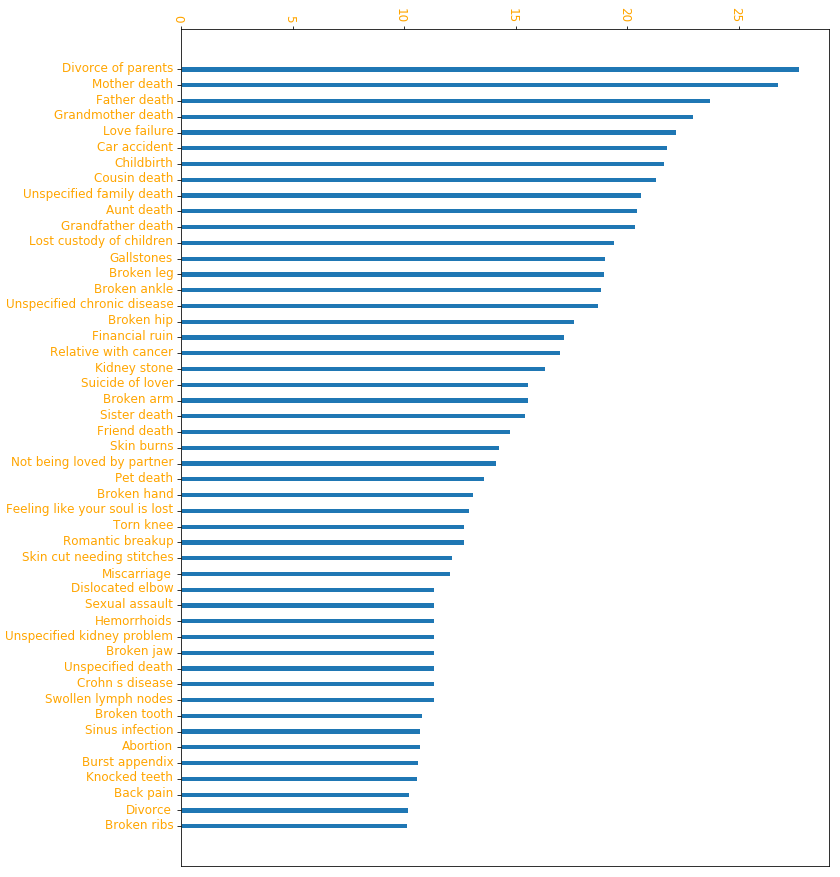


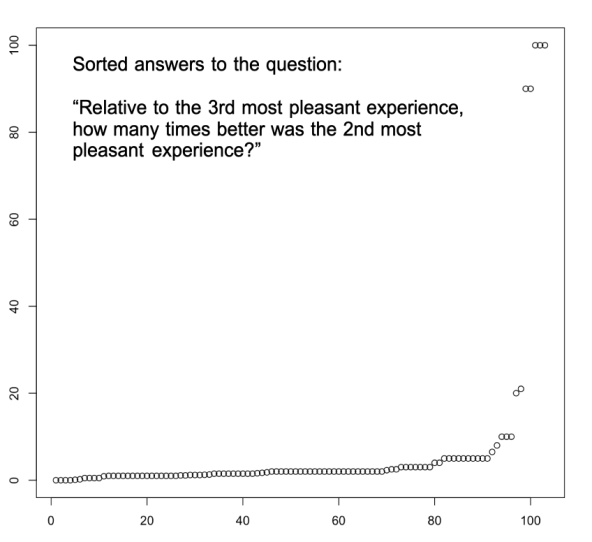

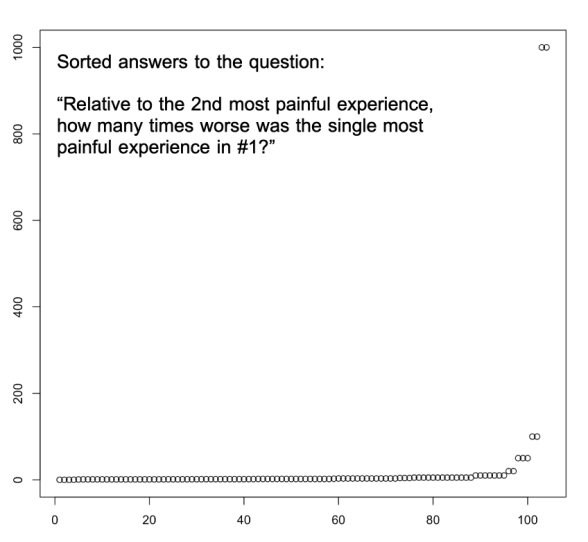
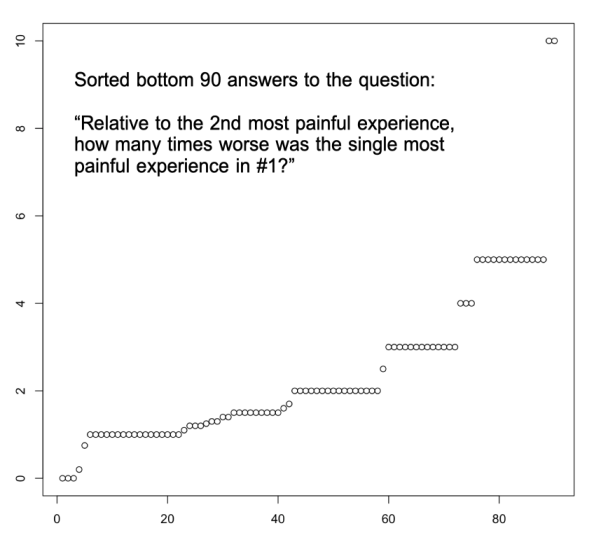
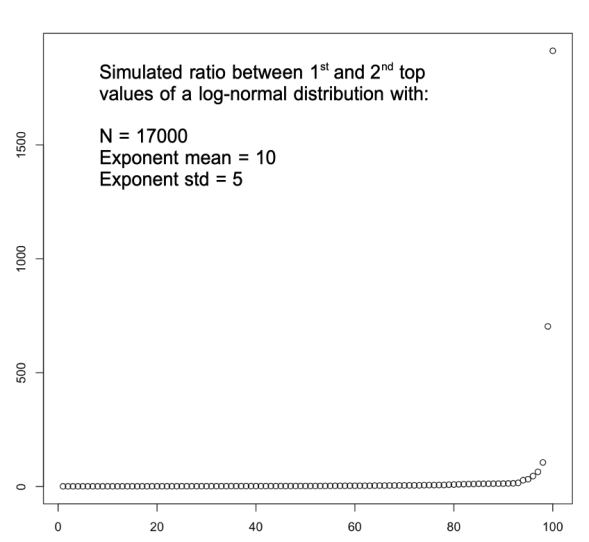
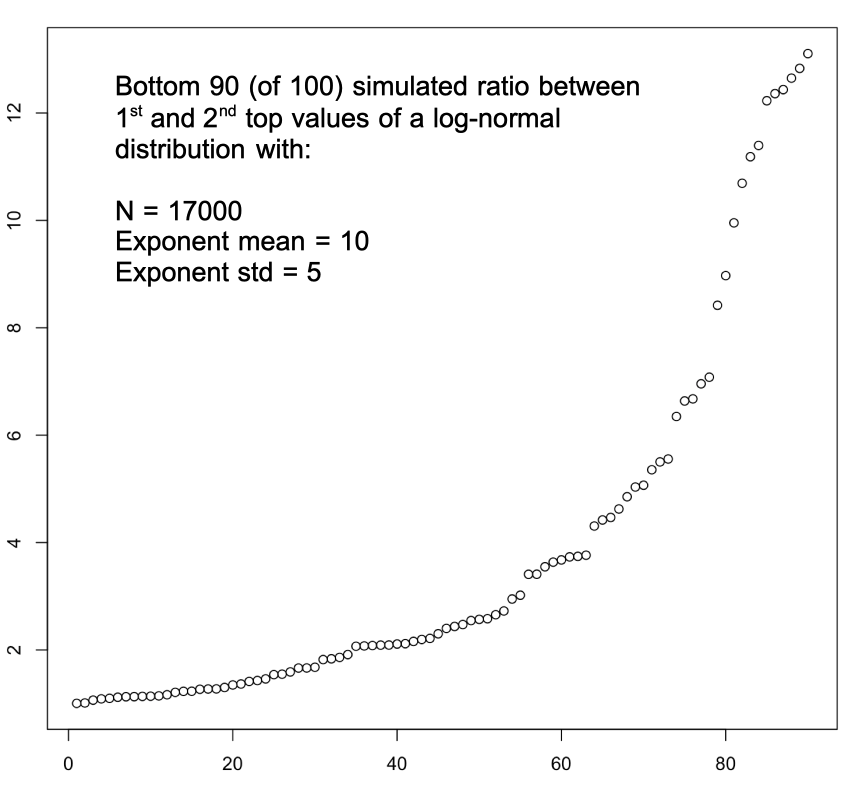


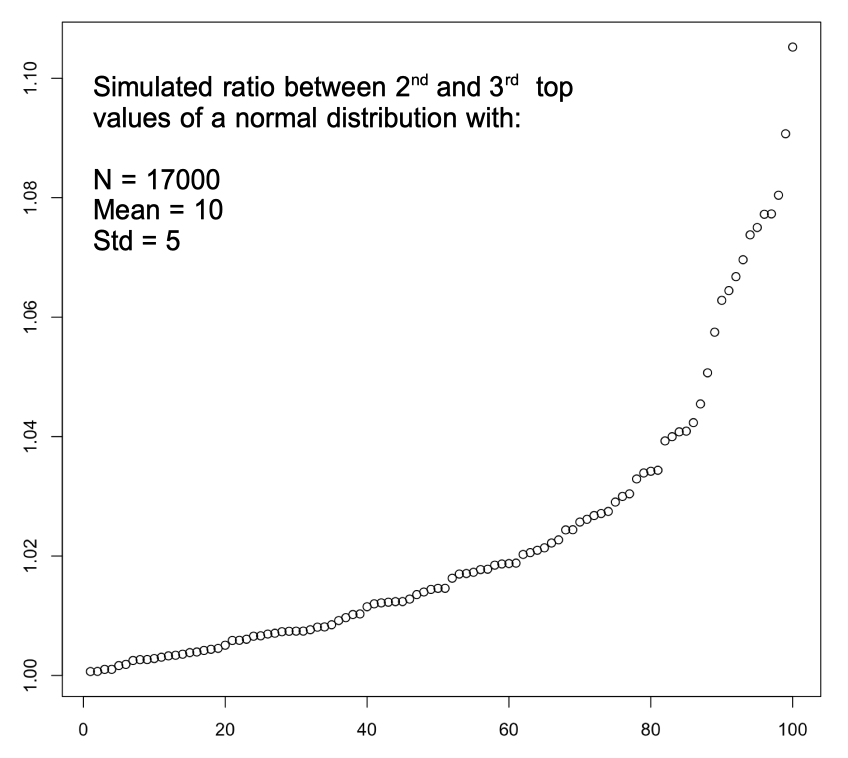
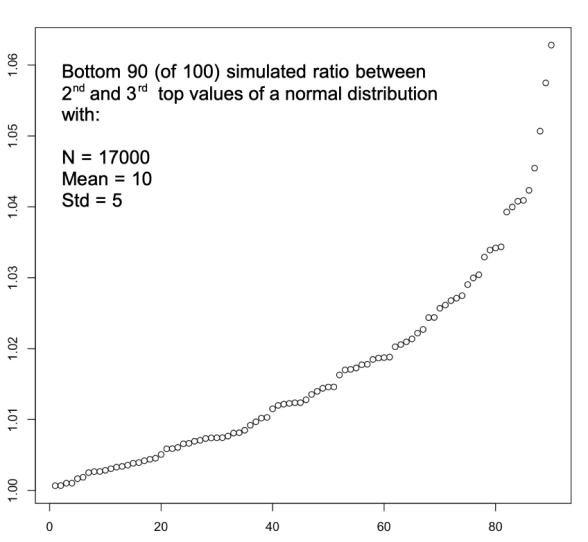

I would like to suggest that Logarithmic Scales of Pleasure and Pain (“Log Scales” from here on out) presents a novel, meaningful, and non-trivial contribution to the field of Effective Altruism. It is novel because even though the terribleness of extreme suffering has been discussed multiple times before, such discussions have not presented a method or conceptual scheme with which to compare extreme suffering relative to less extreme varieties. It is meaningful because it articulates the essence of an intuition of an aspect of life that deeply matters to most people, even if they cannot easily put it into words. And it is non-trivial because the inference that pain (and pleasure) scales are better understood as logarithmic in nature does require one to consider the problem from multiple points of view at once that are rarely, if ever, brought together (e.g. combining deference analysis, descriptions of pain scales by their creators, latent-trait analysis, psychophysics, and so on).
Fundamentally, we could characterize this article as a conceptual reframe that changes how one assesses magnitudes of suffering in the world. To really grasp the significance of this reframe, let’s look back into how Effective Altruism itself was an incredibly powerful conceptual reframe that did something similar. In particular, a core insight that establishes the raison d'etre of Effective Altruism is that the good that you can do in the world with a given set of resources varies enormously depending on how you choose to allocate it: by most criteria that you may choose (whether it’s QALYs or people saved from homelessness), the cost-effectiveness of causes seem to follow much more closely (at least qualitatively) a long-tail rather than a normal distribution (see: Which world problems are the most pressing to solve? by Benjamin Todd). In turn, this strongly suggests that investigating carefully how to invest one’s altruistic efforts is likely to pay off in very large ways: choosing a random charity versus a top 1% charity will lead to benefits whose scale differs by orders of magnitude.
Log Scales suggests that pain and pleasure themselves follow a long-tail distribution. In what way, exactly? Well, to a first approximation, across the entire board! The article (and perhaps more eloquently the subsequent video presentation at the NYC EA Meetup on the same topic) argues that when it comes to the distribution of the intensity of hedonic states, we are likely to find long-tails almost any way we choose to slice or dice the data. This is analogous to, for example, how all of the following quantities follow long-tail distributions: avalanches per country, avalanches per mountain, amount of snow in mountains, number of avalanche-producing mountains per country, size of avalanches, number of avalanches per day, etc. Likewise, in the case of the distribution of pain, the arguments presented suggest we will find that all of the following distributions are long-tails: average pain level per medical condition, number of intensely painful episodes per person per year, intensity of pain per painful episode, total pain per person during one’s life, etc. Thus, that such a small percentage of cluster headache patients accounts for the majority of episodes per year would be expected (see: Cluster Headache Frequency Follows a Long-Tail Distribution), and along with it, the intensity of such episodes themselves would likely follow a long-tail distribution.
This would all be natural, indeed, if we consider neurological phenomena such as pain to be akin to weather phenomena. Log Scales allows us to conceptualize the state of a nervous system and what it gives rise to as akin to how various weather conditions give rise to natural disasters: a number of factors multiply each other resulting in relatively rare, but surprisingly powerful, black swan events. Nervous systems such as those of people suffering from CRPS, fibromyalgia, and cluster headaches are like the Swiss Alps of neurological weather conditions… uniquely suited for ridiculously large avalanches of suffering.
Log Scales are not just of academic interest. In the context of Effective Altruism, they are a powerful generator for identifying new important, neglected, and tractable cause areas to focus on. For instance, DMT for cluster headaches, microdose ibogaine for augmentation of painkillers in sufferers of chronic pain, and chanca piedra for kidney stones (writeup in progres) are all what we believe to be highly promising interventions (of the significant, neglected, and tractable variety) that might arguably reduce suffering in enormous ways and that would not have been highlighted as EA-worthy were it not for Log Scales. (See also: Get-Out-Of-Hell-Free Necklace). On a personal note, I’ve received numerous thank you notes by sufferers of extreme pain for this research. But the work has barely begun: with Log Scales as a lens, we are poised to tackle the world’s reserves of suffering with laser-focus, assured in the knowledge that preventing a small fraction of all painful conditions is all that we need to abolish the bulk of experiential suffering.
But does Log Scales make accurate claims? Does it carve reality at the joints? How do we know?
The core arguments presented were based on (a) the characteristic distribution of neural activity, (b) phenomenological accounts of extreme pleasure and pain, (c) the way in which the creators of pain scales have explicitly described their meaning, and (d) the results of a statistical analysis of a pilot study we conducted where people ranked, rated, and assigned relative proportions to their most extreme experiences. We further framed this in terms of comparing qualitative predictions from what we called the Normal World vs. Lognormal World. In particular, we stated that: “If we lived in the ‘Lognormal World’, we would expect: (1) That people will typically say that their top #1 best/worst experience is not only a bit better/worse than their #2 experience, but a lot better/worse. Like, perhaps, even multiple times better/worse. (2) That there will be a long-tail in the number of appearances of different categories (i.e. that a large amount, such as 80%, of top experiences will belong to the same narrow set of categories, and that there will be many different kinds of experiences capturing the remaining 20%). And (3) that for most pairs of experiences x and y, people who have had both instances of x and y, will usually agree about which one is better/worse. We call such a relationship a ‘deference’. More so, we would expect to see that deference, in general, will be transitive (a > b and b > c implying that a > c).” And then we went ahead and showed that the data was vastly more consistent with Lognormal World than Normal World. I think it holds up.
An additional argument that since has been effective at explaining the paradigm to newcomers has been in terms of exploring the very meaning of Just-Noticeable Differences (JNDs) in the context of the intensity of aspects of one’s experience. Indeed, for (b), the depths of intensity of experience simply make no sense if we were to take a “Just-Noticeable Pinprick” as the unit of measurement and expect a multiple of it to work as the measuring rod between pain levels in the 1-10 pain scale. The upper ends of pain are just so bright, so immensely violent, so as to leave lesser pains as mere rounding errors. But if on each step of a JND of pain intensity we multiply the feeling by a constant, sooner or later (as Zvi might put it) “the rice grains on the chessboard suddenly get fully out of hand” and we enter hellish territory (for a helpful visual aid of this concept: start at 6:06 of our talk at the 2020 EAGxVirtual Unconference on this topic).
From my point of view, we can now justifiably work under the assumption that the qualitative picture painted by Log Scales is roughly correct. It is the more precise quantitative analysis which is a work in progress that ought to be iterated over in the coming years. This will entail broadening the range of people interviewed, developing better techniques to precisely capture and parametrize phenomenology (e.g. see our tool to measure visual tracers), use more appropriate and principled statistical methods (e.g. see the comment about the Bradley-Terry model and extreme value theory), experimental work in psychophysics labs, neuroimaging research of peak experiences, and the search for cost-effective pragmatic solutions to deal with the worst suffering. I believe that future research in this area will show conclusively the qualitative claims, and perhaps there will be strong consilience on the more precise quantitative claims (but in the absence of a true Qualiascope, the quantitative claims will continue to have a non-negligible margin of error).
Ok, you may say, but if I disagree about the importance of preventing pain, and I care more about e.g. human flourishing, why should I care about this? Here I would like to briefly address a key point that people in the EA sphere have raised in light of our work. The core complaint, if we choose to see it that way, is that one must be a valence utilitarian in order to care about this analysis. That only if you think of ethics in terms of classical Benthamite pain-minimization and pleasure-maximization should we be so keen on mapping the true distribution of valence across the globe.
But is that really so?
Three key points stand out: First, that imperfect metrics that are proxies for aspects of what you care about (even when not all that you care about) can nonetheless be important. Second, that if you cared a little about suffering already, then the post-hoc discovery that suffering is actually that freaking skewed really ought to be a major update. And third, there really are reasons other than valence maximization as a terminal goal to care about extreme suffering: suffering is antithetical to flourishing since it has long-term sequelae. More so, even if confined to non-utilitarian ethical theories, one can make the case that there is something especially terrible about letting one’s fellow humans (and non-humans) suffer so intensely without doing anything about it. And perhaps especially so if stopping such horrors turn out to be rather easy.
Let’s tackle each in turn.
(1) Perhaps here we should bring a simple analogy: GDP. Admittedly, there are very few conceptions of the good in which it makes sense for GDP to be the metric to maximize. But there are also few conceptions of the good where you should disregard it altogether. You can certainly be skeptical of the degree to which GDP captures all that is meaningful, but in nearly all views of economic flourishing, GDP will likely have a non-zero weight. Especially if we find that, e.g. some interventions we can do to the economy would cause a 99.9% reduction in a country’s GDP, one should probably not ignore that information (even if the value one assigns to GDP is relatively small compared to what other economists and social scientists assign it). Likewise for extreme suffering. There might be only a few conceptions of the good where that is the only thing we ought to work on. But avoiding hellish states is a rather universally desired state for oneself. Why not take it at least somewhat into account?
In truth, this is not something that classical questions in Effective Altruism pre-Log Scales could overcome either. For instance, as far as I am aware, in practice QALYs are used more as a guide than as an absolute; their value within EA comes from the fact that in practice interventions are orders of magnitude different when it comes to their cost-effectiveness when assessed with QALYs. So even though the vast majority of EAs are not QALY absolutists, the differences in QALYs saved between interventions are large enough that as an approximate guide, the metric still generates huge amounts of consilience.
(2) In turn, the post-hoc finding that hellish states are much, much worse than one would intuitively believe really should at least rebalance one’s priorities somewhat. Is there really no amount of suffering that would do so? Unless one has a utility function akin to a ReLu activation function, going far enough down into the depths of hell ought to count for something. And…
(3) Speaking candidly, in order to fully articulate the true significance of this finding will take us to philosophically polemical territory: philosophy of personal identity where person-affecting views will see the situation quite differently than person-moment-affecting views, philosophy of mind where the ontological status of pleasure and pain are questioned, and intricate questions that arise at the interface between the views of virtue ethicists, deontologists, negative and classical utilitarians. Of course a negative utilitarian who believes in Empty Individualism and Eternalism at the same time will likely be especially horrified by this information. But I would suggest that there are good reasons to care no matter how antithetical one’s view is to philosophical hedonism.
In particular, I would argue that deontologists and virtue ethicists should still take note. The cultivation of virtue requires a minimum of wellbeing in order to maintain motivation to live. And perhaps deontologists might find extreme suffering particularly egregious from the point of view of “things so horrible that ought not to be''. Really, the people we interviewed for the cluster headache writeup told us that experiencing such levels of hellish suffering causes profound psychological transformations (e.g. one interviewee told us that experiencing the higher end of pain in a cluster headache feels like a profound “spiritual violation” from which you may never recover - a feeling most certainly aggravated by the seeming indifference of people at large about their plight). Virtue ethicists and deontologists might as well recognize this cause area as work that is unconscionable not to perform, regardless of arguments based on precise mathematical optimization for the prevention of negative valence.
And finally, in all seriousness, as the cognitive intelligentsia of the world begins to see clearly the nature of the distribution of pleasure and pain, we can expect there to be a big social benefit to being the one who destroys hell. Right now there isn’t a huge social reward to be obtained by working on this cause, but I predict this will change. And, pragmatically, it is sensible to present this cause in a motivating rather than depressing light: indeed, let’s give honor, glory, and endless admiration to whoever makes tangible progress in tearing hell down. And to all of the millionaires and billionaires reading this: this could be you! You could be the one who took on the mantle of preventing all future cluster headaches, established the field of anti-tolerance drugs for severe chronic pain, or got rid of kidney stones (and you did it before it was cool!). Let’s get to work!