Summary
- Farmed cows and pigs account for a tiny fraction of the disability of the farmed animals I analysed.
- The annual disability of farmed animals is much larger than that of humans, even under the arguably very optimistic assumption of all farmed animals having neutral lives.
- The annual funding helping farmed animals is much smaller than that helping humans.
Introduction
I think one should decide on which areas and interventions to fund overwhelmingly based on (marginal) cost-effectiveness, as GiveWell does. Relatedly, I estimated corporate campaigns for chicken welfare, like the ones supported by The Humane League (THL), have a cost-effectiveness of 15.0 DALY/$, 1.51 k times that of GiveWell’s top charities.
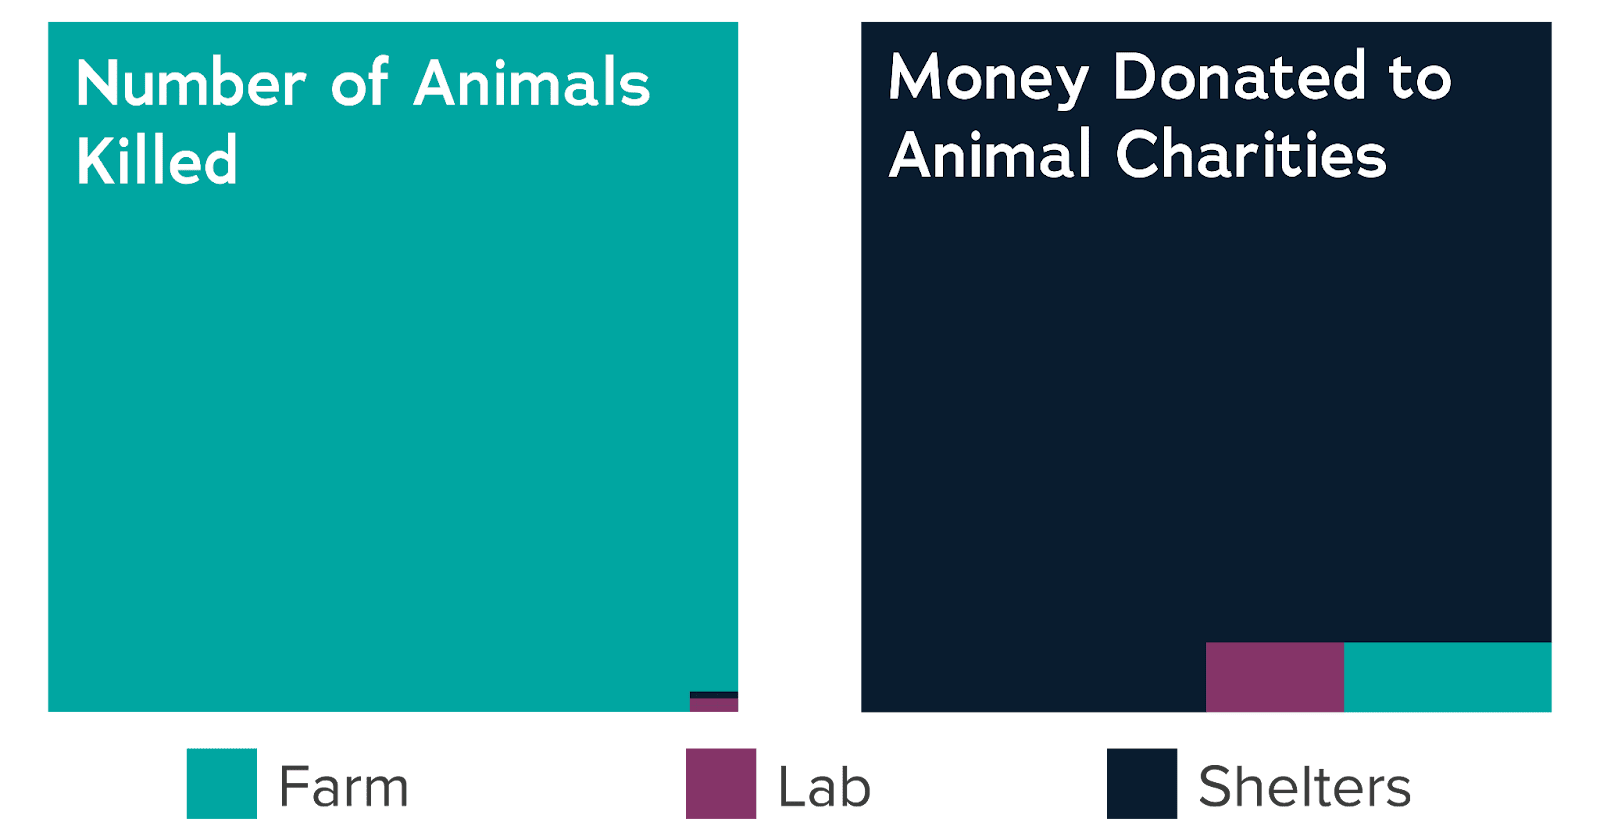
However, for communication purposes, I believe it is fine to look into the benefits of fully solving a problem as well as philanthropic spending. Animal Charity Evaluators (ACE) has a great graph highlighting the neglectedness of farmed animals in the United States relative to their scale.
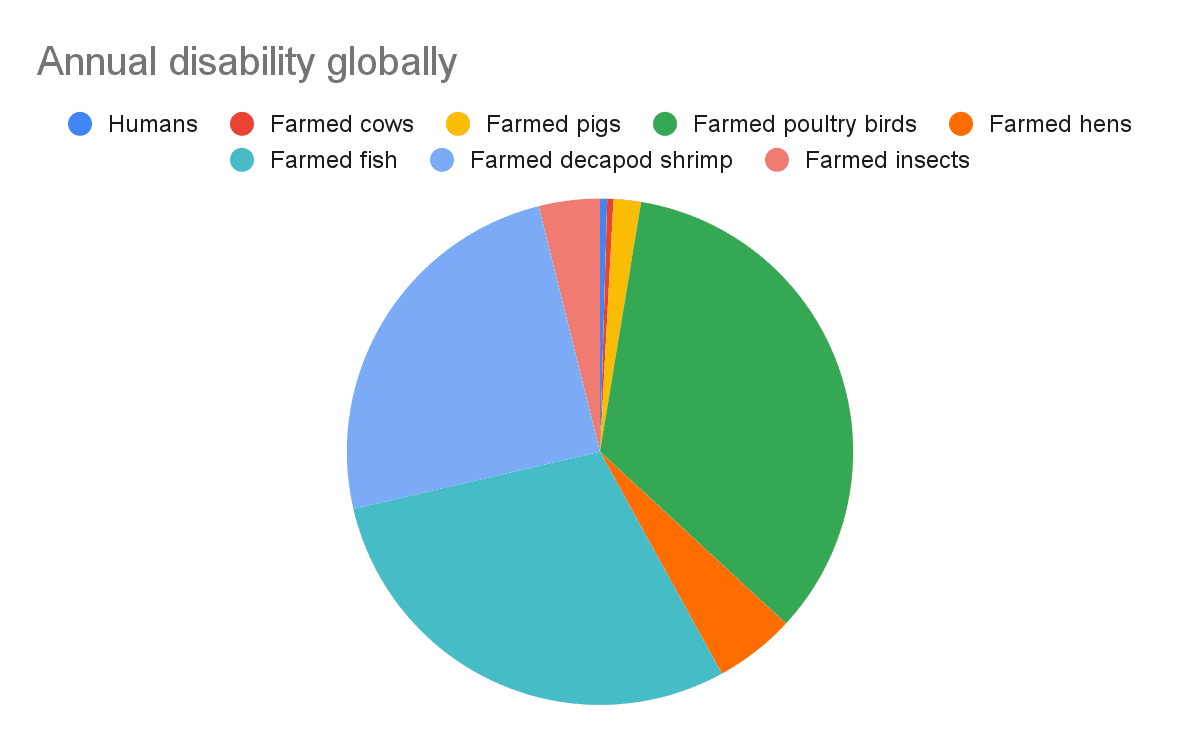
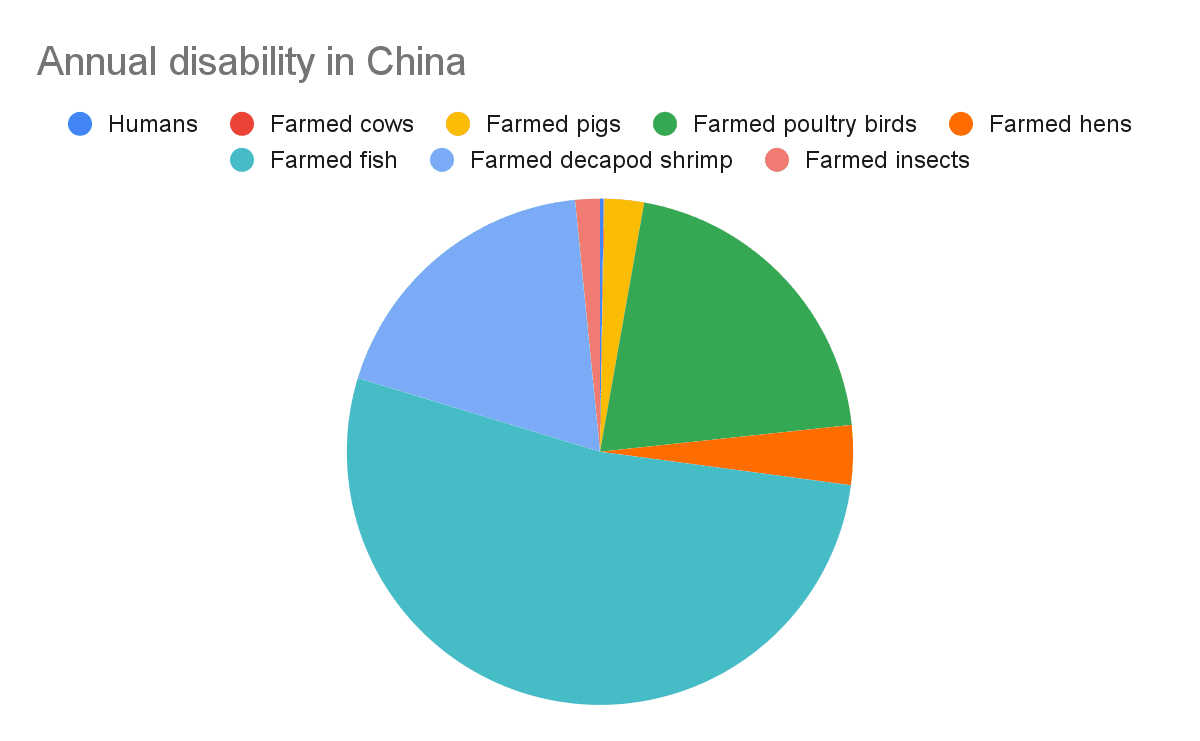
In this post, I estimate the annual disability of and philanthropic spending on humans and farmed animals, both globally and in China[1]. The data and calculations are in this Sheet.
Methods
I got the annual disability of each group of farmed animals multiplying its population by its disability per living time in (human) years lived with disability (YLD) per animal-year[2], which I calculated from (1 - “welfare per time as a fraction of that of a fully healthy human as a fraction of the welfare range (normalised welfare per time)”)*“welfare range”. For a normalised welfare per time equal to:
- 0, corresponding to a neutral life, the disabilty per living time is equal to the welfare range, which makes sense. By definition, a dying human has a disability per living time of 1 YLD/year (which is equal to the welfare range of humans of 1), and a welfare per time of 0.
- 1, respecting a fully healthy farmed animal, the disability per living time is 0, which checks out. By definition, a fully healthy human has a disability per living time of 0, and it is natural to extend this to farmed animals.
In agreement with the above, disability of farmed animals throughout this post refers to the potential for increasing their (affective) welfare up to the level of fully healthy animals. In contrast, the global burden of disease study (GBD) focuses on actual disability.
For simplicity, I did not consider years of life lost (YLL). I would have to figure out the life expectancy as a function of age for farmed animals living in ideal conditions, as GBD uses a reference life expectancy for ideal human conditions. A “reference life table, or theoretical minimum risk life table (TMRLT), is used in GBD to calculate years of life lost (YLLs) due to premature mortality. It was constructed based on the lowest observed age-specific mortality rates by location and sex across all estimation years from all locations with populations over 5 million in 2016”.
I used Rethink Priorities’ median welfare ranges. I relied on the value for pigs for cows, the mean between the values for carp and salmon for fish, and the value for black soldier flies for insects.
To find the normalised welfare per time of farmed poultry birds, hens and decapod shrimp, I assumed:
- The time that farmed broilers, hens and decapod shrimp on ongrowing farms experience each of the 4 pain categories defined by the Welfare Footprint Project (WFP). I also supposed all poultry birds are in a conventional scenario, and that hens are in conventional cages or cage-free aviaries, using data from WFP to find the respective fractions.
Excruciating pain is 1 k times as bad as disabling pain[3].
- Disabling pain is 100 times as bad as hurtful pain.
- Hurtful pain is 10 times as bad as annoying pain.
- Sleeping is morally neutral.
- For poultry birds, hens, decapod shrimp and humans, 8 h each day is spent sleeping, i.e. 1/3 (= 8/24) of the time.
- For poultry birds, hens and decapod shrimp, the welfare from positive experiences per time awake is the negative of that of hurtful pain.
- For humans, the welfare per time awake is the negative of that of hurtful pain.
I stipulated the normalised welfare per time of farmed:
- Cows is 0, i.e. that they have neutral lives.
- Fish, insects and pigs equals the mean between those of a broiler in a conventional scenario, a hen in a conventional cage, and a shrimp on an ongrowing farm.
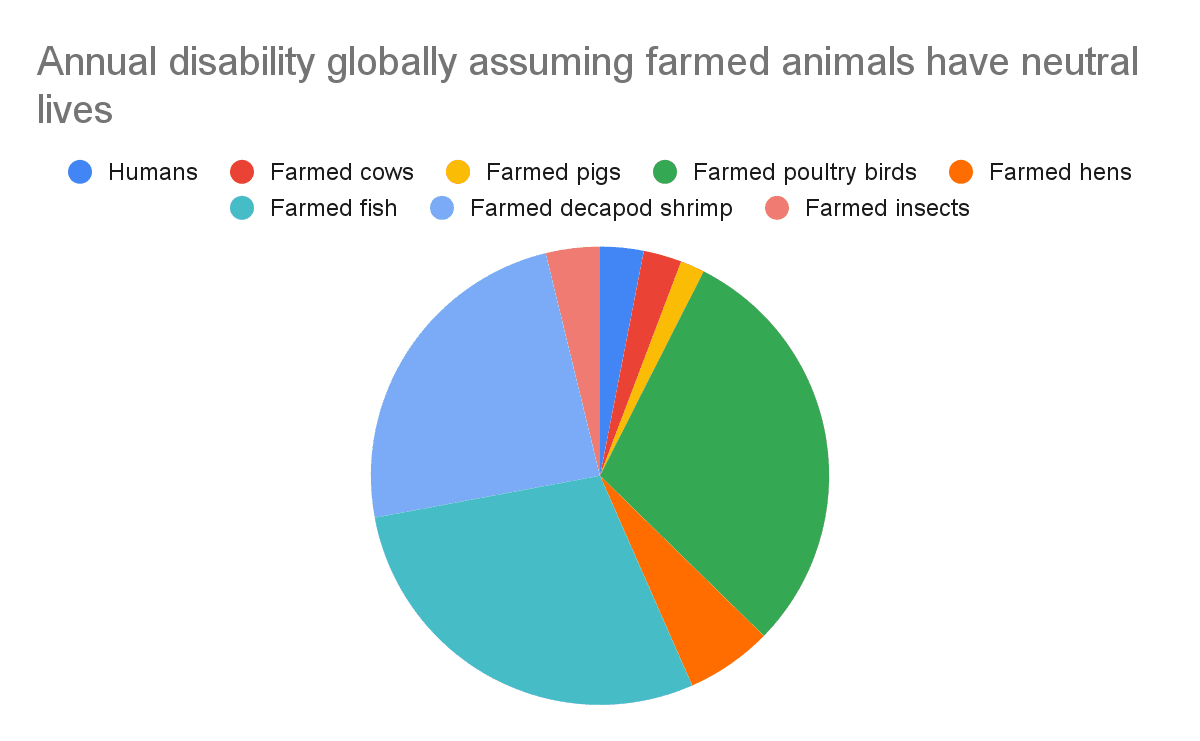
I also studied an arguably very optimistic case where all farmed animals have neutral lives. In this situation, the disability per living time in YLD/animal-year is simply equal to the welfare range (see 1st paragraph of this section), and I did not use any data from WFP.
I set the annual disability of humans to the value from GBD.
Results
Disability per living time
| Farmed animals | Disability per living time (YLD/year) |
| Cows | 0.515 |
| Pigs | 3.56 |
| Poultry birds | 2.57 |
| Hens in cages | 1.99 |
| Hens outside cages | 0.837 |
| Hens globally | 1.89 |
| Hens in China | 1.96 |
| Fish | 0.501 |
| Decapod shrimp | 0.214 |
| Insects | 0.0899 |
Annual disability
World
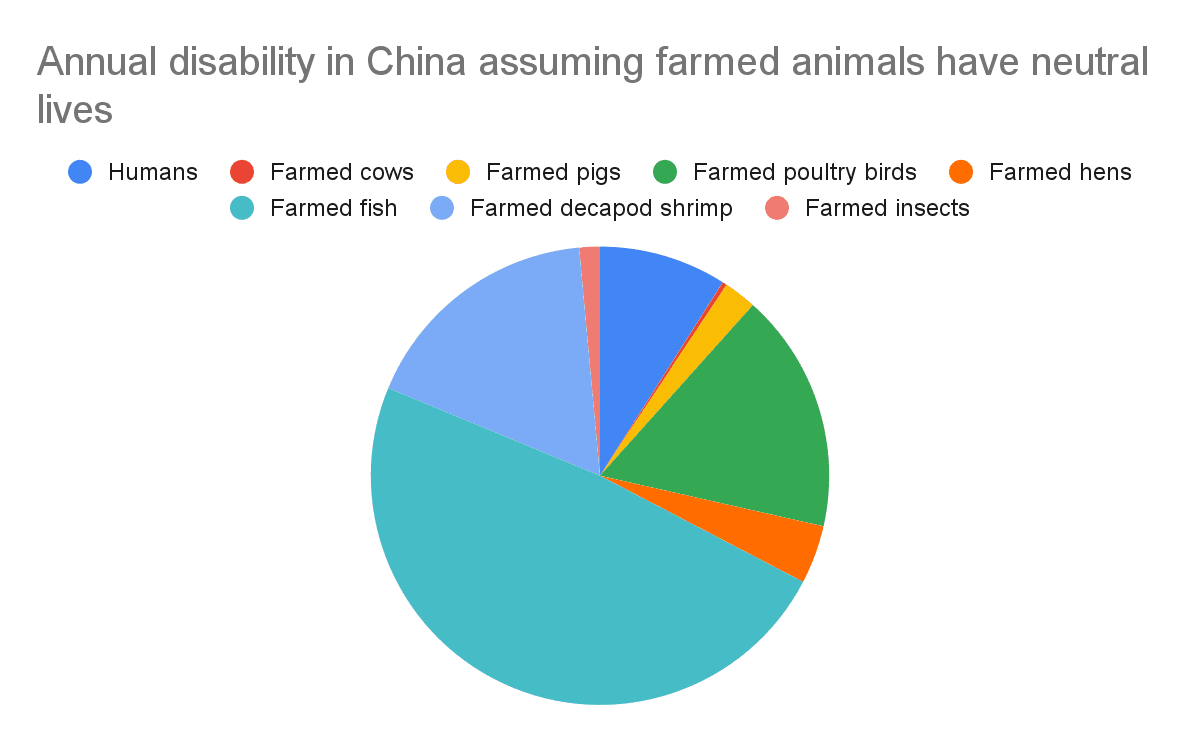
China
Annual philanthropic spending
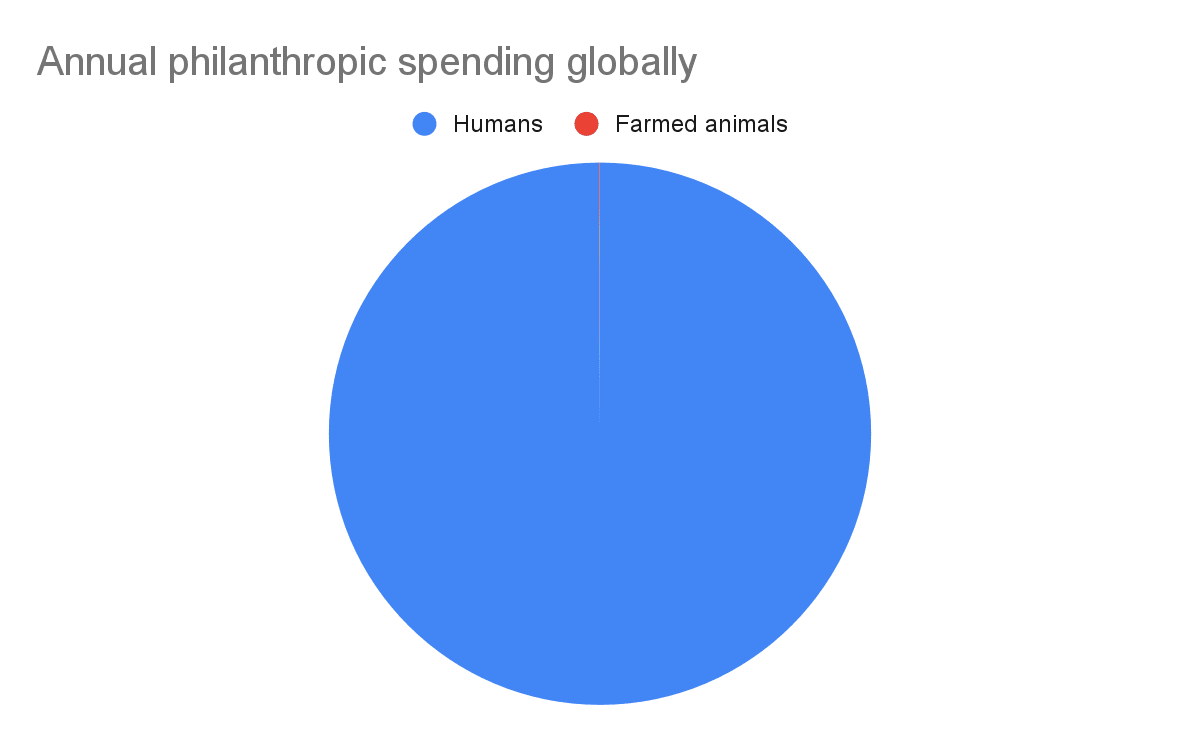
World
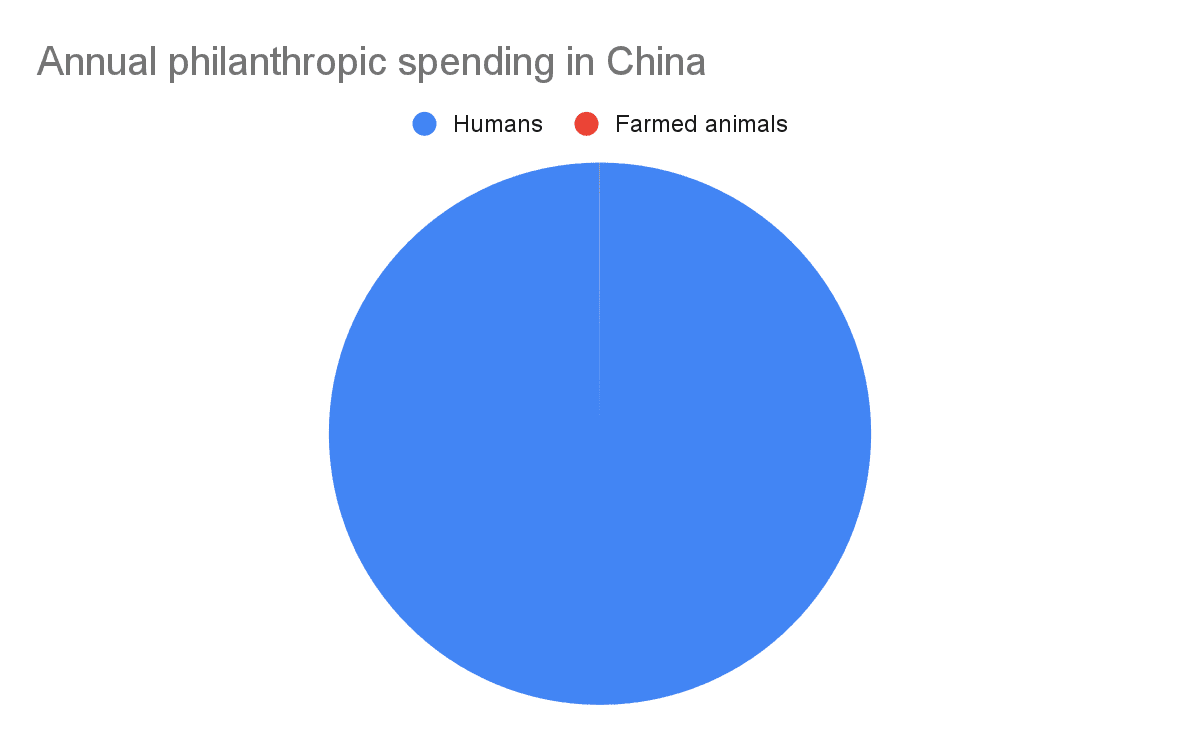
China
Discussion
I have not shown numbers above because what matters is cost-effectiveness, and they are not resilient, but I believe the following points are. In a nutshell, both globally and in China:
- Farmed cows and pigs (and other mammals) account for a tiny fraction of the disability of the farmed animals I analysed.
- The annual disability of farmed animals is much larger than that of humans, even under the arguably very optimistic assumption of all farmed animals having neutral lives.
- The annual funding helping farmed animals is much smaller than that helping humans.
Relatedly, readers may want to check ACE’s research on the geography of farmed animals and farmed animal advocacy funding.
Wild animals are also neglected relative to farmed animals:
- I Fermi estimated the annual suffering/happiness of wild animals is 10.6 M times the annual suffering of farmed animals.
- There is less spending on wild animal welfare than on farmed animal welfare.
On the other hand, wild animal welfare is less tractable. So the case for it being highly cost-effective relative to the best human interventions is not so clear.
Acknowledgements
The following names are ordered alphabetically. Thanks to Eleanor McAree (Animal Charity Evaluators) for pointing me to people who may know about funding for helping farmed animals in China. Thanks to Kieran Greig (Rethink Priorities) for pointing me to data on the philanthropic spending to help farmed animals in China. Thanks to Wayne Chang (Affinity Impact) for inviting me to do this analysis, and feedback on the draft and Sheet. Thanks to Zhilin Li (The Charity Box) for sharing data on the annual philanthropic spending in China, and to Zhonghao He for asking him about such data.
Call me a linearity-pilled likert-maxer, but this seems a bit wild. I’ve previously read the articles you linked to, and think it’s plausible that intense suffering can be way worse than we we’d be inclined to imagine, but don’t think it’s obvious by any means or that this necessarily implies the profound possibilities of suffering indicated here.
After some introspection, which seems near state of the art on this question, I’d guess a range of hedonic experience of -1000 to 100 where:
If I take your scale seriously (linearized below) and normalize hurtful pain to -5 (which would be more compatible with your assumptions), then I have to accept that my worst experienced suffering (which certainly felt like I was maxing out my psychological capacity for distress), was 0.12% of what’s possible. That strikes me as a bit odd. But hey, intuitions differ.
Thanks for the comment, Joel!
This implies adding 7.2 min (= 5/1000*24*60) of the worst conceivable experience to everyday of your life would make it neutral. Would you really be indifferent between living or not living a life like yours plus 7.2 min of e.g. being burned alive every single day? I have a strong intuition that adding a few minutes of torture to a random day of my life would make it a terrible day. I assume excruciating pain is 100 k times as bad as hurtful pain. This means 1.16 days (= 10^5/86400) of hurtful pain is as bad as 1 s of excruciating pain, which feels about right. It implies adding 1 s of excruciating pain everyday would make a random human life neutral, given my assumption that their welfare per time awake is the negative of that of hurtful pain.
In any case, the annual disability of farmed animals is much larger than that of humans even for much less variation in the various types of pain. Assuming hurtful pain is 10 times as bad as annoying pain, disabling pain is 10 times as bad as hurtful pain, and excruciating pain is 10 times as bad as disabling pain, such that excruciating pain is 1 k times as bad as annoying pain (instead of 1 M times as I supposed in the post):
Quick question on the intution pump about 7 minutes of the worst conceivable experience every day. Would you be aware that it happens after the fact? For me at least, a lot of what would make the randomly tortured day so terrible is how it affected the rest of my day, rather than the excruciating moments of pain themselves.
Thanks for the question, Kai! In my example, I was assuming 7 min of the worst conceivable experience were added on top of the baseline welfare, but you are right that the 7 min would affect the baseline welfare. It is hard to make the thought experiment realistic, because 7 min of the worst conceivable experience would likely lead to permanent effects or death. For reference, this is how WFP describes excruciating pain (the worst type of pain):
As further context, according to WFP, hens experience excruciating pain in mostly fatal situations.
The bar in purple ("acute peritonitis (fatal)") and thickest bar in red ("vent wound (fatal)") respect fatal situations[1].
The one in grey concerns "fractures (depop/transport)", and the one in orange "keel bone fractures".
Sounds about right. 10 minutes means bad life. 5 minutes means still life worth living.
Good to know. It mostly makes a difference for humans and cows coming from ~0 to ~5% of disability in your model it seems?
And I appreciate you continuing to bang the drum for animal welfare stuff. It's made me think about it more.
Then we just have very different intuitions.
Yes, mostly that. I did not rely on data from WFP to model the annual disability of humans and cows, so their annual disability remained the same. The annual disability of the other groups decreased because of the lower weight of extreme suffering. Below is a table with the original assumptions and the ones I mentioned in my last comment.
Humans0.489%3.14%Farmed cows0.430%2.77%Farmed pigs1.88%1.71%Farmed broilers (chickens)29.3%29.0%Farmed hens (chickens)5.52%6.73%Farmed fish31.6%28.7%Farmed decapod shrimp26.6%24.2%Farmed insects4.19%3.81%Thanks! I appreciate the support too.
Thanks for the post, I really appreciate the posts you make and the topics you tackle generally.
Thanks for the kind words, CB!
Thanks, Vasco, for doing this analysis! Here are some of my learnings:
I feel like the title should be more specific ? e.g. it should reference china, given the content of the post?
Thanks for the comment, Kaleem.
I think the 1st point holds for most countries (not only China), and the 2nd and 3rd for basically all countries. I could have a title like "Farmed animals are neglected, both globally and China". However, I think this could be read as farmed animal welfare being more neglected relative to its scale in China than in other countries. I believe this is true[1], but it is not necessarily implied by the points above.
I estimate China accounts for 33.3 % of the disability of farmed animals, but only 2.20 % of the philanthropic spending on farmed animals. I suppose one could argue these numbers are interesting, and the title could reflect them, but I am wary of communicating that more funding should to China without having looked into the respective cost-effectiveness (i.e. not only scale and neglectedness, but also tractability, which is arguably lower in China).
As a potential title, maybe "Disability among farmed animals is neglected relative to human disability"? or something like that
Thanks for the suggestion, Seth. I am a little wary of adding "disability" to the title, because I have not relied on actual disability of farmed animals:
This seems unnecessarily precise and long. I don't think many people would get a different takeaway from the current title but it has over twice as many words.
good post
Good comment ;).
Typo?
Thanks, Ryan! It was the other way around: