Hide table of contents

A recent post by Simon_M argued that StrongMinds should not be a top recommended charity (yet), and many people seemed to agree. While I think Simon raised several useful points regarding StrongMinds, he didn't engage with the cost-effectiveness analysis of StrongMinds that I conducted for the Happier Lives Institute (HLI) in 2021 and justified this decision on the following grounds: 

“Whilst I think they have some of the deepest analysis of StrongMinds, I am still confused by some of their methodology, it’s not clear to me what their relationship to StrongMinds is.”.

By failing to discuss HLI’s analysis, Simon’s post presented an incomplete and potentially misleading picture of the evidence base for StrongMinds. In addition, some of the comments seemed to call into question the independence of HLI’s research. I’m publishing this post to clarify the strength of the evidence for StrongMinds, HLI’s independence, and to acknowledge what we’ve learned from this discussion.

I raise concerns with several of Simon’s specific points in a comment on the original post. In the rest of this post, I’ll respond to four general questions raised by Simon’s post that were too long to include in my comment.  I briefly summarise the issues below and then discuss them in more detail in the rest of the post

1. Should StrongMinds be a top-rated charity? In my view, yes. Simon claims the conclusion is not warranted because StrongMinds’ specific evidence is weak and implies implausibly large results. I agree these results are overly optimistic, so my analysis doesn’t rely on StrongMind’s evidence alone. Instead, the analysis is based mainly on evidence synthesised from 39 RCTs of primarily group psychotherapy deployed in low-income countries. 

2. When should a charity be classed as “top-rated”? I think that a charity could be considered top-rated when there is strong general evidence OR charity-specific evidence that the intervention is more cost-effective than cash transfers. StrongMinds clears this bar, despite the uncertainties in the data. 

3. Is HLI an independent research institute? Yes. HLI’s mission is to find the most cost-effective giving opportunities to increase wellbeing. Our research has found that treating depression is very cost-effective, but we’re not committed to it as a matter of principle. Our work has just begun, and we plan to publish reports on lead regulation, pain relief, and immigration reform in the coming months. Our giving recommendations will follow the evidence.

4. What can HLI do better in the future? Communicate better and update our analyses. We didn’t explicitly discuss the implausibility of StrongMinds’ data in our work. Nor did we push StrongMinds to make more reasonable claims when we could have done so. We acknowledge that we could have done better, and we will try to do better in the future. We also plan to revise and update our analysis of StrongMinds before Giving Season 2023. 

1. Should StrongMinds be a top-rated charity?

I agree that StrongMinds’ claims of curing 90+% of depression are overly optimistic, and I don’t rely on them in my analysis. This figure mainly comes from StrongMinds’ pre-post data rather than a comparison between a treatment group and a control. These data will overstate the effect because depression scores tend to decline over time due to a natural recovery rate. If you monitored a group of depressed people and provided no treatment, some would recover anyway.

My analysis of StrongMinds is based on a meta-analysis of 39 RCTS of group psychotherapy in low-income countries. I didn’t rely solely on StrongMinds’ own evidence alone, I incorporated the broader evidence base from other similar interventions too. This strikes me, in a Bayesian sense, as the sensible thing to do. In the end, StrongMinds' controlled trials only make up 21% of the effect of the estimate (see Section 4 of the report for a discussion of the evidence base). It's possible to quibble with the appropriate weight of this evidence, but the key point is that it is much less than the 100% Simon seems to suggest.

2. When should a charity be classed as “top-rated”?

At HLI, we think the relevant factors for recommending a charity are:

(1) cost-effectiveness is substantially better than our chosen benchmark (GiveDirectly cash transfers); and

(2) strong evidence of effectiveness. 

I think Simon would agree with these factors, but we define “strong evidence” differently. 

I think Simon would define “strong evidence” as recent, high-quality, and charity-specific. If that’s the case, I think that’s too stringent. That standard would imply that GiveWell should not recommend bednets, deworming, or vitamin-A supplementation. Like us, GiveWell also relies on meta-analyses of the general evidence (not charity-specific data) to estimate the impact of malaria prevention (AMF, row 36) and vitamin-A supplementation (HKI, row 24) on mortality, and they use historical evidence for the impact of malaria prevention on income (AMF, row 109). Their deworming CEA infamously relies on a single RCT (DtW, row 7) of a programme quite different from the one deployed by the deworming charities they support. 

In an ideal world, all charities would have the same quality of evidence that GiveDirectly does (i.e., multiple, high-quality RCTs). In the world we live in, I think GiveWell’s approach is sensible: use high-quality, charity-specific evidence if you have it. Otherwise, look at a broad base of relevant evidence.

As a community, I think that we should put some weight on a recommendation if it fits the two standards I listed above, according to a plausible worldview (i.e., GiveWell’s moral weights or HLI’s subjective wellbeing approach). All that being said, we’re still developing our charity evaluation methodology, and I expect our views to evolve in the future. 

3. Is HLI an independent research institute?

In the original post, Simon said:

I’m going to leave aside discussing HLI here. Whilst I think they have some of the deepest analysis of StrongMinds, I am still confused by some of their methodology, it’s not clear to me what their relationship to StrongMinds is (emphasis added).

The implication, which others endorsed in the comments, seems to be that HLI’s analysis is biased because of a perceived relationship with StrongMinds or an entrenched commitment to mental health as a cause area which compromises the integrity of our research. While I don’t assume that Simon thinks we’ve been paid to reach these conclusions, I think the concern is that we’ve already decided what we think is true, and we aim to prove it.

To be clear, the Happier Lives Institute is an independent, non-profit research institute. We do not, and will not, take money from anyone we do or might recommend. Like every organisation in the effective altruism community, we’re trying to work out how to do the most good, guided by our beliefs and views about the world.

That said, I can see how this confusion may have arisen. We are advocating for a new approach (evaluating impact in terms of subjective wellbeing), we have been exploring a new cause area (mental health), and we currently only recommend one charity (StrongMinds). 

While this may seem suspicious to some, the reason is simple: we’re a new organisation that started with a single full-time researcher in 2020 and has only recently expanded to three researchers. We started by comparing psychotherapy to GiveWell’s top charities, but it’s not the limit of our ambitions. It just seemed like the most promising place to test our hypothesis that taking happiness seriously would indicate different priorities. We think StrongMinds is the best giving option, given our research to date, but we are actively looking for other charities that might be as good or better.

In the next few weeks, we will publish cause area exploration reports for reducing lead exposure, increasing immigration, and providing pain relief. We plan to continue looking for neglected causes and cost-effective interventions within and beyond mental health. 

4. What can HLI do better in the future?

There are a few things I think HLI could learn from and do better due to Simon’s post and the ensuing discussion around it. 

We didn’t explicitly discuss the implausibility of StrongMinds’ headline figures in our work, and, in retrospect, that was an error. We should also have raised these concerns with StrongMinds and asked them to clarify what causal evidence they are relying on. We have done this now and will provide them with more guidance on how they can improve their evidence base and communicate more clearly about their impact.

I also think we can do better at highlighting our key uncertainties, the quality of the evidence we are using in our analysis, and pointing out the places where different priors would lead a reader to update less on our analysis. 

Furthermore, I think we can improve how we present our research regarding the cost-effectiveness of psychotherapy and StrongMinds in particular. This is something that we were already considering, but after this giving season, I’ve realised that there are some consistent sources of confusion we need to address. 

Despite the limitations of their charity-specific data, we still think StrongMinds should be top-rated. It is the most cost-effective, evidence-backed organisation we’ve assessed so far, even when we compare it to some very plausible alternatives that are currently considered top-rated. That being said, we’ve learned a lot since we published our StrongMinds report in 2021, and there is room for improvement. This year, we plan to update our meta-analysis and cost-effectiveness analysis of psychotherapy and StrongMinds with new evidence and more robustness checks for Giving Season 2023. 

If you think there are other ways we can improve, then please respond to our annual impact survey which closes at 8 am GMT on Monday 30 January. We look forward to refining our approach in response to valuable, constructive feedback. 

Comments54
Sorted by Click to highlight new comments since: Today at 4:42 AM

Here’s my attempt to summarise some of the discussion that Ryan Briggs and Gregory Lewis instigated in the comments of this post, and the analyses it prompted on my end – as requested by Jason [Should I add this to the original post?]. I would particularly like to thank Gregory for his work replicating my analyses and raising several painful but important questions for my analysis. I found the dialogue here very useful, thought provoking, and civil -- I really want to thank everyone for making the next version of this analysis better. 


Summary

  • The HLI analysis of the cost-effectiveness of StrongMinds relies not on a single study, but on a meta-analysis of multiple studies.
  • Regarding this meta-analysis, some commenters (Ryan Briggs and Gregory Lewis) pointed out our lack of a forest plot and funnel plot, a common feature of meta-analyses.
  • Including a forest plot shows some outlier studies with unusually large effects, and a wide variance in the effects between studies (high heterogeneity).
  • Including a funnel plot shows evidence that there may be publication bias. Comparing this funnel plot to the one for cash transfers makes the diagnosis of publication bias appear worse in psychotherapy than cash transfers.
  • My previous analysis employed an ad-hoc and non-standard method for correcting for publication bias. It suggested a smaller (15%) downward correction to psychotherapy’s effects than what some commenters (Ryan and Gregory) thought that a more standard approach would imply (50%+).
  • Point taken, I tried to throw the book at my own analysis to see if it survived. Somewhat to my surprise, it seemed relatively unscathed.  
    • After applying the six standard publication bias correction methods to both the cash transfer and psychotherapy datasets in 42 different analyses, I found that, surprisingly:
    • About half the tests increase the effectiveness of psychotherapy relative to cash transfers, and the average test suggests no adjustment.
    • Only four tests show a decrease in the cost-effectiveness ratio of psychotherapy to cash transfers below of 9.4x → 7x.
    • The largest reduction of psychotherapy relative to cash transfers is from 9.4x to 3.1x as cost-effective as GiveDirectly cash transfers. It’s based on the older correction method; Trim and Fill.
  • I have several takeaways.
    • I didn’t expect this behaviour from these tests. I’m not sure how I should update on using them in the future. I assume the likeliest issue is that they are unreliable in the conditions of these meta-analyses (high heterogeneity). Any thoughts on how to correct for publication bias in future analyses is welcome!
    • Given the ambivalent results, it doesn't seem like any action is urgently needed (i.e., immediately pause the StrongMinds recommendation).
    • However, this discussion has raised my sense of the priority of doing the re-analysis of psychotherapy and inspired me to do quite a few things differently next time. I hope to start working on this soon (but I don’t want to promise dates).
    • I’m not saying “look, everything is fine!”.I should have investigated publication bias more thoroughly in the original analysis. The fact that after I’ve done that now and it doesn’t appear to suggest substantial changes to my analysis is probably more due to luck than a nose for corners I can safely cut.


1. The story so far

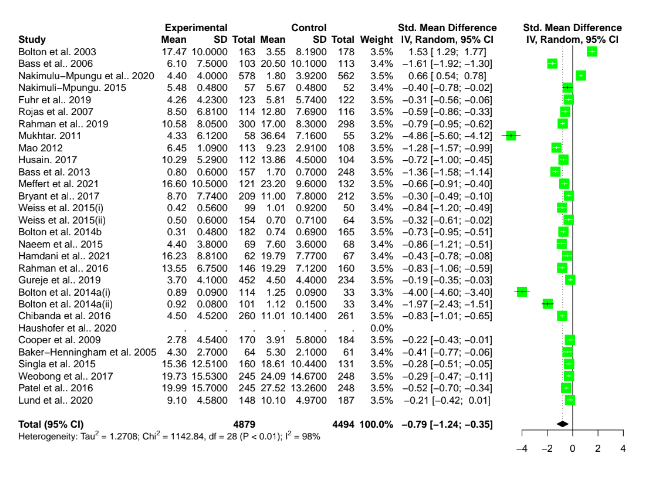
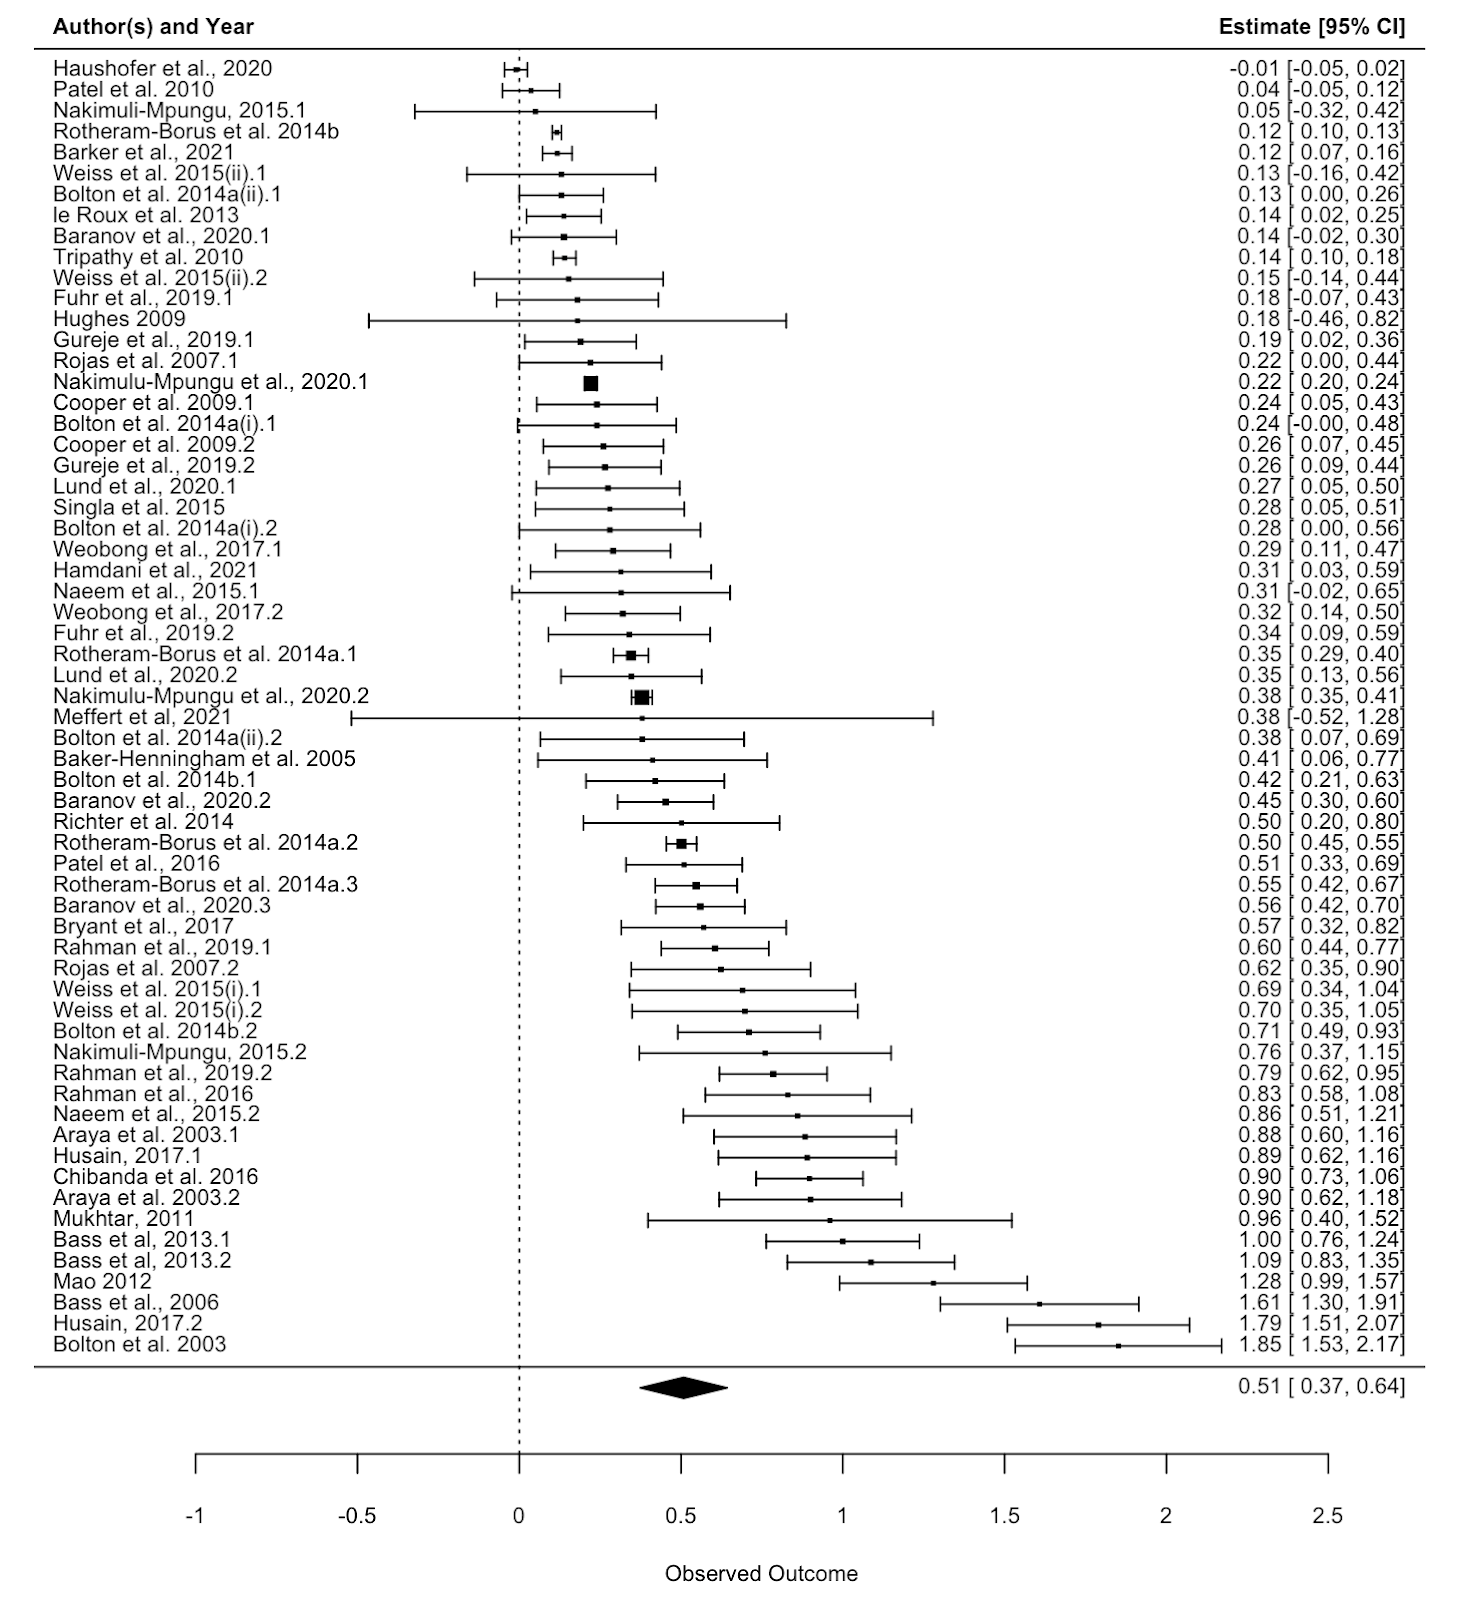
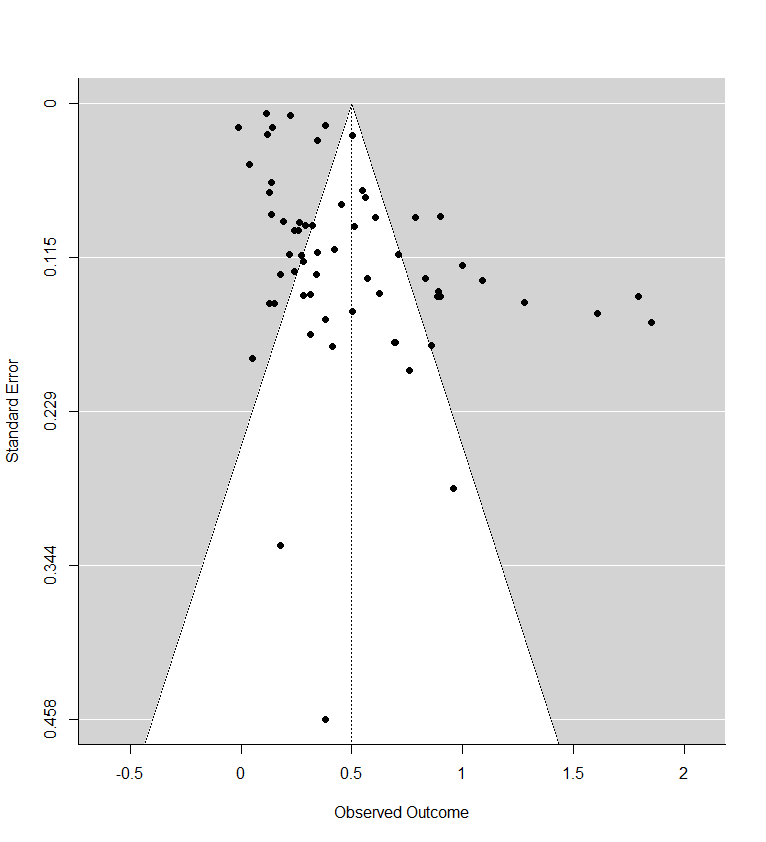
In the comments, Ryan Briggs and Gregory Lewis have pointed out that my meta-analysis of psychotherapy omits several typical and easy to produce figures. These are forest plots and funnel plots. A forest plot shows the individual study effects and the study effects. If I included this, it would have shown two things.

First, that there is quite a bit of variation in the effects between studies (i.e., heterogeneity). What heterogeneity implies is a bit controversial in meta-analyses, and I’ll return to this, but for now I’ll note that some take the presence of high heterogeneity as an indication that meta-analytic results are meaningless. At the other end of professional opinion, other experts think that high heterogeneity is often inevitable and merely warrants prudence. However, even the most permissive towards heterogeneity think that it makes an analysis more complicated.  

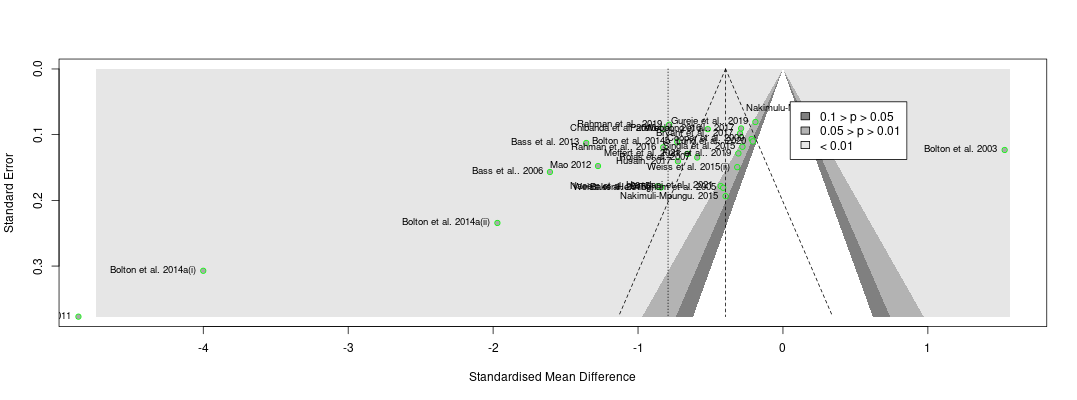
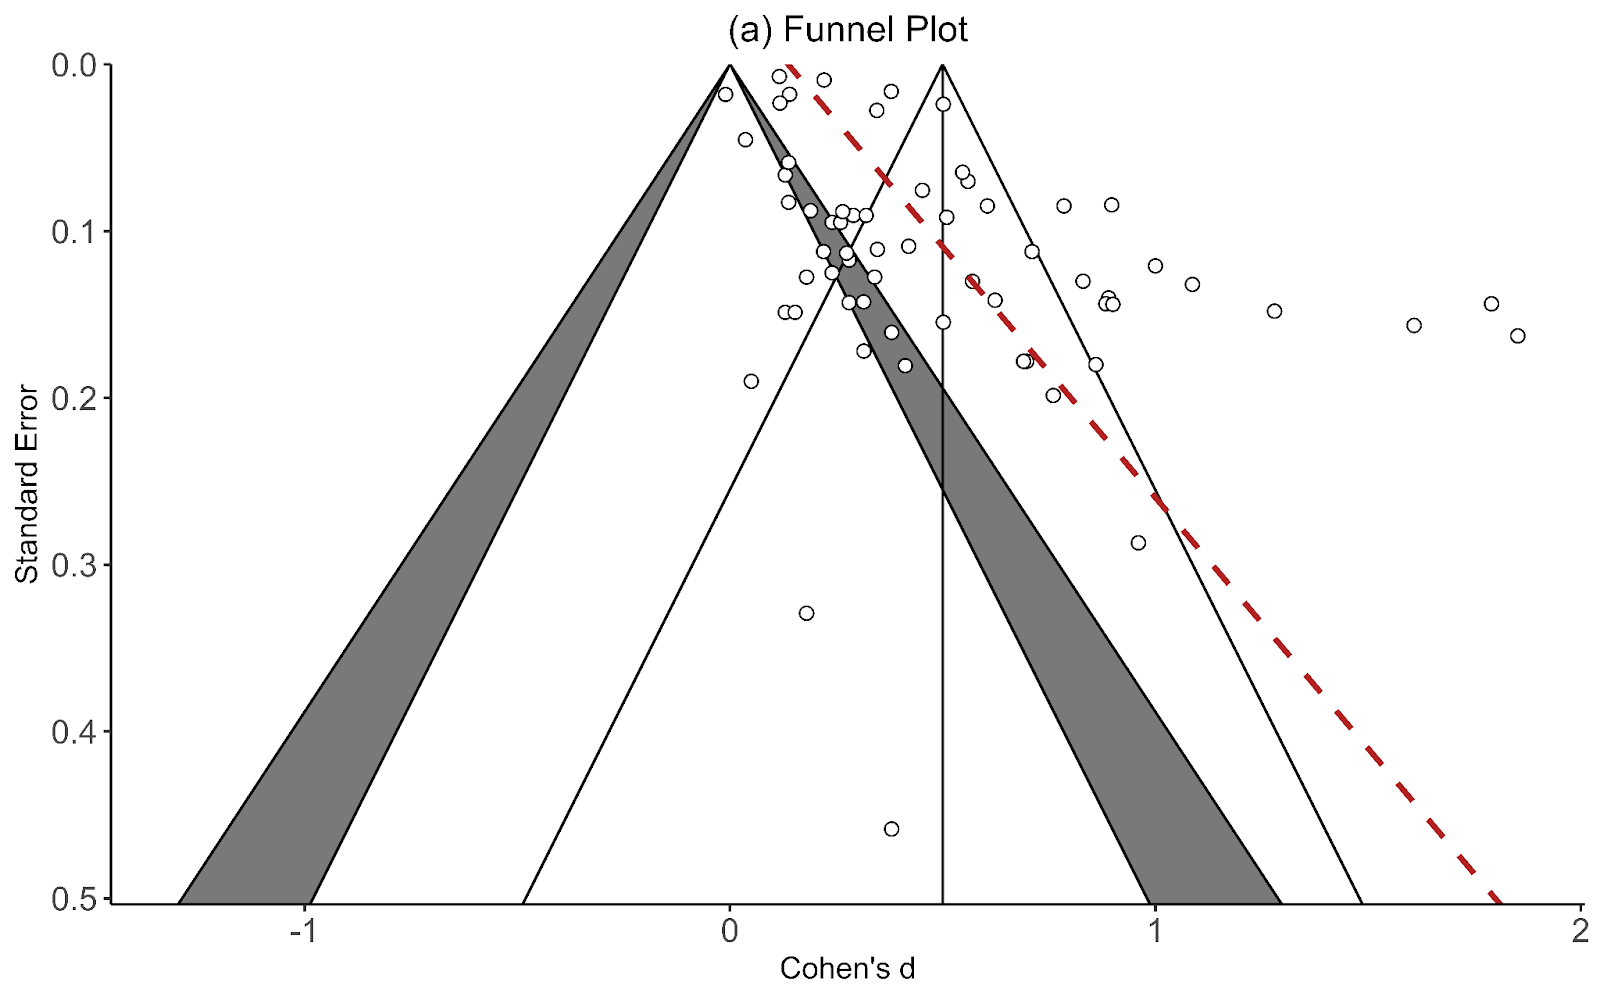
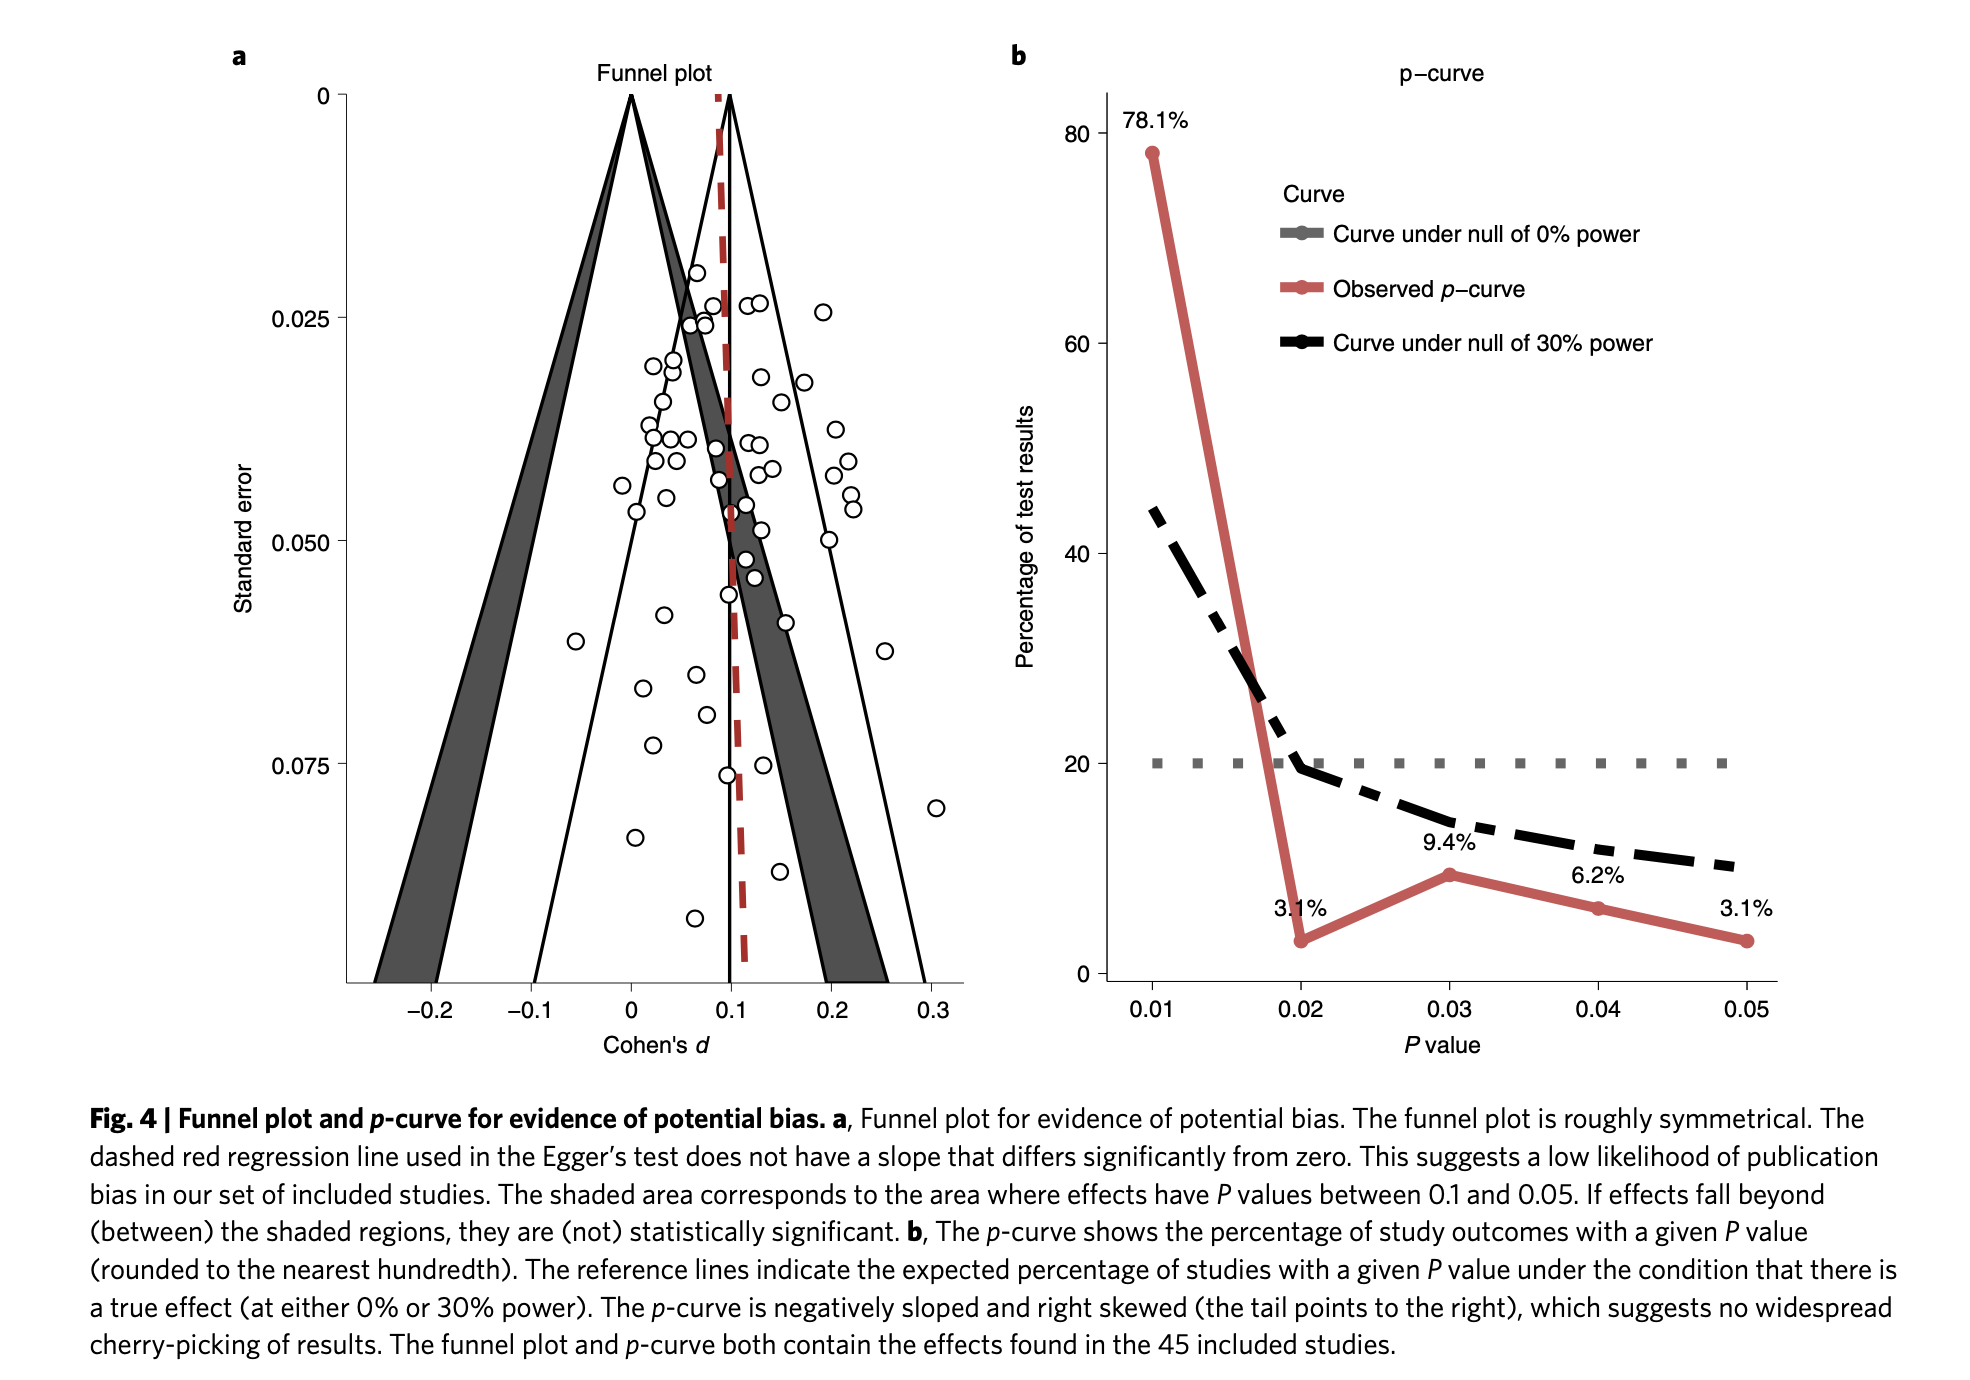
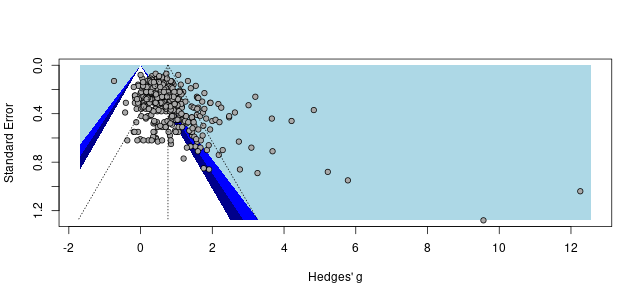
The second thing the forest plot shows is that there were a few considerable outliers. Notably, some of these outliers (Bolton et al., 2003; Bass et al., 2006) are part of the evidence I used to estimate that StrongMinds is more cost-effective than the typical psychotherapy intervention in LMICs. The other figure I omitted was a funnel plot. Funnel plots are made to show if there are many more small studies that find large effects than small with small, null or negative effects than we would expect due to a random draw. In the funnel plots for the psychotherapy data, which Gregory first provided by using a version of the the data I use, he rightly pointed out that there is considerable asymmetry, which suggests that there may be publication bias (i.e., the small sized studies that find small, null, or negative effects are less likely to be published and included than small studies with larger effects). This finding seemed all the more concerning given that I found pretty much no asymmetry in the cash transfers data I compare psychotherapy to.

I supplemented this with a newer illustration, the p-curve, meant to detect publication bias that’s not just about the size of an effect, but its precision. The p-curve suggests publication bias if there’s an uptick in the number of effect sizes near the 0.05 significance level relative to the 0.03 or 0.04 level. The idea is that researchers are inclined to fiddle with their specifications until they are significant, but that they’re limited in their ambitions to perform questionable research practices and will tend to push them just over the line. The p-curve for psychotherapy shows a slight uptick near the 0.05 level, compared to none in cash transfers. This is another sign that the psychotherapy evidence base appears to have more publication bias than cash transfers.

Ryan and Gregory rightly pushed me on this – as I didn’t show these figures that make psychotherapy look bad. I have excuses, but they aren’t very good so I won’t repeat them here. I think it’s fair to say that these could have and should have been included.

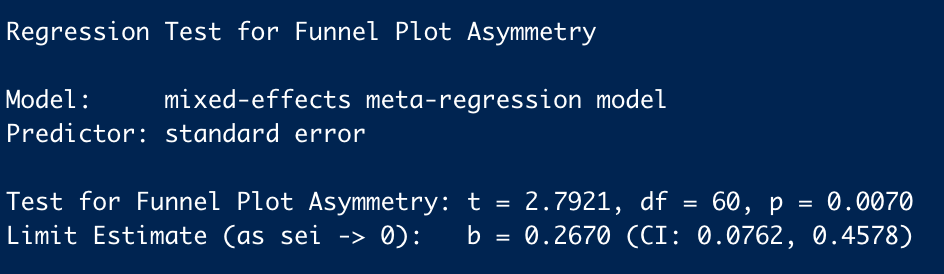
The next, and most concerning point that Ryan and Gregory made was that if we take the Egger regression test seriously (a formal, less eye-bally way of testing for funnel plot asymmetry), it’d indicate that psychotherapy’s effect size should be dramatically reduced[1]. This frankly alarmed me. If this was true, I potentially made a large mistake [2].


2. Does correcting for publication bias substantially change our results?

To investigate this I decided to look into the issue of correcting for publication bias in more depth. To do so I heavily relied upon Harrer et al. (2021), a textbook for doing meta-analyses in R.

My idea for investigating this issue would be to go through every method for correcting publication bias mentioned in Harrer et al. (2021) and show how these methods change the cash transfers to psychotherapy comparison. I thought this would be more reasonable than trying to figure out which one was the method to rule them all. This is also in line with the recommendations of the textbook “No publication bias method consistently outperforms all the others. It is therefore advisable to always apply several techniques…” For those interested in an explanation of the methods, I found Harrer et al. (2021) to be unusually accessible. I don’t expect I’ll do better.  

One issue is that these standard approaches don’t seem readily applicable to the models we used. Our models are unusual in that they are 1. Meta-regressions, where we try to explain the variation in effect sizes using study characteristics like time since the intervention ended, and 2. Multi-level meta-analyses that attempt to control for the dependency introduced by adding multiple timepoints or outcomes from a single study. It doesn’t seem like you can easily plug these models into the standard publication bias methods. Because of this uncertainty we tried to run several different types of analyses (see details in 2.1) based on whether a model included the full data or excluded outliers or follow-ups or used a fixed or random effects estimator[3]

I ran (with the help of my colleague Samuel[4]) the corrections for both psychotherapy and cash transfers and then apply the percentage of correction to their cost-effectiveness comparison. It doesn’t seem principled to only run these corrections on psychotherapy. Even though the problem seems worse in psychotherapy, I think the appropriate thing to do is also run these corrections on the cash transfers evidence and see if the correction is greater for psychotherapy.

If you want to go straight to the raw results, I collected them in a spreadsheet that I hope is easy to understand. Finally, if you’re keen on replicating this analysis, we’ve posted the code we used here.

2.1 Model versions

Measures of heterogeneity and publication bias seem to be designed for simpler meta-analysis models than those we use in our analysis. We use a meta-regression with follow-up time (and sometimes dosage), so the estimate of the intercept is affected by the coefficients for time and other variables. Reading through Harrer et al. (2021) and a brief google search didn’t give us much insight as to whether these methods could easily apply to a meta-regression model. Furthermore, most techniques presented by Harrer et al. (2021) used a simple meta-analysis model which employed a different set of R functions (metagen rather than the rma.uni or rma.mv models we use).

Instead, we create a simple meta-analysis model to calculate the intercept for psychotherapy and for cash. We then apply the publication bias corrections to these models and get the % change this created. We then apply the % change of the correction to the effect for psychotherapy and cash and obtain their new cost-effectiveness ratio.

Hence, we are not using the model we directly use in our analysis, but we apply to our analysis the change in effectiveness that the correction method would produce on a model appropriate for said correction method.

Because of our uncertainty, we ran several different types of analyses based on whether a model included the full data[5] or excluded outliers[6] or follow-ups[7] or used a fixed or random effects estimator[8].

2.2 Results

The results of this investigation are shown below. Tests that are to the left of the vertical line represent decreases in the cost-effectiveness of psychotherapy relative to cash transfers. The reference models are the six right on the line (in turquoise).  I’ll add further commentary below.

Details of the results can be seen in this spreadsheet. We removed tests 28, 29, 30, 34, 35, 36. These were generally favourable to psychotherapy. We removed them because they were p-curve and Rücker’s limit corrections models that we specified as fixed-effects models but they seemed to force the models into random-effects models, making their addition seem inappropriate[9].


Surprisingly, when we apply these tests, very few dramatically reduce the cost-effectiveness of psychotherapy compared to cash transfers, as indicated by changes to their intercepts / the estimated average overall effect.

  • Only four tests show a decrease below 7x for PT.
  • The largest correction (using Trim and Fill) reduces PT <> CT from 9.4x to 3.1x as cost-effective as GiveDirectly cash transfers.
  • Aside: Given that this appears to be the worst case scenario, I’m not actually sure this would mean we drop our recommendation given that we haven’t found anything clearly better yet (see our analyses of anti-malarial bednets and deworming). I think it’s likelier that we would end up recommending anti-malaria bed nets to those with sympathetic philosophical views.
  • The trim and fill and selection models are the ones most consistently negative to PT.
  • The worst models for PT are trim and fill, and selection models. But the trim and fill models are the oldest (most outdated?) models that seem to be the least recommended (Harrer et al., (2021) says they are “often outperformed by other methods”). The PET and PEESE models tend to actually make psychotherapy look even better compared to cash transfers.
  • Surprisingly, many tests increase the cost-effectiveness ratio in favour of psychotherapy!


2.3 Uncertainties

  • A big problem is that most of these tests are sensitive to heterogeneity, so we’re left with a relatively high level of uncertainty in interpreting these results. Are differences between the minimal or most negative update due to the heterogeneity? I’m not sure.
    • This should partially be alleviated by adding in the tests with the outliers removed, but while this reduces heterogeneity a bit (PT I^2: 95% → 56%, CT I^2: 75% → 25%), it’s still relatively high.
    • Further, the largest downwards adjustment that involves removing outliers is from 9.4x → 7.5x.
  • It’s unclear if these publication bias adjustments would differentially affect estimates for the decay rate of the benefit. Our analysis was about the average effect (i.e., the intercept). It’s unclear how publication bias should affect the estimate of the decay rate of psychotherapy (or cash).


2.4 A note about heterogeneity

Sometimes it’s suggested that the high heterogeneity in a meta-analysis means it is impossible to interpret (see details of heterogeneity in my analyses in this spreadsheet). Whilst heterogeneity is important to report and discuss, we don’t think it disqualifies this analysis.

However, high levels of heterogeneity appear to be a common problem with meta-analyses. It’s unclear that this is uniquely a problem with our meta-analysis of psychotherapy. In their big meta-analysis of psychotherapy, Cuijpers et al. (2023; see Table 2) also have high levels of heterogeneity. Our cash transfer meta-analysis also has high (albeit lower than psychotherapy) levels of heterogeneity. 

High heterogeneity would be very problematic if it meant the studies are so different they are not measuring the same thing. Alternative explanations are that (1) psychotherapy is a phenomenon with high variance (supported by similar findings of psychotherapy in HICs), and/or (2) studies about psychotherapy in LMICs are few and implemented in different ways, so we expect this data is going to be messy.


3. Next Steps

  • 4 tests suggest psychotherapy is 3-7x cash, 8 tests suggest psychotherapy is 7-9.4x cash, and 18 tests suggest psychotherapy is 9.4 or more times cash.  Because of the ambiguous nature of the results, I don’t plan on doing anything immediately like suggesting we pause the StrongMinds recommendation.
  • However, this analysis and the surrounding discussion has updated me on the importance of updating and expanding the psychotherapy meta-analysis sooner. Here are some things I’d like to commit to:
    • Do a systematic search and include all relevant studies, not just a convenience sample.
    • Heavily consider including a stricter inclusion criteria. And if we don’t perform more subset analyses and communicate them more clearly.
    • Include more analyses that include dosage (how many hours in session) and expertise of the person delivering the therapy.
    • Include better data about the control group, paying special attention to whether the control group could be considered as receiving a high, low quality, or no placebo.
    • In general, include and present many more robustness checks.
    • Add an analogous investigation of publication bias like the one performed here.
    • Make our data freely available and our analysis easily replicable at the time of publication.
    • Am I missing anything?
  • After updating the psychotherapy meta-analysis we will see how it changes our StrongMinds analysis. 
    • I’ve also expected to make a couple changes to that analysis[10], hopefully incorporating the new Baird et al. RCT. Note if it comes soon and its result strongly diverge from our estimates this could also expedite our re-analysis. 
  1. ^

     Note that the Egger regression is a diagnostic test, not a form of correction. However, the PET and PEESE methods are correction methods and are quite similar in structure to the Egger regression test.

  2. ^

    Point taken that the omission is arguably,  a non-trivial mistake. 

  3. ^

     Choosing a fixed or random effects model is another important and controversial question in modelling meta-analysis and we wanted to test whether the publication bias corrections were particularly sensitive to it. However, it seems like our data is not suitable to the assumptions of a fixed effects model – and this isn’t uncommon. As Harrer et al., (2021) say: “In many fields, including medicine and the social sciences, it is therefore conventional to always use a random-effects model, since some degree of between-study heterogeneity can virtually always be anticipated. A fixed-effect model may only be used when we could not detect any between-study heterogeneity (we will discuss how this is done in Chapter 5) and when we have very good reasons to assume that the true effect is fixed. This may be the case when, for example, only exact replications of a study are considered, or when we meta-analyze subsets of one big study. Needless to say, this is seldom the case, and applications of the fixed-effect model “in the wild'' are rather rare.”

  4. ^

     If my analyses are better in the future, it's because of my colleague Samuel Dupret. Look at the increase in quality between the first cash transfer and psychotherapy reports and the household spillover report. That was months apart. You know what changed? Sam.

  5. ^

     The same data we use in our full models.

  6. ^

     Some methods are not robust to high levels of heterogeneity, which is more often present when there are outliers. We select outliers for the fixed and random effects models based on “‘non-overlapping confidence intervals’ approach, in which a study is defined as an outlier when the 95% confidence interval (CI) of the effect size does not overlap with the 95% CI of the pooled effect size” (Cuijpers et al., 2023; see Harrer et al., 2021 for a more detailed explanation).

  7. ^

     We are concerned that these methods are not made with the assumption of a meta-regression and might react excessively to the follow-up data (i.e., effect sizes other than the earliest effect size collected in a study), which are generally smaller effects (because of decay) with smaller sample sizes (because of attrition).

  8. ^

     Choosing a fixed or random effects model is another important and controversial question in modelling meta-analysis and we wanted to test whether the publication bias corrections were particularly sensitive to it. However, it seems like our data is not suitable to the assumptions of a fixed effects model – and this isn’t uncommon. As Harrer et al., (2021) say: “In many fields, including medicine and the social sciences, it is therefore conventional to always use a random-effects model, since some degree of between-study heterogeneity can virtually always be anticipated. A fixed-effect model may only be used when we could not detect any between-study heterogeneity (we will discuss how this is done in Chapter 5) and when we have very good reasons to assume that the true effect is fixed. This may be the case when, for example, only exact replications of a study are considered, or when we meta-analyze subsets of one big study. Needless to say, this is seldom the case, and applications of the fixed-effect model “in the wild'' are rather rare.”

  9. ^

     The only tests that are different from the random effects ones are 32 and 38 because the list of outliers were different for fixed effects and random effects.

  10. ^

     I expect to assign relatively lower weight to the StrongMinds specific evidence. I was leaning this direction since the summer, but these conversations -- particularly the push from Simon, hardened my views on this. This change would decrease the cost-effectiveness of StrongMinds. Ideally, I’d like to approach the aggregation of the StrongMinds specific and general evidence of lay-group psychotherapy in LMICs in a more formally Bayesian manner, but this would come with many technical difficulties. I will also look into the counterfactual impact of their scaling strategy where they instruct other groups in how to provide group psychotherapy. 

Thanks for this, Joel. I look forward to reviewing the analysis more fully over the weekend, but I have three major concerns with what you have presented here.

1. A lot of these publication bias results look like nonsense to the naked eye.

Recall the two funnel plots for PT and CT (respectively):

I think we're all seeing the same important differences: the PT plot has markers of publication bias (asymmetry) and P hacking (clustering at the P<0.05 contour, also the p curve) visible to the naked eye; the CT studies do not really show this at all. So heuristically, we should expect statistical correction for small study effects to result in:

  1. In absolute terms, the effect size for PT should be adjusted downwards
  2. In comparative terms, the effect size for PT should be adjusted downwards more than the CT effect size.

If a statistical correction does the opposite of these things, I think we should say its results are not just 'surprising' but 'unbelievable': it just cannot be true that, given the data we see being fed into the method it should lead us to conclude this CT literature is more prone to small-study effects than this PT one; nor (contra the regression slope in the first plot), the effect size for PT should be corrected upwards.

Yet many of the statistical corrections you have done tend to fail one or both of these basically-diagnostic tests of face validity. Across all the different corrections for PT, on average the result is a 30% increase in PT effect size (only trim and fill and selection methods give families of results where the PT effect size is reduced). Although (mostly) redundant, these are also the only methods which give a larger drop to PT than CT effect size.

As comments everywhere on this post have indicated, heterogeneity is tricky. If (generally) different methods all gave discounts, but they were relatively small (with the exception of one method like a Trim and Fill which gave a much steeper one), I think the conclusions you drew above would be reasonable. However, for these results, the ones that don't make qualitative sense should be discarded, and the the key upshot should be: "Although a lot of statistical corrections give bizarre results, the ones which do make sense also tend to show significant discounts to the PT effect size".


2. The comparisons made (and the order of operations to get to them) are misleading

What is interesting though, is although in % changes correction methods tend to give an increase to PT effect size, the effect sizes themselves tend to be lower: the average effect size across analyses is 0.36, ~30% lower than the pooled estimate of 0.5 in the funnel plot (in contrast, this is 0.09 - versus 0.1, for CT effect size).

This is the case because the % changes are being measured, not against the single reference value of 0.5 in the original model, but the equivalent model in terms of random/fixed, outliers/not, etc. but without any statistical correction technique. For example: row 13 (Model 10) is Trim-and-Fill correction for a fixed effect model using the full data. For PT, this effect size is 0.19. The % difference is calculated versus row 7 (Model 4), a fixed effect model without Trim-and-Fill (effect = 0.2) not the original random effects analysis (effect = 0.5). Thus the % of reference effect is 95% not 40%. In general, comparing effect sizes to row 4 (Model ID 1) generally gets more sensible findings, and also generally more adverse ones. re. PT pub bias correction:

In terms of (e.g.) assessing the impact of Trim and Fill in particular, it makes sense to compare like with like. Yet presumably what we care about to ballparking the estimate of publication bias in general - and for the comparisons made in the spreadsheet mislead. Fixed effect models (ditto outlier exclusion, but maybe not follow-ups) are already an (~improvised) means of correcting for small study effects, as they weigh them in the pooled estimate much less than random effects models. So noting Trim-and-Fill only gives a 5% additional correction in this case buries the lede: you already halved the effect by moving to a fixed effect model from a random effect model, and the most plausible explanation why fixed effect modelling limits distortion by small study effects.

This goes some way to explaining the odd findings for statistical correction above: similar to collider/collinearity issues in regression, you might get weird answers of the impact of statistical techniques when you are already partly 'controlling for' small study effects. The easiest example of this is combining outlier removal with trim and fill - the outlier removal is basically doing the 'trim' part already. 

It also indicates an important point your summary misses. One of the key stories in this data is: "Generally speaking, when you start using techniques - alone or in combination - which reduce the impact of publication bias, you cut around 30% of the effect size on average for PT (versus 10%-ish for CT)".  


3. Cost effectiveness calculation, again

'Cost effectiveness versus CT' is a unhelpful measure to use when presenting these results: we would first like to get a handle on the size of the small study effect in the overall literature, and then see what ramifications it has for the assessment and recommendations of strongminds in particular. Another issue is these results doesn't really join up with the earlier cost effectiveness assessment in ways which complicate interpretation. Two examples:

  1. On the guestimate, setting the meta-regressions to zero effect still results in ~7x multiples for Strongminds versus cash transfers. This spreadsheet does a flat percentage of the original 9.4x bottom line (so a '0% of previous effect' correction does get the multiple down to zero). Being able to get results which give <7x CT overall is much more sensible than what the HLI CEA does, but such results could not be produced if we corrected the effect sizes and plugged them back into the original CEA. 
  2. Besides results being incongruous, the methods look incongruous too. The outliers being excluded in some analyses include strong-minds related papers later used in the overall CE calculation to get to the 9.4 figure. Ironically, exclusion would have been the right thing to do originally, as including the papers help derive the pooled estimate and then again as independent inputs into the CEA double counts them. Alas two wrongs do not make a right: excluding them in virtue of outlier effects seems to imply either: i) these papers should be discounted generally (so shouldn't be given independent weight in the CEA); ii) they are legit, but are such outliers the meta-analysis is actually uninformative to assess the effect of the particular interventions they investigate.

More important than this, though, is the 'percentage of what?' issue crops up again: the spreadsheet uses relative percentage change to get a relative discount vs. CT, but it uses the wrong comparator to calculate the percentages. 

Lets look at row 13 again, where we are conducting a fixed effects analysis with trim-and-fill correction. Now we want to compare PT and CT: does PT get discounted more than CT? As mentioned before, for PT, the original random effects model gives an effect size of 0.5, and with T'n'F+Fixed effects the effect size is 0.19. For CT, the original effect size is 0.1, and with T'n'F +FE, it is still 0.1. In relative terms, as PT only has 40% of the previous effect size (and CT 100% of the effect size), this would amount to 40% of the previous 'multiple' (i.e. 3.6x). 

Instead of comparing them to the original estimate (row 4), it calculates the percentages versus a fixed effect but not T'n'F analysis for PT (row 7). Although CT here is also 0.1, PT  in this row has an effect size of 0.2, so the PT percentage is (0.19/0.2) 95% versus (0.1/0.1) 100%, and so the calculated multiple of CT is not 3.6 but 9.0.

The spreadsheet is using the wrong comparison, as we care about whether the multiple between PT and CT is sensitive to different analyses, relative sensitivity to one variation (T'n'F) conditioned on another (fixed effect modelling). Especially when we're interested in small study effects and the conditioned on effect likely already reduces those. 

If one recalculates the bottom line multiples using the first model as the comparator, the results are a bit less weird, but also more adverse to PT. Note the effect is particularly reliable for T'n'F (ID 7-12) and selection measures (ID 37-42), which as already mentioned are the analysis methods which give qualitatively believable findings.

Of interest, the spreadsheet only makes this comparator error for PT: for CT, whether all or lumped (column I and L) makes all of its percentage comparisons versus the original model (ID 1). I hope (and mostly expect) this is a click-and-drag spreadsheet error (or perhaps one of my understanding), rather than my unwittingly recovering an earlier version of this analysis.


Summing up

I may say more next week, but my impressions are

  1. In answer to the original post title, I think the evidence for Strongminds is generally weak, equivocal, likely compromised, and definitely difficult to interpret.
  2. Many, perhaps most (maybe all?) of the elements used in HLI's recommendation of strongminds do not weather scrutiny well. E.g.
    1. Publication bias issues discussed in the comments here.
    2. The index papers being noted outliers even amongst this facially highly unreliable literature.
    3. The cost effectiveness guestimate not giving sensible answers when you change its inputs. 
  3. I think HLI should withdraw their recommendation of Strongminds, and mostly go 'back to the drawing board' on their assessments and recommendations. The current recommendation is based on an assessment with serious shortcomings in many of its crucial elements. I regret I suspect if I looked into other things I would see still more causes of concern.
  4. The shortcomings in multiple elements also make criticism challenging. Although HLI thinks the publication bias is not big enough of an effect to withdraw the recommendation, it what publication bias would be big enough, or indeed in general what evidence would lead them to change their minds. Their own CEA is basically insensitive to the meta-analysis, giving 'SM = 7x GD' even if the effect size was corrected all the way to zero. Above Joel notes even at 'only' SM = 3-4GD it would still generally be their top recommendation. So by this logic, the only decision-relevance this meta-analysis has is confirming the effect isn't massively negative. I doubt this is really true, but HLI should have a transparent understanding (and, ideally, transparent communication) of what their bottom line is actually responsive to. 
  5. One of the commoner criticisms of HLI is it is more a motivated reasoner than an impartial evaluator. Although its transparency in data (and now code) is commendable, overall this episode supports such an assessment: the pattern which emerges is a collection of dubious-to-indefensible choices made in analysis, which all point in the same direction (i.e. favouring the Strongminds recommendation); surprising incuriousity about the ramifications or reasonableness of these analytic choices; and very little of this being apparent from the public materials, emerging instead in response to third party criticism or partial replication. 
  6. Although there are laudable improvements contained in Joel's summary above, unfortunately (per my earlier points) I take it as yet another example of this overall pattern. The reasonable reaction to "Your publication bias corrections are (on average!) correcting the effect size upwards, and the obviously skewed funnel plot less than the not obviously skewed one" is not "Well, isn't that surprising - I guess there's no clear sign of trouble with pub bias in our recommendation after all", but "This doesn't make any sense".
  7. I recommend readers do not rely upon HLIs recommendations or reasoning without carefully scrutinising the underlying methods and data themselves.

I will try and summarise and comment on what I think are some possible suggestions you raise, which happen to align with your three sections. 

1. Discard the results that don't result in a discount to psychotherapy [1]

If I do this, the average comparison of PT to CT goes from 9.4x --> 7x. That seems like a plausible correction, but I'm not sure it's the one I should use. I interpreted these results s as indicating none of the tests give reliable results. I'll quote myself: 

I didn’t expect this behaviour from these tests. I’m not sure how I should update on using them in the future. I assume the likeliest issue is that they are unreliable in the conditions of these meta-analyses (high heterogeneity). Any thoughts on how to correct for publication bias in future analyses is welcome!

I'm really unsure if 9.4x --> 7x is a plausible magnitude of correction. The truth of the perfect test could suggest a greater or smaller correction, I'm really uncertain given the behavior of these tests. That leaves me scratching my head at what principled choice to make.

I think if we discussed this beforehand and I said "Okay, you've made some good points, I'm going to run all the typical tests and publish their results." would you have said have advised me to not even try, and instead, make ad hoc adjustments. If so, I'd be surprised given that's the direction I've taken you to be arguing I should move away from. 

2. Compare the change of all models to a single reference value of 0.5 [2]

When I do this, and again remove anything that doesn't produce a discount for psychotherapy, the average correction leads to a 6x cost-effectiveness ratio of PT to CT. This is a smaller shift than you seem to imply. 

3. Fix the weighting between the general and StrongMinds specific evidence [3].

Gregory is referring to my past CEA of StrongMinds in guesstimate, where if you assign an effect size of 0 to the meta-analytic results it only brings StrongMinds cost-effectiveness to 7x GiveDirectly. While such behavior is permissible in the model, obviously if I thought the effect  of psychotherapy in general was zero or close to, I would throw my StrongMinds CEA in the bin. 

As I noted in my previous comment discussing the next version of my analysis, I said: " I expect to assign relatively lower weight to the StrongMinds specific evidence." To elaborate, I expect the effect estimate of StrongMinds to be based much more heavily on the meta-analytic results. This is something I already said I'd change. 

I'll also investigate different ways of combining the charity specific and general evidence. E.g., a model that pins the estimates StrongMinds effects as relative to the general evidence.  Say if the effects of StrongMinds are always say 5% higher, then if we reduce the effects of psychotherapy by from 0.5 to 0.1 then the estimate of StrongMinds would go from 0.525 to 0.105. 

So what happens if we assign 100% of the weight to the meta-analytic results? The results would shrink by 20% [4]. If we apply this to the cost-effectiveness ratio that I so far think Gregory would endorse as the most correct (6x), this would imply a ~ 5x figure.  

Is a reduction of 9.4x to 5x enough to make HLI pause its recommendation? As I said before: 

Aside: Given that this appears to be the worst case scenario [a reduction to 3x], I’m not actually sure this would mean we drop our recommendation given that we haven’t found anything clearly better yet (see our analyses of anti-malarial bednets and deworming). I think it’s likelier that we would end up recommending anti-malaria bed nets to those with sympathetic philosophical views.

Gregory rightly pointed out that we haven't made it clear what sort of reduction would result in us abandoning our recommendation of StrongMinds. I can't speak for the team, but for me this would definitely be if it was less than 1x GiveDirectly. The reason why this is so low is I expect our recommendations to come in grades, and not just a binary. My complete guess is that if StrongMinds went below 7x GiveDirectly we'd qualitatively soften our recommendation of StrongMinds and maybe recommend bednets to more donors. If it was below 4x we'd probably also recommend GiveDirectly. If it was below 1x we'd drop StrongMinds. This would change if / when we find something much more (idk: 1.5-2x?) cost-effective and better evidenced than StrongMinds. 

However, I suspect this is beating around the bush -- as I think the point Gregory is alluding to is "look at how much their effects appear to wilt with the slightest scrutiny. Imagine what I'd find with just a few more hours." 

If that's the case, I understand why -- but that's not enough for me to reshuffle our research agenda. I need to think there's a big, clear issue now to ask the team to change our plans for the year. Again, I'll be doing a full re-analysis in a few months. 

4. Use a fixed effects model instead? 

I'm treating this as a separate point because I'm not sure if this is what Gregory suggests. While it's true that fixed effects models are less sensitive to small studies with large effects, fixed effects models are almost never used. I'll quote Harrer et al., (2021) again (emphasis theirs): 

In many fields, including medicine and the social sciences, it is therefore conventional to always use a random-effects model, since some degree of between-study heterogeneity can virtually always be anticipated. A fixed-effect model may only be used when we could not detect any between-study heterogeneity (we will discuss how this is done in Chapter 5) and when we have very good reasons to assume that the true effect is fixed. This may be the case when, for example, only exact replications of a study are considered, or when we meta-analyze subsets of one big study. Needless to say, this is seldom the case, and applications of the fixed-effect model “in the wild” are rather rare.

I'm not an expert here, but I'm hesitant to use a fixed effects model for these reasons. 

  1. ^

    "However, for these results, the ones that don't make qualitative sense should be discarded, and the the key upshot should be: "Although a lot of statistical corrections give bizarre results, the ones which do make sense also tend to show significant discounts to the PT effect size".

  2. ^

    "This is the case because the % changes are being measured, not against the single reference value of 0.5 in the original model, but the equivalent model in terms of random/fixed, outliers/not, etc. but without any statistical correction technique."

  3. ^

    "On the guestimate, setting the meta-regressions to zero effect still results in ~7x multiples for Strongminds versus cash transfers."

  4. ^

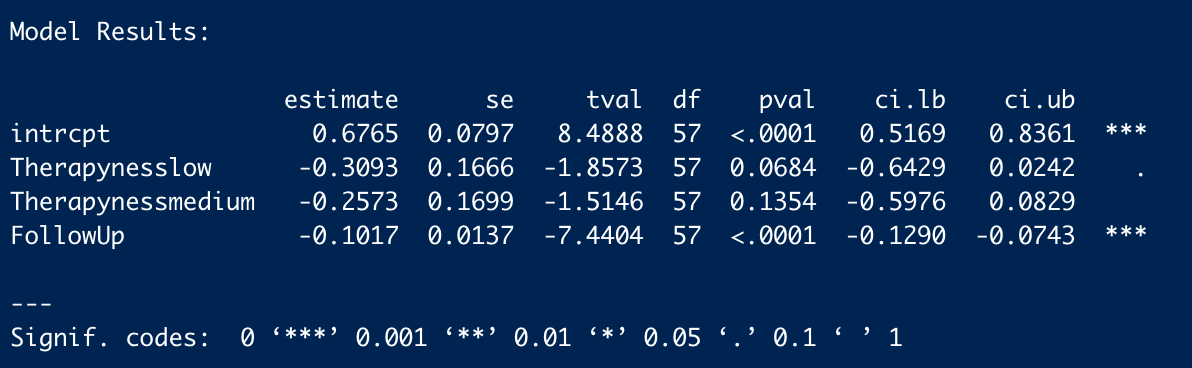
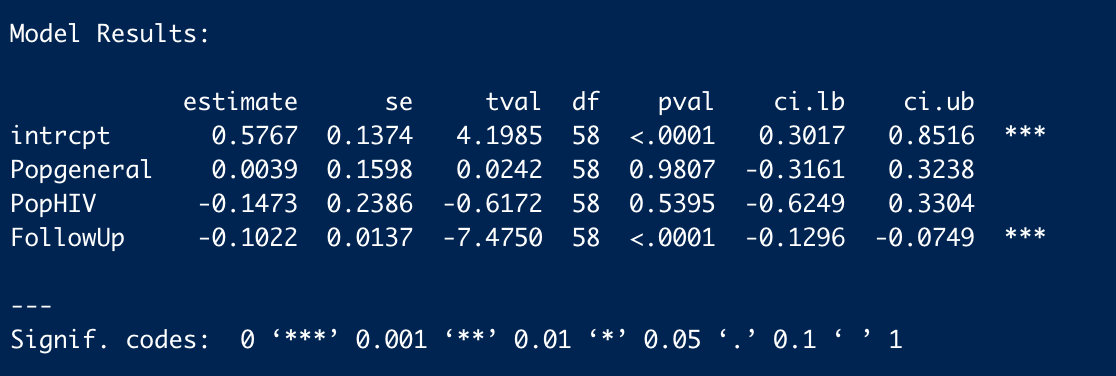
    We estimate the raw total effects of general psychotherapy to be 1.56 (see table 1) and 1.92 for StrongMinds (see end of section 4, page 18). 1.56/ 1.92 = 0.8125. The adjusted effects are smaller but produce a very similar ratio (1.4 & 1.7, table 2).

I have now had a look at the analysis code. Once again, I find significant errors and - once again - correcting these errors is adverse to HLI's bottom line.

I noted before the results originally reported do not make much sense (e.g. they generally report increases in effect size when 'controlling' for small study effects, despite it being visually obvious small studies tend to report larger effects on the funnel plot). When you use appropriate comparators (i.e. comparing everything to the original model as the baseline case), the cloud of statistics looks more reasonable: in general, they point towards discounts, not enhancements, to effect size: in general, the red lines are less than 1, whilst the blue ones are all over the place.

However, some findings still look bizarre even after doing this. E.g. Model 13 (PET) and model 19 (PEESE) not doing anything re. outliers, fixed effects, follow-ups etc, still report higher effects than the original analysis. These are both closely related to the eggers test noted before: why would it give a substantial discount, yet these a mild enhancement?

Happily, the code availability means I can have a look directly. All the basic data seems fine, as the various 'basic' plots and meta-analyses give the right results. Of interest, the Egger test is still pointing the right way - and even suggests a lower intercept effect size than last time (0.13 versus 0.26):

PET gives highly discordant findings:

You not only get a higher intercept (0.59 versus 0.5 in the basic random effects model), but the coefficient for standard error is negative: i.e. the regression line it draws slopes the opposite way to Eggers, so it predicts smaller studies give smaller, not greater, effects than larger ones. What's going on?

The moderator (i.e. ~independent variable) is 'corrected' SE. Unfortunately, this correction is incorrect (line 17 divides (n/2)^2 by itself, where the first bracket should be +, not *), so it 'corrects' a lot of studies to SE = 1 exactly: 

When you use this in a funnel plot, you get this:

Thus these aberrant results (which happened be below the mean effect size) explain why the best fit line now points in the opposite direction. All the PET analyses are contaminated by this error, and (given PEESE squares these values) so are all the PEESE analyses. When debugged, PET shows an intercept lower than 0.5, and the coefficient for SE pointing in the right direction:

Here's the table of corrected estimates applied to models 13 - 24: as you can see, correction reduces the intercept in all models, often to substantial degrees (I only reported to 2 dp, but model 23 was marginally lower). Unlike the original analysis, here the regression slopes generally point in the right direction.

The same error appears to be in the CT analyses. I haven't done the same correction, but I would guess the bizarre readings (e.g. the outliers of 70x or 200x etc. when comparing PT to CT when using these models) would vanish once it is corrected.

So, when correcting the PET and PEESE results, and use the appropriate comparator (Model 1, I forgot to do this for models 2-6 last time), we now get this:

Now interpretation is much clearer. Rather than 'all over the place, but most of the models basically keep the estimate the same', it is instead 'across most reasonable ways to correct or reduce the impact of small study effects, you see substantial reductions in effect (the avg across the models is ~60% of the original - not a million miles away from my '50%?' eyeball guess.) Moreover, the results permit better qualitative explanation.

  • On the first level, we can make our model fixed or random effects, fixed effects are more resilient to publication bias (more later), and we indeed find changing from random effects to fixed effect (i.e. model 1 to model 4) reduces effect size by a bit more than 2.
  • On the second level, we can elect for different inclusion criteria: we could remove outliers, or  exclude follow-ups. The former would be expected to partially reduce small study effects (as outliers will tend to be smaller studies reporting surprisingly high effects), whilst the later does not have an obvious directional effect - although one should account for nested outcomes, this would be expected to distort the weights rather than introduce a bias in effect size. Neatly enough, we see outlier exclusion does reduce effect size (Model 2 versus Model 1) but not followups or not (model 3 versus model 1). Another neat example of things lining up is you would expect FE to give a greater correction than outlier removal (as FE is strongly discounting smaller studies across the board, rather than removing a few of the most remarkable ones), and this is what we see (Model 2 vs. Model 4)
  • Finally, one can deploy a statistical technique to adjust for publication bias. There are a bunch of methods to do this: PET, PEESE, Rucker's limit, P curve, and selection models. All of these besides the P curve give a discount to the original effect size (model 7, 13,19,25,37 versus model 31). 
  • We can also apply these choices in combination, but essentially all combinations point to a significant downgrade in effect size. Furthermore, the combinations allow us to better explain discrepant findings. Only models 3, 31, 33, 35, 36 give numerically higher effect sizes. As mentioned before, model 3 only excludes follow-ups, so would not be expected to be less vulnerable to small study effects. The others are all P curve analyses, and P curves are especially sensitive to heterogeneity: the two P curves which report discounts are those with outliers removed (Model 32, 35), supporting this interpretation.

With that said, onto Joel's points.

1. Discarding (better - investigating) bizarre results

I think if we discussed this beforehand and I said "Okay, you've made some good points, I'm going to run all the typical tests and publish their results." would you have said have advised me to not even try, and instead, make ad hoc adjustments. If so, I'd be surprised given that's the direction I've taken you to be arguing I should move away from. 

You are correct I would have wholly endorsed permuting all the reasonable adjustments and seeing what picture emerges. Indeed, I would be (and am) happy with 'throwing everything in' even if some combinations can't really work, or doesn't really make much sense (e.g. outlier rejection + trim and fill). 

But I would have also have urged you to actually understand the results you are getting, and querying results which plainly do not make sense. That we're still seeing the pattern of "Initial results reported don't make sense, and I have to repeat a lot of the analysis myself to understand why (and, along the way, finding the real story is much more adverse than HLI presents)" is getting depressing.  

The error itself for PET and PEESE is no big deal - "I pressed the wrong button once when coding and it messed up a lot of my downstream analysis" can happen to anyone. But these results plainly contradicted both the naked eye (they not only give weird PT findings but weird CT findings: by inspection the CT is basically a negative control for pub bias, yet PET-PEESE typically finds statistically significant discounts), the closely-related Egger's test (disagreeing with respect to sign), and the negative coefficients for the models (meaning they are sloping in the opposite direction) are printed in the analysis code. 

I also find myself inclined to less sympathy here because I didn't meticulously inspect every line of analysis code looking for trouble (my file drawer is empty). I knew the results being reported for these analysis could not be right, so I zeroed in on it expecting there was an error. I was right.

2. Comparators

When I do this, and again remove anything that doesn't produce a discount for psychotherapy, the average correction leads to a 6x cost-effectiveness ratio of PT to CT. This is a smaller shift than you seem to imply. 

9.4x -> ~6x is a drop of about one third, I guess we could argue about what increment is large or small. But more concerning is the direction of travel: taking the 'CT (all)' comparator.  

If we do not do my initial reflex and discard the PT favouring results, then we see adding the appropriate comparator and fixing the statistical error ~ halves the original multiple. If we continue excluding the "surely not" +ve adjustments, we're still seeing a 20% drop with the comparator, and a further 10% increment with the right results for PT PET/PEESE.

How many more increments are there? There's at least one more - the CT PET/PEESE results are wrong, and they're giving bizarre results in the spreadsheet. Although I would expect diminishing returns to further checking (i.e. if I did scour the other bits of the analysis, I expect the cumulative error is smaller or neutral), but the 'limit value' of what this analysis would show if there were no errors doesn't look great so far. 

Maybe it would roughly settle towards the average of ~ 60%, so 9.4*0.6 = 5.6. Of course, this would still be fine by the lights of HLI's assessment.

3. Cost effectiveness analysis

My complete guess is that if StrongMinds went below 7x GiveDirectly we'd qualitatively soften our recommendation of StrongMinds and maybe recommend bednets to more donors. If it was below 4x we'd probably also recommend GiveDirectly. If it was below 1x we'd drop StrongMinds. This would change if / when we find something much more (idk: 1.5-2x?) cost-effective and better evidenced than StrongMinds. 

However, I suspect this is beating around the bush -- as I think the point Gregory is alluding to is "look at how much their effects appear to wilt with the slightest scrutiny. Imagine what I'd find with just a few more hours." 

If that's the case, I understand why -- but that's not enough for me to reshuffle our research agenda. I need to think there's a big, clear issue now to ask the team to change our plans for the year. Again, I'll be doing a full re-analysis in a few months. 

Thank you for the benchmarks. However, I mean to beat both the bush and the area behind it. 

The first things first, I have harped on about the CEA because it is is bizarre to be sanguine about significant corrections because 'the CEA still gives a good multiple' when the CEA itself gives bizarre outputs (as noted before). With these benchmarks, it seems this analysis, on its own terms, is already approaching action relevance: unless you want to stand behind cycling comparators (which the spreadsheet only does for PT and not CT, as I noted last time), then this + the correction gets you below 7x. Further, if you want to take SM effects as relative to the meta-analytic results (rather take their massively outlying values), you get towards 4x (e.g. drop the effect size of both meta-analyses by 40%, then put the SM effect sizes at the upper 95% CI). So there's already a clear motive to investigate urgently in terms of what you already trying to do.

The other reason is the general point of "Well, this important input wilts when you look at it closely - maybe this behaviour generalises". Sadly, we don't really need to 'imagine' what I would find with a few more hours: I just did (and on work presumably prepared expecting I would scrutinise it), and I think the results speak for themselves. 

The other parts of the CEA are non-linear in numerous ways, so it is plausible that drops of 50% in intercept value lead to greater than 50% drops in the MRA integrated effect sizes if correctly ramified across the analysis. More importantly, the thicket of the guestimate gives a lot of forking paths available - given it seems HLI clearly has had a finger on the scale, you may not need many more relatively gentle (i.e. 10%-50%) pushes upwards to get very inflated 'bottom line multipliers'.

 4. Use a fixed effects model instead? 

As Ryan notes, fixed effects are unconventional in general, but reasonable in particular when confronted with considerable small study effects. I think - even if one had seen publication bias prior to embarking on the analysis - sticking with random effects would have been reasonable. 

Gregory, 

Thank you for pointing out two errors.

  • First, the coding mistake with the standard error correction calculation. 
  • Second, and I didn't pick this up in the last comment, that the CT effect size change calculation were all referencing the same model, while the PT effect size changes were referencing their non-publication bias analog. 

______________________________________________________

After correcting these errors, the picture does shift a bit, but the quantitative changes are relatively small.

Here's the results where only the change due to the publication bias adjusts the cost-effectiveness comparison. More of the tests indicate a downwards correction, and the average / median test now indicates an adjustment from 9.4x to 8x. However, when we remove all adjustments that favor  PT in the comparison (models 19, 25, 23, 21, 17, 27, 15) the (average / median) is ratio of PT to CT is now (7x / 8x). This is the same as it was before the corrections.  

Note: I added vertical reference lines to mark the 3x, 7x and 9.44x multiples. 

Next, I present the changes where we include the model choices as publication bias adjustments (e.g., any reduction in effect size that comes from using a fixed effect model or outlier removal is counted against PT -- Gregory and Ryan support this approach. I'm still unsure, but it seems plausible and I'll read more about it). The mean / median adjustment leads to a 6x/7x comparison ratio. Excluding all PT favorable results leads to an average / median correction of 5.6x / 5.8x slightly below the 6x I previously reported


Note: I added vertical reference lines to mark the 3x, 7x and 9.44x multiples. 

Since the second approach bites into the cost-effectiveness comparison more and to a degree that's worth mentioning if true, I'll read more / raise this with my colleagues about whether using fixed effect models / discarding outliers are appropriate responses to suspicion of publication bias. 

If it turns out this is a more appropriate approach, then I should eat my hat re: 

My complete guess is that if StrongMinds went below 7x GiveDirectly we'd qualitatively soften our recommendation of StrongMinds and maybe recommend bednets to more donors.

The issue re comparators is less how good dropping outliers or fixed effects are as remedies to publication bias (or how appropriate either would be as an analytic choice here all things considered), but the similarity of these models to the original analysis.

 We are not, after all, adjusting or correcting the original metaregression analysis directly, but rather indirectly inferring the likely impact of small study effects on the original analysis by reference to the impact it has in simpler models.

The original analysis, of course, did not exclude outliers, nor follow-ups, and used random effects, not fixed effects. So of Models 1-6, model 1 bears the closest similarity to the analysis being indirectly assessed, so seems the most appropriate baseline. 

The point about outlier removal and fixed effects reducing the impact of small study effects is meant to illustrate cycling comparators introduces a bias in assessment instead of just adding noise. Of models 2-6, we would expect 2, 4,5 and 6 to be more resilient to small study effects than model 1, because they either remove outliers, use fixed effects, or both (Model 3 should be ~ a wash). The second figure provides some (further) evidence of this, as (e.g.) the random effects models (thatched) strongly tend to report greater effect sizes than the fixed effect ones, regardless of additional statistical method.

So noting the discount for a statistical small study effect correction is not so large versus comparators which are already less biased (due to analysis choices contrary to those made in the original analysis) misses the mark. 

If the original analysis had (somehow) used fixed effects, these worries would (largely) not apply. Of course, if the original analysis had used fixed effects, the effect size would have been a lot smaller in the first place.

--

Perhaps also worth noting is - with a discounted effect size - the overall impact of the intervention now becomes very sensitive to linear versus exponential decay of effect, given the definite integral of the linear method scales with the square of the intercept, whilst for exponential decay the integral is ~linear with the intercept. Although these values line up fairly well with the original intercept value of ~ 0.5, they diverge at lower values. If (e.g.) the intercept is 0.3, over a 5 year period the exponential method (with correction) returns ~1 SD years (vs.1.56 originally), whilst the linear method gives ~0.4 SD years (vs. 1.59 originally). 

(And, for what it is worth, if you plug in corrected SE or squared values in to the original multilevel meta-regressions, PET/PEESE style, you do drop the intercept by around these amounts either vs. follow-up alone or the later models which add other covariates.)

I will probably have longer comments later, but just on the fixed effects point, I feel it’s important to clarify that they are sometimes used in this kind of situation (when one fears publication bias or small study-type effects). For example, here is a slide deck from a paper presentation with three *highly* qualified co-authors. Slide 8 reads:

  • To be conservative, we use ‘fixed-effect’ MA or our new unrestricted WLS—Stanley and Doucouliagos (2015)
    • Not random-effects or the simple average: both are much more biased if there is publication bias (PB).
    • Fixed-effect (WLS-FE) is also biased with PB, but less so; thus will over-estimate the power of economic estimates.

This is basically also my take away. In the presence of publication bias or these small-study type effects, random effects "are much more biased" while fixed effects are "also biased [...] but less so." Perhaps there are some disciplinary differences going on here, but what I'm saying is a reasonable position in political science, and Stanley and Doucouliagos are economists, and Ioannidis is in medicine, so using fixed effects in this context is not some weird fringe position.

--

(disclosure: I have a paper under review where Stanley and Doucouliagos are co-authors)

I may respond later after I’ve read more into this, but briefly — thank you! This is interesting and something I’m willing to change my mind about it. Also didn’t know about WAAP, but it sounds like a sensible alternative.

I know "top charity" is in the eye of the beholder but I personally think even within the land of nonhuman-excluding non-longtermism it's a bad idea to use "anything better than GiveDirectly = top charity" when GiveWell has a $300 million dollar unmet gap that is 6-9x as good as GiveDirectly, and their core $600 million 2022 giving season ask is all >=10x GiveDirectly.

To be clear, this isn't the bar HLI uses. As I said in section 2:

At HLI, we think the relevant factors for recommending a charity are:

(1) cost-effectiveness is substantially better than our chosen benchmark (GiveDirectly cash transfers); and

(2) strong evidence of effectiveness. 

To elaborate, we interpret "substantially" to mean "around as good as the best charity we've found so far" which is currently 9x GiveDirectly, but I assume the specific number will change over time.

I was trying to propose a possible set of conditions where we could agree that it was reasonable for a charity to be recommended by someone in the EA community. I was aiming for inclusivity here and to leave room for the possibility that Founder's Pledge may have good reasons I'm not privy to for using GiveDirectly as a bar

I'm also unsure that GiveWell's bar will generalise to other types of analyses. i.e., I think it's very plausible that other evaluators find that cash transfers are much better than GiveWell does.  

Agreed. For what it's worth GWWC also uses a higher threshold than the 1x cash this post advocates.

Thanks Joel that cleared up a few lingering doubts in my mind, especially about the independence of HLI from StrongMinds. 

I agree that charity specific is too specific a requirement and that the evidence for StrongMinds is good enough t recommend it at least using WELLBYs not QALYs, but I also believe that when an org gets to the scale that StrongMinds have now reached, they should have an RCT vs cash at least in the works.

I'm looking forward to the analysis on other interventions - pain relief sounds very interesting given my anecdotal experience here of the difference that good pain relief can make here in middle age to older people with chronic arthritis. We give out much higher quanitites of pain relief than most health providers and people seem to appreciate that a lot.

An unrelated  couple of questions/criticisms looking at your meta-analysis if that's OK! Your selection criteria for the study you used was "Any form of face-to-face psychotherapy delivered to groups or by non-specialists deployed in LMICs." These three studies below you included don't have psychotherapy as the intervention, unless I'm missing something. There ma also be others, I didn't check them all.

https://pubmed.ncbi.nlm.nih.gov/16159905/
https://www.thelancet.com/journals/lancet/article/PIIS0140-6736(09)62042-0/fulltext
https://www.ncbi.nlm.nih.gov/pmc/articles/PMC4109271/

You also say that there are 39 studies analysed, but it looks like there are a lot less studies than that, with individual studies broken into differnent groups (like a,b,c,d). I haven't bothered looking into this in detail but was hoping you could explain first why you stated more studies were analysed than appear in the analysis, and why you broke those individual studies into different parts like that.

Also have you thought about publishing your Meta-analysis in a peer reviewed journal?, even something like Plos-one I think that at least where the quality and format roughly matches peer reviewed journal format (which this does), it would be good both for HLI and the EA movement to do that

"Any form of face-to-face psychotherapy delivered to groups or by non-specialists deployed in LMICs." These three studies below you included don't have psychotherapy as the intervention, unless I'm missing something.

Ah yes, I admit this looks a bit odd. But I'll try to explain. As I said in the psychotherapy CEA on page 9 (I didn't try to hide this too hard!): 

 Similarly, most studies make high use of psychotherapy. We classied a study as making high (low) use of psychological elements if it appeared that psychotherapy was (not) the primary means of relieving distress, or if relieving distress was not the primary aim of the intervention. For instance, we assigned Tripathy et al., (2010) as making low use of psychotherapy because their intervention was primarily targeted at reducing maternal and child mortality through group discussions of general health problems but still contained elements of talk therapy. We classied “use of psychotherapy” as medium if an intervention was primarily but not exclusively psychotherapy.

I also tried to show the relative proportion of papers falling in each category in the first figure: 

The complete list of studies with low or medium use of psychotherapy elements are:

Low psychotherapyMedium psychotherapy 
Cooper et al. 2009Hughes 2009
Baker-Henningham et al. 2005Singla et al. 2015
Richter et al. 2014Weobong et al., 2017
Rotheram-Borus et al. 2014bPatel et al., 2016
le Roux et al. 2013Patel et al. 2010
Tripathy et al. 2010Lund et al., 2020
Rotheram-Borus et al. 2014aAraya et al. 2003

One concern I anticipate is: "were you sneaking in these studies to inflate your effect?" and that's certainly not the case. In a model in an earlier draft of the analysis but didn't make the final cut, I regressed whether a trial made high, medium, or low use of psychotherapy on the effects. I found that, if anything, the trials without "high" use of psychotherapy elements have smaller effects. 

In lieu of a reference, I'll post the R output where the outcome is in SD changes in mental health measures. 

I plan on being stricter with the studies I include in the next analysis version. When I first did this meta-analysis, I thought quantity was more important than quality, and I think my views have changed since then. I don't think including these studies less relevant to psychotherapy affects the results too much other than moving the results to align with the "psychosocial" intervention prior. 

I also recognize that this is probably confusing, and we didn't explain this well. These are things I will return to when we return to this analysis and give it an upgrade in rigour and clarity. 

Nick, thank you for your comment. I always appreciate your friendly tone.  

but I also believe that when an org gets to the scale that StrongMinds have now reached, they should have an RCT vs cash at least in the works.

I agree this would be great ... but this also seems like a really strict requirement, and I'm not sure it's necessary. GiveWell seems nonplussed by not having an RCT comparing deworming to cash transfers or malaria prevention to vitamin-A supplementation, I'm inclined to believe this is something they've thought about. That's not meant to be a knockdown argument against the idea, but if an RCT like this is needed for comparing psychotherapy to cash transfers -- why not every other intervention currently recommended in the EA space? 

More directly, if we have two high-quality trials run separately about two different interventions but measuring similar outcomes -- how much better is this than running an RCT with two arms? It certainly reduces differences in confounders (particularly unobserved) between trials. But I think it's possible it could also have weaknesses. 

  • It seems plausibly more expensive to coordinate two high-quality interventions in a single trial than let them be run separately. For instance, IIRC correctly in Haushofer et al., 2020 the comparison between psychotherapy and GiveDirectly was a bit apples to oranges. For psychotherapy, they hired a local NGO to start a new programme from scratch, which they compared to GiveDirectly, which by that time, was a well-oiled cash-slinging machine. To get two organizations that already know how to deploy the intervention well to collaborate on a single RCT seems difficult and expensive.
  • It also may have limited generalizability. Running separate trials of charity interventions makes it likelier that the results reflect the circumstances that the charity operates in -- unless they have an area of overlap -- which is possible, but finding that seems like another reason this could be difficult. 

Lastly, regarding the making the dream RCT happen, HLI is currently rather resource constrained, so in our work, we have to make do with the existing literature, and we're only just now exploring "research advocacy" as an option. Running an RCT would probably cost a multiple of our annual budget. For StrongMinds, they have more resources, but not much more. If it was desired to have another RCT with a psychotherapy and cash arm, I wonder if the GiveDirectly RCT machine may be the most promising way to get that evidence. 

You also say that there are 39 studies analysed, but it looks like there are a lot less studies than that, with individual studies broken into differnent groups (like a,b,c,d). 

I think what may be happening here is I use "studies" as synonymous with "trials". So in my usage, one paper can analyse multiple studies (or trials). However, on reflection, I realise I sometimes refer to papers as studies -- which is unhelpful, therefore, I think it'd be clearer if I referred to each separate intervention experiment as a "trial".  Another thing that may be confusing is that sometimes authors will publish multiple papers in the same year. I distinguish these papers by adding an "a" or "b" etc to the end of the reference. 

But if you count all of the different unique "trials", it does come out to 39. 

Also have you thought about publishing your Meta-analysis in a peer reviewed journal?

We're keen to do this. But the existing meta-analysis is probably 65% of the rigour necessary for an academic paper. This year we are trying to redo the analysis with an academic collaborator so the search will be systematic, the data will be double-screened, and we have many more robustness tests. 

(I'll answer the selection criterion question separately) 

GiveWell seems nonplussed by not having an RCT comparing deworming to cash transfers or malaria prevention to vitamin-A supplementation, I'm inclined to believe this is something they've thought about. That's not meant to be a knockdown argument against the idea, but if an RCT like this is needed for comparing psychotherapy to cash transfers -- why not every other intervention currently recommended in the EA space? 

This does seem different, though. When you're studying whether bednets or vitamin A save lives, there's no plausible basis for thinking the beneficiary's knowledge that they are in the treatment group, or the non-effective portions of the experimental situation, could skew results. So it's fine to use a control group that consists of no intervention. In contrast, when you're studying a new medication for headache, you very much do not want the treatment group and the control group to know who they are -- you want them to believe they are receiving something equally effective. Hence we have placebos.

I see that many of the studies had what you characterize as some form of "care as usual" or a placebo like "HIV education." I flipped through a few of the linked studies, and I didn't walk away with an impression that the control group received an intervention that was nearly as immersive -- or that would lead participants to think their mental health would benefit -- as the psychotherapy intervention. (Although to be fair, most research articles don't dwell on the control group very much!)

And it seems that placebo "quality" can matter a lot -- e.g., this small study, where anti-depressant + supportive care reduced HRSD scores about 10 points, placebo pill + supportive care about 7.5, supportive care only less than 1.5. If you just looked at anti-depressant vs. the weak control of supportive care only, that anti-depressant looks awfully good. Likewise, on immersiveness, sham surgery does a lot better than sham acupuncture, which does a lot better than sham pills, for migraine headache.

So at some point, I think it's reasonable to ask for an assessment of SM -- or a similar program with a similar client population -- against a control group that  receives an intervention that is both of similar intensity and that study participants believed would likely improve their subjective well-being and/or depression. I hear that HLI doesn't currently have capacity to fund that, though.

As for the control: I don't think something like HIV education works -- the participants would not expect receiving that to improve their subjective well-being. Cash transfers is an obvious option, but probably not the only one. Pill placebos would work in Western countries, but maybe not in other places. Some sort of religious control-group experience (e.g., eight sessions of prayer vs. eight sessions of SM) would be a controversial active control, but seems potentially plausible if consistent with the cultural beliefs of the study population. Sham psychotherapy seems hard to pull off unless you have highly trained experimenters, but could be an option if you do.

In short, you're trying to measure an outcome variable that is far more sensitive to these sorts of issues than GiveWell (whose outcome measure is primarily loaded on whether the beneficiaries are less likely to die).

There's two separate topics here, the one I was discussing in the quoted text was about whether an intra RCT comparison of two interventions was necessary or whether  two meta-analyeses of two interventions would be sufficient. The references to GiveWell were not about the control groups they accept, but about their willingness to use meta-analyses instead of RCTs with arms comparing different interventions they suggest.

Another topic is the appropriate control group to compare psychotherapy against. But, I think you make a decent argument that placebo quality could matter. It's given me some things to think about, thank you.

Thanks, Joel. I agree that an RCT of SM vs cash wouldn't be useful as a head-to-head comparison of the two interventions. Among other things, "cash transfers to people who report being very depressed" is unlikely to be a scalable intervention anyway -- people in the service area would figure out what the "correct" answers were to obtain resources they needed for themselves and their families, and the program would largely turn into "generic cash transfers."

I think that your idea of sham psychotherapy Jason is a great idea and could well work, although it wouldn't be ethical unfortunately so couldn't be done. Thinking of alternatives to cash is a good idea but hard.

I think the purpose of testing Strong minds vs. cash is good not because we are considering giving cash instead to people who are depressed (you are right about it not being able to scale), but instead to see if SM really is better than cash using the before and after subjective question system. If SM squarely beat out cash, it would give me far more confidence that the before and after subjective wellbeing questions can work without a crippling amount of bias, as cash is far more likely than psychotherapy to illicit a positive future hope rating bias.

  Would be interested to hear what's included in your "among other things" that you don't like about cash vs. Strongminds

I understand the discussion above to be about whether it is necessary or advisible to have a SM arm and a cash arm in the same RCT. One major issue I would have with that design is that (based on what I understand of typical study recruitment) a fair number of people in the SM arm would know what people in the other arm got. I imagine that some people would be rather disappointed once they found that out that the other group got several months' worth of income and they got lay psychotherapy sessions. 

Likewise, if I were running a RCT of alprazolam vs. cognitive-behavioral therapy for panic disorder, I wouldn't want the CBT arm participants to see how the alprazolam branch was doing after a few weeks. Seeing the quick symptom relief of a benzo in other participants, and realizing they might be experiencing that present relief but for a coin flip, would risk biasing the CBT group.

It's not obvious to me why concerns about potential crippling bias in subjective well-being questions couldn't be met with the alternative Joel mentioned, "two high-quality trials run separately about two different interventions but measuring similar outcomes." If cash creates high bias (and shows the measurement of certain subjective states to be unreliable), it should show this bias in a separate trial as effectively as in a head-to-head in the same RCT. Of course, the outcome measures would need to be similar enough, and the participant population would need to be similar enough. 

As far as other factors, I think cost is a potentially significant one -- it's been almost twenty years since I took a graduate research design course (and it was in sociology), but it seems a lot cheaper to use existing literature on cash transfers (if appropriate) or to try to piggyback your subjective well-being questions into someone else's cash-transfer study for an analogous population. If SM continues to raise money at the rate it did in 2021 (vs. significantly lower funding levels in prior years), my consideration of that factor will diminish.

"but it seems a lot cheaper to use existing literature on cash transfers (if appropriate) or to try to piggyback your subjective well-being questions into someone else's cash-transfer study for an analogous population" I really like this.

You are right again that two trials would show the bias separately, but doing 2 separate trials loses the key RCT  benefits of (almost) removing confounding and bias. Selecting 2 populations for different trials that are comparable is very, very difficult.

My view on whether a cash vs. SM RCT is necessary / worth the money could definitely change based on the results of a good literature review or piggyback. 

My analysis of StrongMinds is based on a meta-analysis of 39 RCTS of group psychotherapy in low-income countries. I didn’t rely solely on StrongMinds’ own evidence alone, I incorporated the broader evidence base from other similar interventions too. This strikes me, in a Bayesian sense, as the sensible thing to do.

I agree, but as we have already discussed offline, I disagree with some of the steps in your meta-analyses, and think we should be using effect sizes smaller than the ones you have arrived at. I certainly didn't mean to claim in my post that StrongMinds has no effect, just that it has an effect which is small enough that we are looking at numbers on the order (or lower) than cash-transfers and therefore it doesn't meet the bar of "Top-Charity".

I think Simon would define “strong evidence” as recent, high-quality, and charity-specific. If that’s the case, I think that’s too stringent. That standard would imply that GiveWell should not recommend bednets, deworming, or vitamin-A supplementation.

I agree with this, although I think the difference here is I wouldn't expect those interventions to be as sensitive to the implementation details. (Mostly I think this is a reason to reduce the effect-size from the meta-analysis, whereas HLI thinks it's a reason to increase the effect size).

As a community, I think that we should put some weight on a recommendation if it fits the two standards I listed above, according to a plausible worldview (i.e., GiveWell’s moral weights or HLI’s subjective wellbeing approach). All that being said, we’re still developing our charity evaluation methodology, and I expect our views to evolve in the future. 

I agree with almost all of this. I don't think we should use HLI's subjective wellbeing approach  until it is better understood by the wider community. I doubt most donors appreciate some of the assumptions the well-being approach makes or the conclusions that it draws.

A couple of quick comments Simon.

First on this comment, which I disagree with - and this is one of the few areas where I think the Effective Altruism community can at times miss something quite important. This isn't really about the StrongMinds charity question, but instead a general bugbear of mine as someone who implements things ;).

" I think the difference here is I wouldn't expect those interventions to be as sensitive to the implementation details." 

Any intervention is extremely sensitive to implementation details, whether deworming or nets or psychotherapy. In fact I think that intervention details are often more important than the pre-calculated expected value. If a given intervention is implemented poorly, or in the wrong place or at the wrong time then it could still have less impact than an intervention that is theoretically 100x worse. As a plausible if absurd example, imagine a vitamin A project which doesn't actually happen because the money is corrupted away.  Or if you you give out mosquito nets in the same village where another NGO gave out nets 2 weeks ago. Or if you deworm in a place where 20 previous deworming projects and sanitation has already drastically reduced the worm burden.

Maybe some interventions are easier to implement than others,  and there might be  more variance  in the effectiveness of psychotherapy compared with net distribution (although I doubt that, I would guess less variance than nets)  but  all are very sensitive to implementation details.
 

And second this statement

"just that it has an effect which is small enough that we are looking at numbers on the order (or lower) than cash-transfers and therefore it doesn't meet the bar of "Top-Charity"."

I'd be interested in you backing up this comment with a bit explanation if you have time (all good if not!). I know this isn't your job and you don't have the time that Joel has, but  what is it that has led you to conclude that the numbers are "on the order (or lower) than cash transfers"?   Is this comment based on intuition or have you done some maths?

Any intervention is extremely sensitive to implementation details, whether deworming or nets or psychotherapy.

Yes, I'm sorry if my comment appeared to dismiss this fact as I do strongly agree with this. 

Maybe some interventions are easier to implement than others,  and there might be  more variance  in the effectiveness of psychotherapy compared with net distribution (although I doubt that, I would guess less variance than nets)  but  all are very sensitive to implementation details.

This is pretty much my point

I'd be interested in you backing up this comment with a bit explanation if you have time (all good if not!). I know this isn't your job and you don't have the time that Joel has, but  what is it that has led you to conclude that the numbers are "on the order (or lower) than cash transfers"?   Is this comment based on intuition or have you done some maths?

I haven't done a bottom up analyses, more I have made my own adjustments to the HLI numbers which get me to about that level:

  • You use 0.88 as the effect-size for StrongMinds whereas I think it's more appropriate to use something closer to the 0.4/0.5 you use here. (And in fact I actually skew this number even lower than you do)
  • You convert SDs of depression-scores directly to SDs of well-being, which I strongly object to. I don't have exact numbers of how I would discount this, but my guess is there are two reasons I want to discount this:
    • Non-linearity in severity of depression
    • No perfect correlation between the measures (when I spoke to Joel we discussed this, and I do think your reasoning is reasonable, but I still disagree with it)

I think the fairest way to resolve this would be to bet on the effect-size of the Ozler trial. Where would you make me 50/50 odds in $5k?

Just to clarify, am not part of Strongminds or HLI, maybe you thought I was Joel replying?

Thanks for the clarifications, appreciate that. Seems like we generally agree on implementation sensitivity.

Thanks for your explanation on the HLI numbers which unfortunately I only I partly understand. A quick (and possibly stupid question), what does SD stand for? Usually I would expect standard deviation? 

No bet from me on the Ozler trial I'm afraid (not a gambling guy ;) ). Personally I think this trial it will find a fairly large effect due partly to the intervention actually working, but the effect will be inflated compared to the real effect to a due to inflated post-study  SBJ scores. This happens due to "demand bias" and "future hope bias" (discussed in another post) but my certainty of any of this is so low it almost touches the floor...

what does SD stand for? Usually I would expect standard deviation? 

Yes, that's exactly right. The HLI methodology consists of polling together a bunch of different studies effect-sizes (measured in standard deviations) and then converting those standard deviations into WELLBYs. (By mulitplying by a number ~2). 

No bet from me on the Ozler tria

Fair enough - I'm open to betting on this with anyone* fwiw. * anyone who hasn't already seen results / involved in the trial ofc

A few things that stand out to me that seem dodgy and make me doubt this analysis:

One of the studies you included with the strongest effect (Araya et al. 2003 in Chile with an effect of 0.9 Cohens d) uses antidepressants as part of the intervention. Why did you include this? How many other studies included non-psychotherapy interventions?

Some of the studies deal with quite specific groups of people eg. survivors of violence, pregnant women, HIV-affected women with young children. Generalising from psychotherapy's effects in these groups  to psychotherapy in the general population seems unreasonable. 

Similarly, the therapies applied between studies seem highly variable including "Antenatal Emotional Self-Management Training", group therapy, one-on-one peer mentors. Lumping these together and drawing conclusions about "psychotherapy" generally seems unreasonable.

With the difficulty of blinding patients to psychotherapy, there seems to be room for the Hawthorne effect to be skewing the results of each of the 39 studies: with patients who are aware that they've received therapy feeling obliged to say that it helped.


Other minor things:
- Multiple references to Appendix D. Where is Appendix D?
- Maybe I've missed it but do you properly list the studies you used somewhere. "Husain, 2017" is not enough info to go by.

Hi Henry, 

I addressed the variance in the primacy of psychotherapy in the studies in response to Nick's comment, so I'll respond to your other issues. 

Some of the studies deal with quite specific groups of people eg. survivors of violence, pregnant women, HIV-affected women with young children. Generalising from psychotherapy's effects in these groups  to psychotherapy in the general population seems unreasonable. 

I agree this would be a problem if we only had evidence from one quite specific group. But when we have evidence from multiple groups, and we don't have strong reasons for thinking that psychotherapy will affect these groups differently than the general population -- I think it's better to include rather than exclude them. 

I didn't show enough robustness checks like this, which is a mistake I'll remedy in the next version. I categorised the population of every study as involving "conflict or violence", "general" or "HIV".  Running these trial characteristics as moderating factors suggests that, if anything, adding these additional populations underestimates the efficacy. But this is a point worth returning to.

Similarly, the therapies applied between studies seem highly variable including "Antenatal Emotional Self-Management Training", group therapy, one-on-one peer mentors. Lumping these together and drawing conclusions about "psychotherapy" generally seems unreasonable.

I'm less concerned with variation in the type of therapy not generalising because  as I say in the report (page 5) "...different forms of psychotherapy share many of the same strategies. We do not focus on a particular form of psychotherapy. Previous meta-analyses find mixed evidence supporting the superiority of any one form of psychotherapy for treating depression (Cuijpers et al., 2019)." 

Due to the fact most types of psychotherapy seem about as effective, and expertise doesn't seem  to be of first order importance, I formed the view that if you regularly get someone talk to about their problems in a semi-structured way it'll probably be pretty good for them. This isn't a view I'd defend to the death, but I held it strongly enough to justify (at least to myself and the team) doing the simpler version of the analysis I performed. 

With the difficulty of blinding patients to psychotherapy, there seems to be room for the Hawthorne effect to be skewing the results of each of the 39 studies: with patients who are aware that they've received therapy feeling obliged to say that it helped.

Right, but this is the case with most interventions (e.g., cash transfers). So long as the Hawthorne effect is balanced across interventions (which I'm not implying is assured), then we should still be able to compare their cost-effectiveness using self-reports. 

Furthermore, only 8 of the trials had waitlist or do nothing controls. The rest of the trials received some form of "care as usual" or a placebo like "HIV education".  Presumably these more active controls could also elicit a Hawthorne effect or response bias? 

Hi Henry. Thanks for your feedback! I'll let Joel respond to the substantive comments but just wanted to note that I've changed the "Appendix D" references to "Appendix C". Thanks very much for letting us know about that. 

I'm not sure why Appendix B has hyperlinks for some studies but not for others. I'll check with Joel about that and add links to all the papers as soon as I can. In future, I plan to convert some of our data tables into embedded AirTables so that readers can reorder by different columns if they wish.

Rina
1y17
3
0

Thanks for this post! I always appreciate the transparecy and lucidity HLI aims to provide in their posts. The advocacy for a wellbeing view is much needed.

Could I add on to Nick's comment and an ask for clarification about  including"Any form of face-to-face psychotherapy delivered to groups or by non-specialists deployed in LMICs." -- it seems in your Appendix B that the studies incorporated in meta-regression include a  lot of individually delivered interventions, do you still use them and if so how/any differently? (https://www.happierlivesinstitute.org/report/psychotherapy-cost-effectiveness-analysis/)

I was also curious about how relevant you think these populations are, again looking at Appendix B,  given one of Simon's critiques about social desirability, which I understand to be essentially saying: StrongMinds recruits women from the general population who meet a certain threshold of depressive symptoms but some women report higher level symptomatology when they do not really have those levels of problems in order to participate (e.g. under the mistaken assumption they might be getting cash transfers). This type of generally recruited and potentially partially biased sample seems a little different than a sample that includes women survivors of torture/ violence/ SA/ in post-conflict settings of which you have a number of RCTs.  Are there baseline mental health scores for all these samples that you could look at? (I'm assuming you haven't yet based on the paragraph on page 26 starting 'The populations studied in the RCTs we synthesize vary considerably...'

Hi Rina! I appreciate the nice words. 

Could I add on to Nick's comment and an ask for clarification about  including"Any form of face-to-face psychotherapy delivered to groups or by non-specialists deployed in LMICs." -- it seems in your Appendix B that the studies incorporated in meta-regression include a  lot of individually delivered interventions, do you still use them and if so how/any differently?

Yes, we still use individually delivered interventions as general evidence of psychotherapy's efficacy in low and middle-income countries. We assigned this general evidence 46% of the weight in the StrongMind's analysis (see Table 2 in the StrongMinds report). 

While we found that group-delivered psychotherapy is more impactful, I'm not entirely clear what the causal mechanism for this would be, so I thought it'd be appropriately conservative to leave in that evidence. We showed and discussed this topic in Table 2 of our psychotherapy report (page 16).

This type of generally recruited and potentially partially biased sample seems a little different than a sample that includes women survivors of torture/ violence/ SA/ in post-conflict settings of which you have a number of RCTs.

I discussed the potential issues with the differences in samples and the way I try to address them in my response to Henry, so I won't repeat myself unless you have a further concern there. 

Regarding the risk of bias due to mistaken beliefs about receiving material benefits -- this is honestly new to me since Nick Laing brought it up a couple of months ago. Insomuch as this bias exists, I assume for StrongMinds, this will have to go down over time as word travels that they do not, in fact, do much other than mental health treatments. 

And to reiterate the crux here: for this to affect our comparison to, say, cash transfers, we need to believe that this bias leads to people over-reporting their benefits more (or less) than it would for the people who receive cash transfers who hope that if they give positive responses, they'll get even more cash transfers. 

I'm not trying to dismiss this concern out of hand, but I'd prefer to collect more evidence before I change my analysis. I will, if possible, try to make that evidence come to be (just as I try to push for the creation of evidence to inform other questions we're uncertain about) -- if I can do so cost-effectively, but in my position, resources are limited. 

Are there baseline mental health scores for all these samples that you could look at?

There are in many cases, but that's not data we recorded from the samples, but I think for most studies, the sample was selected for having psychological distress above some clinical threshold. That may be worth looking into. 

Thanks Joel - I might be wrong but I think the point might be more more that sometimes you seem to say something in the methodology, than do something a bit different. I don't think Rina was necessarily saying that you shouldn't have included individual interventions but more clarifying what the study is actually doing, compared to what you said it was doing in the methodology.

Thank you for this. I might have more to say later when I read all this more carefully, but I couldn’t find either a forest plot or a funnel plot from the meta-analysis in the report (sorry if I missed it). Could you share those or point me to where they exist? They’re both useful for understanding what is going on in the data.

I should also say, if there is a replication package available for the analysis (I didn’t see one) then I should be able to do this myself and I can share the results here.

If we all agree that this topic matters, then it is pretty important to share this kind of normal diagnostic info. For example, the recent water disinfectant meta-analysis by Michael Kremer’s team shows both graphs. https://papers.ssrn.com/sol3/papers.cfm?abstract_id=4071953

I found (I think) the spreadsheet for the included studies here. I did a lazy replication (i.e. excluding duplicate follow-ups from studies, only including the 30 studies where 'raw' means and SDs were extracted, then plugging this into metamar). I copy and paste the (random effects) forest plot and funnel plot below - doubtless you would be able to perform a much more rigorous replication.

funnel plot

This is why we like to see these plots! Thank you Gregory, though this should not have been on you to do.

Having results like this underpin a charity recommendation and not showing it all transparently is a bad look for HLI. Hopefully there has been a mistake in your attempted replication and that explains e.g. the funnel plot. I look forward to reading the responses to your questions to Joel.

I'd love to hear which parts of my comment people disagree with. I think the following points, which I tried to make in my comment, are uncontentious:

  1. The plots I requested are indeed informative, and they cast some doubt on the credibility of the original meta-analysis
  2. Basic meta-analysis plots like a forest or funnel plot, which are incredible common in meta-analyses, should have been provided by the authors rather than made by community members
  3. Relatedly, transparency in the strength and/or quality of evidence underpinning charity recommendation is good (not checking the strength or quality of evidence is bad, as is not sharing that information if one did check)
  4. The funnel plot looks very asymmetric as well as just weird, and it would be nice if this was due to e.g. data entry mistakes by Gregory as opposed to anything else

I didn't vote, but people may feel "not showing it all transparently is a bad look for HLI" is a little premature and unfriendly without allowing HLI time for a response to fresh analysis.

Thank you for responding Jason. That makes sense. The analysis under question here  was done in Oct 2021, so I do think there was enough time to check a funnel plot for publication bias or odd heterogeneity. I really do think it's a bad look if no one checked for this, and it's a worse look if people checked and didn't report it. This is why I hope the issue is something like data entry.

Your core point is still fair though: There might be other explanations for this that I'm not considering, so while waiting for clarification from HLI I should be clear that I'm agnostic on motives or anything else. Everyone here is trying.

Hi Ryan, 

Our preferred model uses a meta-regression with the follow-up time as a moderator, not the typical "average everything" meta-analysis. Because of my experience presenting the cash transfers meta-analysis, I wanted to avoid people fixating on the forest plot and getting confused about the results since it's not the takeaway result. But In hindsight I think it probably would have been helpful to include the forest plot somewhere.

I don't have a good excuse for the publication bias analysis. Instead of making a funnel plot I embarked on a quest to try and find a more general system for adjusting for biases between intervention literatures. This was, perhaps unsurprisingly, an incomplete work that failed to achieve many of its aims (see Appendix C) -- but it did lead to a discount of psychotherapy's effects relative to cash transfers. In hindsight, I see the time spent on that mini project as a distraction. In the future I think we will spend more time focusing on using extant ways to adjust for publication bias quantitatively. 

Part of the reasoning was because we weren't trying to do a systematic meta-analysis, but trying to do a quicker version on a convenience sample of studies. As we said on page 8 "These studies are not exhaustive (footnote: There are at least 24 studies, with an estimated total sample size of 2,310, we did not extract. Additionally, there appear to be several protocols registered to run trials studying the effectiveness and cost of non-specialist-delivered mental health interventions.). We stopped collecting new studies due to time constraints and the perception of diminishing returns." 

I wasn't sure if a funnel plot was appropriate when applied to a non-systematically selected sample of studies. As I've said elsewhere, I think we could have made the depth (or shallowness) of our analysis more clear. 

so I do think there was enough time to check a funnel plot for publication bias or odd heterogeneity

While that's technically true that there was enough time, It certainly doesn't feel like it! -- HLI is a very small research organization (from 2020 through 2021 I was pretty much the lone HLI empirical researcher), and we have to constantly balance between exploring new cause areas / searching for interventions, and updating / improving previous analyses. It feels like I hit publish on this yesterday. I concede that I could have done better, and I plan on doing so in the future, but this balancing act is an art. It sometimes takes conversations like this to put items on our agenda.

FWIW, here some quick plots I cooked up with the cleaner data. Some obvious remarks: 

  • The StrongMinds relevant studies (Bolton et al., 2003; Bass et al., 2006) appear to be unusually effective (outliers?). 
  • There appears more evidence of publication bias than was the case with our cash transfers meta-analysis (see last plot). 
  • I also added a p-curve. What you don't want to see is a larger number of studies at the 0.05 mark than the 0.04 significance level, but that's what you see here. 

Here are the cash transfer plots for reference: 

Thank you for sharing these Joel. You've got a lot going on in the comments here, so I'm going only make a few brief specific comments and one larger one. The larger one relates to something you've noted elsewhere in the thread, which is:

"That the quality of this analysis was an attempt to be more rigorous than most shallow EA analyses, but definitely less rigorous than an quality peer reviewed academic paper. I think this [...] is not something we clearly communicated."

This work forms part of the evidence base behind some strong claims from HLI about where to give money, so I did expect it to be more rigorous. I wondered if I was alone in being surprised here, so I did a very informal (n = 23!) Twitter poll in the EA group asking about what people expected re: the rigor of  evidence for charity recommendations. (I fixed my stupid Our World in Data autocorrect glitch in a follow up tweet).

I don't want to lean on this too much, but I do think it suggests that I'm not alone in expecting a higher degree of rigor when it comes to where to put charity dollars. This is perhaps mostly a communication issue, but I also think  that as quality of analysis and evidence becomes less rigorous then claims should be toned down or at least the uncertainty (in the broad sense) needs to  be more strongly expressed.

On the specifics, first, I appreciate you noting the apparent publication bias. That's both important and not great.

Second, I think comparing the cash transfer funnel plot to the other one is informative. The cash transfer one looks "right". It has the correct shape and it's comforting to see the Egger regression line is basically zero. This is definitely not the case with the StrongMinds MA. The funnel plot looks incredibly weird, which could be heterogeneity that we can model but should regardless make everyone skeptical because doing that kind of modelling well is very hard. It's also rough to see that if we project the Egger regression line back to the origin then the predicted effect when the SE is zero is basically zero. In other words, unwinding publication bias in this way would lead us to guess at a true effect of around nothing. Do I believe that? I'm not sure. There are good reasons to be skeptical of Egger-type regressions, but all of this definitely increases my skepticism of the results. While I'm glad it's public now, I don't feel great that this wasn't part of the very public first cut of the results.

Again, I appreciate you responding. I do think going forward it would be worth taking seriously community expectations about what underlies charity recommendations, and if something is tentative or rough then I hope that it gets clearly communicated as such, both originally and in downstream uses.

Interesting poll Ryan! I'm not sure how much to take away because I think epistemic / evidentiary standards is pretty fuzzy in the minds of most readers. But still, point taken that people probably expect high standards. 

It's also rough to see that if we project the Egger regression line back to the origin then the predicted effect when the SE is zero is basically zero.

I'm not sure about that. Here's the output of the Egger test. If I'm interpreting it correctly then that's smaller, but not zero. I'll try to figure out how what the p-curve suggested correction says. 

Edit: I'm also not sure how much to trust the Egger test to tell me what the corrected effect size should be, so this wasn't an endorsement that I think the real effect size should be halfed. It seems different ways of making this correction give very different answers. I'll add a further comment with more details. 

I do think going forward it would be worth taking seriously community expectations about what underlies charity recommendations, and if something is tentative or rough then I hope that it gets clearly communicated as such, both originally and in downstream uses.

Seems reasonable. 

Fair re: Egger. I just eyeballed the figure.

I have no right to ask for this, but for comment sections that really get into the weeds technically (and on issues one would expect to be action-relevant for other members of the community), it would be great to have a fairly short, neutral, accessible writeup once the conversation has died down. I suspect there are a number of readers whose statistical background and abilities are not significantly better than mine (I have some graduate research training in sociology, but it was nearly half a lifetime ago). On the other hand, it's not reasonable to ask commenters to write their technically-oriented comments in a way that is accessible to people like me.

At present, I think those of us with less technical sophistication are left with something like "There are issues with HLI's methodology, but the extent to which those issues materially affect the bottom line is a subject of disagreement." Maybe that's all that could be said neutrally anyway, and people like me just have to read the comments and draw what conclusions we can? 

That's so reasonable.

I think that we can all agree that the analysis was done in an atypical way (perhaps for good reason), that it was not as rigorous as many people expected, and that it had a series of omissions or made atypical analytical moves that (perhaps inadvertently) made SM look better than it will look once that stuff is addressed. I don't think anyone can speak yet to the magnitude of the adjustment when the analysis is done better or in a standard way. 

But I'd welcome especially Joel's response to this question. It's a critical question and it's worth hearing his take.

Fair point! I'll try to to summarize things from my perspective once things have settled a bit more. 

Re. the meta-analysis, are you using the regressions to get the pooled estimate? If so, how are the weights of the studies being pooled determined?

Yes, the pooled results are mostly done with meta-regressions where studies are weighted by the inverse of the standard error (so more imprecisely estimated effect sizes are weighted less).

Thanks. I've taken the liberty of quickly meta-analysing (rather, quickly plugging your spreadsheet into metamar). I have further questions.

1. My forest plot (ignoring repeated measures - more later) shows studies with effect sizes >0 (i.e. disfavouring intervention) and <-2 (i.e.. greatly favouring intervention). Yet fig 1 (and subsequent figures)  suggests the effect sizes of the included studies are between 0 and -2. Appendix B also says the same: what am I missing?

2. My understanding is it is an error to straightforwardly include multiple results from the same study (i.e. F/U at t1, t2, etc.) into meta-analysis (see Cochrane handbook here): naively, one would expect doing so would overweight these studies versus those which report outcomes only once. How did the analysis account for this?

3. Are the meta-regression results fixed or random effects? I'm pretty sure metareg in R does random effects by default, but it is intuitively surprising you would get the impact halved if one medium-sized study is excluded (Baranov et al. 2020). Perhaps what is going on is the overall calculated impact is much more sensitive to the regression coefficient for time decay than the pooled effect size, so the lone study with longer follow-up exerts a lot of weight dragging this upwards.

4. On the external validity point, it is notable that Baranov et al. was a study of pre-natal psychotherapy in Pakistan: it looks dubious that the results of this study would really double our estimates of effect persistence - particularly of, as I understand it, more general provision in sub-Saharan Africa. There seem facially credible reasons why the effects in this population could be persistent in a non-generalising way: e.g. that better maternal mental health post-partum means better economic decision making at a pivotal time (which then improves material circumstances thereafter). 

In general inclusion seems overly permissive: by analogy, it is akin to doing a meta-analysis of the efficacy of aspirin on all cause mortality where you pool all of its indications, and are indifferent to whether is mono-, primary or adjunct Tx. I grant efficacy findings in one subgroup are informative re. efficacy in another, but not so informative that results can be weighed equally versus studies performed in the subgroup of interest (ditto including studies which only partly or tangentially involve any form of psychotherapy - inclusion looks dubious given the degree to which outcomes can be attributed to the intervention of interest is uncertain). Typical meta-analyses have much more stringent criteria (cf. PICO), and for good reason. 

5. You elect for exp decay over linear decay in part as the former model has a higher R2 than the latter. What were the R2s? By visual inspection I guess both figures are pretty low. Similarly, it would be useful to report these or similar statistics for all of the metaregressions reported: if the residual heterogeneity remains very high, this supplies caution to the analysis: effects vary a lot, and we do not have good explanations why.

6. A general challenge here is metagression tends insensitive, and may struggle to ably disentangle between-study heterogeneity - especially when, as here, there's a pile of plausible confounds owed to the permissive inclusion criteria (e.g. besides clinical subpopulation, what about location?).  This is particularly pressing if the overall results are sensitive to strong assumptions made of the presumptive drivers of said heterogeneity, given the high potential for unaccounted-for confounders distorting the true effects. 

7. The write-up notes one potential confounder  to apparent time decay: better studies have more extensive followup, but perhaps better studies also report lesser effects. It is unfortunate small study effects were not assessed, as these appear substantial:

funnel plot

Note both the marked asymmetry (Eggers P < 0.001), as well as a large number of intervention favouring studies finding themselves in the P 0.01 to 0.05 band.  Quantitative correction would be far from straightforward, but plausibly an integer divisor. It may also be worth controlling for this effect in the other metaregressions.

8. Given the analysis is atypical (re. inclusion, selection/search, analysis, etc.) 'analysing as you go' probably is not the best way of managing researcher degrees of freedom. Although it is perhaps a little too late to make a prior analysis plan, a multiverse analysis could be informative. 

I regret my hunch is this would find the presented analysis is pretty out on the tail of 'psychotherapy favouring results': most other reasonable ways of slicing it lead to weaker or more uncertain conclusions.

Hi Gregory, 

The data we use is from the tab “Before 23.02.2022 Edits Data”. The “LayOrGroup Cleaner” is another tab that we used to do specific exploratory tests. So the selection of studies changes a bit.

1. We also clean the data in our code so the effects are set to positive in our analysis (i.e., all of the studies find reductions in depression/increases in wellbeing). Except for the Haushofer et al., which is the only decline in wellbeing.

2. We attempt to control for this problem by using a multi-level model (with random intercepts clustered at the level of the authors), but this type of meta-analysis is not super common.

3. We are using random effects. We are planning on exploring how best to set the model in our next analysis, and how using different models changes our analysis. Our aim is to do something more in the spirit of a multiverse analysis than our present analysis. 

Perhaps what is going on is the overall calculated impact is much more sensitive to the regression coefficient for time decay than the pooled effect size, so the lone study with longer follow-up exerts a lot of weight dragging this upwards.

Yes, Baranov et al. has an especially strong effect on the time decay coefficient, not the pooled effect size. I'm less concerned this was a fluke as Bhat et al., (2021) has since been published. , which also found very durable effects of lay delivered psychotherapy primarily delivered to women. 

4. I think you raise some fair challenges regarding the permissiveness of inclusion. Ideally, we'd include many studies that are at least somewhat relevant, and then weight the study by its precision and relevance. But there isn't a clear way to find out which characteristics of a study may drive the difference in its effect without including a wide evidence base and running a lot of moderating analyses.  I think many meta-analyses through the baby out with the bath water because of the strictness of their PICOs, and miss answering some very important questions because of it, e.g. "like how do the effects decay over time?".  

5. As we say in the report. 

We prefer an exponential model because it ts our data better (it has a higher 𝑅2) and it matches the pattern  found in other studies of psychotherapy’s trajectory. (footnote: The only two studies we have found that have tracked the trajectory of psychotherapy with suficient time granularity also find that the effects decay at a diminishing rate (Ali et al., 2017; Bastiaansen et al., 2020)). 

So R^2 wasn't the only reason, but yes it was very low. I agree that it would be a good idea to report more statistics including the residual heterogeneity in future reports. 

6. I think this is fair, and that more robustness checks are warranted in the next version of the analysis. 

7. We planned quantitatively comparing the publication bias / small study effects between psychotherapy and cash transfers, as psychotherapy does appear to have more risk as you pointed out. 

8. At the risk of sounding like a broken record, we plan on doing many more robustness checks in the flavor of a multiverse analysis when we update the analysis. If we find that our previous analyses appeared to have been unusually optimistic, we will adjust it until we think it's sensible. 

These are good points, and I think they make me realize we could have framed our analysis differently. I saw this meta-analysis as:

  •  An attempt to push EA analyses away from using one or a couple of studies and towards using larger bodies of evidence. 
  • To try point that the ho the change effects over time is an important parameter and we should try to estimate it. 
  •  A way to form a prior on the size and persistence of the effects of psychotherapy in low income countries. 
  • That the quality of this analysis was an attempt to be more rigorous than most shallow EA analyses, but definitely less rigorous than an quality peer reviewed academic paper

I think this last point is not something we clearly communicated. 

Thanks for the forest and funnel plots - much more accurate and informative than  my own (although it seems the core upshots are unchanged)

I'll return to the second order matters later in the show, but on the merits, surely the discovery of marked small study effects should call the results of this analysis (and subsequent recommendation of Strongminds) into doubt? 

Specifically:

  1. The marked small study effect is difficult to control for, but it seems my remark of an 'integer division' re. effect size is in the right ballpark. I would expect* (more later) real effects 2x-4x lower than thought could change the bottom lines.
  2.  Heterogeneity remains vast, but the small study effect is likely the best predictor of it versus time decay, intervention properties similar to strongminds, etc. It seems important to repeat the analysis controlling for small study effects, as overall impact calculation is much more sensitive to coefficient estimates which are plausibly confounded by this currently unaccounted for effect.
  3. Discovery the surveyed studies appear riven with publication bias and p hacking should provide further scepticism of outliers (like the SM-specific studies heavily relied upon).

Re. each in turn:

1. I think the typical 'Cochrane-esque' norms would say the pooled effects and metaregression results are essentially meaningless given profound heterogeneity and marked small study effects. From your other comments, I presume you more favour a 'Bayesian Best Guess' approach: rather than throwing up our hands if noise and bias loom large, we should do our best to correct for them and give the best estimate on the data. 

In this spirit of statistical adventure, we could use the Egger's regression slope to infer the effect size the perfectly precise study would have (I agree with Briggs this is dubious technique, but seems one of the better available quantitative 'best guesses'). Reading your funnel plot, the limit value is around 0.15 ~ 4x lower than the random effects estimate. Your output suggests it is higher (0.26), which I guess is owed to a multilevel model rather than the simpler one in the forest and funnel plots, but either way is ~2x lower than the previous 't=0' intercept values. 

These are substantial corrections, and probably should be made urgently to the published analysis (given donors may be relying upon it for donation decisions).

2. As it looks like 'study size' is the best predictor of heterogeneity so far discovered, there's a natural fear that previous coefficient estimates for time decay and SM-intervention-like properties are confounded by it. So the overall correction to calculated impact could be greater than flat a 50-75% discount, if the less resilient coefficients 'go the wrong way' when this factor is controlled. I would speculate adding this in would give a further discount, albeit a (relatively) mild one: it is plausible that study size collides with time decay (so controlling results in somewhat greater persistence), but I would suspect the SM-trait coefficients go down markedly, so the MR including them would no longer give ~80% larger effects.

Perhaps the natural thing would be including study size/precision as a coefficient in the metaregressions (e.g. adding on to model 5), and using these coefficients (rather than univariate analysis previous done for time decay) in the analysis (again, pace the health warnings Briggs would likely provide). Again, this seems a matter of some importance, given the material risk of upending the previously published analysis.

3. As perhaps goes without saying, seeing a lot of statistical evidence for publication bias and p-hacking in the literature probably should lead one to regard outliers with even greater suspicion - both because they are even greater outliers versus the (best guess) 'real' average effect, and because the prior analysis gives an adverse prior of what is really driving the impressive results.

It is worth noting that the strongminds recommendation is surprisingly insensitive to the MR results, despite comprising the bulk of the analysis. With the guestimate as-is, SM removes roughly 12SDs (SD-years, I take it) of depression for 1k. When I set the effect sizes of the metaregressions to zero, the guestimate still spits out an estimate SM removes 7.1SDs for 1k (so roughly '7x more effective than givedirectly). This suggests that the ~5 individual small studies are sufficient for the evaluation to give the nod to SM even if (e.g.) the metaanalysis found no impact of psychotherapy.

I take this to be diagnostic the integration of information in evaluation  is not working as it should. Perhaps the Bayesian thing to do is to further discount these studies given they are increasingly discordant from the (corrected) metaregression results, and their apparently high risk of bias given the literature they emerge from. There should surely be some non-negative value of the meta-analysis effect size which reverses the recommendation.

#

Back to the second order stuff. I'd take this episode as a qualified defence of the 'old fashioned way of doing things'. There are two benefits in being aiming towards higher standards of rigour.

First, sometimes the conventions are valuable guard rails. Shortcuts may not just add expected noise, but add expected bias. Or, another way of looking at it, the evidential value of the work could be very concave with 'study quality'. 

These things can be subtle. One example I haven't previously mentioned on inclusion was the sampling/extraction was incomplete. The first shortcut you took (i.e. culling references from prior meta-analyses) was a fair one - sure, there might be more data to find, but there's not much reason to think this would introduce directional selection with effect size. 

Unfortunately, the second source - references from your attempts to survey the literature on the cost of psychotherapy - we would expect to be biased towards positive effects: the typical study here is a cost-effectiveness assessment, and such assessment is only relevant if the intervention is effective in the first place (if no effect, the cost-effectiveness is zero by definition). Such studies would be expected to ~uniformly report significant positive effects, and thus including this source biases the sample used in the analysis. (And hey, maybe a meta-regression doesn't find 'from this source versus that one' is a significant predictor, but if so I would attribute it more to the literature being so generally pathological rather than cost-effectiveness studies are unbiased samples of effectiveness simpliciter).

Second, following standard practice is a good way of demonstrating you have 'nothing up your sleeve': that you didn't keep re-analysing until you found results you liked, or selectively reporting results to favour a pre-written bottom line. Although I appreciate this analysis was written before the Simeon's critique, prior to this one may worry that HLI, given its organisational position on wellbeing etc. would really like to find an intervention that 'beats' orthodox recommendations, and this could act as a finger on the scale of their assessments. (cf. ACE's various shortcomings back in the day)

It is unfortunate that this analysis is not so much 'avoiding even the appearance of impropriety' but 'looking a bit sus'. My experience so far has been further investigation into something or other in the analysis typically reveals a shortcoming (and these shortcomings tend to point in the 'favouring psychotherapy/SM' direction). 

To give some examples:

  • That something is up (i.e. huge hetereogeneity, huge small study effects) with the data can be seen on the forest plot (and definitely in the funnel plot). It is odd to skip these figures and basic assessment before launching into a much more elaborate multi-level metaregression.
  • It is also odd to have an extensive discussion of publication bias (up to and including ones own attempt to make a rubric to correct for it) without doing the normal funnel plot +/- tests for small study effects.
  • Even if you didn't look for it, metareg in R will confront you with heterogeneity estimates for all your models in its output (cf.). One should naturally expect curiosity (or alarm) on finding >90% heterogeneity, which I suspect stays around or >90% even with the most expansive meta-regressions. Not only are these not reported in the write-up, but in the R outputs provided (e.g. here) these parts of the results have been cropped out.  This was mistaken; mea maxima culpa.
  • Mentioning prior sensitivity analyses which didn't make the cut for the write-up invites wondering what else got left in the file-drawer.

Hi Gregory, I wanted to respond quickly on a few points. A longer respond about what I see as the biggest issue (is our analysis overestimating the effects of psychotherapy and StrongMinds by =< 2x??) may take a bit longer as I think about this and run some analyses as wifi permits (I'm currently climbing in Mexico). 

This is really useful stuff, and I think I understand where you're coming from. 

I'd take this episode as a qualified defence of the 'old fashioned way of doing things'.

FWIW, as I think I've expressed elsewhere, I think I went too far trying to build a newer better wheel for this analysis, and we've planned on doing a traditional systematic review and meta-analysis of psychotherapy in LMICs since the fall. 

  • It is also odd to have an extensive discussion of publication bias (up to and including ones own attempt to make a rubric to correct for it) without doing the normal funnel plot +/- tests for small study effects.

I get it, and while I could do some more self flagellation on behalf of my former hubris at pursuing this rubric, I'll temporarily refrain and point out that small study effects were incorporated as a discount against psychotherapy -- they just didn't end up being very big. 

  • Even if you didn't look for it, metareg in R will confront you with heterogeneity estimates for all your models in its output (cf.). One should naturally expect curiosity (or alarm) on finding >90% heterogeneity, which I suspect stays around or >90% even with the most expansive meta-regressions. Not only are these not reported in the write-up, but in the R outputs provided (e.g. here) these parts of the results have been cropped out. 

But it doesn't do that if you 1. aren't using metareg or 2. are using multi-level models. Here's the full output from the metafor::rma.mv() call I was hiding. 

It contains a Q test for heterogeneity, which flags statistically significant heterogeneity. What does this mean? I'll quote from the text we've referenced

Cochran’s Q increases both when the number of studies increases, and when the precision (i.e. the sample size of a study) increases.

Therefore Q,  and whether it is significant highly depends on the size of your meta-analysis, and thus its statistical power. We should therefore not only rely on Q, and particularly the Q-test, when assessing between-study heterogeneity.

It also reports sigma^2 which should be equivalent to the tau^2 / tau statistic which "quantifies the variance of the true effect sizes underlying our data." We can use it to create a 95% CI for the true effect of the intercept, which is: 

> 0.58 - (1.96 * 0.3996) =  -0.203216

 > 0.58 + (1.96 * 0.3996) = 1.363216

This is similar to what we find we calculate the prediction intervals (-0.2692, 1.4225). Quoting the text again regarding prediction intervals:

Prediction intervals give us a range into which we can expect the effects of future studies to fall based on present evidence.

Say that our prediction interval lies completely on the “positive” side favoring the intervention. This means that, despite varying effects, the intervention is expected to be beneficial in the future across the contexts we studied. If the prediction interval includes zero, we can be less sure about this, although it should be noted that broad prediction intervals are quite common.

Commenting on the emphasized section, the key thing I've tried to keep in mind "is how does the psychotherapy evidence base / meta-analysis  compare to the cash transfer evidence base / meta-analysis / CEA?". So while the prediction interval for psychotherapy contains negative values, which is typically seen as a sign of high heterogeneity, it also did so in the cash transfers meta-analysis. So I'm not quite sure what to make of the magnitude or qualitative difference in heterogeneity, which I've assumed is the relevant feature. 

I guess a general point is that calculating and assessing heterogeneity is not straightforward, especially for multi-level models. Now, while one could argue we used multi-level models as part of our nefarious plan to pull the wool over folks eyes, that's just not the case. It just seems like the appropriate way to account dependency introduced by including multiple timepoints in a study, which seems necessary to avoid basing our estimates of how long the effects last on guesswork.  

  • That something is up (i.e. huge hetereogeneity, huge small study effects) with the data can be seen on the forest plot (and definitely in the funnel plot). It is odd to skip these figures and basic assessment before launching into a much more elaborate multi-level metaregression.

Understandable, but for a bit of context -- we also didn't get into the meta-analytic diagnostics in our CEA of cash transfers. While my co-authors and I did this stuff in the meta-analysis the CEA was based on, I didn't feel like I had time to put everything in both CEAs, explain it, and finish both CEAs before 2021 ended (which we saw as important for continuing to exist) -- especially after wasting precious time on my quest to be clever (see bias rubric in appendix C).  Doing the full meta-analysis for cash transfers took up the better part of a year, and we couldn't afford to do that again. So I thought that broadly mirroring the CEA I did for cash transfers was a way to "cut to the chase". I saw the meta-analysis as a way to get an input to the CEA, and I was trying to do the 20% (with a meta-analysis in ~3 months rather than a year) . I'm not saying that this absolves me, but it's certainly context for the tunnel vision. 

  • Mentioning prior sensitivity analyses which didn't make the cut for the write-up invites wondering what else got left in the file-drawer.

Fair point! This is an omission I hope to remedy in due course. In the mean time, I'll try and respond with some more detailed comments about correcting for publication bias -- which I expect is also not as straightforward as it may sound. 

Hello Joel,

0) My bad re rma.rv output, sorry. I've corrected the offending section. (I'll return to some second order matters later).

1) I imagine climbing in Mexico is more pleasant than arguing statistical methods on the internet, so I've attempted to save you at least some time on the latter by attempting to replicate your analysis myself.

This attempt was only partially successful: I took the 'Lay or Group cleaner' sheet and (per previous comments) flipped the signs where necessary so only Houshofer et al. shows a negative effect. Plugging this into R means I get basically identical results for the forest plot (RE mean 0.50 versus 0.51) and funnel plot (Eggers lim value 0.2671 vs. 0.2670). I get broadly similar but discordant values for the univariate linear and exp decay, as well as model 1 in table 2 [henceforth 'model 3']  (intercepts and coefficients ~ within a standard error of the write-up's figures), and much more discordant values for the others in table 2. 

I expect this 'failure to fully replicate' is mostly owed to a mix of i) very small discrepancies between the datasets we are working off are likely to be amplified in more complex analysis than simpler forest plots etc. ii) I'd guess the covariates would be much more discrepant, and there are more degrees of freedom in how they could be incorporated, so it is much more likely we aren't doing exactly the same thing (e.g. 'Layness'  in my sheet seems to be ordinal - values of 0-3 depending on how well trained the provider was, whilst the table suggests it was coded  as categorical (trained or not)in the original analysis. Hopefully it is 'close enough' for at least some indicative trends not to be operator error. In the spirit of qualified reassurance here's my funnel plot: 

2) Per above, one of the things I wanted to check is whether indeed you see large drops in effect size when you control for small studies/publication bias/etc. You can't neatly merge (e.g.) Egger into meta-regression (at least, I can't), but I can add in study standard error as a moderator. Although there would be many misgivings of doing this vs. (e.g.) some transformation (although I expect working harder to linearize etc. would accentuate any effects), there are two benefits: i) extremely simple, ii) it also means the intercept value is where SE = 0, and so gives an estimate of what a hypothetical maximally sized study would suggest.

 Adding in SE as a moderator reduces the intercept effect size by roughly half (model 1: 0.51 -> 0.25; model 2: 0.42 -> 0.23; model 3: 0.69 ->0.36). SE inclusion has ~no effect on the exponential model time decay coefficient, but does seem to confound the linear decay coefficient (effect size down by a third, so no longer a significant predictor) and the single group or individual variable I thought I could helpfully look at (down by ~20%). I take this as suggestive there is significant confounding of results by small study effects, and bayesian best guess correction is somewhere around a 50% discount.

3) As previously mentioned, if you plug this into the guestimate you do not materially change the CEA (roughly 12x to 9x if you halve the effect sizes), but this is because this CEA will return strongminds at least seven times better than cash transfers even if the effect size in the MRAs are set to zero. I did wonder how negative the estimate would have to be to change the analysis, but the gears in the guestimate include logs so a lot of it errors if you feed in negative values. I fear though, if it were adapted, it would give absurd results (e.g. still recommending strongminds even if the MRAs found psychotherapy exacerbated depression more than serious adverse life events).

4) To have an empty file-drawer, I also looked at 'source' to see whether cost survey studies gave higher effects due to the selection bias noted above. No: non-significantly numerically lower.

5) So it looks like the publication bias is much higher than estimated in the write-up: more 50% than 15%.  I fear part of the reason for this discrepancy is the approach taken in Table A.2 is likely methodologically and conceptually unsound. I'm not aware of a similar method in the literature, but it sounds like what you did is linearly (?meta)regress g on N for the metaPsy dataset (at least, I get similar figures when I do this, although my coefficient is 10x larger). If so, this doesn't make a lot of sense to me - SE is non-linear in N, the coefficient doesn't limit appropriately (e.g. an infinitely large study has +inf or -inf effects depending on which side of zero the coefficient is), and you're also extrapolating greatly out of sample for the correction between average study sizes. The largest study in MetaPsy is ~800 (I see two points on my plot above 650), but you are taking the difference of N values at ~630 and ~2700.

Even more importantly, it is very odd to use a third set of studies to make the estimate versus the two literatures you are evaluating (given an objective is to compare the evidence bases, why not investigate them directly?) Treating them alike also assumes they share the same degree of small study effects - there are just at different points 'along the line' because one tends to have bigger studies than the other. It would seem reasonable to consider that the fields may differ in their susceptibility to publication bias and p-hacking, so - controlling for N - cash transfer studies are less biased than psychotherapy ones. As we see from the respective forest plots, this is clearly the case - the regression slope for psychotherapy is like 10x or something as slope-y as the one for cash transfers.

(As a side note, MetaPsy lets you shove all of their studies into a forest plot, which looks approximately as asymmetric as the one from the present analysis:) 

Plot object

6) Back to the meta stuff.

I don't suspect either you or HLI of nefarious or deceptive behaviour (besides priors, this is strongly ruled against by publishing data that folks could analyse for themselves). But I do suspect partiality and imperfect intellectual honesty. By loose analogy, rather than a football referee who is (hopefully) unbiased but perhaps error prone, this is more like the manager of one of the teams claiming "obviously" their side got the rough end of the refereeing decisions (maybe more error prone in general, definitely more likely to make mistakes favouring one 'side', but plausibly/probably sincere), but not like (e.g.)  a player cynically diving to try and win a penalty. In other words, I suspect - if anything - you mostly pulled the wool over your own eyes, without really meaning to.

One reason this arises is, unfortunately, the more I look into things the more cause for concern I find. Moreover, the direction of concern re. these questionable-to-dubious analysis choices strongly tend in the direction of favouring the intervention. Maybe I see what I want to, but can't think of many cases where the analysis was surprisingly incurious about a consideration which would likely result in the effect size being adjusted upwards, nor where a concern about accuracy and generalizability could be further allayed with an alternative statistical technique (one minor example of the latter - it looks like you coded Mid and Low therapy as categoricals when testing sensitivity to therapyness: if you ordered them I expect you'd get a significant test for trend).

I'm sorry again for mistaking the output you were getting, but - respectfully - it still seems a bit sus. It is not like one should have had a low index of suspicion for lots of heterogeneity given how permissively you were including studies; although Q is not an oracular test statistic, P<0.001 should be an prompt to look at this further (especially as you can look at how Q changes when you add in covariates, and lack of great improvement when you do is a further signal); and presumably the very low R2 values mentioned earlier would be another indicator. 

Although meta-analysis as a whole is arduous, knocking up a forest and funnel plot to have a look (e.g. whether one should indeed use random vs. fixed effects, given one argument for the latter is they are less sensitive to small study effects) is much easier: I would have no chance of doing any of this statistical assessment without all your work getting the data in the first place; with it, I got the (low-quality, but informative) plots in well under an hour, and do what you've read above took a morning.  

I had the luxury of not being on a deadline, but I'm afraid a remark like "I didn't feel like I had time to put everything in both CEAs, explain it, and finish both CEAs before 2021 ended (which we saw as important for continuing to exist)" inspires sympathy but not reassurance on objectivity. I would guess HLI would have seen not only the quality and timeliness of the CEAs as important to its continued existence, but also the substantive conclusions they made: "We find the intervention we've discovered is X times better than cash transfers, and credibly better than Givewell recs" seems much better in that regard than (e.g.) "We find the intervention we previously discovered and recommended, now seems inferior to cash transfers - leave alone Givewell top charities - by the lights of our own further assessment".  

Besides being less pleasant, speculating over intentions is much less informative than the actual work itself. I look forward to any further thoughts you have on whether I am on the right track re. correction for small study effects, and I hope future work will indeed show this intervention is indeed as promising as your original analysis suggests.  

Curated and popular this week
Relevant opportunities