Executive summary: A new analysis estimates the duration of psychotherapy's impact on depression to be around 1 year 4 months, much shorter than previous estimates of 3-4 years. This translates to a duration multiplier of 0.56.
Key points:
Based on relapse rates after successful treatment and spontaneous remission rates, benefits appear to converge around 1 year 4 months after therapy.
This translates to a duration multiplier of 0.56 with linear decay, much lower than previous estimates of 1.7-2.16.
The analysis relies on observational data, avoiding some biases inherent in RCTs, but still has uncertainties.
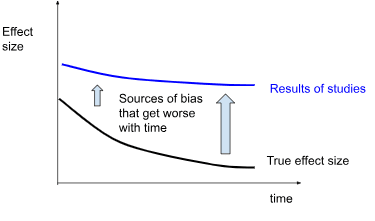
Prior estimates may be inflated by biased study design in RCTs measuring long-term impacts.
The final estimate includes a 90% adjustment for suspected optimism. Without it, the raw multiplier would be 0.625.
While not highly robust, the estimate is probably accurate within a factor of 2.
This comment was auto-generated by the EA Forum Team. Feel free to point out issues with this summary by replying to the comment, andcontact us if you have feedback.
StrongMinds (4 of 9) - Psychotherapy's impact may be shorter lived than previously estimated — EA Forum
StrongMinds (4 of 9) - Psychotherapy's impact may be shorter lived than previously estimated
This is a crosspost from the new Animal Welfare Alignment Newsletter by Anima International. You can subscribe on Substack if you are interested in following these efforts. Audio reading also available on Substack.
The goals of this post are to:
1. Raise a question I see as crucially important to the goal of aligning AI to animal welfare...
“How long have you been v*g*n?”
This is one of the most common icebreakers at animal protection events. It’s a baseline assumption, and it mostly holds true: if you’re out advocating for animals not to be tortured or abused, realistically these days you are v**n, or close. And it makes for good conversation. It seems fairly safe to assume when you meet strangers.
But this assumption is hurting the movement in a way which we don’t always notice: someone new comes into the sp...
Summary
Back in November 2023 I posted here to launch Spiro and raise our first $198k. Two and a half years later this is an update and a fundraiser for the next step.
The short version: we've now reached over-5,900 people with TB preventive medicine, including over 3,000 children under five years old. Our early results have held up well an...
This post: Psychotherapy's impact may be shorter lived than previously estimated
Executive summary
This article estimates the duration multiplier for psychotherapy. The duration multiplier is the number you multiply the initial effect size by in order to get a figure which reflects both the magnitude of the effect and its duration, in standard-deviation years.
We estimate that the duration multiplier on psychotherapy is 0.56, much lower than HLI's duration multiplier of 2.16 and GiveWell's duration multiplier of 1.70.
We projected that the difference between patients successfully healed from depression following psychotherapy and untreated patients converges to zero around 1.25 years after the intervention, or about 1 year and four months. This translates to a 1.25/2=0.625 duration multiplier. We further multiply this by a subjective 90% adjustment to account for ways in which our estimate may be too optimistic to arrive at 0.56.
[Update: In their newest report, HLI McGuire 2023, estimates a duration multiplier of 1.93, which is still on the optimistic end compared to ours]
Our estimate draws from existing academic meta-analyses on spontaneous remission and post-treatment relapse rates. We developed tools to convert remission and relapse rates into effect sizes, and then estimated the duration multiplier by determining where successfully treated but relapsing patients and spontaneously remitting untreated patients converged. This approximately corresponds to the point where 1-relapse rates for untreated patients are equal to remission rates for treated formerly cured patients.
The quality of our data suffers from several problems, including:
Risks of excessive optimism
Remission data comes from patients who had once fully recovered, and are therefore better off than the average psychotherapy patient. (This is partially mitigated by signs that they regress to the mean fairly quickly)
Risk of excessive pessimism
Spontaneous remission data uses "care as usual" control groups for later time points but "waitlisted" patients for earlier time points (but removing later time points creates similar results, mitigating this concern)
In theory, relapse rates for cured patients should not exceed remission rates for untreated patients, but in some studies they do, suggesting the potential for greater pessimism than theoretically permitted. However, adding context from other studies partially mitigates this concern.
General sources of uncertainty
We assume linear decay because it makes more sense given our model, but exponential decay is more common in nature.
We had to create a non-standard methodology for producing this estimate, and don't have the benefit of a body of knowledge regarding how it could be misleading.
The quality of available longitudinal data in this area is generally low.
Our 90% adjustment reflects a subjective intuition that the factor leaning towards excessive optimism slightly outweighs factors leading to excessive pessimism.
We therefore do not consider this estimate to be very robust, and anticipate that it might change substantially upon deeper analysis.
HLI's (and therefore GiveWell's) estimate is drawn from a meta-regression of effect sizes from studies taken at different time points. We are concerned that longer longitudinal studies are at greater risk of bias, inflating the estimate beyond what is plausible considering the spontaneous remission rates of untreated depression and the remission rates of successfully treated depression.
Our methodology (which relies on observational data for relapse and remission) does not suffer from some of these risks of bias inherent to RCTs, such as those related to lack of randomization and blinding. It is still susceptible to risks related to selective dropout and publication bias, as well as new issues related to directly combining results from different studies with different study designs and populations.
The Rate of Decay After Therapy
Previously, we quantified the impact of psychotherapy on depression immediately after the administration of treatment. But the impact of subjective well-being interventions cannot be understood as occurring only over a single point in time. How long the benefits last plays a key role in how impactful the intervention is.
Unfortunately, there is very little data regarding how long psychotherapy interventions last. We are in a position of being relatively more certain about the immediate effect, but are almost entirely in the dark about the duration of the effect, though the latter factor plays a huge role in the impact.
This article is a review of existing literature on decay rates. Our conclusion is roughly that all the existing literature is insufficient to form a confident estimate, but that the positive effects of a course of psychotherapy will become negligible relative to a control group about 1.25 years after the intervention, or about 1 year and four months. If we assume this effect decays linearly, it means that the immediate effect size of therapy should be multiplied by 1.25/2= 0.625 in order to get the total effect in SD-years. We estimate duration by estimating when spontaneous remission rates in untreated patients and relapse rates from formerly cured treated patients converged. We do not consider this estimate robust, and anticipate that it would change upon deeper analysis. We've added a 90% adjustment to reflect our intuition that our methods may be yielding a slight overestimate, for a final number of 0.56.
This is shorter than previous estimates of 1.70 GiveWell, Cohen (2023) and2.16 by McGuire, J. (2021b)[1], which are based on meta-regressions of effect size over time. We think that effect sizes over time are vulnerable to risk of bias in study design, especially over long time periods, and that observational studies of remission and relapse rates may be less vulnerable to some of these effects.
[Update: A new report, HLI McGuire 2023, which estimates a duration multiplier of 1.93, has recently been published. We are still reviewing it, but will insert notes in this document regarding the new report where relevant. This document was written prior to that document's publication, and references to "HLI's estimates" generally refer to findings from McGuire, (2021a);McGuire, J. (2021b) unless explicitly stated]
Using remission and relapse rates to estimate decay rates
We came to this conclusion based on existing academic meta-analyses on spontaneous remission and post-treatment relapse rates. Spontaneous remission means “getting better without any treatment” and post-treatment relapse refers to getting ill again after treatment. We converted both remission rates and relapse rates into effect sizes, and then estimated when the two effect sizes were likely to converge.
Remission rates
Remission refers to when a patient is considered no longer depressed. Most cases of depression resolve without treatment. Despite estimates of lifetime depression prevalence ranging from 13-40%, only 2%-6% of people are estimated to have depression in any given year
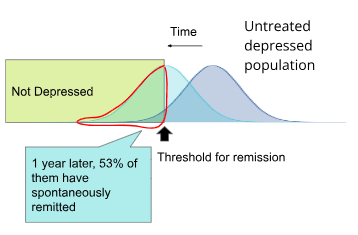
Based on a meta-analysis by Whiteford et al. (2013), which looked at studies from high income countries, 53% of untreated patients spontaneously remit per year.
Figure - Spontaneous remission rate: A meta-analysis by Whiteford et al. (2013) estimates that 53% of patients with major depressive disorder are no longer depressed 1 year later.[2]
We previously developed tools to convert these remission rates into effect sizes. Using these methods, we determined that assuming a normal distribution with a consistent standard deviation, in order to see this remission rate the average patient's depression scores must have dropped to 51% of what they were the previous year.
Figure - spontaneous remission in SDs: We developed methods to convert remission rates from Whiteford et al. (2013) back into the average patient's depression questionnaire scores, expressed here in standard-deviations from zero. For comparison, we have added our estimate of what the average American's depression score would be from Villarroel et al, 2019 (after doing a correction for floor effects to account for the fact that some people's true score is lower than zero which are described in the appendix, we estimate the average American's level of depression to be 0.29 SDs from zero.)
In this model, Whiteford et al. (2013) patients begin with a level of depression 2.43 SDs from zero, and their depression level reduces by 51% per year. According to the model, they would converge with the general population score of 0.29 SDs from zero after 3.16 years, with each individual experiencing a cumulative 3.19 SD-years more depression than the general population.
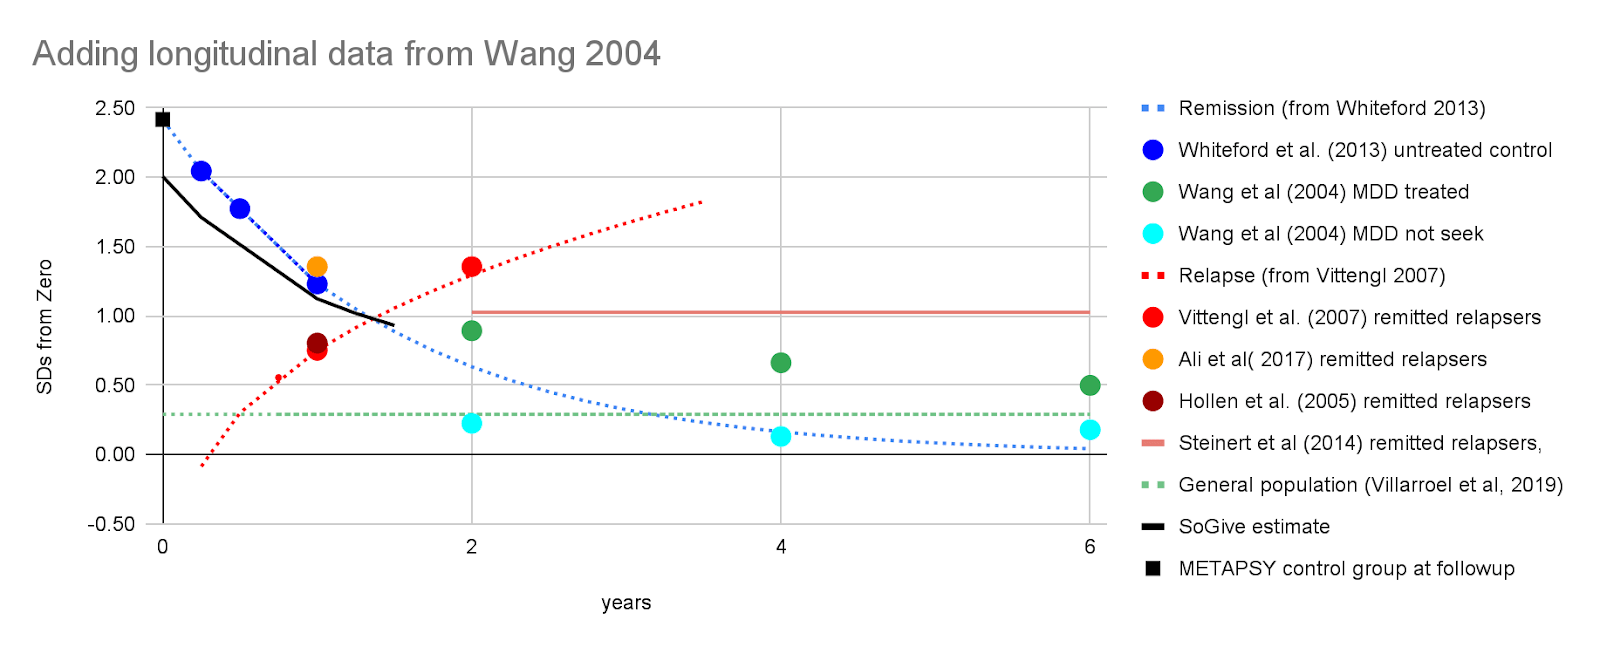
To supplement our prediction with additional data, we've added longitudinal remission data from Wang et al (2004) on patients who had major depressive disorder, separated by those who did or did not seek treatment. Individuals who did seek treatment were less likely to remit than those who did not, presumably for reasons related to self-selection where people who have greater need of treatment may be more likely to seek it.
Figure - Spontaneous remission in context: Spontaneous remission in SDs of depression calculated from Whiteford et al. (2013) is extended using an exponential decay model, and then juxtaposed with data points from Wang et al (2004) as well as with the rate of depression in the general population. A rough depiction of where GiveWell and HLI would have considered the benefits to have gone to zero if they had used a linear model is included (bearing in mind that they in fact used an exponential model, which never goes to zero).
GiveWell, Cohen (2023) andHLI, McGuire (2021a) estimate duration multipliers of 1.7 and 2.16, respectively. To a very rough approximation (glossing over details like that GW 2023 and HLI 2021 did exponential and not linear modelling), this means that they think non-negligible benefits continue something like 1.7×2=3.4 and 2.16×2=4.32 years out.
We're not necessarily ruling out the possibility of this, but we think that it's helpful for intuitions to juxtapose the proposed multipliers with how long the typical case of depression actually lasts to illustrate the optimistic seeming nature of this guess.
Relapse rates
Relapse refers to when a patient remits from depression, and then becomes depressed again. We use the rates at which people who are successfully treated for depression using psychotherapy relapse back into depression in order to further bring down our upper bound estimate of the duration of psychotherapy's effectiveness.
A meta analysis by Vittengl et al. (2007) reported a relapse rate of 29% in the first year and 54% in the second year. A meta analysis by Steinert et al (2014) found a relapse rate of 39% (95% CI 0.29, 0.50) for studies which followed up more than two years later.
While there are many longitudinal studies, only two of those report a large number of points. After pulling recovered patients out of cognitive therapy, Ali et al( 2017) found a 53% relapse rate per year, while Hollen et al. (2005) found a relapse rate of 30.8% per year among patients discontinuing regular cognitive therapy but having 3 "booster" sessions available as necessary during the followup period. The shape of these curves seems to validate HLI, McGuire 2021a's choice to model it as exponential rather than linear decay.
Figure - Relapse rates: Relapse rates for Ali et al( 2017) on left, and Hollen et al. (2005) on right over time. On the right, the white circles "prior CT group" was the one pulled out of cognitive therapy for followup, with three booster sessions available. (The other groups displayed for comparison were - "placebo": patients withdrawn from antidepressant medication and prescribed placebos, "cADM": patients prescribed continuing antidepressant medication, and "adhere cADM": the subset of patients who faithfully took medications when prescribed).
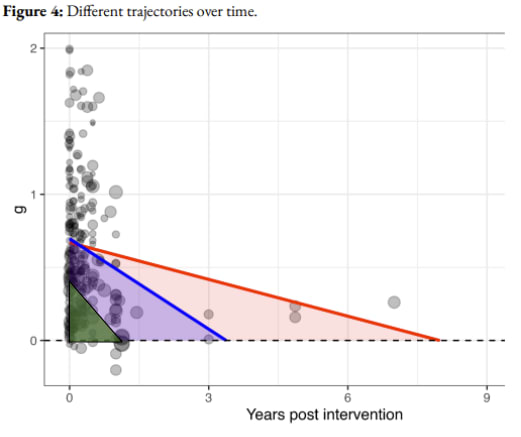
Based on these data, we decided to use Vittengl et al. (2007)'s 29% relapse rate in our models. After applying our tools to convert between relapse rate and effect size, we found that the projects from Vittengl et al. (2007) and Whiteford et al. (2013) converge at 1.25 years, which suggests that the effects of psychotherapy go to approximately zero around then.
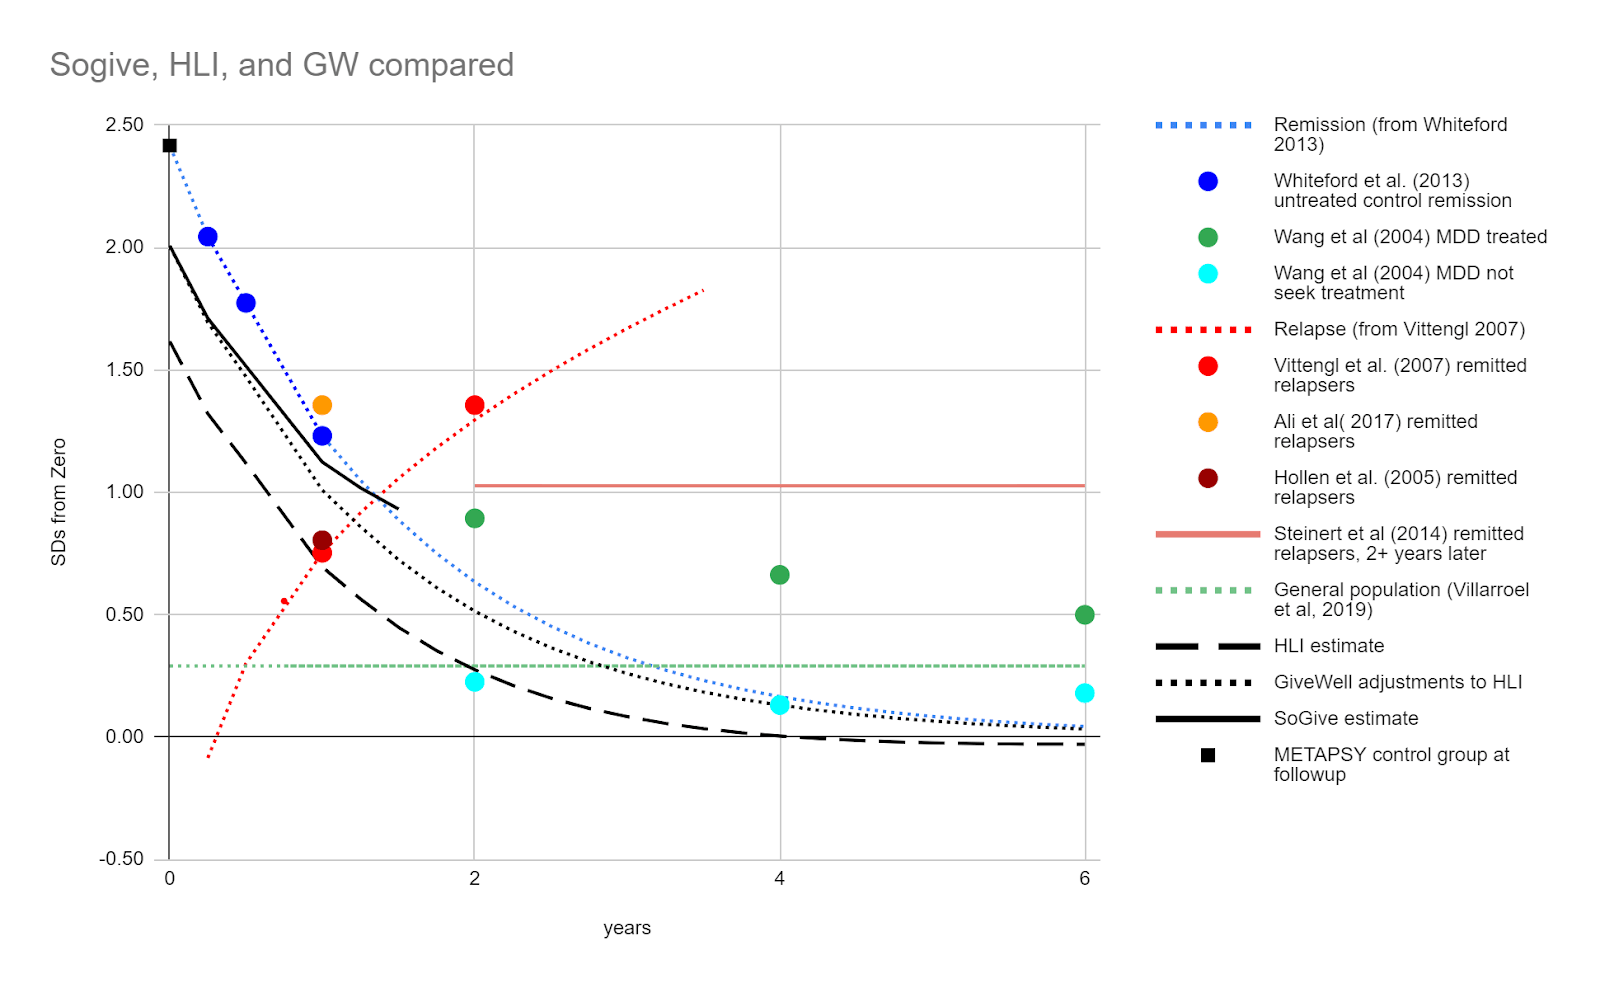
Figure- Remission and relapse in SDs juxtaposed: We converted remission rates from Vittengl et al. (2007) and relapse rates from Whiteford et al. (2013) into effect sizes and found that our projections converge at 1.25 years. We modelled linear decay to reach zero at this point, starting from an effect size of 0.41. SoGive's model of what is happening to treated patients after the intervention ends is illustrated with a solid black line. The score of the general population is illustrated with a dashed green line. As a sanity check, the average distance METAPSY control group depression scores after followup from zero is illustrated by a black square - it is roughly where we would expect it to be given the remission rates in Whiteford et al. (2013).
This led us to our final estimate, that the duration multiplier for psychotherapy is probably equal to or lower than 1.25/2 = 0.625. Because we think it's more likely that it's lower, we added a 90% adjustment to get 0.56. This is substantially lower than HLI's duration multiplier of 2.16 and GiveWell's duration multiplier of 1.70.
While we use a combination of remission rates from Vittengl et al. (2007) and relapse rates from Whiteford et al. (2013) to generate our headline result, we can use further data from other studies to put things into context and increase confidence in our estimate, and understand the considerations which might sway one to be more pessimistic or more optimistic.
Critiques where the model might be too pessimistic
For some time points, either remission is too high, or relapse is too low.
Theoretically, formerly recovered treated patients should always be better off than untreated patients at all time points, and approximately 1-recovered relapse rate > spontaneous remission rate should be true at all time points.
It's therefore notable that in year 2, formerly recovered treated patients who relapse from Vittengl et al. (2007) are more depressed than our exponential decay model of spontaneous remission from Whiteford et al. (2013) predict that they should be. We looked at some additional studies of relapse after treatment and remission to get a clearer picture.
Figure - sometimes combining relapse rates from one study and remission rates from another yields figures that are more pessimistic than is theoretically plausible: Estimated SDs of depression for treated and remitted relapsers from Vittengl et al. (2007) (2 year mark), and Ali et al( 2017) (1 year mark) are higher than those from the spontaneously remitting control groups from Whiteford et al. (2013) at the same time points. Such results shouldn't happen, since treatment shouldn't have a negative effect, suggesting that either Whiteford et al. (2013) overestimates remission rates or Vittengl et al. (2007) (2 year mark), or Ali et al( 2017) (1 year mark) overestimate relapse rates. Both of these errors suggest that we risk being too pessimistic.
However, longitudinal data from Steinert et al (2014) on remitted relapsers suggests that over time points longer than two years, treated relapsed remitters do stabilise around the point where we would expect from our model. This partially mitigates our concern.
Whiteford et al. (2013) uses waitlist control samples at earlier time points, and "care as usual" control samples at later time points, which could cause an overestimate of spontaneous remission.
Whiteford et al. (2013) mixes in primary care populations, where non-treatment is uncontrolled, with waitlist control samples. For instance, the most influential study in the Whiteford et al. (2013) meta-analysis was Wang, 2004, an observational study comparing populations which receive treatment with populations that do not. It is not a randomised control trial intended to observe the effects of treatment, but rather an observational study which illustrates differences between populations that successfully seek out treatment, and populations that choose not to or cannot access treatment.
Wang, 2004 reports that in a 6 year longitudinal observational study of patients with depression, 49.8% of participants who received treatment for depression nevertheless reported major depressive disorder, while only 28.7% of those who were untreated reported the same. This suggests that there may be an extent to which individuals who do not seek out treatment in uncontrolled environments may be accurately assessing that they are likely to spontaneously go into remission and are therefore not seeking treatment. The implication of this is that we cannot consider observational samples of untreated patients who do not necessarily have intention to treat, as identical to waitlist control samples who do have intention to treat.
Figure - Treatment non-seekers have less persistent depression and should not be compared with seekers: Data from Wang, 2004, the most influential study in Whiteford et al. (2013), is added to the chart, with treated patients in green and patients who never sought out treatment in cyan. Never-treated patients have better outcomes - this is not because treatment has a negative effect, but because treatment seekers are a different population than non-seekers (for example they may have less severe cases in the first place, or accurately ascertain that they're likely to remit without treatment).
Nevertheless, Whiteford et al. (2013)has combined waitlist control samples with observational primary care samples. And because the earlier time points appear to be the waitlist-control samples (who are self-selected for agreeing to take treatment), while the later time points refer to observational primary care populations (who are self-selected for not seeking treatment and are therefore likely to be doing better or recovering faster), this overestimate the extent of spontaneous remission.
Figure - Remission rates concerningly mix wait-listed controls with primary care samples which may not have sought treatment. A meta-analysis by Whiteford et al. (2013) estimates the proportion of untreated people still depressed. Wait-listed samples are shown in white, while primary care samples are shown in black.
In the METAPSY sample, control populations which are receiving care as usual at a clinic improve much faster than control populations which are waitlisted. There are competing hypotheses about why this is (e.g. being at a clinic may involve receiving some care, being on a waitlist may lead a person to procrastinate on seeking care elsewhere), but either way, it means there are systematic differences and so using one for an earlier time point and another for a later is problematic.
METAPSY treatment arms - care as usual at clinic control vs waitlisted
Waitlisted controls
Baseline
treatment
control
SDs from zero
3.02
1.62
2.56
Improvement (glass's delta from baseline)
-1.40
-0.46
Care as usual at clinic control
Baseline
treatment
control
SDs from zero
3.66
2.27
2.80
Improvement (glass's delta from baseline)
-1.39
-0.86
The implication is that the remission rate from Whiteford et al. (2013) might beinfluencedby data from primary care samples having a more cared-for control group than data from wait-listed samples, and the true spontaneous remission rate might be much lower than this. In the METAPSY sample this is somewhat offset by the clinic population having more severe cases (and therefore less likely to cross the threshold for remission, despite experiencing greater overall improvement), but we're not sure whether this is the case for the Whiteford et al. (2013) sample.
However, even if we eliminated the data from the primary care samples, eyeballing only the white dots representing weightlisted samples, Whiteford et al. (2013)'s estimate that 23% of untreated depression cases remit within 3 months (suggesting 77% are still depressed at 13 weeks) does fall within the range for those samples. If we assume that the rate of remission stays roughly constant over time, and if that trend were to continue for a year, 77%^4=65%, which is actually an even better remission rate than 53%.
Data is from high income countries, where remission could be faster
Based on our findings in What's the effect size of therapy, we are generally of the opinion that low income countries and high income countries are similar enough for the purpose of our analysis. However, Joel McGuire was concerned that data on "spontaneous remissions" from high income settings would overestimate the rate of remission in low income settings, because people in high income countries have lots of options for alternative forms of care even when outside of trial settings. We think this argument may have some merit - as we have seen, participants in "control groups" tend to do better when they are receiving "care as usual" in a clinical setting. In a high income country, care as usual might consist of quite a bit of care compared to a low income country.
However, a potential counterpoint is that our data concerning rates of relapse among formerly recovered patients is also drawn from high income countries, so arguably this would balance out.
Another potentialy mitigating counterpoint is that our analysis on the effect size of therapy found that although studies in low income countries report higher effect sizes, this difference vanishes after adequately accounting for risk of bias factors. This suggests that the difference between treated patients and untreated controls is not necessarily any wider in low income countries, at least within the context of a randomised trial.
(Update: In light of this consideration, we're currently debating about whether or not to add some subjective factor to the model which rewards working on low income countries or penalizes working in high income ones, on an intuition that high income beneficiaries would be more likely to "counterfactually" get care otherwise. But we decided that if we do adjust for beneficiary counterfactuals, it should be considered as separate issue rather than something to be rolled into the decay model being discussed here.)
Critiques where the model risks being too optimistic
Relapse data describes a selected population of patients who are doing better than the average treated patient: Effect size estimates derived from the population of treated and recovered patients who relapsed involves a population with lower scores than the average RCT participant. The point at which the average fully-recovered treated patient intersects with the average spontaneously remitting untreated patient may be much later than the point at which the average treated RCT patient (who did not fully recover) intersects with the average spontaneously remitting untreated patient. If we were to shift the relapse curve up by 1 sd (the approximate distance between remitted patients and the average treated patient) then the duration multiplier would fall to ×0.5, which is 81% less than ×0.625
However,we think the full 81% adjustment would be too pessimistic, because formerly depressed patients who did not meet the criteria for depression during the initial measurement would likely regress to the mean and become more representative of other patients during the second measurements.
In support of this, longitudinal data on treated patients with major depressive disorder (not limited to those who remit) from Wang, 2004 is similar to longitudinal data on formerly cured patients from Steinert et al (2014) suggests that either our estimated spontaneous remission rate is too high, or that it slows down at later time points. Wang, 2004 interviewed a cohort at outtake, and then 2, 4, and 6 years later found that with 33%, 26%, and 21% of them remitting. This made us hopeful that patients who have once remitted regress to the mean quickly enough to be a good-enough approximation for the time course of all patients who receive treatment (including those who do not remit)
We've modelled the benefit as decaying linearly, rather than exponentially:
Because we did not have a good way to estimate the decay coefficient, we assumed linear decay that intersects at zero at the point at which remitted and relapsed patients seem to converge. It's unclear whether linear vs exponential models leans towards optimism or pessimism (playing around with the parameters suggest that "it depends".)
Most naturalistic phenomena are exponential. The difference between our remission curves and our relapse curves, was close enough to linear for approximation purposes within the relevant time domain, although we don't think this means much about the shape of the underlying phenomenon.
[Update: The new report from HLI McGuire 2023 has opted to use linear decay as well, making the results more directly comparable to ours.]
What might have caused inflation in Happier Lives Institute's duration estimates?
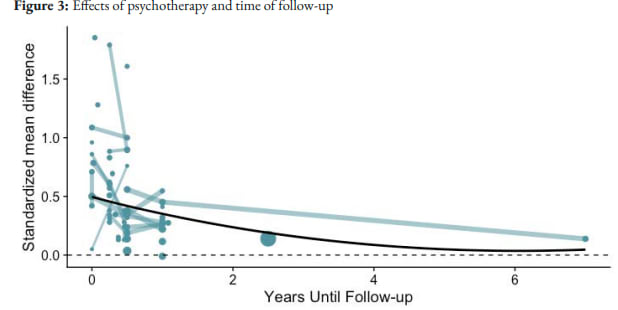
We have previously described how HLI, McGuire (2021a) modelled the impact of therapy over time using the equation EffectSize(t) = d0bt, where d0is the immediate impact of therapy and t is time.
To determine the size of the decay constant b, HLI did a combination of collecting longitudinal studies, and using the fact that studies do not always collect data on effect sizes until a short period of time after the intervention.
Figure from HLI: Cost-Effectiveness Analysis: Group or Task-Shifted Psychotherapy to treat Depression ( McGuire 2021a). Points reflect estimated effects reported in individual studies. Lines connect studies with multiple longitudinal follow-ups. Larger points and lines reflect larger sample sizes.
Based on this, HLI concluded that 71% of the benefits of psychotherapy were retained per year, an estimate which dropped to 67% after including evidence from sources closer to the StrongMinds intervention (HLI, McGuire 2021a, table 3).
GiveWell subsequently adjusted this figure by multiplying it by 80%(suggesting that 54% of the benefits would be retained per year) citing general scepticism but no specific reason.
"We’re somewhat skeptical of HLI’s estimate, given that it seems unlikely to us that a time-limited course of group therapy (4-8 weeks) would have such persistent effects. We also guess that some of the factors that cause StrongMinds’ program to be less effective than programs studied in trials (see above) could also limit how long the benefits of the program endure."
However, we think that much more scepticism than this may be warranted. To give a picture of what kind of data we're looking at, all longitudinal studies in the HLI dataset have been separated out on this table, with their individual decay rate shown.
Authors
Country
n
Months
cohen's d
Decay rate
Note
Baranov et al., 2020
Pakistan, Punjab
818
6
0.559
81.23%
704
12
0.452
585
84
0.138
Rojas et al. 2007
Chile
208
3
0.623
1.56%
208
6
0.22
Araya et al. 2003
Chile
211
3
0.884
107.44%
Not decreasing
211
6
0.9
Bolton et al. 2003
Bass et al., 2006
Uganda
284
0.5
1.852
73.47%
216
6
1.608
Rahman et al., 2019
Pakistan, Swat
598
0.25
0.785
32.09%
577
3
0.605
Fuhr et al., 2019
India
251
3
-0.34
7.86%
251
6
-0.18
Nakimulu-Mpungu et al., 2020
Uganda
1140
6
0.379
34.00%
1140
12
0.221
Lund et al.. 2020
South Africa
384
4
0.346
73.30%
384
13
0.2741
Husain, 2017
Pakistan
216
3
1.79
6.11%
216
6
0.89
Nakimuli-Mpungu, 2015
Uganda
109
0
0.5
231.04%
not decreasing
109
6
0.76
Gureje et al., 2019
Nigeria
686
6
0.189
196.59%
not decreasing
686
12
0.265
Naeem et al., 2015
Pakistan
129
0
0.86
13.42%
false
110
6
0.315
Bass et al. 2013
Congo
405
0
1
84.63%
405
6
1
Cooper et al. 2009
South Africa
449
6
0.24
117.36%
not decreasing
449
12
0.26
Rotheram-Borus et al 2014a
South Africa
1030
0
0.501
109.18%
dropping sample size, odd u shape
766
6
0.345
251
12
0.547
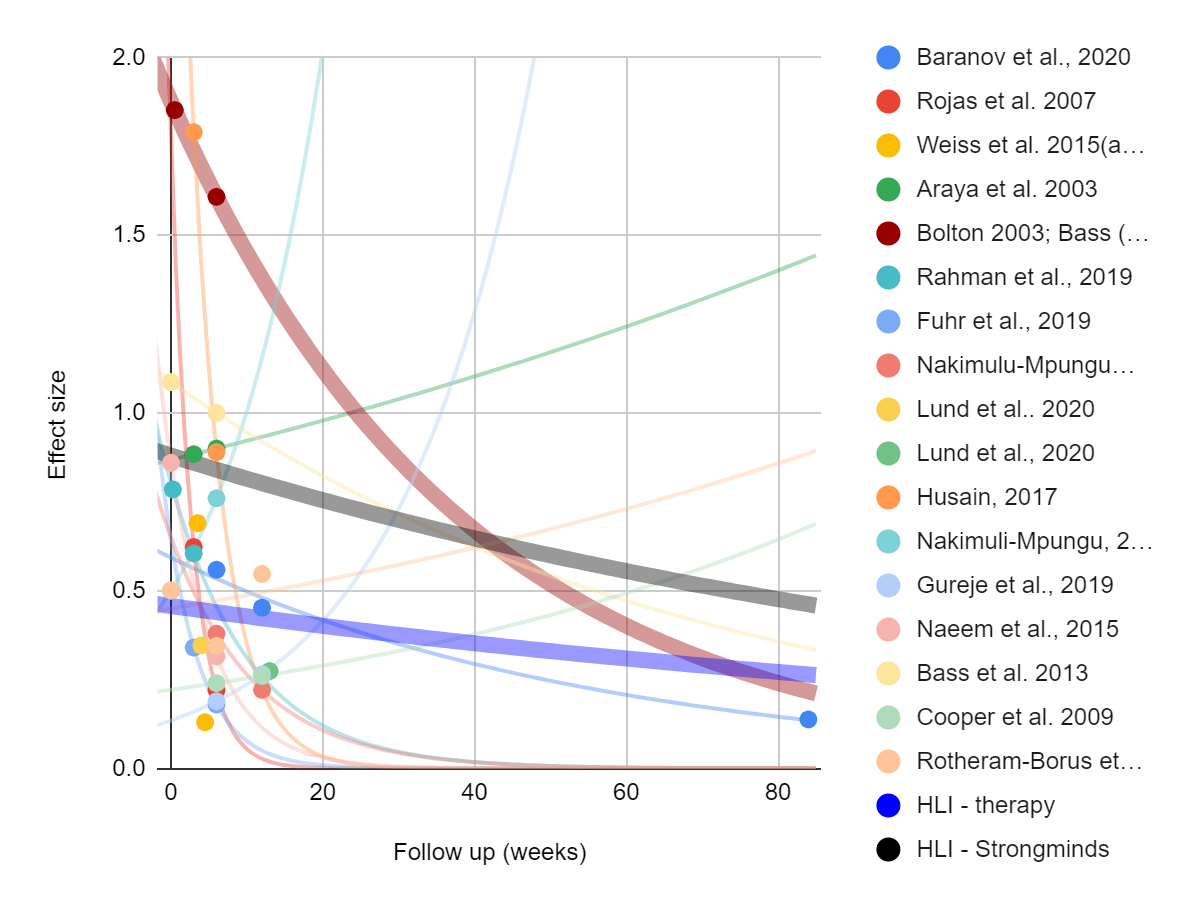
Figure - large diversity in findings from longitudinal studies used by HLI, McGuire 2021b: The following graph is similar to the taken from HLI above, except that all the non-longitudinal studies are removed, and exponential fits are drawn on all the remaining studies to illustrate the longitudinal study trends. Direct evidence from Bolton (2003) and Bass (2006) (red), and what we understand to be HLI's estimates for Psychotherapy more generally (black) and StrongMinds in particular (blue) are shown in thicker lines.
If we’d had more time, we would have investigated meta-regression methodology more deeply, and sought external expertise to support us. However we feel some suspicion that inadequate study design and publication bias factors may inflate results. When we initially eyeball the data, the first thing we notice is that 5 out of the 15 longitudinal studies found that the effect of the intervention increased as time from the intervention passed, despite involving more than 100 participants. While it's not impossible that the impact of psychotherapy increases after the intervention is over, we think that this is more likely a sign of methodological problems. With over a hundred participants in even the smallest study, we don't think this can be attributed to statistical luck - there is probably some sort of systematic bias in those datasets. Our guess is that those particular studies suffer from poor study design, and cannot adequately differentiate the general trend of improvement from improvement that is due to the intervention. Removing those studies doesn't necessarily influence the calculations much, but the fact that the increasing effects finding is so common speaks to general methodological concerns.
In our analysis of the effect size of therapy, removing studies which failed Cochrane's risk of bias criteria such as adequate randomization, double blinding, and intention to treat analysis reduced effect sizes from 0.73 to 0.41 after removing outliers and correcting for publication bias. If such sources of bias distort effect size equally regardless of followup time (e.g. if they inflated both the effect sizes at 5 weeks and at 40 months by 150%) the discount rate would remain un-inflated. However, it seems unlikely that we're lucky enough to be in the happy scenario where near-to-intervention and far-to-intervention observations are equally inflated by all forms of bias.
F0r example, some of the studies in this sample did not do intention to treat[3]. Absence of intention to treat analysis in particular seems like it ought to disproportionately inflate studies with long followup, because intention to treat analysis corrects bias stemming from people who are doing worse dropping out of the intervention, and longer follow up times create more opportunities to drop out. It's also possible that studies with later followup times have different study design characteristics from studies with earlier followup times.
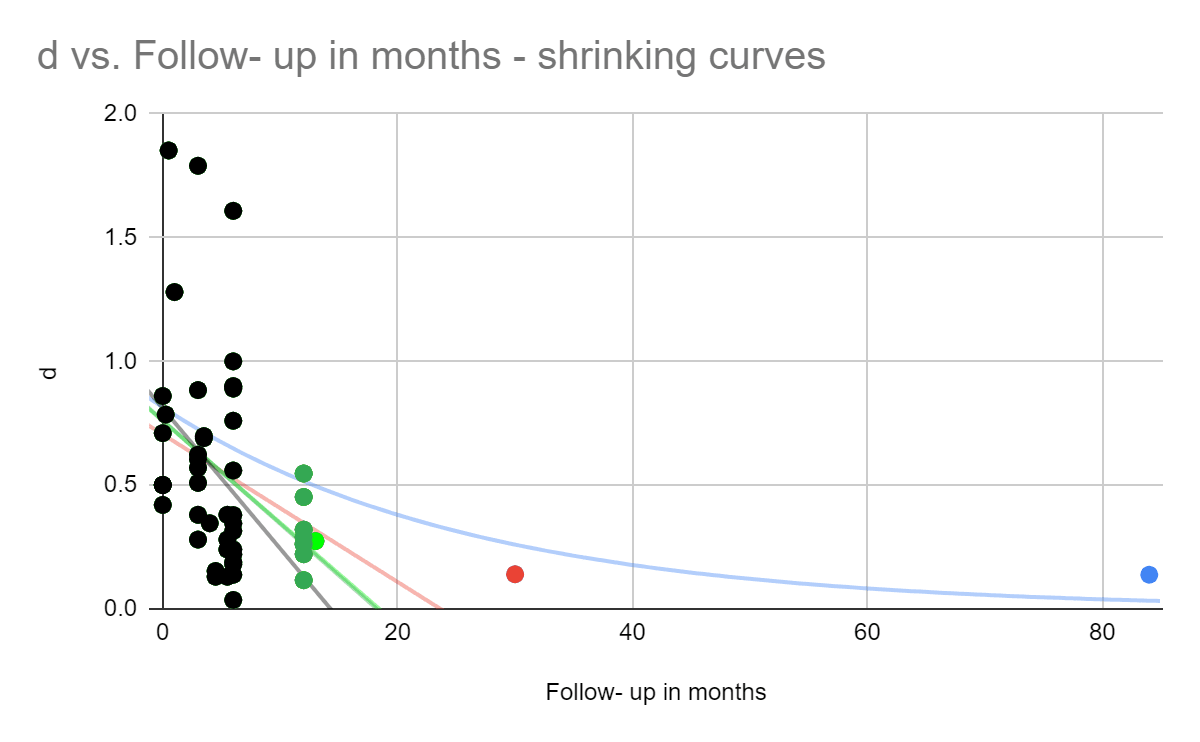
To test this concern, we decided to estimate what might happen to HLI's decay estimate when we eliminate later time points. We weren't able to get a meta-regression running to replicate HLI's result due to a lack of time, so we took the scatterplot of effect sizes and fit them to an exponential curve. This isn't strictly the correct way to do it, because points that have more data behind them should be weighted more, and we had to remove effect sizes below zero (where the intervention made things worse), but in the interest of time we're hoping it's good enough for approximation - we got 75%, similar to HLI’s 71%. However, we notice that if we drop the datapoint which is the most far away in time (that's an 84 month followup from Baranov et al., 2020), it falls to 45%. After dropping the next furthest followup (a 30 month follow up by Tripathy et al. 2010, it drops to 37%. If we continue in this manner and keep dropping away the longest time intervals, we see a trend of the decay curve shrinking, whereas if longitudinal studies weren't optimistically biassed, the decay rate wouldn't reliably shrink as the furthest time points were dropped.
Figure - removing later time points causes shrinking decay curves, an illustration of what happens if you only include studies with <=3 months followup, <-3.5 months followup, and so on. We see that as we include further and further data points (marked in green, red, and blue) the duration of effect curves becomes longer.
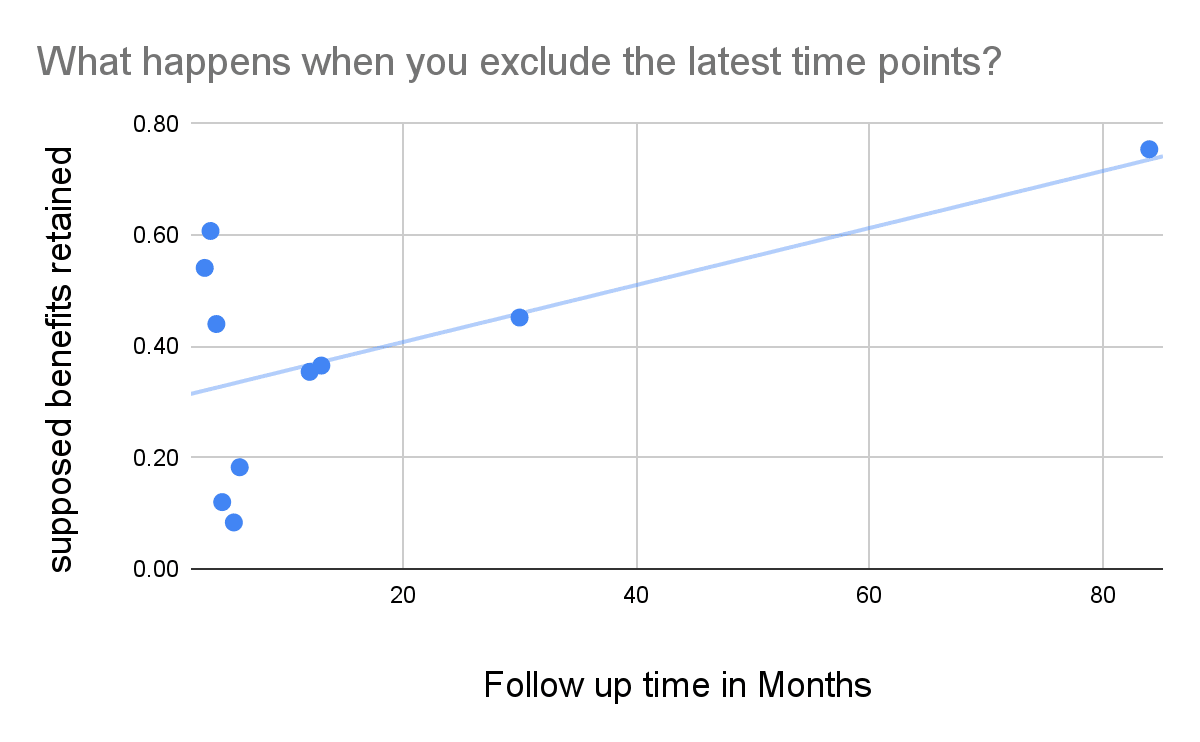
Figure - benefits retained increases as longer followup times are added: Benefits retained are plotted against which time points are included. At any given point, data on the left is included while data on the right is excluded. On the far right, all time points are included, on the far left only the earliest data points are included. We see that as we include further and further data points, the supposed benefits retained rise, suggesting that the further data points are potentially more biassed. The intercept is at 0.305. Under an exponential decay model, retaining 30.5% of the benefits per year would have produced a multiplier of (0.31^5-1)/ln(0.31) = 0.84 over five years.
Of the four follow ups that were <= 30 months, all of them caused the estimate of the retention of benefits to increase. The optimistic interpretation here is that psychotherapy genuinely has a quick decay at early time points but has lasting psychosocial outcomes. We're leaning towards a more sceptical intuition that this is at best a sign of a few studies having an outsized effect, and at worst a sign of systematically increasing sources of bias as time goes on. Removing only two time points brings the decay down to 37%, already lower than to the 67% and 54% estimated by HLI and GiveWell, respectively.
While HLI, McGuire (2021a) Appendix C does outline a methodology for accounting for sources of bias such as these, our understanding is that:
a) HLI's bias adjustments bottom out to an overall 89% multiplier adjustment as applied to the final impact number, so the decay rate in isolation does not include this discount
b) this discount is intended to describe the situation relative to cash transfer effects on subjective well being - "We estimate that the evidence base for psychotherapy overestimates its efficacy relative to cash transfers by 11%".
We didn't review this methodology in enough detail to evaluate whether doing it this way succeeds at its own stated aims at discovering impact of therapy on happiness relative to cash, but this doesn't work for our aim of finding the absolute effect size and decay rate of therapy.
Though these considerations make us doubt that we can take either HLI or GiveWell's estimated rate at face value, many of these concerns also apply to most of the alternative methods of estimation that we can think of, and also appear to apply to most academic analysis aiming to estimate the duration of the effect.
It's possible that the same methodology would return more accurate results using a larger number of studies, with a broader evidence base, filtered for risk of bias in study design factors, and taking care to make apples to apples comparisons between early and late time points. We weren't able to complete such an analysis due to facing time constraints ourselves. The METAPSY database doesn't code its data according to follow-up time, we don't at present have the resources to create such a database ourselves, and to our knowledge HLI, McGuire (2021a) and Feng (2011) are the only reviews which attempted to create a large database that codes effect sizes by followup time, with HLI, McGuire (2021a) being the larger of the two. We imagine that HLI must have faced similar resource constraints. Such an endeavour is also limited by a relative scarcity of longitudinal studies that also have strong study design characteristics.
For comparison, if HLI (black dashed line) and GiveWell (black dotted line) decay rate models were to be combined with the spontaneous spontaneous decay rates from Whiteford et al. (2013) and juxtaposed with the other studies, it would look like this.
Update: In their newest report, HLI McGuire 2023, finds a similar pattern for studies longer than 1.5 years, but not for studies shorter than 1.5 years[4]. Removing the offending studies drops the duration multiplier from 2.67 to 1.18. They use the averaged 1.93 for their headline estimate. We think it would have made more sense to use the former number, and that the trend places suspicion that the former number is biassed in the same direction]
Figure - SoGive and HLI 2023 estimates compared: HLI McGuire 2023 updated linear meta-regression. All studies included in red, longitudinal studies of less than 1.5 years in blue. We have added a representation of SoGive's estimate in green - reflecting what an effect size of 0.41 with a duration multiplier of 0.56 would look like.
We think it's notable that due to our smaller initial effect size estimate, our estimate of decay shares a similar slope with HLI's updated estimate after longitudinal studies are removed. If we kept our same initial effect size but instead used the rate of decay after removing extreme follow-ups from HLI McGuire 2023 of -0.21 sds / year, we would have arrived at a multiplier of (0.41/.21)/2=0.97.
Academic estimates of changes in effect sizes over time
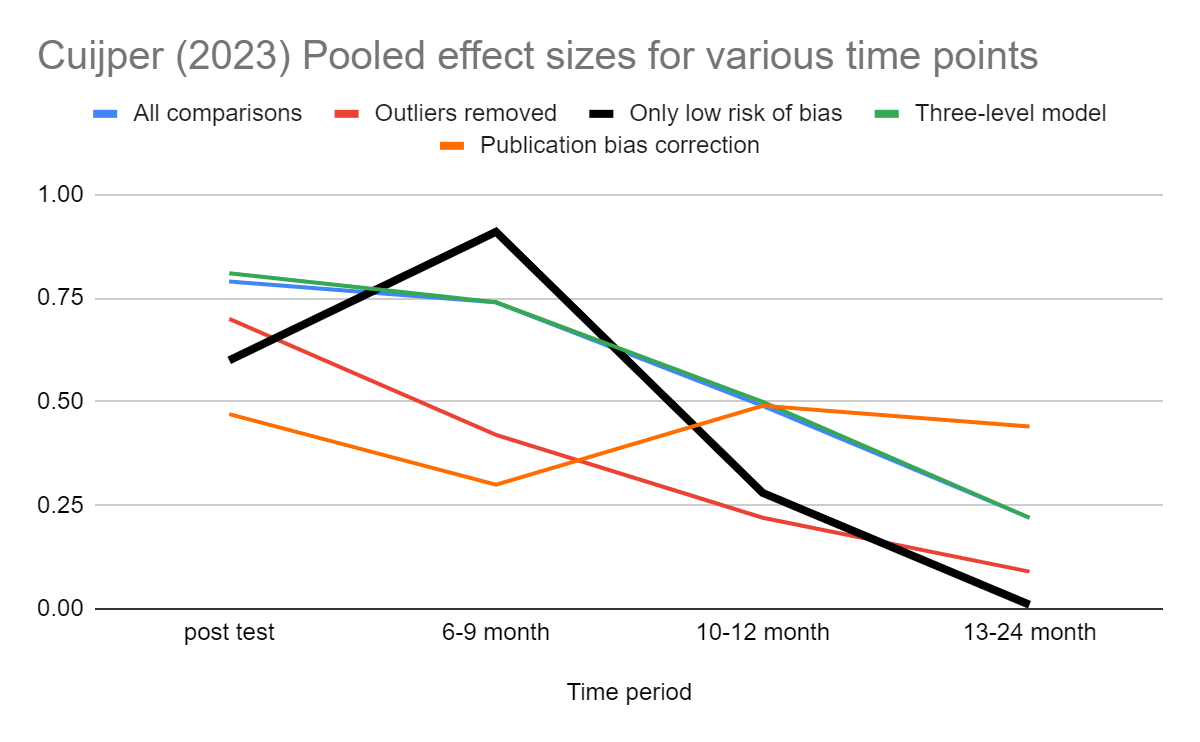
Cuijpers (2023) pooled effect sizes for cognitive behavioural therapy in various time bins[5]. For studies that passed all four tests for risk of bias in study design (blinding of assessor, blinding of participant, adequate randomization, and intention to treat analysis), the effect became negligible in the 13-24 month bin, although that bin only contained three comparisons.
Figure - Cuijper (2023) CBT effect sizes over time: After removing low risk of bias studies, effect sizes drop to zero in the 13-24 month bin, but based on a very small number of studies.
Importantly, the number of studies involved becomes quite low at later time points.
Only low risk of bias
Number of comparisons
g (95% CI)
Post-test
90
0.60 (0.49-0.71)
6-9 month follow-up
29
0.91 (0.46-1.36)
10-12 month follow-up
4
0.28 (–0.25 to 0.82)
13-24 month follow-up
3
–0.01 (–0.17 to 0.16)
We think that only the "low risk of bias" dataset should be used as a guide to determine effects over time, because as previously discussed, we suspect these risk of bias factors get worse over time. We also would tend to disregard the series labelled "publication bias correction" because I^2 heterogeneity is high, and we understand that the trim and fill procedure can give odd results under those conditions.
Feng (2011) looked at 16 studies immediately after psychotherapy and found an effect of g=0.40 (95% CI: 0.11 to 0.68, k=16), 5 studies which took place six months after psychotherapy and found an effect of g=0.38 (0.16-0.60, k=5), and 4 studies which followed up for some period longer than 6 months and found g=0.06 (-0.27-0.28, k=4) for Cognitive Behavioral Therapy (CBT). The authors conclude that therapy should be applied "every six months". If we assumed that the effect of therapy is constant and lasts for 6 months, and then abruptly dropped off, then it would correspond to 0.2 SD-years of impact per therapy session. If we instead imagine that it decays linearly after 6 months. The effect size would be 0.3 SD-years. For comparison, our model would predict 0.41×0.625×90% = 0.23 SD-years of impact.
Both Feng (2011) and Cuijpers (2023) has the advantage of having conducted risk of bias assessment as part of its inclusion criteria, which may protect against inflated longitudinal effect sizes, but the drawback of using a relatively small number of studies and fairly large time bins.
Conclusions:
SoGive estimates that the duration multiplier is 0.5625. At an initial effect size of 0.41, this translates to 0.41×0.5625 = 0.23 SD-years of impact per client. This estimate rests primarily on the fact that spontaneous remission rates from Whiteford et al. (2013) and relapse rates from treated and formerly cured patients from Vittengl et al. (2007) suggest a convergence around 1.25 years, and an assumption of linear decay which hits zero at the time of this convergence (1.25/2×90%=0.5625).
Our 90% adjustment reflects the fact that unlike the average patient, Vittengl et al. (2007) patients were once fully cured of depression, but this is partially offset by biases in the opposite direction such as Whiteford et al. (2013) use of clinical samples at later time points, and the finding that some relapse-related studies report higher relapse rates than should be possible if remission-related studies are correct and vice versa.
We think our estimate of 0.5625 is probably correct within a factor of 2 - between 0.3 and 1.2 (implying that therapy lasts between 0.6 and 2.4 years), because longitudinal 2+ year follow ups by Steinert et al (2014) and Wang, 2004 converging to approximately the number of SDs of depression we would predict by where cured-relapsing and spontaneously-remitting patients converge. Additionally, Cuijpers (2023) finding effect sizes going to zero in the 13-24 month bin among studies which have low risk of bias in study design. [Update: Finally, HLI McGuire 2023 estimated a linear decay of -0.21 sds / year after eliminating long followups, which would have yielded a multiplier of (0.41/.21)/2=0.97.]
Compared to HLI McGuire 2023's methodology of using meta-regressions of RCTs, our results rely on observational data concerning remission and relapse, and are therefore less susceptible to risk of bias factors related to inadequate randomization, blinding of participants, and blinding of assessors. We remain susceptible to observational data being potentially biassed by selective dropout rates (though presumably the direction of bias in relapse data would run counter to the direction of bias in the remission data) and to problems related to heterogeneity and publication bias. We would predict that a meta-regression based methodology might converge closer to our answer after eliminating studies which have risk of bias factors (although there may be insufficient longitudinal studies with sufficiently low risk of bias for such an analysis to be possible).
Subsequent articles will discuss the meaning of this number in terms of moral weights and the role of spillover effects.
Acknowledgements
We'd like to thank Joel McGuire for giving helpful feedback on this document. This article is primarily the work of Ishaan from SoGive, with substantial input and support from Sanjay and Spencer.
Appendix
Methodology: How we extracted effect sizes from remission and relapse rates
Most longitudinal literature on depression report disease courses in terms of "remission rates" (the proportion of people who no longer meet the criteria of depression) and "relapse rates" (the proportion of people who are treated for depression, and then get depressed again).
HLI based their original analysis on effect sizes changing over time rather than remission and relapse rates. We think this is a great methodology, effect sizes are a better way to conceptualise well-being improvements than remission and relapse, because remission and relapse rates do not account for sub-threshold improvements. However, in order to present our analysis in terms of effect sizes as presented in the previous sections, we had to find a way to estimate what a reported remission or relapse rate means for a given effect size. We outlined some of this methodology in our previous article. The remaining sections will go through the particular application of the methodology step by step.
Setting standards for remission and relapse
Every questionnaire uses a slightly different cutoff for "slightly depressed" vs "not depressed". This cut-off typically determines depression remission and relapse criteria. In academic meta-analyses using remission and relapse, typically different papers with entirely different criteria for remission and relapse are lumped together. In order to extract information from these papers in terms of standard deviation, we need to establish where the "typical" cut-off is in terms of standard deviations from zero
The METAPSY database contains 62 questionnaires, most of which were only used in one study. Five questionnaires were used more often than the rest. We began by aggregating information within commonly used questionnaires, dropping the rest of the data.
We want some way to aggregate all these scales into a single scale. We therefore described the means and cutoffs as being a certain number of standard deviations away from zero. We've also included the percent distance of the means and cutoffs to the maximum scores.
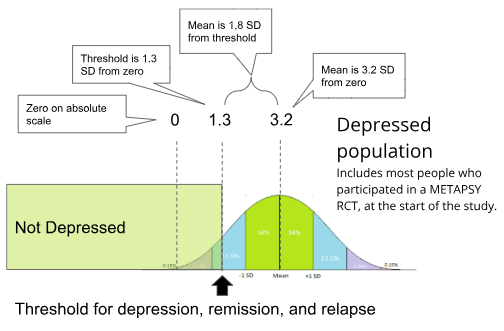
The final row of this table allows us to establish that typically, the average RCT participant is 3.20 standard deviations of depression from zero (50% of the maximum possible score). The remission and relapse cutoffs (the maximum score to be considered undepressed, and the minimum score to be considered depressed, respectively) are typically at 1.31 and 1.46 standard deviations of depression from zero (This is 20% and 23$ of the way to the maximum possible score).
Figure: The estimated distribution of depression scores for all participants in METAPSY, aggregated across all questionnaire types. All diagnostic questionnaires have different diagnostic thresholds for remission, but the typical one as determined by population-weighted average was 1.3 SDs from zero.
This concludes the standardisation process for determining what "remission" or "relapse" typically means. We did some further validity checks, which you can find in Appendix: Validity checks for standardisations.
1.31SDs and 1.46 SDs will be used in further calculations that require a standardised SD cutoff for remission and relapse across multiple studie, while "3.20 SDs from zero" has now been established as the approximate severity of the typical case of depression in RCT populations.
Calculating means from remission/relapse rates
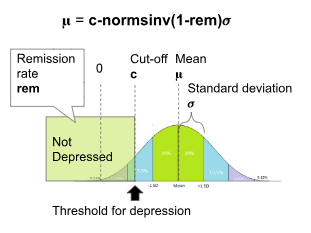
Given a remission rate of a population, it is possible to calculate the population mean score 𝛍 using the formula 𝛍=cutoff-normsinv((1-remission rate))*𝜎
Where 𝜎 is the standard deviation of the population, "cutoff" is the maximum remission score, and normsinv() is the inverse normal distribution function.
To calculate the population mean score from a relapse rate, the formula is
𝛍=cutoff-normsinv(relapse rate)*𝜎
Where 𝜎 is the standard deviation of the population, "cutoff" is the minimum relapse score[7], and normsinv() is the inverse normal distribution function.
Our threshold standardisation process, as described above, has revealed that the standard remission cutoff is 1.31 standard deviations from the mean. A similar process reveals that the standard relapse cutoff is 1.46 standard deviations from the mean. When using standardised cutoffs, the standard deviation 𝜎 = 1.
If instead of the standardised cut-off, a particular questionnaire's cut-off score is used, the standard deviation 𝜎 of that particular questionnaire can be found in the table above.
Papers which report relapse rates do not typically report the means and standard deviation, but Furukawa (2006) describes how, when standard deviations are not reported in psychiatry trials, it's okay to use other studies to impute (estimate and fill-in) what the standard deviation is by taking it from other studies where it is provided.
A meta-analysis by Whiteford et al. (2013) estimates that 23% of untreated depression cases remit within 3 months, 32% within 6 months, and 53% within 12 months. All studies in the meta-analysis defined remission via scoring below a cut-off for depression on a questionnaire, though each study differed in precisely which questionnaires and cut-offs they used. If about half the population has remitted, that means that the mean score of the population is approximately the same as the remission cutoff.
All the studies in Whiteford et al. (2013) use different questionnaires and have different criteria for remission and they haven't been reported in a way that makes it easy to disaggregate them. Using 𝛍 = 1.31-normsinv(1-remission rate), we can convert remission rates from Whiteford et al. (2013) into standard deviations to find that the average depressed person in their dataset was be 2.0 SDs, 1.8 SDs and 1.2 SD away from a score of "zero" at three, six, and twelve months.
3 months
6 months
12 months
Percent past cutoff
0.23
0.32
0.53
SD of distribution
1
1
1
SDs from mean of cutoff
1.3
1.3
1.3
Distance from 0 in SDs of the Mean of the distribution
2.04
1.77
1.23
We can use this table to generate linear and exponential decay lines to describe the spontaneous reduction in symptom severity in depression, which will assist us in placing some upper bounds on how long the effects of psychotherapy could reasonably last.
The same process was done for data from Wang, 2004.
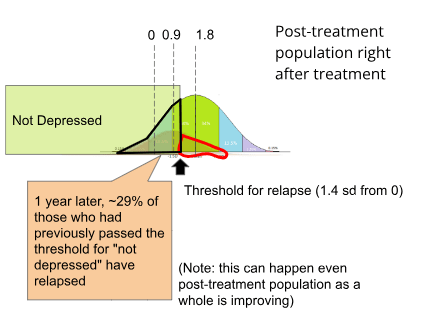
An important distinction regarding "relapse rates" is that it does not refer to the proportion of the whole sample which is still depressed, but rather the rate at which the subset of the sample which had remitted from depression (outlined in black), and subsequently relapsed (outlined in red).
Outlined in black is the proportion of the post-treatment population that has remitted using data from the METAPSY database.
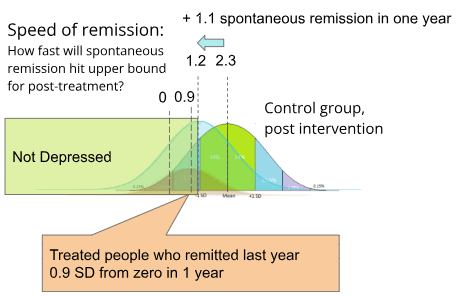
Note that even while this selected remitted population is worsening as it regresses to the population mean, the overall post-relapse population may be improving. For example, if the post-treatment population were to spontaneously remit by approximately 1.1 sd, (which is about how fast control populations remit per year in Whiteford et al. (2013)), it would mean that by 1 year the remitted population and the total post-treatment population would have approximately converged upon the same mean.
While the formerly remitted subset does regress to the post-treatment population mean, it should never be worse off than the post-treatment population mean, so it is possible to use the mean of the formerly remitted population as an "upper bound" for how far the post-treatment population has actually improved.
Integrating remission and relapse to produce an estimate
Having established an upper bound of post-treatment improvement using data from Vittengl et al. (2007), and having established the rate of spontaneous remission using the data from Whiteford et al. (2013), it is now possible to build a complete model which starts with remission and relapse and ends with an estimate of how fast the means of the treatment and the control populations are converging.
Given a yearly relapse or remission rate, The relapse and remission rate at any arbitrary number of years can be calculated using the function rate (years) = 1-(1- rate)^years. The final formulas are given by
𝛍 = 1.31-normsinv((1- remission rate)^years)
𝛍 = 1.46-normsinv(1-(1- relapse rate)^years)
Where rates at multiple time points were available, we converted each one to their population mean 𝛍 and then used Google sheet's growth() function to aggregate the rates.
At a remission rate of 51% and a relapse rate of 29%, solving this equation yields 𝛍 = 1 SD at 1.25 years, which forms the backbone of our estimate.
Estimating the general population's depression level
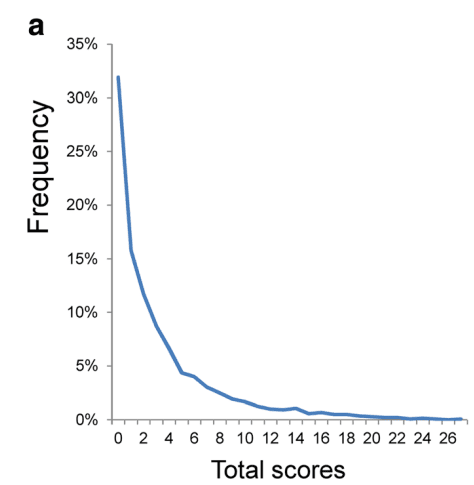
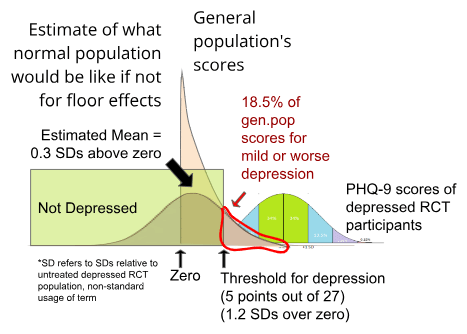
We're interested in how these results compare to the general population. Because the majority of people are not depressed, scores from depression questionnaires administered to the general population are not normally distributed (pictured below, PHQ-9 scores taken from the general population from Tomitaka, 2018)
18.5% of US adults in the representative National Health Interview Survey score higher than the remission cut-off of 4 points on the PHQ-8[8] at a single time point (Villarroel et al, 2019), while a meta analysis by Zimmerman (2004) found that 16% of healthy controls scored over the 7 point cutoff on the HRSD (This is different than the lifetime risk of major depression disorder, as it includes any amount of depression higher than the diagnostic cutoff).
We don't want to simply take the average score here, because the data is skewed due to not accepting any scores lower than "zero". We want to know what the distribution of scores for the general population would have been if the data were not distorted by floor effects.
As described above, the PHQ-9 has a relapse threshold of 5 and a standard deviation of 4.21. We can therefore use 𝛍 = 5-normsinv(18.5%)×4.21 = 1.22
to estimate what the general population's average score would have been, had floor effects not been bringing up the average. A score of 1.22 on the PHQ-9, which is 0.3 SD (relative to untreated baseline PHQ-9 scores) away from a score of zero. It would require 3.0 SD of improvement for the typical RCT participant who took the PHQ-9 to be as depression-free as the average person. This would imply that only 0.3% of the general population was as depressed as the average RCT participant, which seems suspiciously low. If it is too low, that would imply that we have overcorrected for floor effects, but we think it's good enough for the practical purposes which we are using it for.
Validity checks for standardisation
Risk of bias checks
We repeated the standardisation process using only studies with the highest quality Risk of Bias scores, the findings were similar (mean: 3.1 sd and cutoff: 1.4 sd from zero), which is what we expected - none of the risk of bias factors (randomization, blinding, intention-to-treat analysis) should change anything before the intervention actually begins. Differences in recruitment process did produce the expected differences (For example, as expected clinical populations were more depressed, with mean: 3.6 sd from zero, with the cutoff staying consistent at 1.3 sd from zero.)
BDI-II / PHQ-9 conversion table sanity check
Because we had previously made a conversion table between the depression-questionnaires BDI-II and PHQ-9 using data from a single population which took both questionnaires, we were able to do a quick sanity check to see whether the mean BDI-II score of 26.45 and the mean PHQ-9 of 13.78 indicated a similar level of depression, and found that they did indeed fall at the same point on the scale after conversion, and that point was 3.1 SD from the zero of that scale. That means that, at least for these two questionnaires, RTC participants indicated a similar level of depression at intake as well as improvement after treatment regardless of which questionnaire was used to evaluate them. We didn't do a similar sanity check on the other scales due to time constraints.
After the intervention
We only included studies which used the five most commonly used questionnaires. To ensure that the studies included in the standardisation process were representative, we also wanted to check that things seemed normal after the intervention.
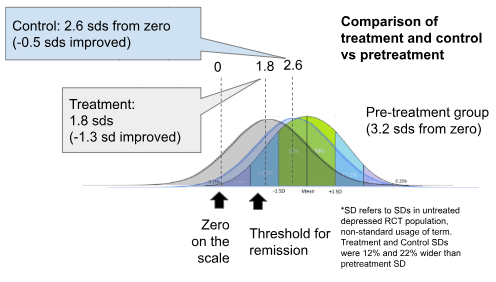
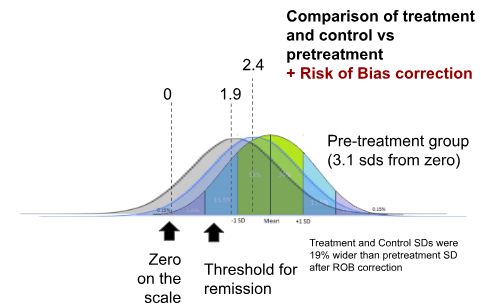
After the intervention, without accounting for risk of bias, the treatment group improves by 1.4 standard deviations, while the control group improves by 0.6 standard deviations (We are here using the "standard deviations" that were established at the pre-treatment baseline populations. This is equivalent to using Glass's Delta to compare pre and post treatment scores.)
Adjustments for Risk of Bias reduce the difference between treatment-improvement and control-improvement from 0.76 to 0.52 SDs. This is roughly consistent with the effect sizes that we found with the larger dataset (which did not exclude infrequently used questionnaires, and used more sophisticated effect size calculation methods).
This means that the studies that we used for standardisation were sufficiently representative of the rest of the dataset for practical purposes both in terms of pretreatment populations and post-treatment results.
McGuire, J. (2021b) estimated a 0.671 exponential decay rate. GiveWell, Cohen (2023) converted this into a multiplier, most likely using the conversion formula (0.671^5-1)/ln(0.671)=2.165
Joel McGuire pointed out that this data has a Simpson's paradox like pattern (if waitlist sample and care-as-usual sample are considered separately, it looks like people are getting worse instead of better!). This may suggest poor data quality. In this case, however, we know that everyone in the sample was depressed at the start, so it is safe to assume that the intercept is zero. Once that is assumed, estimates using only waitlist samples vs only care-as-usual samples don't too different from each other.
Did these particular studies do Intention To Treat analysis? We did not ourselves examine the individual studies for risk of bias factors, but HLI, McGuire (2021a) did, coding 5 of the 15 longitudinal studies with something other than "true" or "yes" under the "ITT" column, though many of these codings did not necessarily deny that the study did intention to treat. These studies and their codings were: Rojas et al. 2007 = "N/A"; Lund et al.. 2020 = "50%"; Naeem et al., 2015 = "false"; Cooper et al. 2009 = "N/A"; Rotheram-Borus et al 2014b = "NR -- but I think they do ITT". Many non-longitudinal studies, which also contribute to the meta-regression, also did not perform ITT, see TherapyIntervnetionsData table by HLI.
In response to this problem, HLI tried removing the "longest" studies in their new analysis and found that this trend did not occur after removing the 5 latest trials. See page 25-26 and in particular footnote 43 on page 26.
Regarding the "cutoffs" column, we did a quick google search for each scale and wrote down the first result for arbitrary cutoffs we saw. Cut-offs for "remission" are not particularly well standardised - not every study uses the same cutoff. However, we need to know where on the normal distribution the cutoff "usually" is, to interpret academic meta-analyses regarding remission/relapse in terms of standard deviations. Also, note that "relapse" cutoff refers to the lowest "depressed" score, which is one point above the "remission" cutoff which refers to the highest "not depressed" score.
Note that "relapse cutoff" and "remission cutoff" are not the same cutoff. "Relapse" cutoff refers to the lowest "depressed" score, which is one point above the "remission" cutoff which refers to the highest "not depressed" score.


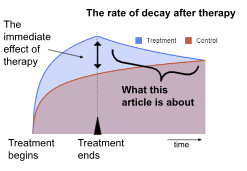
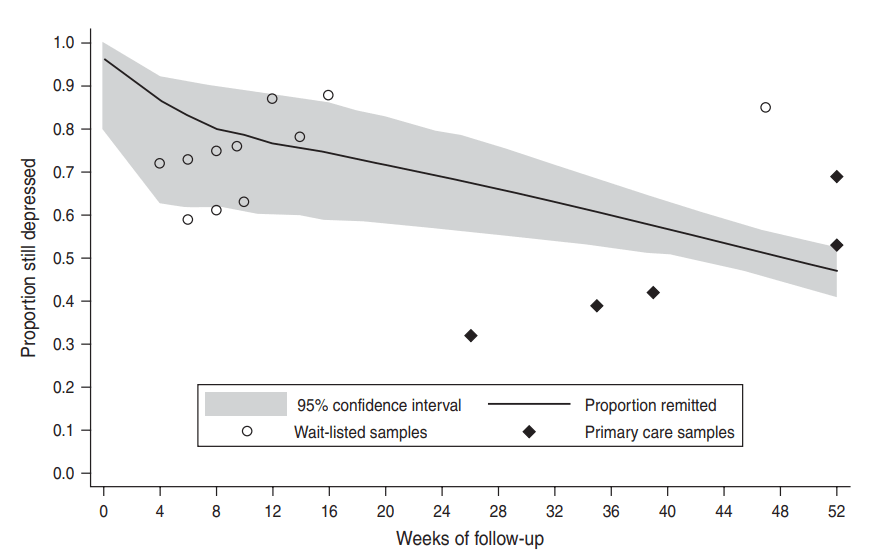
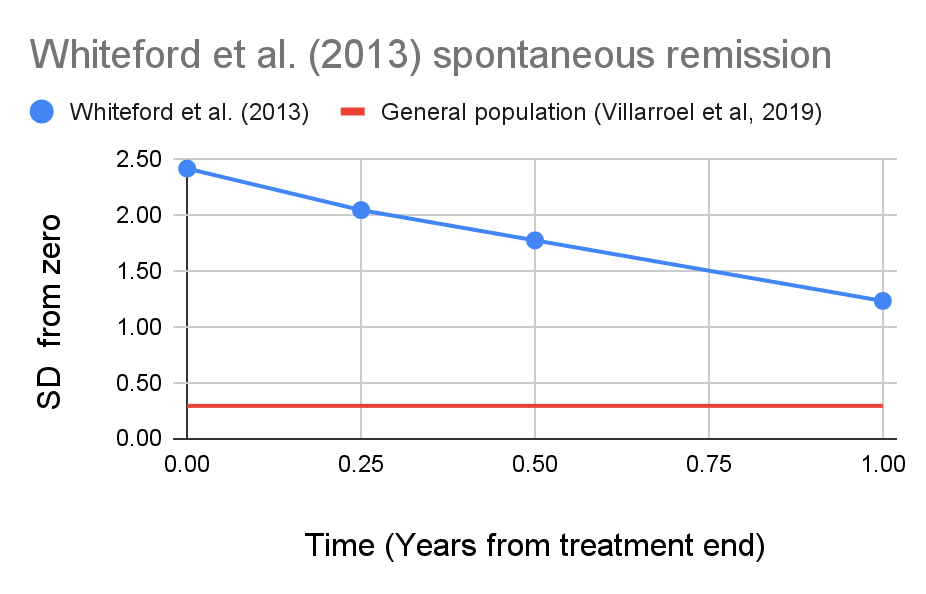
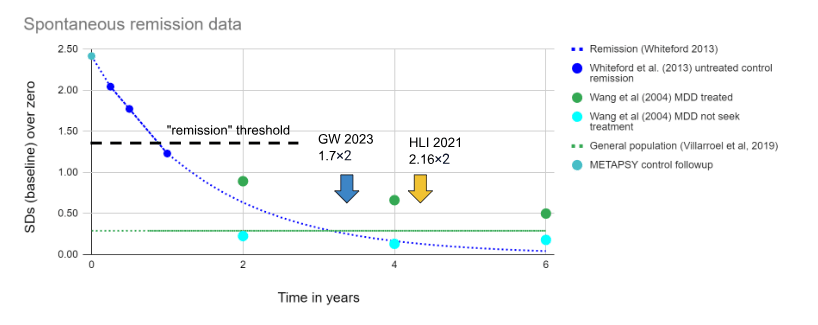 Figure - Spontaneous remission in context: Spontaneous remission in SDs of depression calculated from
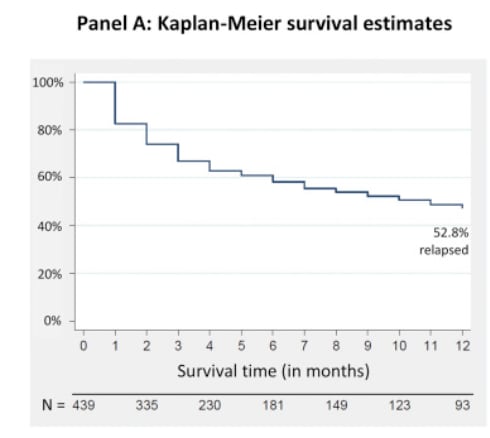
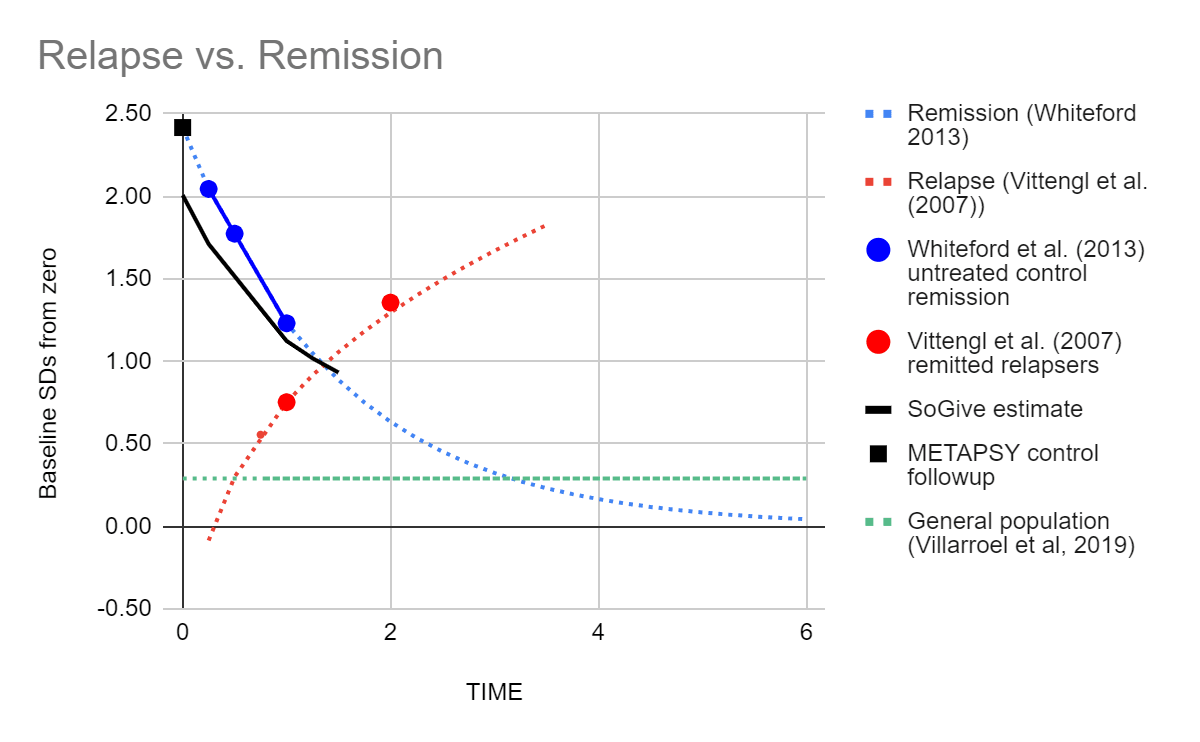 Figure- Remission and relapse in SDs juxtaposed: We converted remission rates from
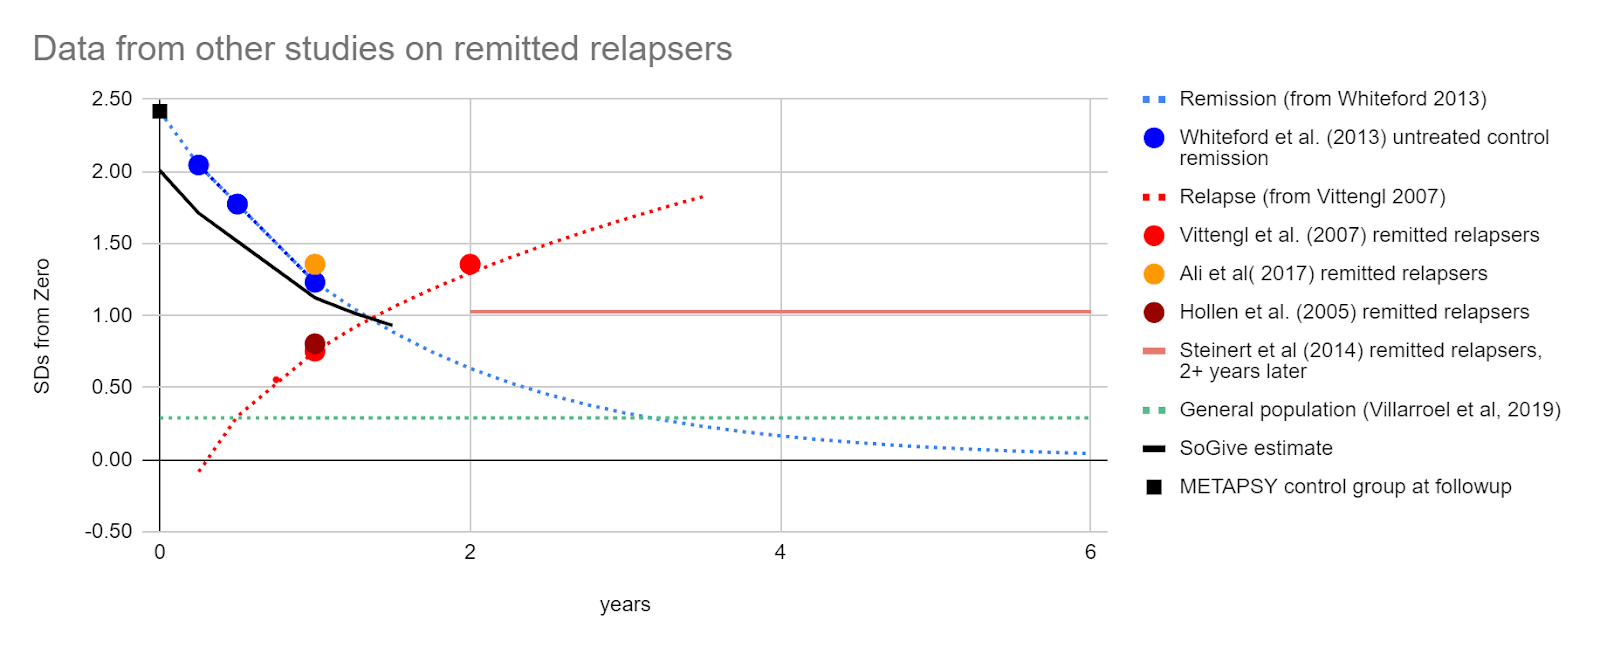
 Outlined in black is the proportion of the post-treatment population that has remitted using data from the METAPSY database.
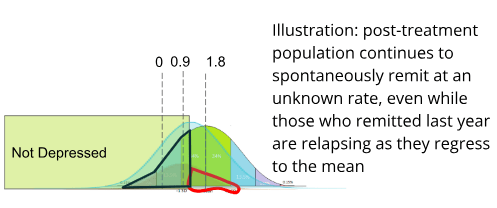
Executive summary: A new analysis estimates the duration of psychotherapy's impact on depression to be around 1 year 4 months, much shorter than previous estimates of 3-4 years. This translates to a duration multiplier of 0.56.
Key points:
This comment was auto-generated by the EA Forum Team. Feel free to point out issues with this summary by replying to the comment, and contact us if you have feedback.