Comments
This is the fifth in SoGive's nine-post sequence evaluating StrongMinds, authored by Ishaan with substantial input and support from Sanjay and Spencer.
Post 1: Why SoGive is publishing an independent evaluation of StrongMinds
Post 3: What's the effect size of therapy?
Post 4: Psychotherapy's impact may be shorter lived than previously estimated
This post: Depression's Moral Weight
Executive summary
- Previous posts are aimed at finding the effect of depression in terms of SD-years. We want to be able to convert this to DALYs / QALYs, which can subsequently be plugged into moral weights frameworks and be directly compared to life saving interventions.
- We find that every 1 SD-year of improvement in depression is worth 0.185 DALYs, and that 1 DALY is worth 5.4 SD-years of improvement.
- On the PHQ-9, 1 DALY would correspond to 23 points of improvement for one year. The PHQ-9 is a 9 item depression questionnaire with possible scores from 0 to 27, where remission is at 4 and the typical patient who enrolled in a depression RCT scores 23.8 points.
- We find that these choices would bring SoGive's moral weights within the range of subjective well being based views that were outlined in GiveWell's review of HLI.
- In the appendix, a spreadsheet can be found that allows the user to input their own moral weights. When our analysis is completed, this spreadsheet will allow the user to pick their moral weights and see how it changes their recommendation.
- In addition, we’ve created an easy-to-use tool to help donors determine their own moral weights – we call it the MoralMeter tool. We’re keen for donors to try out the tool (still in beta) and provide feedback.
- We come to these conclusions using time-trade-off data from Sanderson (2004), in which physicians were asked how many healthy life-years they would trade for a given SD of improvement in depression.
- Our conclusions are formed by combining this time-trade-off data with an estimate that the positive effects of psychotherapy mostly take place while patients are in the 2.3-3.1 SD range. Which range most of the positive effects take place during is an important uncertainty in this analysis, which is part of a wider uncertainty about how fast depression tends to fade more generally.
- We also have important doubts about anchoring and framing effects in Sanderson (2004), however,we believe it to be the most suitable source available.
Introduction
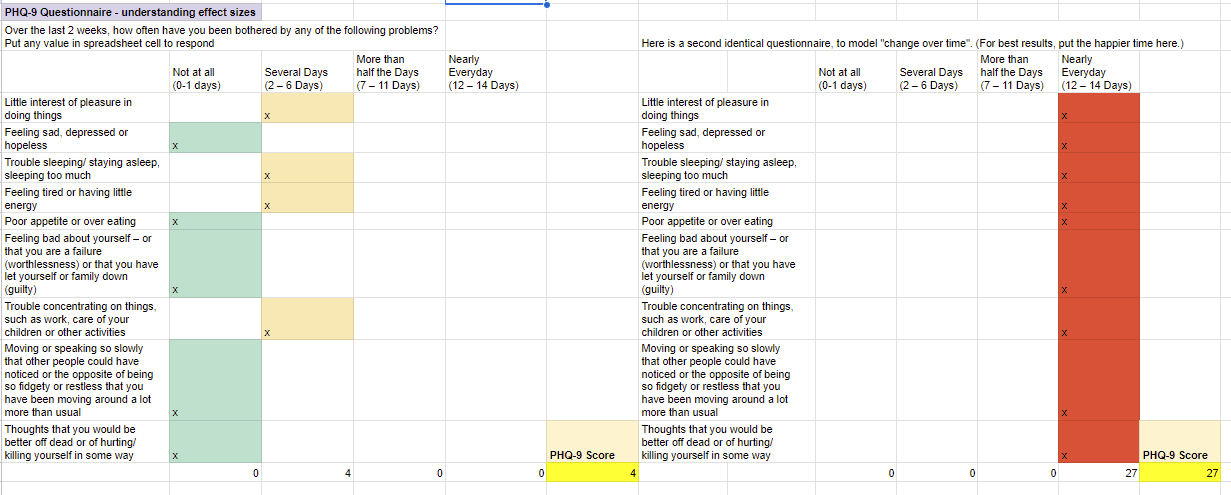
This is an example of how a typical person diagnosed with depression might answer the PHQ-9. Our findings, based on a study that questioned people about their preferences, suggest that if these scores were to drop by 1 point for an entire year, that would be as morally good as granting them approximately as good as adding 15 days of extra life that year.

A 24 point difference would correspond to a whole year's worth of gain. For each question, they get 0, 1, 2, or 3 points depending on how often they feel the depression symptom. There are nine questions, so the highest possible score is 27. 13.7 is the average score for someone diagnosed with depression, 5 is the minimum score to be considered depressed, and 1.2 is what we estimate the score of the general population would be after adjusting for floor effects. Having established how to convert 1 SD year of depression to DALYs/QALYs, we can then more easily compare this to a life saved, which is another established outcome within SoGive’s moral weights framework.
In other posts, we calculate how many SD-years of depression are averted by psychotherapy interventions. We want to know how improvements in SD-years compare to interventions that save life, improve income, or improve health.
We converted SD-years into disability adjusted life years by looking at data regarding how much life expectancy people are willing to trade for a given amount of improvement in depression from Sanderson (2004).
We discuss the implications of integrating this number into the SoGive Gold Standard Benchmarks, and how it compares to the moral weights of other organisations.
In the appendix, there is a spreadsheet which will allow you to change your moral weights and pick your own time trade off. More detailed calculations can be found in the footnotes. Interested readers are also encouraged to review SoGive’s MoralMeter tool for comparing lives saved to tackling depression (still in beta); this also incorporates a number of considerations which are beyond the scope of this document.
How much time would you trade to cure depression? Converting from SDs of depression to DALYs
Sanderson (2004) asked general practitioner doctors who had recently completed a 1 year masters in the recognition and management of mental health disorders to rate their trade-offs regarding various health states. Short vignettes and data from real patients who had scored 1, 2, and 3 SDs above remission were provided.

To produce a rating scale (RS), the physicians were instructed to mark a spot on the vertical line (pictured above) with "worse health" and "better health" on either end. To produce a time-trade-off (TTO), the physicians were instructed to "Imagine a person in this health state. They have a life expectancy of 10 years. They can either live for 10 years in this health state, or you can offer them a cure to perfect health but with a reduction in life expectancy. How many months and/or years do you think someone in this health state would be willing to give up to live in perfect health?".

Time-trade-off and rating scale metrics are both methodologies that can potentially be used to create Quality Adjusted Life Years or Disability Adjusted Life Years metrics.
We combined Sanderson (2004) data with estimates of patient progress from the METAPSY database to produce an estimate of the number of QALYs saved / DALYs averted for the average patient. Conclusions are reported in the main body of the article - see footnotes for calculations.
Sanderson (2004) "remitted" cutoff likely between PHQ-9 = 1 and PHQ-9 = 4, centred at PHq-9 = 2.95
"Remission" is an arbitrary cut-off. In order to use time-trade off and rating scale data from Sanderson (2004), we first need to estimate where exactly on the depression scale their definition of "remitted" lies. Sanderson (2004) defines patients in remission if they do not have a depression diagnosis and have "an SF-12 MCS score of 50 or more".
Previously, we converted multiple depression scales to a single "universal" scale based on standard deviations from zero, and established where each of their canonical remission and relapse cut-off points lay on that universal scale. Unfortunately, the SF-12 MCS was not among those scales.
We needed to convert the SF-12 MCS to a known quantity. The PHQ-9 (Patient Health Questionnaire - 9) is a nine-item quiz measuring depression severity. While our findings are intended to be applicable across many different depression scales, we decided to use the PHQ-9 to anchor our moral weights to a set of concrete statements concerning well-being. [1]
We have three hints that can help us to convert the SF-12 into a PHQ-9 score.
- An SF-12 score of 50 is intended to represent the mean score of the general population, which we previously estimated was at PHQ-9 = 1.22.
- Ishaan took the PHQ-9 and the SF-12 MCS at the same time, to establish which scores were considered approximately equivalent.
- A PHQ-9 score of 4 is intended to represent remission.
The 12-item Short Form Survey's mental component score (SF-12 MCS) has an average of 50 and an SD of 10 points. We estimate a score of 50 SF-12 MCS corresponds to a PHQ-9 score somewhere between 1 and 4, most likely centering around 2.95 (see footnotes for calculation of this figure).[2] This translates to the 50-SF-12 MCS having a cutoff between 0.24 SDs and 0.95 SDs from zero, centred around 0.7 SDs.
Pretreatment PHQ-9 scores have a standard deviation of +4.2, so the locations of +1 SD, +2SD, and +3SD on the PHQ-9 can be found by adding +4.2×1, +4.2×2, and +4.2×3 respectively.
Typical therapeutic effect starts within the 2.3-3.1 SD range
Because time trade-offs do not have a linear relationship to standard deviations of depression, we need to consider where on the scale the typical participant is as they experience their improvement to figure out what the slope of their trade-off is.
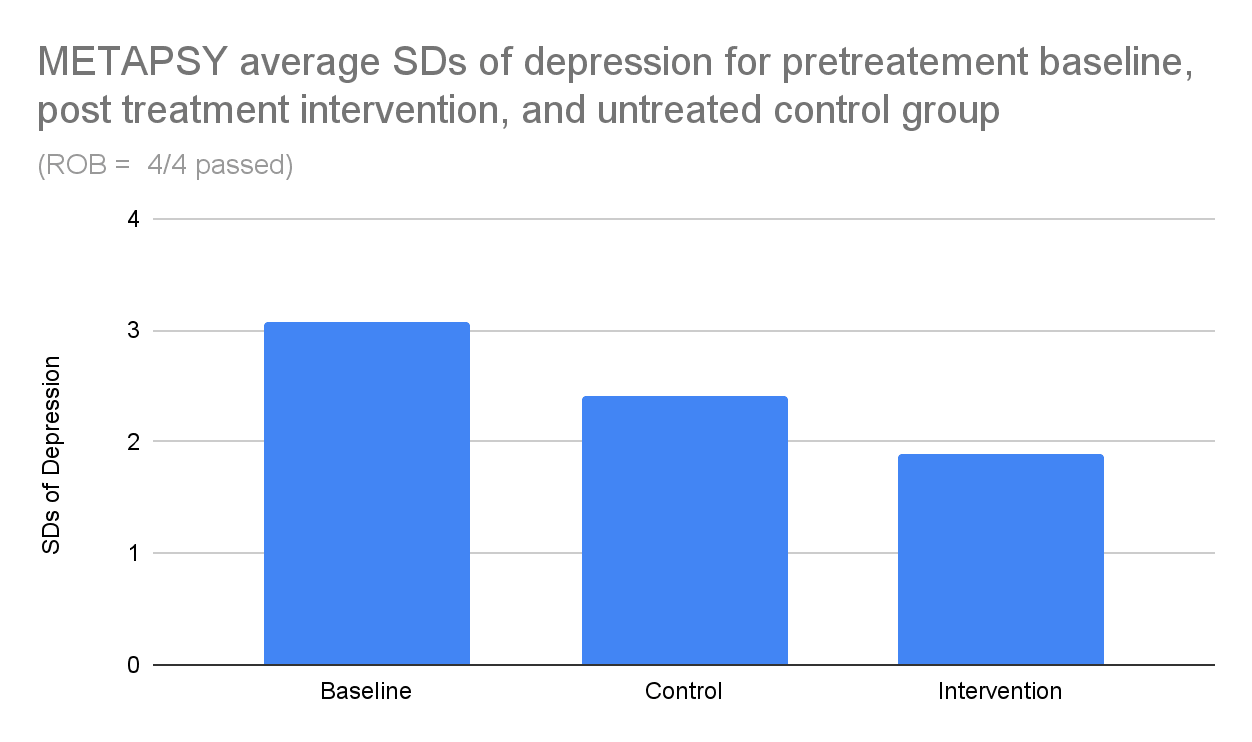
We find that the average METAPSY RCT participant begins treatment somewhere between 2.3 and 3.1 SDs from what Sanderson (2004) describes as the remission cutoff (see footnotes for calculation of this figure).[3]

Figure: Our model of treated vs untreated patients suggests that the bulk of the benefits occur in the 2-3 SD range. The plausible range of what Sanderson (2004) intends as "remission" cutoff is marked.
To go from 3 to 2 SDs corresponds to a time-trade-off of 0.245 per SD improvement, or 0.21 points per SD when using the rating scale methodology, again based on data from Sanderson (2004) . However, given that depression has a spontaneous remission rate of 51% a year, untreated participants are expected to fall within the 1-2 SD range about halfway through the year (e.g. 3.1*51%^0.5=2.2, 2.7*51%^0.5=1.9). To go from 1 SD to 2SDs corresponds to a time-trade-off of 0.122 per SD improvement, or 0.15 SD when using the rating scale methodology. As our analysis suggests that almost all of the benefits occur in the first year, we want a value that is intermediate between these two numbers.
We find 0.18 DALYs per SD of improvement, or 5.4 SDs per DALY
We find 0.18 DALYs per SD of improvement when we take a weighted average of time-trade-offs and estimated effect sizes. It's about the same regardless of whether the cutoff is assumed to be at PHQ-9 = 2.95 or averaged between cutoffs at PHQ-9 = 1 and 4.
Using a simpler method of taking the average between the 1-2 SD transition and the 2-3 SD transition also yields 0.18 adjusted life years. Additionally, using the rating scale (which is linear) also yields 0.18 adjusted life years.

Based on these considerations, we choose 5.4 SDs of psychotherapy-induced improvement, which on the PHQ-9 corresponds to 24 points of improvement (for instance, going from the worst PHQ-9 score of 27 to a remission score of 4) as being equivalent to one adjusted-life-year of improvement, with each SD of improvement being worth 0.18 adjusted life years, a little over 2 months.
Key uncertainties - we used pre-intervention data to estimate the severity level treated.
We would like to flag that we used the average patient status at the beginning of therapy. It would be more pessimistic to use reported scores at post-treatment, which are significantly lower.
Because Sanderson (2004) patients valued improvements from 3-2 SD more than improvements from 2-1 SD, and more than improvements from 1 SD-remission, using lower post-treatment scores would break down the moral DALY weighting we place on psychotherapy, since it would lower the range within which the improvement is experienced.

If we had used the post-intervention model instead, the moral weight would fall from 0.18 to 0.10.
We decided to instead stick to the pretreatment baseline data and use our estimate of how long psychotherapy lasts to plot the effect over time. We did this for several reasons:
- We thought of the idea of using post-intervention data later on in the analysis, and didn't want to make too many large last minute changes.
- The 0.18 DALYs per SD figure has a few signs of robustness
- It matches the answer you would get if you used the rating scale methodology, rather than the time trade off methodology, and it's possible that the rating scale methodology is better.
- it spans the distance from the maximum depression score to the remission score. On the PHQ-9 (which ranges from 0 to 27, with diagnostic cutoff from 3 to 4), at 0.10 DALYs per SD you would need 43 points of improvement on the PHQ-9 to reach 1 DALY.
- We're not sure as to whether the design of an RCT is well suited to estimating changes over time - for instance, if individuals drop out for similar reasons in the intervention group and in the control group, the effect size will not necessarily be distorted, but the appearance of remission for both intervention and control groups relative to baseline may well be inflated.
- In general, concerns about odd sources of improvement not associated with the intervention was a big part of the reason we didn't use meta-regression based methodologies such as those used by HLI McGuire 2023 and instead used data from relapse and remission rates.
- Arguably, those same concerns should point us towards favouring relapse and remission based methodologies now.
- While we know that the average RCT in the METAPSY database did nine sessions, we don't have clear data on exactly how long each study was.
Arguments for instead using post-intervention model data include
- We can't give a clear account for why exactly post-intervention data might overestimate spontaneous remission in both intervention and control group, so there's no reason not to use the available data.
- Because the intervention is quick, almost all the supposed benefits occur after intervention.
- If depression scales only measure the bottom half of life satisfaction, then arguably going from the maximum score to zero on a depression scale should only span half the range of what an adjusted life year might be counted as.
- However, this interpretation would be at odds with what Sanderson (2004) participants were reported as preferring.
Key uncertainties - regarding the validity of the time trade off data
We're somewhat suspicious that the format of asking people for their rating scales and time trade offs has generally anchored them towards considering the worst possible score as a full adjusted life year lost, and the best possible score on a given scale as a full adjusted life year experience. When a person is given two numerical scales and asked to align them, it might be natural for them to think that the ends of the scale ought to line up together, even if there is no reason why this should be so. We think that the method of first having people think of two specific times in their life and then naming their time trade off before introducing any surveys or scales to anchor on might be less vulnerable to this, but we haven't systematically collected data from many people using this method.
Another caveat is that the participants in Sanderson (2004) are physicians who are not selected for being currently depressed. Plant (2022) previously made the point that asking people to estimate the badness of health states that they are not currently experiencing may involve various forms of bias in various ways, and that point has generally not been addressed by our analysis.
SoGive moral weights similar to subjective well being based methods
The SoGive gold standard considers averting 1 death to be worth averting 25 cases of severe depression, and averting 1 case of severe depression to be worth doubling income 4 times. We find that when "severe depression" is defined as 5.46 SD-years of depression, it causes SoGive moral weights to converge with the ones used by subjective-well being centred views.
Using the numbers from GiveWell's Assessment of Happier Lives Institute’s Cost-Effectiveness Analysis of StrongMinds — EA Forum, we compared how far off SoGive was from the moral weights that could be arrived at using subjective-well-being based frameworks.
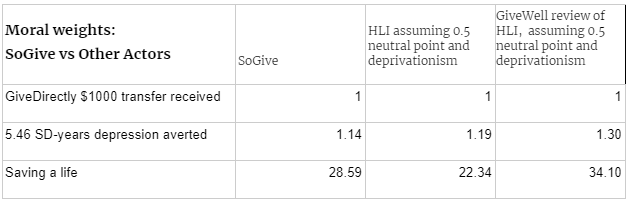
Table: The relative moral weights that SoGive, HLI, and GiveWell would assign to various outcomes, with "receiving a $1000 cash transfer" (which is enough to double a GiveDirectly recipient's consumption about 3.5 times) to 1. Note: HLI has explicitly not taken a philosophical stance (see section 2) on deprivationism or 0.5 as the neutral point.
We found that after incorporating 5.46 SD-years as the definition of "severe depression", SoGive's moral weights became similar to those found by HLI and GiveWell's analysis. We haven't spent enough time looking into the details of the other methods to know whether this similarity should be considered independent convergence or a coincidence.
[DEC 2024 EDIT: The "saving a life" figures were calculated using HLI and GiveWell's estimate for WELLBYs averted per life saved by AMF, estimating the average age of the life saved, and with an adjustment for grief. The raw "averting an under 5 death" figures would have been 24.5 for HLI and 37.4 for GiveWell.]
Comparing averting depression to cash
Using the numbers from GiveWell's Assessment of Happier Lives Institute’s Cost-Effectiveness Analysis of StrongMinds — EA Forum, we find that with respect to the head-to-head cash comparison, HLI thinks that giving someone a $1000 lump sum improves their mental well being by 1.05 SDs (or 2.3 WELLBYs), and the positive impact on their family members multiplies this effect by 4.4, while GiveWell thinks that a $1000 cash transfer improves the mental health of all 4.7 individuals in recipient households by 0.89 SDs, for a total of 4.6 SD-years (HLI) vs 4.2 SD-years (GiveWell) of improvement per $1000 transferred. GiveWell's estimates are only 10% lower than HLIs, so we can consider them to be in agreement on this point.
We haven't spent time evaluating the value of cash transfers and we're not sure that these figures are directly comparable in this way, but if these are taken at face value, then it would imply that averting 5.46 SDs of depression is equivalent to 119%(according to givewell) or 130% (according to HLI) of the value of a $1000 cash transfer in terms of the improvement in subjective well being that it produces.
SoGive considers averting 5.46 SDs of depression to be worth four annual income doublings. GiveWell estimates that the GiveDirectly recipients consume $285.92 per year, which means that $1000 would serve to double income 3.5 times. This implies that SoGive moral weights consider averting 5.46 SDs of depression to be worth 4/($1000/$285.92)=114% of the value of a $1000 cash transfer. This means that SoGive moral weights are mostly in line with a subjective-well-being based evaluation of the value of averting depression, compared to cash.
Comparing averting depression to saving lives
Using the numbers from GiveWell's Assessment of Happier Lives Institute’s Cost-Effectiveness Analysis of StrongMinds, we find that GiveWell and HLI think that averting 1 SD-year of depression bestows 1.56 (GW), 2.17 (HLI) life satisfaction points, which means that they think averting 5.46 SDs of depression bestows 8.5 (GW), 11.9 (HL) life satisfaction points. They also think saving a life bestows 223 (HLI), 224 (GiveWell) life satisfaction points, implying that they think saving a life is worth averting 19 (HLI) or 26 (GiveWell) cases of 5.46 SD depression.
SoGive considers averting 5.46 SDs of depression to be worth saving 25 lives, which falls between these values[4].
SoGive's moral weights
The remainder of this document (with the exception of the appendices) is a discussion of SoGive's internal moral weights process and how it has evolved during this evaluation, so it may not be of interest to all audiences.
SoGive's benchmarks - "severe" depression, income doubling, and lives saved
The SoGive gold standard as set out in 2021 values averting 25 years of "severe depression" as equivalent to averting 1 death, or doubling the income of 100 people.
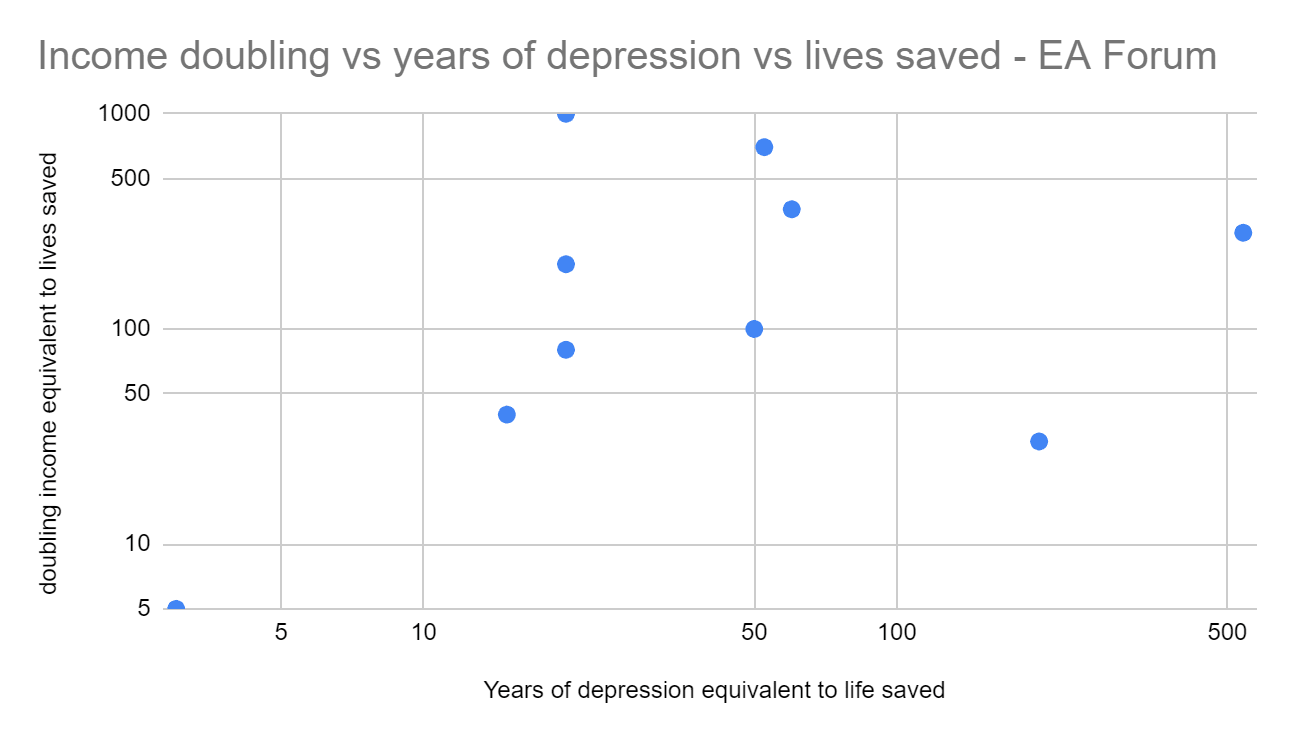
In 2021, before doing an in-depth analysis on depression, SoGive conducted a poll to see how many income doublings and years of depression averted corresponded to a life saved. The result differed wildly (this is a log scale).

We also polled the EA community, the results were somewhat less wild but still difficult to interpret.
Finally, we did a delphi process with a small focus group which included SoGive staff and volunteers. The focus group saw the results of the previous two polls, and were given the opportunity to change their response after seeing other people's responses, but the participants once again did not particularly reach consensus.

It had been decided in advance that the SoGive process would involve setting the moral weights based heavily on the median of the SoGive team’s responses.
Prior to finalising the moral weights, two senior members of the SoGive team (Sanjay and Alex) reviewed these responses and settled on SoGive moral weighting of 1 life being equivalent to 100 years of doubled consumption, or 25 years of severe depression averted. The process involved starting from the median of the SoGive team responses, conducting some sense checks and applying some rounding.
A commonly observed shortcoming of the Delphi process is that it doesn’t provide a clear, canonical rationale for its conclusions. However, as part of the review process when finalising the weights, Sanjay and Alex made the following observations:
- This, at first glance, appears to place more value on tackling depression than one might expect from other DALY weights which tend to be in the range 0.65 to 0.7 for severe depression.
- We judged that the Delphi process appeared to be accounting for concerns akin to those raised by Plant (2022); this process occurred prior to 2022, but we were aware of these concerns independently of HLI, based on our own reviews of DALY/QALY methodology. In particular that the survey methods used in determining those weights may incorporate biases which underweight the severity of conditions like depression.
- As an intuition pump, it seems that some people who are severely depressed are also suicidal, and it seems reasonable to believe that people who feel suicidal at least judge themselves to be experiencing a DALY weighting greater than 100% in that moment.
- In terms of the conversion between one year and one life saved, other global health actors (including GiveWell in, e.g., 2019) have used similar conversions – a conversion of 30.3 years[5], in GiveWell’s case. This largely reflects the use of discounting, specifically a discount rate of 3%. It’s unclear whether participants were explicitly endorsing discounting or had some other rationale in mind. In later work on discounting, we set out reasons why a discount rate of 2.3% might be suitable for this type of discounting, although this was heavily caveated work.
SoGive defining "Severe Depression" as 1 DALYs worth and the implications for the value of a statistical life
After we began the StrongMinds analysis, we ran into a problem: the SoGive gold standard assigns a value to 25 cases of "severe depression averted". But depression is not a binary which is either "severe" or "not severe" and changing the threshold that decides severity can completely change the moral weights.
After discussions between Ishaan and Sanjay regarding what was originally meant by "severe depression", we decided that "severe" ought to mean "you are experiencing something so bad that you'd rather just be unconscious and skip it". In other words, a DALY weighting of >=1, a QALY weighting of <=0, or a neutral to negative experience in a utilitarian framework.
This is a fairly high level of severity. Although the SoGive process found severe depression to be valuable to tackle, our work to define “severe depression” somewhat offset this by saying that the valuable thing is an unusually demanding level of depression.
It is useful to reiterate here the ways in which the Delphi process was unhelpful for us – participants in the Delphi process likely did not have a consistent picture of what was meant by “severe depression”, and we were forced to make a judgement call after the event.
Given the time-trade-off literature above, we decided to set the definition of "severe depression, sufficiently severe that it accounts for 1 DALY " at 5.4 SDs of depression. This corresponds to an improvement of 24 points on the PHQ-9, where the maximum score is 27 and a score of 4 or below is considered non-depressed.
The implications of this choice entail further commitments. If SoGive believes that averting 25 cases of severe depression is equivalent to saving 1 life, and further believes that "severe depression" consists of averting 1 DALY, then it appears to imply that the value of a statistical life is 25 DALYs. In fact, things are more complicated than that. Some of the reasoning employed by participants in the Delphi process included considerations which don’t fit naturally with this model (e.g. replacement effects – saving a child’s life may mean depriving an as-yet unborn child of life, because if parents lose one child they might have another; epicureanism – a death matters because of the suffering it causes, but the years of life lost don’t count because the dead person won’t feel bad about losing those years). It’s not clear how to incorporate the fact that such considerations are indirectly fed into the process. However, for the purposes of enabling progress on this analysis, we operated as if one life were equivalent to 25 DALYs.
Even though life expectancy is typically higher than 25, this isn't necessarily an unusual claim after adding various adjustments. For instance it's similar to GiveWells' 2019 moral weights (which seem to have modelled a death as equivalent to 30.3 years lost to disability).
One way to decide how many adjusted-life years are saved when a death is averted is to take the average life expectancy (e.g. 61 years in Sub-Saharan Africa), do adjustments to account for the fact that not every year of life is a year of full health (e.g. the health adjusted life expectancy (HALE) in sub-saharan africa might be around 55), and then add a discount rate so that future years matter less. For comparison, GiveWell has in the past treated a life saved as being equivalent to 30 years/DALYs; this is based on this World Bank paper (Lopez et al 2006, p402), which suggests that life expectancy at birth is around 30 years if we discount at 3% (and this doesn’t reflect the “HALE” adjustment). See SoGive's Moral Meter tools for lives saved vs doubled consumption and lives saved vs depression averted for more information (Note: these tools are still being developed and are "in beta").
Appendix: Use our tool to find your personal time trade off
Open the User Moral Weights tab on our cost effectiveness analysis.
Step 1: Pick two times you recall well, ideally one in which you were unhappy, and one in which you were happy.
Step 2: Fill out the PHQ-9 for two time points in your life by deleting the pre-filled answers and marking an X next to the spot which applies.
Step 3: How much is that improvement worth to you, in terms of life-expectancy?
SoGive's moral weights are set to being willing to sacrifice 10 months of life expectancy for 10 months of improvement from PHQ-9=4 to PHQ-9=27.
If you, like me, haven't haven't experienced any mental state corresponding to PHQ-9=27, you might find this hard to grasp. This tool allows you to work with mental states which you have experienced.
If you asked me "Would you rather experience 10 months of subjective experience at PHQ-9 score 15, or pay 3 months of life expectancy to upgrade that time to a PHQ-9 score of 4", I would consider those to be about equally good and would have difficulty making the choice.
Therefore, for myself, I indicated that I would be willing to sacrifice 3 months of life expectancy for 10 months of improvement from PHQ-9 = 4 to PHQ-9 = 15. This suggests that I would consider the subjective experience "zero point" to correspond to a PHQ-9 score of 36, much higher than SoGive's 23. What about you?
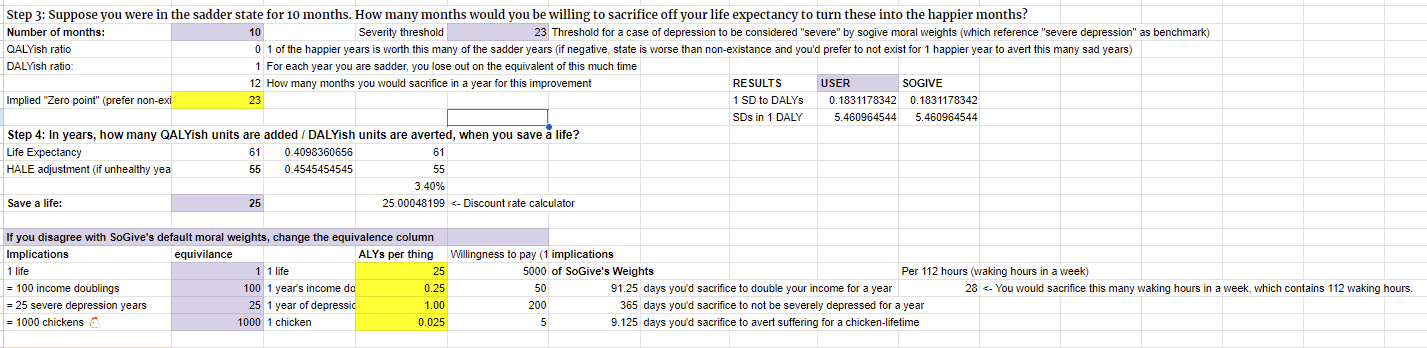
Step 4: When a life is saved, how many adjusted life years do you think that's worth? SoGive moral weights are currently set up such that if you could extend 25 people's life for 1 year right now, that would be as good as saving one child from death. What do you think that number should be?
I tried setting mine to 70, which means that if you extend my life by 70 years, I would consider my life to have been saved. Bear in mind that people in worse health contexts probably don't expect to have 70 years of good health.
Results: You will be able to see both your personal SD to DALY's conversion and your moral weights. The prefilled options will give SoGive's default moral weights, but they will shift in response to your answers to the above. Check that the number of hours you are willing to sacrifice for the given outcome is correct.
If you disagree with any of the moral weights, you can try changing them manually, but make sure that your results are internally consistent with the rest of what you have said.
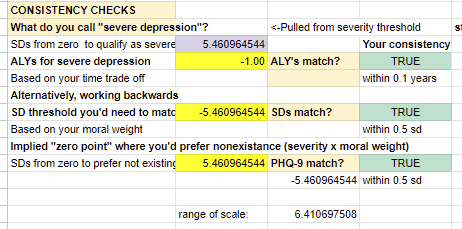
For example, try adjusting the value of income doubling. I'd sacrifice perhaps about 3 hours of life, or endure 3 hours of circumstances so bad that I might prefer to turn off my subjective experience for the duration of that time rather than experience it, to be able to spend twice as much money that week. Per day, that would be giving up a little under half an hour, and 2.7% of my waking hours. That means that every time my income doubles for a year, I've gained about 0.027 adjusted life years, or 9.8 days for that year. If I believe that there are 70 adjusted-life-years to be had in my life, that means I would value saving a life such as mine as much as doubling the income of 2600 people like me. Bear in mind that people in low income contexts probably value cash more than this.
Benefits: We're still in the process of working out exactly what the costs and SD-yers of therapy are, but you can check out the benefits of therapy as per the moral weights you entered. For example, were I to experience 0.18 SD-years of improvement for 6 weekly sessions of therapy, it would be a very good use of my time and money. I would gain about 7.6 adjusted-life-days worth of value that year, as good as increasing my income by 7.6/9.8= 78%, or decreasing my infant mortality by 7.6/(70×365)=0.03%. SoGive default moral weights suggest about twice that amount.

Note: As we saw in the delphi process, people differ widely in which trade-offs they are willing to make. Additionally, as we saw from Sanderson (2004), individuals who are comparing more severe states will likely assign alleviation of that state more moral weight if the question is posed as a time trade off rather than a rating scale. Therefore, it's most likely best to rely more on aggregated responses (as we have done with Sanderson (2004).
Appendix: Why we didn't use suicidal thoughts or behavior to set the zero point
Content note: Extended discussion of suicide.
We tried using suicidal thoughts or behaviors to anchor a specific "zero point" on the PHQ-9 scale which is equivalent to 1 DALY or 0 QALYs, but were not able to identify any such threshold at which suicidal thoughts or behaviors reliably increase. Suicide did not ultimately influence our final moral weights, so reading this section is not necessary to understand this article or its conclusions.
The "zero point" corresponds to a state so bad that a person would prefer to subjectively "skip it", or would trade a year of life expectancy to avert a year of it, or for a utilitarian the threshold between an experience counting as positive and negative utility. Importantly for this discussion, it is not necessarily the state at which it is theoretically rational to choose suicide, because it only describes how a person feels right now, not how they will always feel: Within the framework of maximizing points on this scale, a person experiencing life below the "zero point" rationally ought to persist in the hope that future years would involve states of being that are above zero. This hope would be well justified, considering the fairly robust spontaneous remission rate.
Given that most cases of depression do remit even without treatment, suicide due to depression would almost always be a net welfare loss within an "adjusted life year" type of framework even if one sets the zero point at a fairly high level. Therefore, the vast majority of suicidal behaviors, thoughts, and impulses which are attributed to depression severity specifically can't be considered a case of rational choice or revealed preference, and can't be straightforwardly plugged into this framework without breaking internal consistency. Nevertheless, if there was a particular threshold of subjective badness beyond which suicidal thoughts and suicidal attempts reliably began, it might be used to anchor intuitions and set some lower and upper bounds for where the "zero point" might be.
In the hopes of grounding the "zero point" in something more empirical, we did try and check whether there was a specific point on the depression scale beyond which people do, in fact, tend to choose suicide, or a particular threshold at which suicidal thoughts begin to arise. We were unable to identify any such clear point or threshold - suicide risk is associated with both increasing depression score and with increasing self-reported suicidal ideation, but is not particularly well predicted by it (Na, 2018), with one paper (Simon, 2013) finding that 25% of suicides self-reported no suicidal ideation.
Our overall impression is that the act of committing suicide is better predicted by disorders of impulsivity rather than depressive symptoms, questionnaires regarding suicidality are relatively poor predictors of suicidal behavior, and that while suicidal thoughts are a depression symptom, we were unable to ascertain specific threshold of badness at which they appear. We therefore continue to instead rely on time-trade-off estimates in setting the zero point.
Citations
General resources from SoGive
SoGive Cost-effectiveness analysis, StrongMinds (in progress)
SoGive's Gold Standard Benchmarks
Joshi (2022), "SoGive review of GiveWell’s discount rates", SoGive
Time trade off data
Sources relating to ascertaining what SD range was appropriate for time trade off
SoGive calculations
Metapsy
Pim Cuijpers , Clara Miguel , Mathias Harrer , Constantin Yves Plessen , Marketa Ciharova , David Ebert , Eirini Karyotaki (2022) . Database of depression psychotherapy trials with control conditions. Part of the Metapsy project (Version 22.0.2 ). URL docs.metapsy.org/databases/depression-psyctr DOI https://zenodo.org/doi/10.5281/zenodo.7254845 Github: https://github.com/metapsy-project/data-depression-psyctr/tree/22.0.2
References relating to questionnaires
Free Online SF-12 Score Calculator - OrthoToolKit (n.d.). https://orthotoolkit.com/sf-12/
Other EA organizations
[public] 2020 update on GiveWell's moral weights - GiveWell
Suicidal ideation
- ^
We decided to use the PHQ-9 as an anchor point from which to build out our moral weights, because the PHQ-9 is used by StrongMinds internal M&E, was previously used by Founders Pledge's M&E, because we previously generated conversion scales for it, because PHQ-9 scores were closest to the weighted average of all questionnaire types for pretreatment mean score distance from minimum and maximum scores, and because it is quick and convenient to take.
- ^
Sanderson (2004) "remitted" cutoff likely between PHQ-9 = 1 and PHQ-9 = 4, centred at PHQ-9 = 2.95: To do a rough check of this, Ishaan filled out both questionnaires and got SF-12 MCS = 47.5 and PHQ-9 = 4. The SF-12 MCS is designed to have a standard deviation of 10, and the PHQ-9 has a standard deviation of 4.2, which suggests that if Ishaan's answers are representative then Sanderson (2004) would consider patients depressed with a PHQ-9 score of 4-(50-47.5)/10*4.2=2.95 or more. PHQ-9 considers people not depressed if they score 4 or less, and depressed if they score 5 or more.
Of note, our last post included a section on estimating the general population's depression level" , where we estimated that after correcting for floor effects, the general population would have a PHQ-9 score of approximately 1.22, whereas the SF-12 MCS has a mean of 50. This mildly contradicts the calculations above - which could mean that in reality the general population is closer to a PHQ-9 score of 2.95. However, it could also be an idiosyncrasy of how I took the test, or it could mean that PHQ-9 exerted its floor effects on the way that I took the test (since the PHQ-9 has no options better than "neutral" whereas the SF-12 MCS has actively "positive" items like "feeling calm and peaceful" and having a "lot of energy").
Based on these facts, we think it's probably pretty reasonable to posit that Sanderson (2004) raters consider some state in between PHQ-9 score 1 and PHQ-9 score 4 as being "in remission", with our central guess being that "remission" in Sanderson (2004) means PHQ-9 = 2.95
- ^
Typical therapeutic effect starts within the 2-3 SD range. We find that the average METAPSY RCT participant begins treatment somewhere between 0.24*(13.78-4)= 2.3 SDs and 0.24*(13.78-1)= 3.1 SDs from what Sanderson (2004) describes as the remission cutoff.
In our previous article we reported that among the 5 most commonly used depression scales administered in the METAPSY database, the mean score tended to be 50% of the way between zero and the highest possible score, with zero being 3.2 SDs from the mean. Each point on the PHQ-9 is 0.24 SD. With the average PHQ-9 score being 13.78, and with our previous estimate that that Sanderson (2004) remission cutoffs are equivalent to between 1 and 4 phq-9 points, the average METAPSY RCT participant falls somewhere between 0.24*(13.78-4)= 2.3 SDs and 0.24*(13.78-1)= 3.1 SDs from what Sanderson (2004) describes as the remission cutoff.
The general equation is
PHQ-9 SD)×(PHQ-9 mean-remission cutoff), with means and SDs taken from Metapsy and 1, 2.95 and 4 previously established as some reasonable places to consider the remission cutoffs as being. - ^
When represented on the table above, thesee values are multiplied by the value of averting 5.46 sd-years depression (for example SoGive's column would be 25*114%=28.59
- ^
The 30.3 figure is calculated using the 2019 column on the table on page 8. Saving a life is worth 100 consumption doublings, and averting one Year Lived with Disease/Disability (YLD) is worth 3.3 consumption doublings, which implies that saving a life is worth 100/3.3= 30.3 DALYs.

So glad you're looking into this.
Interesting to see that you didn't use IHME's DALY weights for mild, moderate and severe depression, which are derived from surveys of ordinary people making pairwise comparisons (GBD, 2019).
[Figure from WHO (2020).]
In my report on mental health interventions (
coming soon!) I took data from Pyne et al. (2009) which asked sufferers, ex-sufferers and never-sufferers of depression to rate the badness of different levels of depression. My analysis of the data suggests that sufferers rate depression to be approximately 20% worse than a typical person would. Interestingly, this phenomenon of rating your own condition worse than others would does not seem to hold for most health conditions (see Pyne et al., 2009).I also tried to model the DALY burden that comes from the additional suicide risk associated with depression, and reached an estimate of 0.066 DALYs for each year of depression. This is contingent on some dodgy data on the effect of depression on suicide rates, and ought to vary a lot by gender and nationality.
Putting it all together, I got an estimated weighting of 0.392 for an average case of depression. My central estimate is 0.145 DALYs per SD of depression symptoms, so about 22% lower than yours.
Thanks very much for the comment, this is really interesting. The idea of explicitly adding in suicide risk is an interesting direction for the analysis, it sounds like good work. When you publish your paper, I'll be interested to consider whether the underlying estimates of the badness of depression (perhaps implicitly) already reflect the suicide angle.
At some point it might be useful to do a more careful compare and contrast between your method (using Pyne et al's paper) and our method (using the Sanderson paper). Given that the methods are quite different, if anything, I think it's actually quite striking that the methods ended up with numbers that are actually fairly similar (0.145 DALYs per SD-year vs 0.18 DALYs per SD-year).
The report is now public: https://forum.effectivealtruism.org/s/ykdScawzq59ntw9N3