Summary
- We have developed a methodology to estimate how much money any U.S. charity is losing every year by keeping money in low-interest accounts
- This methodology is easy for anyone to replicate and is based on publicly available nonprofit financial statements (IRS Form 990) that all U.S. charities are required to file yearly
- We approximate GiveWell’s five-year opportunity cost at $4 million dollars, and other EA charities have six-figure or seven-figure five-year opportunity costs as well
- Like most U.S. charities, many EA charities across various cause areas do not follow the best practice of storing cash in high-interest accounts (which have the same level of risk as low-interest accounts)
- It only takes several hours of staff time for organizations to set up a high-interest account to move money into (similarly quick to opening up a personal savings account online)
- High-interest accounts are considered a best practice at major companies like Apple, Google, and Facebook, as well as at large EA charities like the Against Malaria Foundation
- See our comprehensive EA Forum post in 2019 for more information on selecting low-interest and high-interest bank accounts and investment options
- Actions an EA community member can take:
- Contribute online by posting on our action thread: scroll to our action thread in the comments section
- Advise one or more EA organizations you have a close connection with
- We’ve been able to help all of the charities our staff have previously worked at to make these improvements, but we’ve noticed that the less connected we are with an organization, the harder it is to get in touch with their staff
- We hope that readers can help us make the case for better cash management practices to a wide range of EA charities—by doing so, any given reader might be able to "contribute" up to millions of counterfactual dollars to these organizations
- Take action by directly advising an EA organization you are closely connected with, or by filling out our outreach request form
- This article was published by Antigravity Investments, an EA social enterprise with the mission of leveraging finance to drive millions of dollars to high-impact charities
- Our intention here is to simply encourage institutional behavior change and engage in discussion on cash management practices; this recommendation can be implemented independently of our involvement
- The ideas expressed in this article are also available as a 10-minute EAGxVirtual Unconference talk
Form 990
The majority of charities, including EA charities, do not optimize their interest on cash. In this section, we will introduce our cash interest opportunity cost estimation methodology for U.S. 501(c)(3) charities and use GiveWell’s Form 990 as an example.
The U.S. tax collection agency known as the Internal Revenue Service (IRS) requires that all tax-exempt organizations, including charities, fill out a financial report known as Form 990 every calendar or fiscal year. The IRS mandates that all Form 990 reports be made publicly available.
The Form 990 report for any nonprofit can be found with a quick Google search. GiveWell’s historical Form 990 reports, and other financial information, can be found on its official records page. The IRS’s official instructions for Form 990, the primary source for our analysis methodology, can be found here. We consulted with the IRS and an independent CPA to get their input on various facets of our methodology.
Here is a link to GiveWell’s 2019 Form 990 report (the most recent Form 990 available at publication) which we will use as an example: https://files.givewell.org/files/ClearFund/Clear_Fund_2019_tax_return_Form_990.pdf
Calculating Cash
The balance sheet of any organization describes what it owns as well as what it owes to others. The Balance Sheet (Part X) on every Form 990 contains two key bits of information we will use.
Line 1 of the Balance Sheet titled “Cash—non-interest-bearing” describes how much money a nonprofit keeps in accounts that pay zero interest.
Line 2 of the Balance Sheet titled “Savings and temporary cash investments” describes how much money a nonprofit keeps in accounts that pay any amount higher than zero interest.
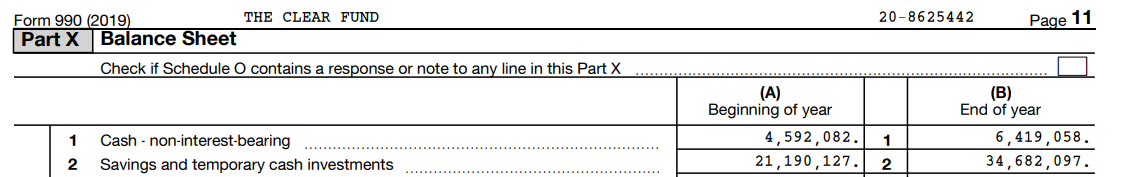
GiveWell’s Balance Sheet (GiveWell is legally known as The Clear Fund) indicates that it held $6,419,058 in zero-interest accounts and $34,682,097 in non-zero-interest accounts at the end of 2019, for a total of $41,101,155 in cash.
Calculating Interest
The Statement of Revenue (Part VIII) on Form 990, which is similar to an income statement, breaks down the sources of income a nonprofit earned during the year.
Line 3 of the Statement of Revenue titled “Investment income (including dividends, interest, and other similar amounts)” describes how much interest a nonprofit earned throughout the year from its cash and investments. Interest on a nonprofit’s investments, which is separate from a nonprofit’s cash holdings, can greatly inflate the amount reported on Line 3 above the interest a nonprofit earns solely on its cash. Therefore, Line 3 represents a maximum bound for how much interest a nonprofit earned on its cash during the year.
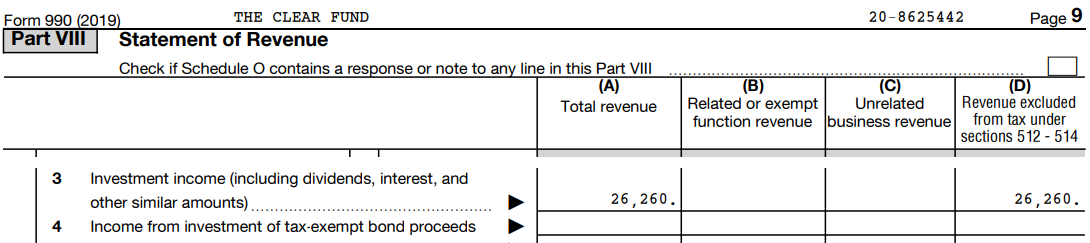
GiveWell’s total cash and investment income in 2019 was $26,260. GiveWell held investments in 2019, so using the full amount on Line 3 to estimate GiveWell’s interest on cash in 2019 likely overestimates GiveWell’s actual interest earned on cash in 2019.
Dividing $26,260 by GiveWell’s end of year cash balance in 2019—the $41,101,155 we calculated in the previous section—produces an upper bound interest rate of 0.0006389, or 0.064%.
The U.S. federal funds rate, an interest rate that represents the minimum bound of a good rate of interest on a savings account, averaged around 2.16% in 2019.
Multiplying GiveWell’s $41,101,155 in cash at the end of 2018 by a 2.16% rate of interest yields a total of $887,785 in potential interest earnings which is nearly 34 times higher than the actual investment income GiveWell earned.
Subtracting the $26,260 upper bound on how much GiveWell actually earned on its cash in 2019 results in an annualized opportunity cost of $861,525.
Calculating Opportunity Cost
A more precise estimate of GiveWell’s opportunity cost involves making several adjustments, including switching to calendar years rather than using the more recent end-of-year cash balance.
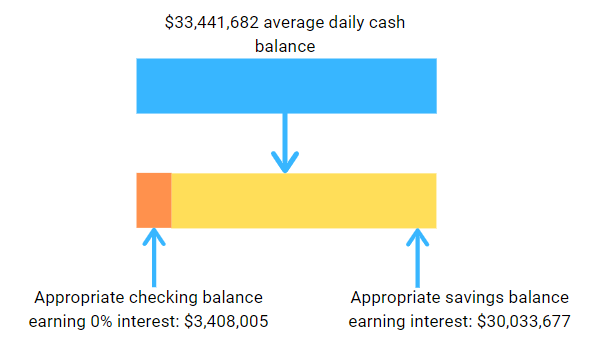
GiveWell earns interest on its average cash balance during the year, rather than its cash balance at one point in time like the end of the year. We can better approximate this figure by averaging GiveWell’s beginning of year and end of year zero-interest and non-zero-interest cash and then summing them. This produces an estimated average cash balance in 2019 of $33,441,682.
Although high-interest checking accounts exist, we can ignore 30 days of GiveWell’s spending when calculating opportunity costs, because organizations may keep a few weeks of typical spending in their checking account which typically pays no interest. JP Morgan calculates that the average small business keeps 27 days of typical spending distributed across checking and savings accounts. Transfers between accounts only take several business days, so recommendations for companies to have a cash buffer usually don’t distinguish between keeping the buffer in a checking account or in savings accounts, as long as the company has a buffer. GiveWell may want to keep 30 days of expenses in its zero-interest checking account to cover day-to-day transactions and keep the rest in savings. Ideally, GiveWell should transfer money from checking to savings and vice versa as needed to maintain a 30-day buffer in its checking account.
Line 25 of the Statement of Functional Expenses (Part IX) titled “Total functional expenses” is the sum of a nonprofit’s total annual spending.
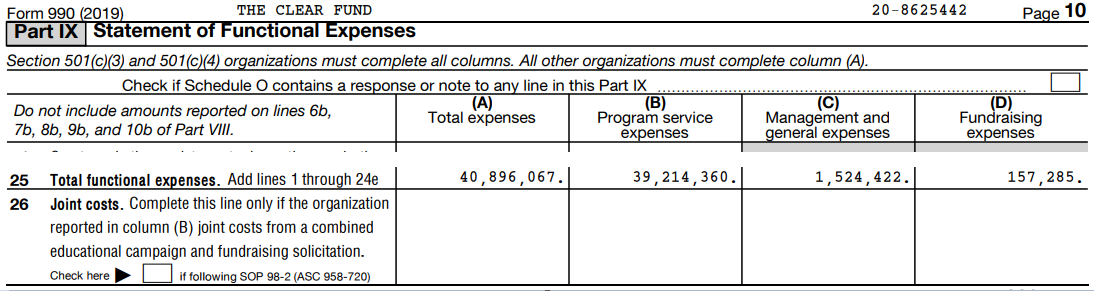
We can divide GiveWell’s $40,896,067 in 2019 spending by 12 to get a 30-day cash buffer of $3,408,005. By subtracting the $3,408,005 cash buffer from GiveWell’s $33,441,682 estimated average cash balance in 2019, we can calculate a reasonable amount of money GiveWell should be storing in a savings account. We get a reasonable savings balance of $30,033,677. It appears like GiveWell is already following the best practice of not keeping too much money in zero-interest accounts.
Thus, GiveWell’s estimated interest rate in 2019 is the $26,260 upper bound interest income divided by the $30,033,677 reasonable savings balance to get 0.0008743, or 0.087%.
Multiplying the $30,033,677 reasonable savings balance by a 2.16% federal funds rate of interest yields a total of $648,727 in potential interest earnings. Subtracting the $26,260 upper bound on how much GiveWell actually earned on its cash in 2019 results in a calendar year opportunity cost of $622,467.
As a reminder, investment income represents an upper bound on a nonprofit’s annual cash holdings because it also includes earnings from a nonprofit’s investments. Some charities derive significant investment income while keeping large amounts of cash in zero-interest accounts. To account for this rare scenario, a nonprofit’s zero-interest cash balance can be multiplied by the market rate of interest during the nonprofit’s tax period to get its zero-interest cash opportunity cost. Multiplying GiveWell’s $5,505,570 estimated average zero-interest cash balance by 2.16% yields $118,920.
The higher of the reasonable savings balance and zero-interest opportunity cost calculations—$622,467 rather than $118,920 in GiveWell’s case—should be used to estimate a nonprofit’s annual opportunity cost since both numbers are lower bound estimates.
The 2.16% U.S. federal funds rate in 2019 is one of the most conservative interest rates possible. Higher interest rates would result in significantly higher annual opportunity costs. Our top recommendation for an ultra-short-term bond ETF (JPST) in our recommendation article published in early 2019 earned 3.34% in 2019, according to Portfolio Visualizer. There were no drops in account value on a monthly basis (0% maximum drawdown). Multiplying GiveWell’s $30,033,677 reasonable savings balance by 3.34% generates an opportunity cost of over one million dollars per year, at $1,003,124.
Using an even higher interest rate of 5.51%, which is what a very conservative portfolio of 20% stocks and 80% bonds earned on average (CAGR) from January 2000 to December 2019 calculated using Portfolio Visualizer, the one-year opportunity cost on GiveWell’s 2019 reasonable savings balance would be $1.65 million dollars a year. The 5.51% figure is an approximation of GiveWell’s expected opportunity cost rather than what it would have experienced, which would have been a small loss of -1.15% in 2018 followed by a 13.01% gain in 2019. For those curious about how this portfolio would have fared during COVID-19, the maximum negative month-over-month change in account value was -3.20% since the beginning of 2020; the portfolio is now up 9.11% for the YTD period ending November 30, 2020.
Estimation Methodology Caveats
The average of a nonprofit’s start of year and end of year cash could noticeably underestimate or overestimate a nonprofit’s actual average cash balance during the year because it only uses two days as data points rather than all 365 days in a year which is not available from the Form 990 data. If the estimated cash is lower than the actual cash, the actual rate of interest is lower than the estimated rate. Additionally, the total cash a nonprofit can earn interest on is higher than the estimated amount of cash which can considerably increase the opportunity cost. Overstating daily cash has the opposite effect, meaning the actual rate of interest is higher and the opportunity cost is lower.
Investment income in Form 990 represents the absolute upper bound interest income a nonprofit earned from its cash holdings during any given year. This enables us to be relatively certain a nonprofit is not using its cash holdings well if it has low investment income relative to its reasonable savings balance. Unfortunately, most charities likely do not optimize their cash holdings, but this cannot be determined from the reported Form 990 investment income because that figure also includes income they earn from investments. This means that our methodology is good for identifying some poor performers, but cannot reliably be used to estimate high performers when it comes to cash holdings. If a nonprofit has positive values for Lines 5, 6, 7, 11, 12, or 13 on the Balance Sheet (Part X), that indicates other factors are contributing to investment income besides a nonprofit’s cash holdings (Lines 1 and 2).
Estimating Counterfactual Impact
GiveWell has Form 990 data going back more nearly 14 years. In those 14 years, it did not attempt to improve the yield on its cash. Since we have no way of knowing when GiveWell would otherwise optimize the yield on its cash, we could use the Copernican Principle and assume we are at the midpoint of when GiveWell would optimize its cash. Multiplying GiveWell’s $622,467 estimated 2019 opportunity cost by 14 years yields an estimated impact of $8,714,538. Given the number of charities that have not optimized their cash yields, this doesn’t seem like an unreasonable approach.
GiveWell’s specific finances inspire another approach. GiveWell started 2015 with $8,179,232 in cash, 2016 with $12,177,201 in cash, 2017 with $13,184,319 in cash, 2018 with $19,598,155 in cash, 2019 with $25,782,209, and 2020 with $41,101,155. Using least squares regression, GiveWell’s five-year cash growth rate is 35.83%. It is likely that organizations with more cash—and thus more potential opportunity costs—will seek to optimize their yield sooner rather than later, decreasing the number of years of counterfactual impact. However, GiveWell’s cash growth also means that its opportunity costs rise rapidly over time, increasing the opportunity cost every year.
Assuming we’ve encountered GiveWell three-fourths through the timeline when GiveWell would otherwise have started looking into how to increase its yield on cash, we are at year 14 out of 19. Using a five-year time period, a $30,033,677 reasonable savings balance, a 35.83% growth rate on GiveWell’s reasonable savings balance, and a recommendation that increases GiveWell’s interest on its reasonable savings balance by 1% compared to what it would have earned otherwise, the counterfactual impact of advising GiveWell is an additional $4,126,003 towards GiveWell and the top charities that GiveWell regrants to.
Regardless of the estimation method, it’s very likely the counterfactual impact of changing GiveWell’s financial practices is in the millions of dollars. Not bad for a time investment that should take between 1–10 hours of staff time to set up, and 0–2 hours of staff time to administer on an annual basis! In general, the two time requirements are (1) filling out a one-time application to open a higher-interest account and (2) making online transfers between accounts on an ongoing basis, perhaps once a month. These time requirements are around the same order of magnitude it takes to create a new personal savings account (perhaps three hours for an organization instead of one hour personally) and move money between personal bank accounts (perhaps three minutes for an organization instead of one minute personally). An optional one-time requirement, and perhaps the most time consuming, is staff evaluation and deliberation time around whether and how to implement this change within an organization. We typically speak with the person in charge of finances at a charity, whether that’s the executive director, head of operations, or CFO, who is more financially experienced and can make the decision without escalating the request. Answering the common questions of (1) why some accounts pay higher interest than others, (2) why high-interest accounts have the same risk as low-interest accounts, and (3) how to implement a solution usually only takes several minutes per question.
In general, the counterfactual impact of successfully making a case for better cash management at any organization is likely at least several times higher than the annual opportunity cost, given that organizations would likely incur at least several more years of suboptimal cash interest before implementing better cash management.
Actions for the EA Community
Here are the results of applying this same methodology for a few EA organizations:
Year | Average Cash Reserves | Investment Income | Estimated Interest Rate | Interest Rate for Fiscal Year | 1 Year Opportunity Cost | |
| GiveWell | 2019 | $33,441,682 | $26,260 | 0.087% | 2.16% | $622,467 |
| The END Fund | 2019 | $23,687,145 | $33,859 | 0.160% | 2.16% | $421,962 |
| BERI | 2019 | $4,390,669 | $423 | 0.010% | 2.16% | $88,106 |
| Helen Keller International | 2018 | $31,617,052 | $126,041 | 0.498% | 2.23% | $438,357 |
| Centre For Effective Altruism | 2018 | $9,314,112 | $221,861 | 0% | 1.79% | 156,610 |
| New Incentives | 2018 | $5,206,747 | $4,918 | 0.097% | 1.79% | $85,705 |
| Good Food Institute | 2018 | $5,042,465 | $40,260 | 0.883% | 1.79% | $41,345 |
| Sightsavers Inc | 2018 | $1,729,604 | $0 | 0% | 1.79% | $24,402 |
| Animal Equality | 2018 | $1,006,894 | $0 | 0% | 1.79% | $12,937 |
We have spoken to dozens of charities, and the only implementation objection voiced to us so far is a lack of staff time. GiveWell mentioned in our last formal communication with them in February 2019 that “GiveWell has historically not engaged in that kind of active money management because we [do] not have the operational bandwidth to do so.”
Given the magnitude of the opportunity costs involved—equivalent in 2019 to hiring 13 full-time research analysts or deworming 600,000 people a year and growing in GiveWell’s case—and the ease of implementing a solution, we believe all charities should implement better cash management if the opportunity cost exceeds the several hundred dollars in staff time (<10 hours) it should take to implement. Furthermore, volunteers across the EA community and within our team are willing to help organizations implement a solution at no cost.
We’ve noticed that the less connected we are with an organization, the harder it is to get in touch with their staff and build trust. We hope that readers can build upon our work by helping us make the case for better cash management practices to a wide range of EA charities—by doing so, any given reader might be able to "contribute" up to millions of counterfactual dollars to these organizations. You can take action by commenting on our action thread in the comments section, directly advising an EA organization you are closely connected with, or by filling out our outreach request form if you work at a charity or are closely connected to one.
-
We founded Antigravity Investments because we realize people and charities can be unfamiliar with common ways to increase their income using investing. Charities face implementation barriers such as certain banking and investment accounts being difficult to open and a lack of staff experience with finance and investing. We’ve developed various solutions to overcome these issues. We make it extremely easy for charities to open high-interest cash accounts with reputable providers like StoneCastle, and help charities get started with optimizing their cash holdings at every level of desired risk and returns. To learn more or request free advising, email support@antigravityinvestments.com
Thanks to Benjamin Pence, Caroline Jeanmaire, and Aaron Gertler for their assistance in reviewing this article. Reviewers do not necessarily endorse the views expressed in this article.
The U.S. Federal Funds rate has been effectively 0% since April 2020 and was roughly 0% for six years from 2009 to 2015. The same is roughly true of the UK. Central banks in both countries are saying they'll keep rates low for years to come.
I can't immediately find a reputable business savings accounts in the UK/US that currently offers more than 1%.
Those that offer the highest rates (something approaching 1%) on comparison sites tend to have conditions (e.g. you lock the money up for a period, or have to keep depositing regularly), and usually have a maximum amount on which you can earn interest, a maximum which is low enough to be binding for these organisations.
These accounts usually offer a high rate to attract customers for a while, then dramatically reduce the interest rate and trust you won't be bothered moving your money. I think that's their basic business model.
Opening bank accounts for non-profits, at least in the UK, is a pain — something that will take a few weeks, and some time/attention from the operations team, management and trustees (who are needed for e.g. security checks). It looks like you usually won't be able to put in more than a million dollars/pounds in any given account, often less.
So you'd need to open many accounts, keep track of them, secure the chequebooks, have them audited annually, integrate them into your bookkeeping system, change the signatures when staff turn over, figure out the idiosyncratic requirements to pull out money when you need to, and so on.
This may sound simple but if you've worked in operations you'll know it's actually a big hassle.
In return, for each account opened you make <£10k a year, and probably need to keep closing accounts and moving your money into new ones every few years, as the teaser rate used to draw you in is removed.
This may all be worth it, but it's far from a no-brainer, as these organisation have other fruitful projects they could be using staff to pursue.
Thanks for your thoughtful reply Rob!
To quote my reply to GMcGowan, "We used the latest Form 990 data from 2018 and 2019 and the associated interest rates from those years to calculate the prior-year opportunity costs as accurately as possible, which is a separate calculation than estimating the forward-looking counterfactual impact." In other words, the 2.16% is meant to be a conservative rate of interest a charity could earn by holding cash in a respectable savings account in 2019 rather than a forward-looking projection.
The federal funds rate is a good rate to use for historical analysis because we have very granular data for what it is in the past, whereas to get savings accounts yields themselves, we might need to use a third-party service or design a benchmark ourselves. Given the current situation with the federal funds rate, it would make sense for us to find a better proxy for good savings accounts yields in 2020 so that we can better estimate the opportunity cost for 2020 once the 2020 Form 990s come out as well as use the rate as a point of reference for current and future expected earnings.
I think the recommendation in this article is timeless, so the specific numbers don't matter that much. In fact, if the interest rates are lower, organizations are even less likely to do this, so the counterfactual impact decreases along the lines of expected interest increase but increases with the timeframe of impact before the organization would have otherwise implemented these changes.
In the "estimating counterfactual impact" section of this article, I use a 1% average improvement over the next five years to estimate GiveWell's opportunity cost over the next five years rather than, say, 2.16%. Right now, the rates are below 1% as you say. I see savings account options around the 0.5% and 0.6% range in both the US and the UK, although they've been higher earlier this year even after COVID-19.
You mention challenges with opening and managing bank accounts like:
I have three responses. First, given the magnitude of the opportunity costs involved, most organizations with significant cash holdings should do this since the benefit is greater than the operational complexity (maybe a higher cash threshold for organizations wanting to hold money in UK banks). All organizations mentioned in the table have cash holdings of over $1,000,000.
Second, I think you've articulated some great reasons why Antigravity Investments should exist! On the surface, it might appear challenging to solve this problem, so having one person or organization figure this out and make the recommendation to multiple organizations and help with implementation as needed seems like a much more efficient model compared to having operations/finance team members at each organization relying on their preconceived notions to evaluate the benefits of this, plus needing to figure out the implementation component all by themselves.
Third, because Antigravity Investments exists, the EA community is now aware that there are institutional cash management solutions that overcome the challenges you mentioned. While it's better to directly contact Antigravity Investments for our latest recommendations, I wrote a DIY guide to institutional cash management in my 2019 EA Forum article (which is the solution to the opportunity cost problem mentioned in this forum post, although slightly outdated).
I've mostly been focusing on the United States and business savings accounts seem easier to open here. However, it so happens that I have done some preliminary exploration for the UK where you seem to have more experience with dealing with bank accounts. I'll mention several solutions, which address all of the concerns you mentioned.
In my original article, I mention a service called StoneCastle: "Our recommended solution is StoneCastle’s AAA-rated Federally Insured Cash Account (FICA). FICA works by continually analyzing yields at hundreds of U.S. banks and automatically storing cash at each high-yield bank up to the $250,000 FDIC insurance limit." Basically, you open one account, and that one account automatically optimizes the yield across hundreds of banks. The application is a very short PDF that can be filled out and submitted quickly and completely digitally. StoneCastle is open to international clients that want to store funds in USD.
As I mention in a comment on my 2019 article, "We're in the process of investigating options in the UK. Right now, Flagstone looks very promising, particularly for charities and large account sizes."
Flagstone is a somewhat similar service to StoneCastle but for UK cash deposits. It allows charities to open a single account and gain access to the best rates across (as of the time of writing) 45 partner banks. Unlike StoneCastle, money isn't moved automatically, but it can be moved at the click of a button. Flagstone appears to overcome the discovering reputable banks problem, the interest rate teaser problem, the switching bank accounts to get the highest yield problem, the account maximum balance problem, and the complexities of managing multiple accounts problem that you mentioned.
As mentioned in my original article and briefly in this article, storing money in ultra-short-term bonds or other investments is another good approach. Then, there's only a single brokerage account, and no bank-related complexity. Options like ultra-short-term bonds are safe relative to other investment options and also have a higher expected yield than savings accounts. Organizations can manage a brokerage account with a DIY approach, which could be as simple as making a couple-minute trade in a brokerage account every few months, or have an external service (like us) handle that.
I agree with Rob's points.
This article makes several statements that I interpret as somewhere between intentionally misleading and outright incorrect.
For instance, this reply says the 2.19% Fed Funds rate was the prevailing rate in 2019, and isn't intended to be a forecast of the future. But since we know the Fed Funds rate is 0% today, why would that rate be used to argue for a forward-looking change in behavior?
Similarly, the 2019 return of a short-term bond fund gives literally no information about what returns a similar fund would offer today. Indeed the beauty of the bond market is that it does offer guaranteed future returns if you hold a bond to maturity. As of today, US government bonds (which carry no risk of default) offer a guaranteed annualized return of:
So assuming an organization needed to make a grant within 12 moths, they could currently expect to make 0.10% on their cash balance. Needless to say this is 1/10th of 1%, or <1/20th of the figure cited in the post. And it seems a stretch to assume organizations hold cash for 12 months before granting it. So the likely benefit is perhaps at best 1/10th and potentially <1/100th of what's cited here.
Granted, this is not necessarily obvious stuff. However it is and should be easily understood by anyone holding themselves out to be giving financial advice to other people or institutions.
Could you list out those statements? Are you talking about the article, or my comments? I would certainly not want to intentionally mislead, nor be outright incorrect.
As I state in the introduction, "In this section, we will introduce our cash interest opportunity cost estimation methodology for U.S. 501(c)(3) charities." The majority of this article is about open sourcing the estimation methodology we developed, which took considerable effort over multiple years. We analyzed financial data across over 300,000 nonprofits and ran the methodology past the IRS and an independent accountant. This methodology was not designed to forecast future opportunity costs, and doing so seemed especially unnecessary in the pre-COVID-19 environment of rising interest rates that we originally developed the methodology in.
As you can see by the dollar amount of the $4 million dollar forward-looking estimate for GiveWell (based on a 1% interest rate), the interest rate does not need to be 2% for this recommendation to make sense. Current bank yields are 0.5%, so if we assume that's the case for the next five years, the five-year benefit is $2 million instead. Given that the implementation time is, say, a conservative 20 hours, the associated staff time cost might be 20 * $100 = $2,000. Should GiveWell spend $2,000 to make $2,000,000? That's a 1000x ROI.
Part of the reason why the article was mostly about my estimation methodology is because the exact forward-looking numbers don't change the conclusions of the article.
You are citing numbers for an unappealing option to store cash in, and using that to argue that that's the best that organizations can do. Furthermore, you're doing this after I already mentioned bank interest rates of 0.5%+ in my reply to Rob that you are replying to. A quick Google search indicates that there are lower risk options (business savings accounts) that yield 0.5% and upwards. I have no idea why you are quoting a 0.10% figure.
You may not be understanding what the article means by "cash balance." As I make very clear in the article, we are using the organization's estimated average daily cash balance to calculate the historical and future opportunity costs. The average daily cash balance is the amount that an organization literally makes interest on; I can't think of a better number to use to calculate the interest an organization previously made and could be making in the future. All organizations have a cash balance, which we can say is the amount of cash in their checking and/or savings accounts, that they regularly make grants out of. As you can see from the historical opportunity cost estimation, clearly organizations have cash reserves on hand, and clearly those cash reserves could be earning more interest than they are now, regardless of whether or how they make grants.
Sure:
Cash balance methodology
You say:
Incorrect and misleading statements in these four paragraphs:
In your reply to me you suggest:
Even this approach seems incorrect or misleading:
Potential returns of other investment options
You say:
Citing the one year, backward looking return of JPST is misleading, and citing the one year drawdown performance is naive:
Conclusion and staff time
You say:
Thanks for taking the time to list those out Steve. I downvoted your comments because while I'm very happy to engage in this type of discussion with commenters, and have with others that have commented on this article, I feel like you are jumping to conclusions that things are "incorrect" or "misleading." In fact, many of your points are already mentioned in the article itself. Additionally, you are attacking my writing by making comments like something is "naive" which I feel is not conducive to a positive and intellectual discussion about this. You'll find that I've thought out the reasoning for all of the points you mention, either in the article itself, or because it's fairly easy to understand why.
Cash balance methodology
In the sentence directly above this quote, I explain what I mean by upper bound: "GiveWell’s total cash and investment income in 2019 was $26,260. GiveWell held investments in 2019, so using the full amount on Line 3 to estimate GiveWell’s interest on cash in 2019 likely overestimates GiveWell’s actual interest earned on cash in 2019."
I am saying that the number overstates the interest earned on cash alone because of the confounding effect of investment income.
The reason why this methodology is being used is stated in this first line of the article "This methodology is easy for anyone to replicate and is based on publicly available nonprofit financial statements (IRS Form 990) that all U.S. charities are required to file yearly."
The Form 990 does not include a better estimate of an organization's average daily cash balance. This is why I am calling this an "estimation" methodology. In the "Estimation Methodology Caveats" section I cover this and other issues in depth (and I've already mentioned this to other commenters, who also brought up this valid point). A short quote: "The average of a nonprofit’s start of year and end of year cash could noticeably underestimate or overestimate a nonprofit’s actual average cash balance during the year because it only uses two days as data points..."
GiveWell is used as an example—this analysis is meant to highlight the methodology, including its shortcomings, not be a deep dive into GiveWell itself. I don't have the data needed to estimate this better. Neither you nor I know how much money GiveWell actually holds during other times of the year. They receive funds year-round and need reserves on hand to pay operational expenses.
That is not correct, the workaround is, as I state in the article, meant to account for the confounding effects of money made from investments rather than cash holdings by only looking at the cash balance we know isn't earning any interest. This "workaround" has nothing to do with the cash balance issue you mentioned.
Thanks for pointing this out. I didn't look more closely into GiveWell's specifics because GiveWell is used as an example of a methodology that generalizes to other charities as I stated in the article. Data like this is very difficult to correlate with an organization's cash balance. We don't know what percentage of GiveWell's cash balance the Maximum Impact Fund is, what the Maximum Impact Fund balance is after a grant is made, whether the "amount" column reflects all donor inflows during a specified period or also granting from reserves or other revenue sources, etc.
The most recent data is most relevant to GiveWell's current and future opportunity costs.
That is a good point! Time did not permit, but as I stated in my reply to Rob, I do think that "to get savings accounts yields themselves, we might need to use a third-party service or design a benchmark ourselves. Given the current situation with the federal funds rate, it would make sense for us to find a better proxy for good savings accounts yields in 2020 so that we can better estimate the opportunity cost for 2020 once the 2020 Form 990s come out as well as use the rate as a point of reference for current and future expected earnings."
So it is a good idea to use an alternative metric to the federal funds rate, particularly for lower interest rate years, so they more accurately reflect the opportunity cost. Off the top of my head I think that rates were around 1% (see Ally Bank's 2015 and 2016 historical yields when the fed funds rate was 0.13% and 0.39% respectively), which is the exact same rate I used for the forward-looking estimate for GiveWell. Using savings yields from one bank or a blend of banks instead still wouldn't change the article's conclusions, given that those rates would be both higher than the federal funds rate and also significant enough to warrant consideration even in a zero interest rate environment.
Potential returns of other investment options
Exactly, why wouldn't I pick Bitcoin or Tesla? Because both ultra-short-term bonds and a standard conservative risk portfolio are extremely common investment portfolios for more risk averse investors such as many nonprofits who require a steady rate of return with minimal drawdowns. It doesn't matter what examples you use, low-risk options would have performed well during this time period and other time periods, just worse than riskier options.
And another reason I used JPST as an example is because I recommend JPST in my early-2019 article before I could see its historical performance. So I'm not sure if "backward looking" is the right verbiage.
I already state in the article that I am quoting month-to-month drawdown data, not day-to-day data. This means the fund did not decline in value month by month. The highest historical month-to-month drawdown was -1.72% and it recovered in two months. Hardly a volatile investment.
I did not cherry pick the time period, stocks and bonds have generally performed well across time. Portfolio Visualizer has data starting from 1987, which indicates an annual return even higher than what I quoted, at 7.07%. Maximum drawdown is -8.49% from the 2008 crash. Exactly why this is considered a standard conservative portfolio by financial professionals.
As we can see, the drawdown is very low, and the expected value is positive and significant. For granted funds that GiveWell cannot afford to have a drawdown on (this does not represent all of their funds), then a "zero-risk" option like a savings account would make more sense. It all depends on the charity. Investment examples are for illustrative purposes, I have no idea what approaches GiveWell can or cannot take in actuality, beyond a savings account, which it should be able to do.
Conclusion and staff time
That depends on what numbers we're using. I think 10% is very low. As I've said, the Maximum Impact Fund cannot be used as a reliable estimate or predictor of GiveWell's average daily cash balance. But if we assume just the fund itself represents all of GiveWell's money, we can see that there's a 3-month grant collection period (averages to 1.5 months of cash at 100%) plus a 2–3 month delay in granting (averages to 2.5 months of cash at 100%) which would suggest a minimum percentage of at least 33% (4/12 months) just based on the money collected during the last three months of the year.
This is probably evident from the rest of my replies, but a 1% account savings rate or even 0.5% still produces significant financial returns. These numbers should be used instead of 0%.
And it would take a very small amount of time to keep funds in one fund for multiple years, whether that's JPST or a multi-asset fund that has, say, a 20% stock allocation and 80% bond allocation. Vanguard, a well-known and trusted provider, has a great ultra-short-term bond fund as a JPST alternative. A nonprofit might not maximize returns by shifting between funds on the reg (which is, as you say, time consuming, although Antigravity Investments is more than happy to help with that), but evidently they will do much better than nothing. Many nonprofits self-manage their investment approach.
Hi Brendon and Tharun,
Catherine from GiveWell here. Thanks for your post - it's generated some good discussion!
First, I want to confirm a few aspects of our banking that have been discussed here:
We agree that consideration of where to hold and invest funds is important. Last year, we began work to revisit our banking practices. We also adopted an investment policy in December 2020 that enables us to invest a portion of our available cash balances in financial vehicles, with the following goals: preserving capital, meeting our liquidity requirements, minimizing volatility, and maximizing our after-tax return.
We are continuing our project to revisit our banking this year. In addition to the interest rates offered on accounts, our decisions about where to hold funds will also factor in our additional needs, such as strong customer service, security, understanding of non-profit vs. for-profit needs, user interface, connection with our various tools and platforms, and international operability. We plan to take this work forward in 2021.
Thanks for your response Catherine! It's great to hear that GiveWell is moving in this direction!
Makes sense regarding those three aspects of GiveWell's banking, and completely agree that our estimation methodology is likely in GiveWell's case to overestimate its average cash balance during the year. For the benefit of readers, as mentioned in our article, whether the estimate is accurate, too low, or too high will vary by charity and there is no way to increase the accuracy for an estimation methodology that works across charities due to the limitations of the Form 990 data.
Other commenters have mentioned that the federal funds rate is now close to zero. This article was primarily written before COVID-19 and the federal funds rate seemed like an appropriate and conservative benchmark at the time. I did not update the benchmark before the article was published because I received feedback from reviewers that the magnitude of the impact was large regardless of the exact interest rates. This is a sentiment that I agree with.
If the exact rate is literally 0% for the next few years (I did not intend for the federal funds rate to be used as a forward-looking estimate) that would indicate the benefit to charities is pretty low. I think a better proxy for the interest rate charities could have earned in the past and can earn now and into the future is Ally Bank's high-yield savings account rate. Ally Bank is a large institution and has over 10 years of historical interest rate data available. Their rate has historically been close to high-yield savings rates offered by most banks, and just a touch lower than the best options.
At this exact point in time, Ally Bank's rate is 0.5%. Here is the link to a historical rate chart with data since 2009: https://www.depositaccounts.com/banks/ally-bank.html#a305301. Ideally, GiveWell and other charities earning interest on U.S. dollar deposits should choose banking options that have historically earned and currently earn something close to this rate. Unfortunately, I do not think organizations can open accounts at Ally Bank at this time because they only cater to individuals, but there are many options for organizations out there that are competitive with Ally Bank's rate. We're happy to provide suggestions to GiveWell or any other organization.
As you can see from the chart, back when the federal funds rate was close to 0% after the 2008 recession, Ally Bank's interest rate hovered around 1%. That was one of the reasons my counterfactual impact estimate for GiveWell used a 1% rate. In retrospect, I should have elaborated on how I generated that estimate in the article itself.
I understand that factors like customer service, security, technology integrations, etc influence GiveWell's decision making around its banking needs. I have two thoughts on the matter.
Firstly, a high-yield savings account simply exists to maximize the yield on a nonprofit's cash, whereas a checking account accommodates most of an organization's banking needs. A checking account does not need to be selected on the basis of its interest rate, whereas this is much more important for a savings account, where an nonprofit's appropriate savings balance (e.g. most of its cash that isn't immediately needed) is stored.
Secondly, GiveWell and other charities can also select the option of having an account at a major brokerage firm such as Vanguard or Fidelity which may be more trustworthy and integrated with more options than a lesser know savings account provider (although FDIC insurance means that most regulated U.S. banking options are safe). Charities can hold these funds inside a money market account (offered by most brokerage providers as well as a lot of third parties), which is designed to not change in value, or another low-risk option. My article from last year contains more information on different options for charities, including analyzing the risk/security of both bank accounts and money market funds which you mentioned GiveWell is considering, as well as concrete guidance on selecting a brokerage account and the fund(s) to hold within it.
Action Thread
This is the cash management outreach action thread! We’ll be using this thread to keep track of how outreach to EA organizations is going and avoid duplicating our efforts.
All replies to this thread should include the name of the organization in the first line, and reply to comments about a particular organization with updates on how outreach is going.
Please make comments on our overall methodology or approach as a separate top-level comment to avoid disrupting this thread, and check if the organization you want to post about is already included in this thread before submitting a new organization.
Actions you can take:
Dear [contact at EA org],
I wanted to share an EA forum article I was reading. [insert forum article link]
The article analyzes cash management practices at EA orgs and highlights a simple, risk-neutral change to increase funding by up to millions. [Insert Org name here] was mentioned in the comments as a potential candidate.
Would love to get your thoughts in the comments. You can reach out to the authors at support@antigravityinvestments.com.
Best,
[Your name]
GiveWell
This is the first post in the action thread which I hope will be a good model for anyone that would like to try posting in this thread in the future. I hope that the action thread in general will be a good experiment for the EA Forum.
As documented in this article, I estimate GiveWell's five-year opportunity cost at $4 million. This is a very rough estimate which is dependent on many factors including GiveWell's true past and future cash balances. GiveWell's Form 990 makes it pretty clear they can benefit from this recommendation because they are earning a very small amount of interest income per year, even if their cash balances during the year are considerably lower than the year-end balances in Form 990.
I have not received a response from GiveWell staff members I've cold emailed in the past, but I have consistently received responses from info@givewell.org. This makes me think that info@givewell.org is a good choice.
I believe the detailed documentation of GiveWell's opportunity cost in this article makes it likely (85%) that GiveWell will respond to this inquiry or a follow-up email within two months. Hopefully they forward the inquiry to the appropriate team members.
I anticipate that the main failure mode of email outreach is that GiveWell indicates they intend to take action but does not do so in a timely manner (within six months), or isn't transparent regarding cash management improvements they say they've made in the past or intend to make in the future. In the latter case, the lack of transparency makes it difficult to determine the effectiveness of GiveWell improvements relative to the best possible interest rate until new Form 990s are released, which will be mid-2022 at the earliest for the 2021 Form 990. As an interest rate reference point, Axos Bank, which I mentioned in my talk earlier this year, is paying a 0.50% rate of interest right now.
I believe that it is difficult to mitigate risks associated with this failure mode without some way to increase GiveWell's trust in this recommendation or influence/get more time to speak with the appropriate decision makers. To date I have not found someone that can help with this, so I think a cold email is most appropriate in this case.
My email is as follows:
To: info@givewell.org
Subject: EA Forum Article About GiveWell
Dear GiveWell,
I wanted to share an EA Forum article I recently published about the opportunity costs of GiveWell's current approach to cash management. A rough estimate puts GiveWell's opportunity cost at $4 million over the next five years. Excluding deliberation time, I believe it will take under 10 hours for GiveWell to implement the change the article recommends.
It would be great to know if GiveWell has or intends to make changes, as well as the change that was made/how much interest it is currently paying relative to the best business savings accounts. My outreach to GiveWell is being publicly tracked in the action thread of the article, which is an experiment around leveraging the EA Forum to drive institutional behavior change.
Best,
Brendon
Thanks for writing this article. I think you are spot on that many non-profit and for-profit organisations do not manage cash effectively.
A few comments:
Thanks for sharing your thoughts!
For point 1, I mention this in more detail in my response to GMcGowan—the 2.16% federal funds rate in 2019 was in fact a conservative estimate for bank yields. That can be seen by looking at my EA Forum article from 2019 which references bank savings yields of up to 2.4%. The accounts that offer a higher rate of interest (like the 2.4% accounts) do not fluctuate like bonds and have identical risk to other savings accounts because they’re all insured by the FDIC. They yield less in 2020, of course. I perform a more in-depth risk analysis of savings accounts and alternative options in my article from 2019.
Regarding point 2, if we include 2% estimated inflation, then bonds would return 1% and a low-interest charity savings account would return -2%. If we adjust your estimates upwards to include inflation like my 5.51% figure, so 7% for equities and 3% for bonds, we get 3.8% (likely higher, say 4%, with rebalancing). Would you say that’s within the same ballpark? Regardless, I think future returns are very difficult to forecast, even with good causal explanations. With those assumptions, it would make sense to allocate more of the portfolio to stocks instead.
Regarding point 3, yep, that’s a shortcoming of solely relying on Form 990 data. If we had the full data, I think it’s unlikely that would change the numbers by that much (say more than 50% higher or lower). I talk about this and other estimation issues in the “Estimation Methodology Caveats” section of the article.
I broadly agree that cash management could be improved at many charities, so thanks for this post!
The interest rate for the fiscal year should probably be based on the best available bank account rate. I think that is considerably less than your given interest rates, for example in the UK the best business savings account I could find offered about 0.9%.
That’s a good point! While UK and US interest rates do differ, the interest rates are much lower now because of the COVID-19 economic situation. We used the latest Form 990 data from 2018 and 2019 and the associated interest rates from those years to calculate the prior-year opportunity costs as accurately as possible, which is a separate calculation than estimating the forward-looking counterfactual impact. We chose the federal funds rate because there’s a lot more granular and historical data on it and it’s one of the most conservative rates possible. There’s a link in my article explaining its association with savings account yields. If you look at my EA Forum post from 2019 I was referencing savings account rates of 2.4% which was the same or higher than the federal funds rate at the time.
In my talk earlier this year I listed savings account yields at banks that were around 1% even as the federal funds rate was plummeting to 0%. That’s why I used a more conservative 1% interest rate in my five-year opportunity cost calculation for GiveWell (estimated at $4 million), which aligns with the lower UK interest rate of 0.9% you mentioned.
Ah I see, thanks for clarifying!
Thanks for sharing this. I that info about good financial practices are being shared here. I have two questions that you might be able to answer.
First, what specific options are available? As an individual I can open a high yield savings account with Ally (or I can refer to NerdWallet for a list of other high yield savings accounts). But If I am running an NGO I can't legally use accounts intended for individuals, right? Could you provide a list of options?
Second, these ideas are fairly limited to cash held in USD in the United States, right? For organizations that have operations (and thus which keep funds) in other countries and other currencies, are you able to recommend any options? I am concerned that both the lack of high yield savings accounts in those countries and the cost of international transactions would prevent organizations from using this method.
Thanks for commenting!
Exactly, in most jurisdictions, NGOs must create savings accounts meant for organizations. In the United States, those accounts would be called business savings accounts. In the U.K., those accounts would be called charity savings accounts, but some business savings accounts might work depending on the terms and conditions.
For the U.S., here's a link to some examples of business savings account (online sources may be somewhat biased in choosing recommendations due to affiliate links, although this source seems decent): https://www.magnifymoney.com/blog/best-of/best-business-savings-accounts625269146/
The ideas expressed here are applicable to any country that has accounts or investment options available that pay more interest than the default accounts in use by most people/organizations. This likely holds true for most/all countries that have an established financial system.
In terms of offering recommendations, it would depend on the currency and country in question. The Flagstone option I mentioned in earlier comments works for GBP, EUR, and USD (they may be limited to UK-based clients, I don't recall off the top of my head). Feel free to mention specifics in a follow-up comment or email us at support@antigravityinvestments.com. I've historically researched the US, UK, and Canada, but I'll see what we can do if there's another country in question!
For countries that have less established financial systems, I agree, they may be unable to find a suitable alternative in their base currency that pays a high rate of interest, or be unwilling to take on currency risk and currency conversion costs by opening an international account likely denominated in another currency.
Besides opening an international account in USD, for instance at StoneCastle, an organization could also open an account at a brokerage firm that supports international clients like Interactive Brokers (I believe they support 19 currencies) and access various investment options. That is getting to a pretty high level of complexity though.
Thanks for sharing this. I that info about good financial practices are being shared here. I have two questions that you might be able to answer.
First, what specific options are available? As an individual I can open a high yield savings account with Ally (or I can refer to NerdWallet for a list of other high yield savings accounts). But If I am running an NGO I can't legally use accounts intended for individuals, right? Could you provide a list of options?
Second, these ideas are fairly limited to cash held in USD in the United States, right? For organizations that have operations (and thus which keep funds) in other countries and other currencies, are you able to recommend any options? I am concerned that both the lack of high yield savings accounts in those countries and the cost of international transactions would prevent organizations from using this method.