Sequence contents
- Background on QALYs and DALYs
- The HALY+: Improving preference-based health metrics
- The sHALY: Developing subjective wellbeing-based health metrics
- The WELBY (i): Measuring states worse than dead
- The WELBY (ii): Establishing cardinality
- The WELBY (iii): Capturing spillover effects
- The WELBY (iv): Other measurement challenges
- Applications in effective altruism
- Applications outside effective altruism
- Conclusions
Key takeaways from Part 2
- As explained in Part 1, health-adjusted life-years (HALYs) combine length and quality of life on the same scale. This enables direct comparison of life-extending and life-improving interventions, and the quantification of the overall health of a population.
- The most widely-used HALYs are the quality-adjusted life-year (QALY) and disability-adjusted life-year (DALY). For reasons covered in Part 1, they tend to inaccurately estimate the overall wellbeing impact of many conditions, leading to serious misallocation of resources.
- The (hypothetical) HALY+ incorporates incremental improvements to the most common versions of the QALY and DALY, so that they more closely track subjective wellbeing (and perhaps other things people care about) while avoiding some potential problems with pure wellbeing measures. The extent to which they would resolve each of my core concerns with current HALYs is summarized in the conclusion.
- Key topics that must be addressed in order to develop and use the HALY+ include:
- How should health states be described? Narrow health-focused multi-attribute utility instruments like the EQ-5D could be replaced by ones that include more psychosocial dimensions, such as the E-QALY, and DALY health state descriptions could likewise be broadened.
- How should states be assigned weights? There is a lot of literature comparing the time tradeoff, standard gamble, visual analog scale, and discrete choice experiments. It may be worth taking another look at methods that have fallen out of favour, such as the person tradeoff, and recent innovations like direct elicitation of the social welfare function.
- How should we handle extremely negative (or positive) states? Current methods grossly underestimate the severity of some states, overestimate the severity of others, and ignore positive experiences beyond absence of health problems. There may be some relatively straightforward modifications to achieve some rapid improvement, but dealing with extreme states properly would be a challenging (though highly important and neglected) project.
- Who should provide the weights? Current value sets are normally derived from the stated preferences of the general public, most of whom haven’t experienced the relevant health conditions. Some have argued for the use of “experience-based” values (e.g., from the patient herself), but those are problematic for a variety of reasons, so it’s also worth thinking about how general population preferences can become better informed.
- How should we handle spillover effects? Consequences beyond the individual patient, e.g., on carers, are typically ignored, but can be valued as costs, HALYs, or a mixture. How to do this while avoiding double counting and limiting the scope of evaluations needs further research.
- How should HALYs be aggregated? HALYs are normally counted equally, but it’s possible to give extra weight to some HALYs in order to improve efficiency (e.g., to capture spillover effects) and/or to address distributional concerns (e.g., to favor severe states). Methods for deriving and implementing such weights are underdeveloped. While this is mostly an issue for broader evaluation methodology, it may also influence what kind of HALY we select or create in the first place.
- Which HALY should we focus on improving, the QALY or the DALY? The DALY is used in low-income settings with the highest burden of disease, and receives less attention from researchers; but the QALY is increasingly popular in middle- as well as high-income countries, and work on it is perhaps more tractable.
- How can we influence the development and use of HALYs? There’s no point creating a metric that won’t be used, so it’s crucial to think about the practicalities of effecting policy change. There are many relevant degree programs, academics, and public institutions, but there could also be a role for large non-profits.
- Work to develop the HALY+ seems generally more tractable than work on subjective wellbeing measures, such as those discussed in Parts 3–7, at least in terms of gaining acceptance among stakeholders outside the effective altruism movement. But the impact of successful reforms may be more limited, and some areas have already reached diminishing returns, so topics need to be selected carefully.
- Many of these projects would require strong quantitative skills, but there is also a need for qualitative research and philosophical analysis. In most cases, patience and a pragmatic attitude would be very beneficial.
Introduction to Part 2
This is the second in a series of posts on the measurement of health and wellbeing. Part 1 reviewed the structure, descriptive system, valuation methods, application, and interpretation of the most common health-adjusted life years (HALYs), namely the quality-adjusted life-year (QALY) and disability-adjusted life-year (DALY). It also highlighted five problems with them:
- They neglect non-health consequences of health interventions.
- They rely on poorly-informed judgements of the general public.
- They fail to acknowledge extreme suffering (and happiness).
- They are difficult to interpret, capturing some but not all spillover effects.
- They are of little use in prioritizing across sectors or cause areas.
This series of posts focuses on the use of subjective wellbeing (SWB) to overcome these challenges. However, I first consider whether it’s worth trying to incrementally improve current outcome measures, and if so, what research will help us to do so. The result would be a hypothetical measure I called the HALY+: a variation of the QALY or DALY that retains preference-based methods of valuation but differs from the most widely-used existing versions in a few respects, as shown in the table below:
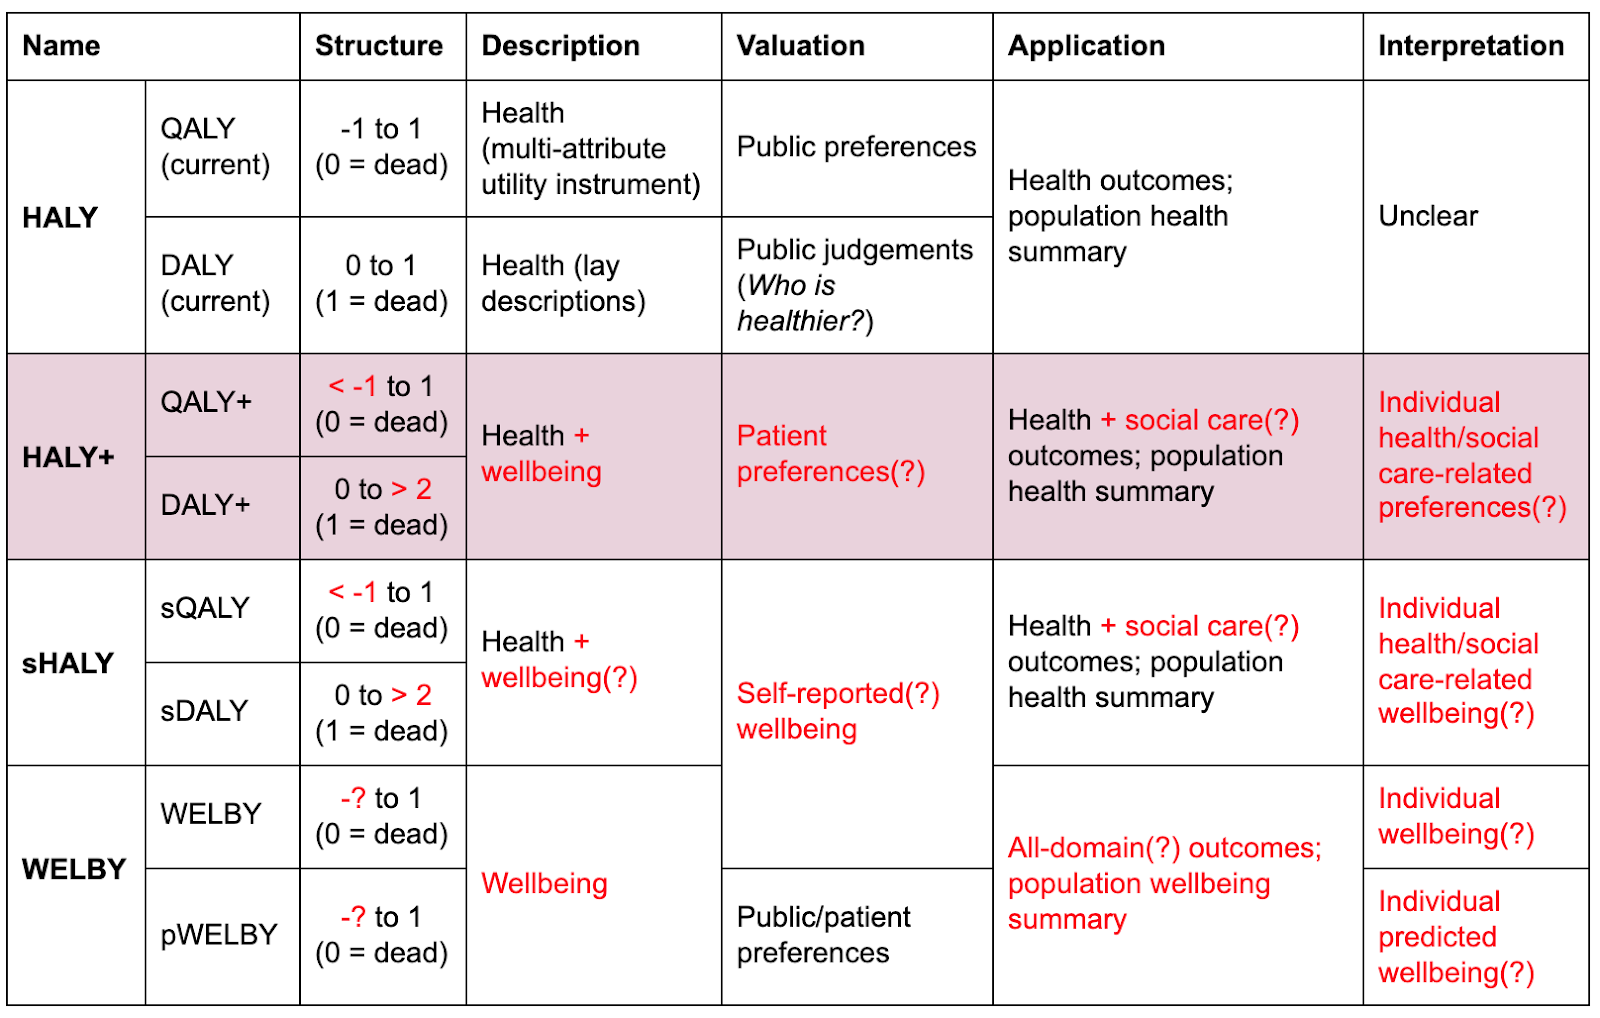
HALYs and their alternatives. Red text indicates departures from current practice. Question marks indicate optional or uncertain features.
The methods used to derive and apply HALYs, particularly QALYs, are an active area of research among academics and agencies such the UK’s National Institute for Health & Care Excellence (NICE) and the Institute for Health Metrics & Evaluation (IHME). Rather than providing detailed summaries of existing literature, I mostly give a basic outline of the issues (with links to further reading),[1] followed by a list of potential research topics. The main aims are to:
- Encourage proponents of a SWB approach to seriously consider alternatives, at least within domains such as health and social care. (I think the challenges of operationalizing SWB, and the advantages of some preference-based alternatives, are often underestimated.)
- Allow readers to appreciate previous work. (Even if SWB measures are ultimately preferred, I think their developers could learn much from preference-based efforts.)
- Draw particular attention to some areas that are important, somewhat tractable, and relatively neglected within health economics, such as ways of handling states worse than dead.
- Highlight opportunities for further research that could be carried out by students, academics, effective altruism organizations, and perhaps independent researchers.
I finish with a brief assessment using the importance, tractability, and neglectedness (ITN) framework commonly employed by the effective altruism community, and a summary of how well the HALY+ would address the five core problems listed above.
Why should we consider working on the HALY+?
It might reasonably be asked why we should bother trying to improve (rather than replace) traditional HALYs. Given their major flaws—discussed in Part 1 and listed in the introduction—shouldn’t we spend all our efforts working on distinct alternatives such as the wellbeing-adjusted life-year (WELBY), or at least a HALY valued using SWB (the sHALY, discussed in Part 3)?
It’s difficult to answer that question without addressing general critiques of a wellbeing approach to healthcare. Daniel Hausman (e.g., 2012; 2015) has perhaps provided the strongest arguments for evaluating health interventions and the burden of disease in terms of health itself (in some functional sense) rather than its effects on wellbeing.[2] Drawing partly on his work, I think there are three broad reasons we might want to continue work on preference-based measures of health as well as, or perhaps even instead of, developing a sHALY or WELBY.
- Wellbeing might be the wrong metric in principle.
- Most moral theories, and most members of the public, care about more than happiness, e.g., many people think health is intrinsically good, independently of its effects on wellbeing (Adler, Dolan, & Kavetsos, 2017; Brouwer et al., 2017). In particular, there is resistance to the idea that if someone adapts to a disability, such that it no longer affects their wellbeing, then preventing or curing their condition has no value.
- Even if they are wrong in some fundamental sense (e.g., because hedonic states are all that matter), the legitimacy of institutions may rest in part on their taking into account the views of the public they serve.
- While nobody would claim that health is all that matters in life, there is some intuitive appeal to the claim that the proper goal of health systems is to improve health—especially since other determinants of wellbeing can, to some extent, be addressed by other areas of public policy.
- Wellbeing might be hard to measure in practice.
- There are many different conceptions of wellbeing, and at least two components of subjective wellbeing alone, so it would be hard to reach agreement on which one(s) to measure. Even given a particular theory of wellbeing, how much various aspects of life (and health) influence it will vary so much among individuals and groups—and perhaps over time–that comparisons may be impractical. Defining and measuring health is not straightforward either, but there’s more of a consensus on what good health looks like.
- Some wellbeing measures, especially the common single-item ones (such as life satisfaction on a 0–10 scale), may lack validity or responsiveness in some conditions; that is, clinically important changes do not always show up in wellbeing data. When this is because they do not actually affect wellbeing, we may want to bite the bullet and say they don’t matter; but in some cases it’s likely to be due to response shift (your 5 may not be the same as my 5), the framing of the questions (e.g., questions about “happiness” may not fully capture physical pain or a sense of purpose), or simply because the data are noisy and the effect relatively small.
- There is a possibility that some preference-based measures of health better capture spillover effects. Absent other methods for accounting for such consequences, this could make them a better proxy for societal wellbeing than direct wellbeing measures. (See below and Part 6.)
- There may be resistance from stakeholders.
- Patients, clinicians, and decision-making bodies are generally reluctant to use wellbeing measures due to normative concerns mentioned above, perceived irrelevance to health conditions, or simply institutional inertia. So it is unlikely that the main “consumers” of QALYs and—even more so—DALYs will adopt measures based on wellbeing (especially subjective wellbeing) in the near future.
There are, of course, strong counter-arguments to the philosophical claims, and ways of overcoming at least some of the practical challenges. Moreover, some of these critiques may “prove too much,” in that they could also constitute reasons for opposing some “HALY+” improvements, many of which have strong support from stakeholders. But for now I will assume that there are grounds for some people to seriously consider working on the topics presented below.
How should states be described?
As noted in Part 1, there are four main ways to describe health:
- Generic multi-attribute utility instruments (MAUIs) classify health states using severity levels on several dimensions of health. The EQ-5D-3L, for example, gives a score of 1–3 on five dimensions: mobility, self-care, usual activities, pain/discomfort, and anxiety/depression. When paired with preference-based valuation, they are called generic preference-based measures (GPBMs).
- Condition-specific measures only include dimensions relevant to the particular disease, such as cancer or dementia.
- Bolt-ons are dimensions added to generic MAUIs in order to capture “missing” aspects of a health condition, such as problems with vision, hearing, or tiredness.
- Vignettes are lay descriptions of what it’s like to live with the condition.
There are pros and cons to each of these, and there may be a place for all of them in health economic evaluation.[3] But since MAUIs are most widely used, and the various MAUIs provide non-trivially different values, choosing (or creating) an MAUI that correlates more strongly with subjective wellbeing is likely to have the greatest payoff. Moreover, about two thirds of the difference in values among GPBMs is due to the choice of MAUI rather than the valuation method (Richardson, Iezzi, et al., 2015), so it may be the single most important decision to make (though improving the handling of states worse than dead could be even more consequential).
Unfortunately, the EQ-5D, which is by far the most common MAUI,[4] is probably the worst of all. Of six MAUIs compared by Richardson, Chen, et al. (2015), the EQ-5D-5L explained the least variation in SWB scales—about 25% (i.e., R2 ~0.25). Other studies have drawn similar conclusions (e.g., Mukuria & Brazier, 2013). Potentially better options include:
- AQoL-8D (R2 ~0.4–0.6). In addition to three physical dimensions (independent living, pain, senses), it contains five “psychosocial” dimensions (happiness, mental health, coping, relationships, self-worth) that clearly overlap with aspects of wellbeing. Each of the 35 items on the questionnaire (3–7 per dimension) were thoroughly tested, and many were originally derived from existing mental health measures or focus groups of patients and carers, making the process more rigorous than for other MAUIs. However, its questionnaire takes about five minutes to complete (compared to under a minute for the EQ-5D) and it requires a complex, multi-stage valuation procedure (see references here). To my knowledge, it’s only used in Australia, and I’d be surprised if other countries/agencies would consider it practical enough to adopt, though I haven’t looked into the details. Note also that the minimum value on the current value set is -0.04, perhaps making it less suitable for extremely bad states, though revaluation is possible.
- SF-6D (R^2 ^ ~0.3–0.6). This comprises physical functioning, role participation (both physical and emotional), social functioning, bodily pain, mental health, and vitality. The new version (Mulhern et al., 2020) is derived from ten items (5–6 levels each) selected from the SF-36 version 2, one of the world’s most widely-used health status questionnaires. This makes it longer than the EQ-5D but still quite usable.
- E-QALY. In collaboration with NICE, the Extending the QALY project at Sheffield aims to develop a measure that can assess outcomes in health care, social care (e.g., providing living support to elderly people), and public health—including outcomes for carers—in order to guide resource allocation across those sectors. At the start of the six-stage process (see diagram below), seven domains of quality of life were identified from the literature—physical sensation, feelings & emotions, activity, self-worth, control & coping, relationships, and concentration & memory—each of which has 2–6 sub-domains. Potentially suitable items (questions), drawn from existing measures, were tested for face validity and psychometric performance in patients, social care users, carers, and the general public in six countries (the UK, USA, Germany, Australia, Argentina, and China) (Brazier et al., n.d.). The valuation of selected items by the general public in those countries is currently underway. The E-QALY is firmly rooted in the extra-welfarist[5] tradition (in that it values more than just “utility”), has more in common with objective list theories of wellbeing—especially the capabilities approach—than SWB, and will not be usable in all domains (Peasgood et al., n.d.). Nevertheless, I expect it to correlate more strongly with SWB and be more widely applicable than most of the alternatives—most importantly the EQ-5D. It’s still unclear whether it will be viable, or whether NICE and others will accept it, but it’s perhaps the most promising effort I’m aware of.
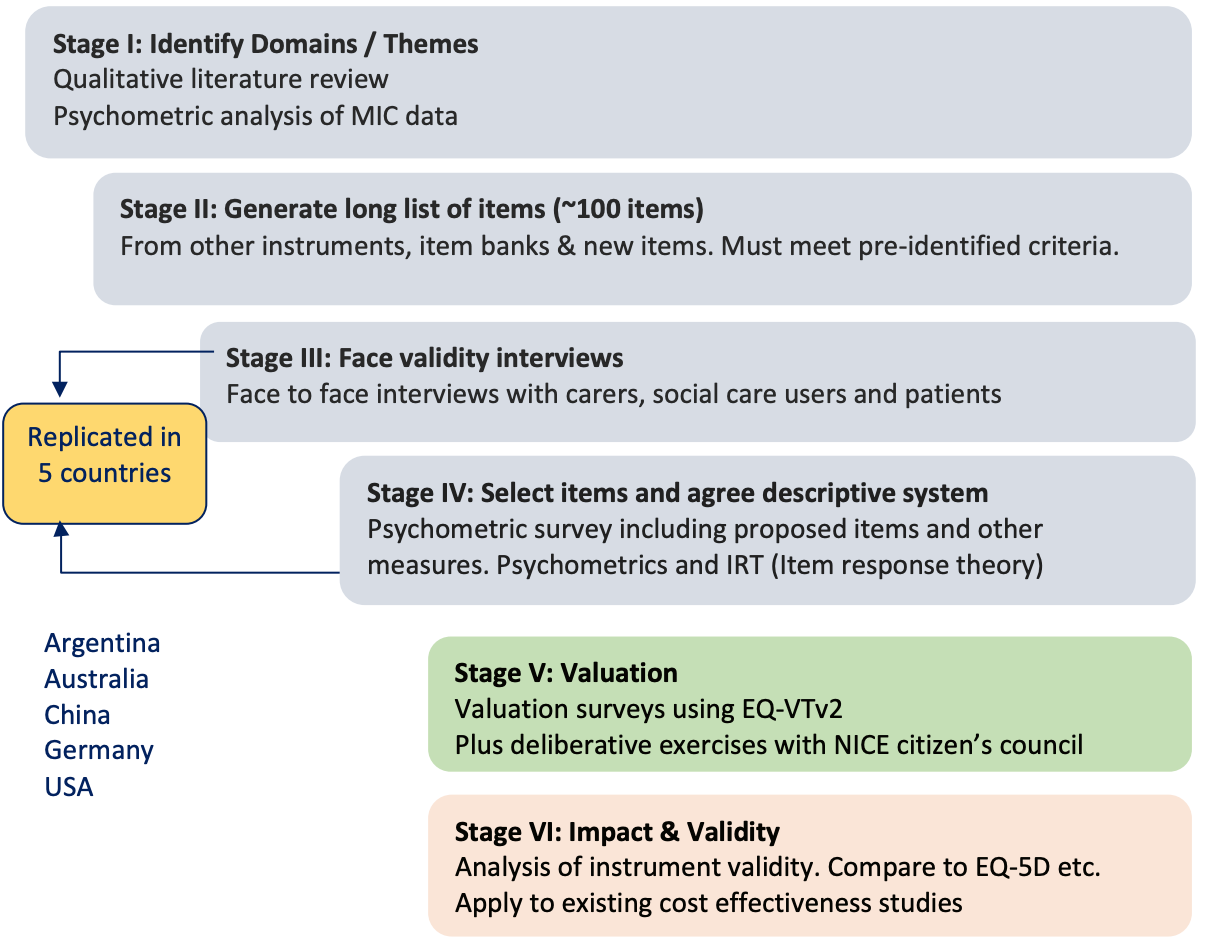
Stages of the development of the E-QALY (source). MIC = maximal information coefficient. EQ-VTv2 = EuroQuol Valuation Technology protocol, Version 2 (Oppe et al., 2014)
- Creating a new MAUI. Effective altruists (or anyone else) could in principle develop an entirely new MAUI that fits their desiderata. However, this typically takes several researchers a few years, and does not always result in a viable measure, so it should not be undertaken lightly. The basic steps in the process are described in Brazier et al. (2012). (See also Brazier et al., 2017, ch. 8; Brazier & Deverill, 1999; Young et al., 2010; Devlin et al., 2018; Yang et al., 2009.)
Just as for the QALY, it’s theoretically possible to nudge the DALY weights in a wellbeing direction by including more information about psychosocial aspects of the health states in the lay descriptions. More radically, they could be replaced with a QALY-style MAUI such as the EQ-5D or E-QALY. Neither of those seem likely given the developers’ stated aim to measure health in a functional sense, but the DALY has changed several times in the past following various objections (Chen et al., 2015), so it's not impossible they (or their successors) could be persuaded to make some reforms.
Some possible projects include:
- Updating reviews of MAUIs from a wellbeing perspective, to ensure I haven’t missed any more promising ones.
- Keeping an eye on the development of the E-QALY, and perhaps joining in the efforts (e.g., by offering to do a thesis related to it).
- Looking into the feasibility/cost/timeline of developing an even better one.
- Could a single metric be used to evaluate, say, anti-poverty as well as health and social care interventions, without losing validity in either?
- What would a system that took into account moral uncertainty look like?
- How would you decide which theories of wellbeing to include, which measures of each to use, and how much weight to give to each measure?
- Looking into the policy aspects of promoting a new form of QALY or DALY (see discussion below).
- Identifying “quick wins” for DALY improvements, e.g., cases where the descriptive system is clearly distorting results.
- The similarity of values for terminal cancer with (0.540) and without pain relief (0.569) described in Part 1 may be a good example.
How should states be valued?
The second major factor determining HALY weights (and therefore also its structure, applications, and interpretation) is the process for assigning values to health states. According to Richardson, Iezzi, et al. (2015), this accounts for about a third of the variation between GPBMs, making it an important choice.
This section offers a brief review of the five most common methods—visual analog scale, standard gamble, time tradeoff, and discrete choice experiments—and lists some rarer alternatives. (For longer reviews, see e.g., Brazier et al., 2017, ch. 4; Green, brazier, & Deverill, 2000.) Approaches to obtaining values considered “worse than dead” are left to the following section, as I think that topic merits special treatment.
Visual analog scale (VAS)
Sometimes called a rating scale, the VAS is typically a thermometer-like scale, usually running from 0 (e.g., “the worst health you can imagine”) to 100 (e.g., “the best health you can imagine”). Respondents mark the point that they feel best represents the target health state.
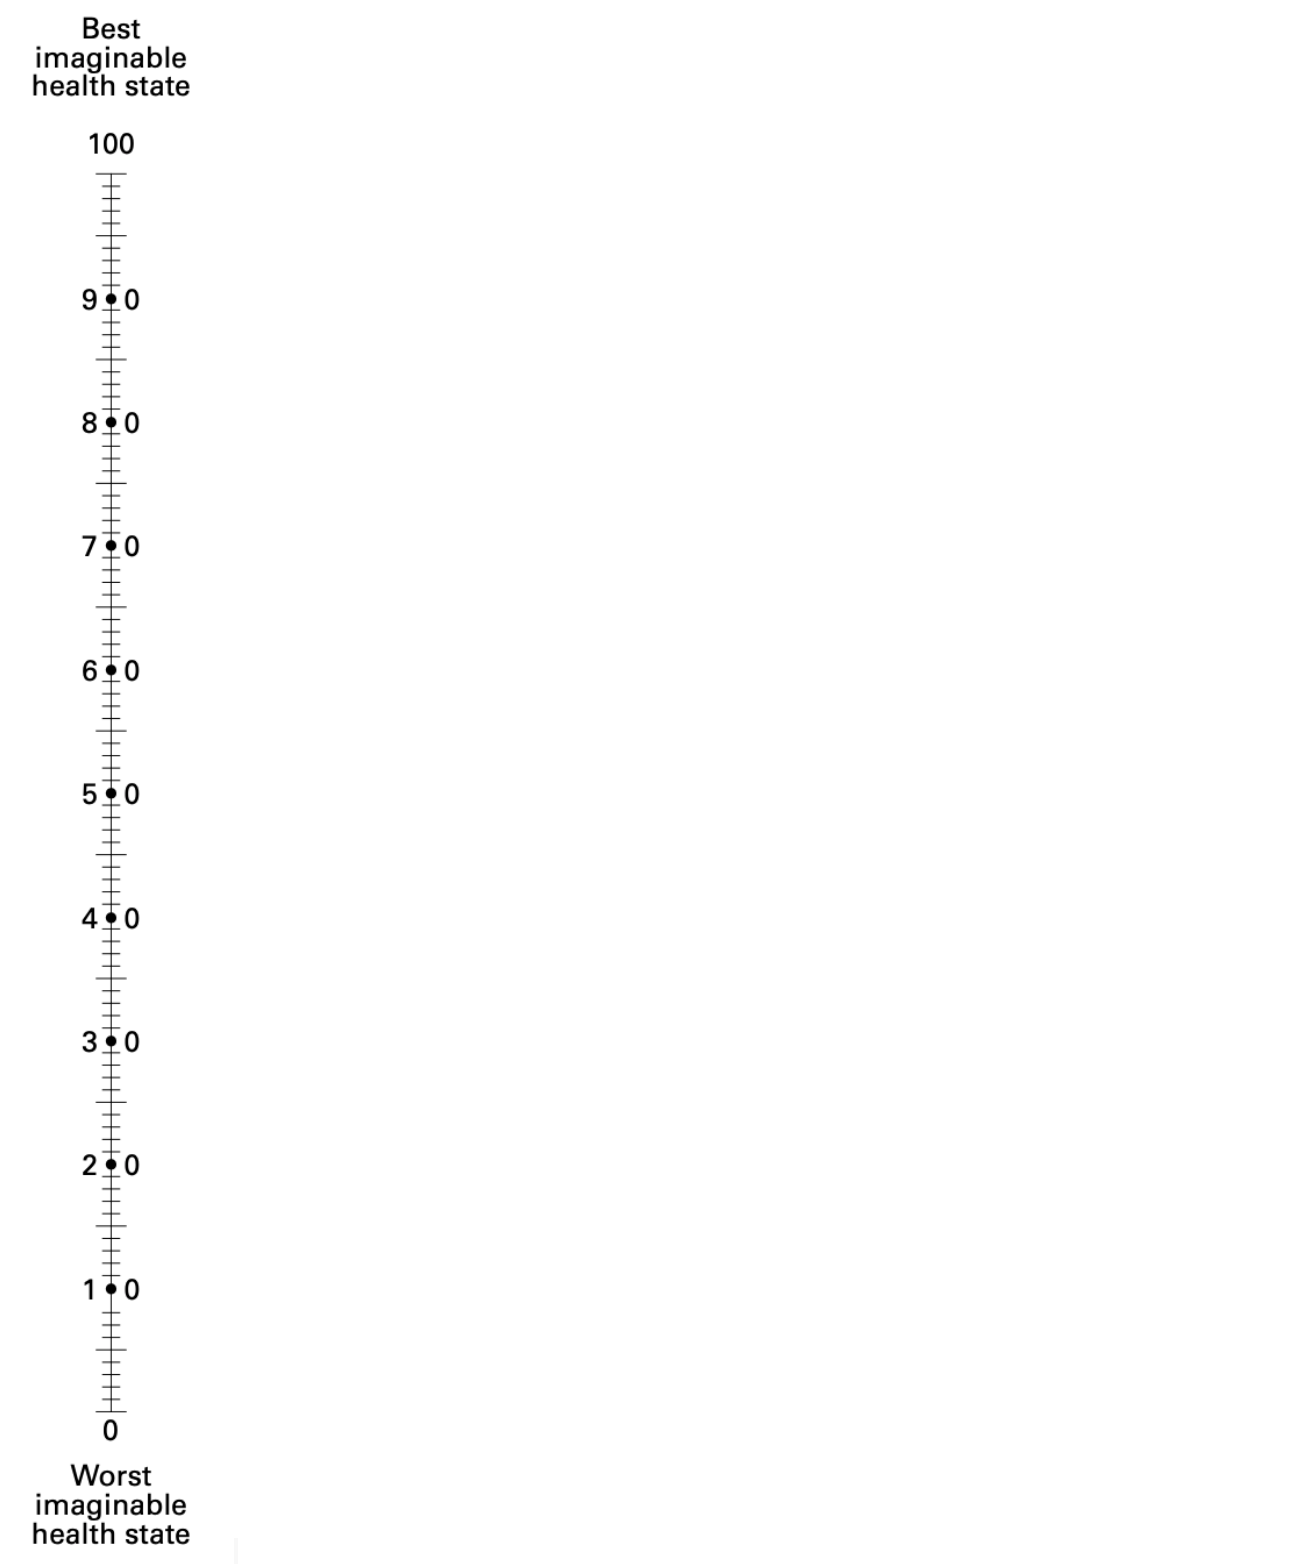
The EQ-VAS, a form of visual analog scale used alongside the EQ-5D.
This is quick and easy to complete (resulting in high response rates), and is cheap to administer. The main criticism from health economists is that it violates expected utility theory (EUT). VAS responses are not strictly choice-based: they don’t require any consideration of the opportunity costs (e.g., lower life expectancy) of having a lower QALY weight for the target state. VAS is also vulnerable to end-aversion bias (people tend to avoid assigning extreme values), and the spreading effect (when valuing several states, people tend to be reluctant to place them close together). The latter results in significant context effects: the value for a given state depends to a considerable degree on which states are valued at the same time. Thus, some have claimed that responses are better understood as reflecting ordinal preferences (i.e., a ranking) rather than strength of preference (i.e., “utilities”). There has been some pushback on all of these points (see e.g., Devlin, 2006 and responses by Brazier & McCabe, 2006), but by the late 1990s it seems a near-consensus emerged among health economists that the VAS is unsuited to the generation of HALY weights (e.g., Green, Brazier, & Deverill, 2000; Brazier et al., 2003).
Standard gamble (SG)
In the SG, respondents trade off quality of life and risk of death, by stating the highest probability of death they would accept to avoid a fixed period (e.g., 10 years) in the target health state.
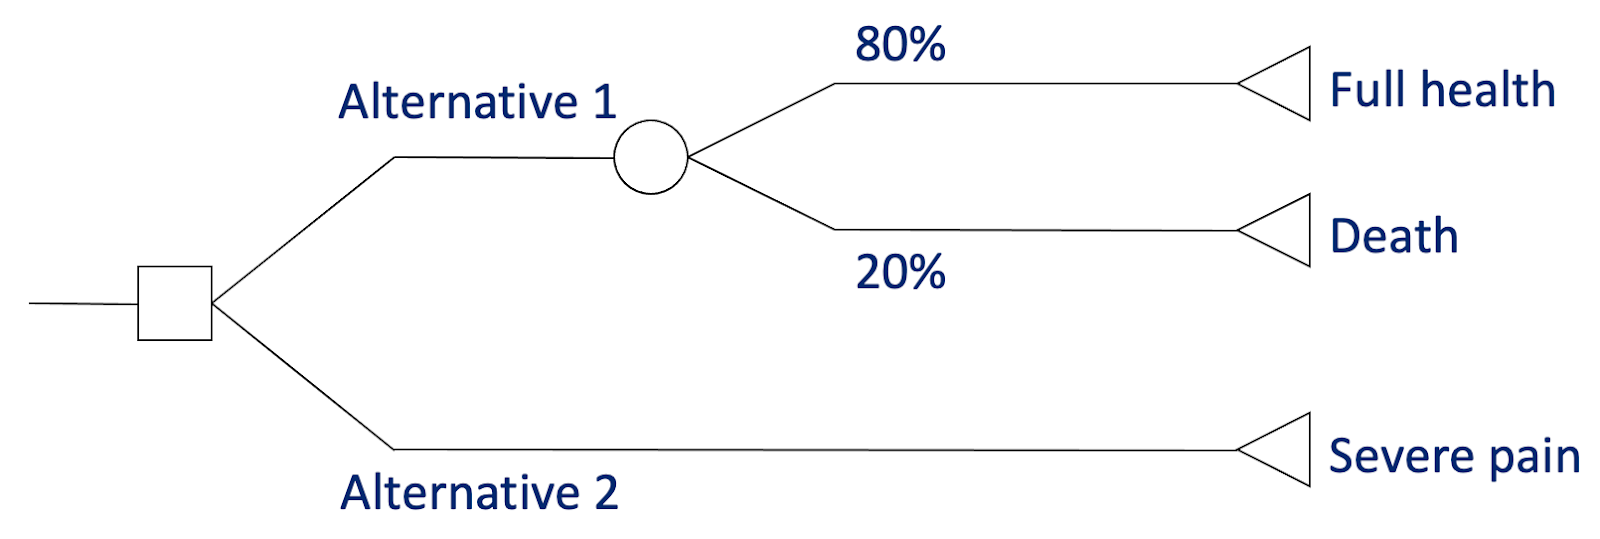
The standard gamble for states considered better than dead. In this case, the respondent is willing to risk a 20% chance of death to avoid 10 years in severe pain, giving a QALY value of 0.8. (Image adapted from lecture slides by Tessa Peasgood.)
This was long favoured by health economists due to its supposed grounding in EUT. Unlike the other options here, it involves decisions under uncertainty; and unlike some (notably VAS), it requires choices that involve sacrifice, thereby addressing the tradeoff between quantity and quality of life. The resulting values are also on the interval scale required by QALYs: for someone in a state valued at 0.4, moving to 0.8 is twice as good as moving to 0.6, and so on.
However, it’s not clear that the kind of uncertainty involved is the same as in medical decision-making: most real-life choices are not between only two options, one of which is a known risk of instant death and the other a certain period in a chronic state. Moreover, the von Neumann–Morgenstern axioms on which EUT is based are not descriptively valid; for example, people are generally somewhat loss-averse, and tend to overstate small probabilities while understating large ones. Thus, while its psychometric performance is arguably acceptable, respondents often struggle with the task, and the resulting “utilities” may not represent quite what its proponents claim. (See, e.g., Richardson, 1994; Gafni, 1994). For some respondents, such as the terminally ill, it may also be considered inappropriate to ask questions about death.
Time tradeoff (TTO)
Respondents directly trade off duration and quality of life, by stating how much time in perfect health is equivalent to a fixed period in the target health state. For example, if they are indifferent between living 10 years with moderate pain and moderate depression or 8 years in perfect health, the weight for that state is 0.8.
Visual aid (“time board”) for better-than-dead states, used by the MVH TTO protocol. (From Oppe et al., 2016.)
This is arguably less cognitively challenging than the SG, while retaining many of its advantages: it’s choice-based, involves trading off quantity and quality of life, and produces values on an interval scale.
But it also suffers from many similar problems. It’s still quite hard for some respondents to grasp, especially when valuing states worse than dead (discussed in the next section), and the comparison with death—required even for “better than dead” states—may still be inappropriate in some cases. Just as the SG is affected by attitudes to risk, TTO responses often violate the assumption of constant proportional tradeoff: many people are willing to trade less proportional life expectancy to avoid a severe state when the hypothetical duration is shorter (e.g., 2 years out of 10 = QALY 0.8, but 20 years out of 40 = 0.5), sometimes switching to a preference for death when longer periods are used—it seems they feel they could “put up with it” for a while, perhaps until their children grow up, but would eventually find it intolerable (e.g., Dolan & Stalmeier, 2003). Relatedly, most people exhibit positive time preference: a year of healthy life is more valuable sooner than later. For mild illnesses, many are unwilling to trade any life expectancy, while others will not accept any amount of health life as “compensation” for enduring very severe states (see below).
So, while the TTO has dominated health state valuation so far this century (largely due to its place in EQ-5D protocols), some researchers have been developing alternatives, often based on ordinal methods.
Discrete choice experiments (DCE)
Three closely related tasks have been used to obtain ordinal data for use in HALYs:
- Ranking: Placing several health states in order of preference.
- Best-worst scaling: Choosing the best and worst out of several options.
- Discrete choice experiments (DCE): Choosing one state out of two (or occasionally three) options, based on which seems “healthier” or which the respondent would prefer to live in for a specified duration.
DCE is currently the most popular of these for valuing QALYs, and DCE-like pairwise comparisons are the main approach for obtaining the DALY’s disability weights (Salomon et al., 2012; Salomon et al., 2015), so that will be the focus here. However, most of the following also applies to the analysis of other ordinal data.
The roots of DCE lie in Thurstone’s (1927) law of comparative judgement, later developed into random utility theory (e.g., Bradley & Terry, 1952; McFadden, 1974). The key assumption is that “discriminal processes” (e.g., a choice of which of two objects is heavier, or which of two health states is better) are influenced both by systematic factors (e.g., the actual weight of the objects, or the mean value of a health state on the respondent’s latent utility function) and random error. On repeated sampling, the probability of choosing A over B reflects not just the order on the latent scale (weight, utility, health, etc.) but the distance between them. This allows each item to be placed on an interval scale. When applied to populations, each “sample” represents the choice of a different individual, and the results are on the latent utility scale of the population as a whole. (For a fuller explanation, see Brazier et al., 2017, ch. 6.)
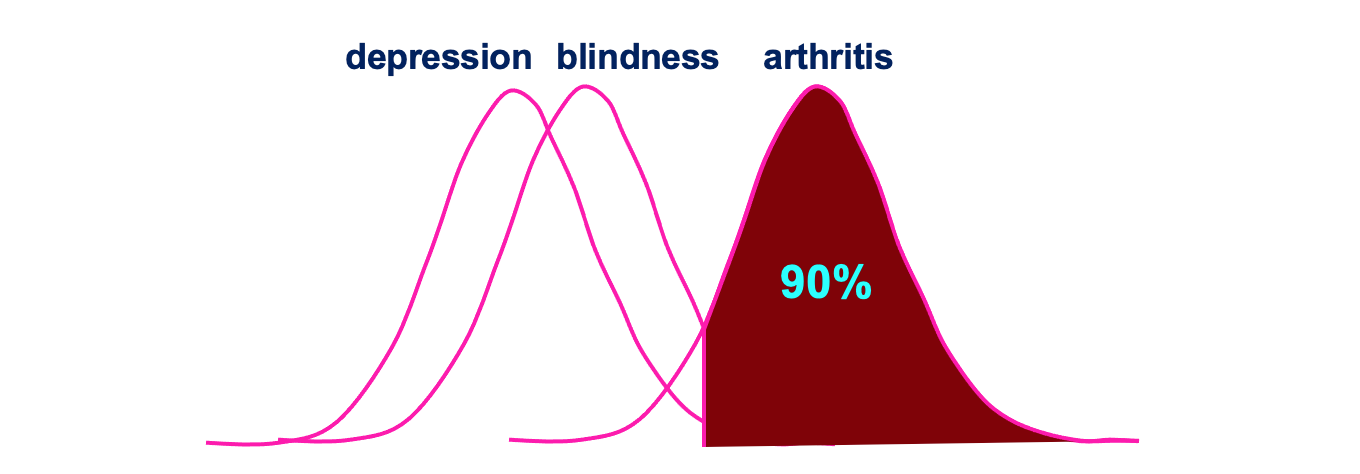
An illustration of how ordinal responses can be placed on an interval scale. In this (hypothetical) case, 90% of respondents thought arthritis was better than blindness, and almost all thought arthritis was better than depression, but only 70% thought blindness was better than depression. (From lecture slides by Donna Rowen.)
As described, DCE has several advantages over the major alternatives outlined above:
- It’s less cognitively challenging than the TTO and SG, making it more suitable in vulnerable populations such as children and the elderly.
- It can usually be done online or by post, without an interviewer, making it cheaper to get large samples.
- It avoids some biases: attitudes to risk (SG); time preference and loss aversion (TTO); and end aversion and spreading (VAS).
- It uses the same tasks for better and worse than dead (see below for a discussion), making the values more comparable along the scale.
- It does not (necessarily) include explicit comparison with being dead, which both avoids potential biases this can introduce and makes it more appropriate for those who may become distressed by it.
- It can be combined with other aspects of a health state or its treatment, such as waiting period, being treated with respect, travelling time, and even cost. This can make it more relevant to real-life decision-making.
The key challenge, of course, is anchoring the interval data (showing the relative positions on the latent utility scale) to a ratio scale where 0 = dead and 1 = full health. Options for doing this are outlined in the next section on states worse than dead, but in brief, it seems like there are no solutions that maintain all of the putative advantages listed above, and no consensus on the best approach. This is an active area of research and I expect some progress in the coming years.
It’s also worth noting some more general criticisms:
- It may overstate the distance between some states, e.g., if almost all respondents think the EQ-5D-3L state 21111 (moderate mobility problems and no other problems) is worse than full health (11111), the former may get a much lower value than it ought to.
- It arguably lacks a theoretical basis in economics and EUT, e.g., choices are not made under uncertainty (though it can perhaps be modified to include risk: Robinson, Spencer, & Moffatt, 2015).
- It may not always be (much) less cognitively demanding than the TTO or SG: factoring in, say, all five levels of all five dimensions for two states on the EQ-5D-5L is not easy when one isn't obviously better than the other. Some anchoring methods increase the complexity.
- It’s unclear whether avoiding direct comparison to dead is an unalloyed benefit. If the resulting values are going to determine, say, whether extending a life is net negative or net positive, it may be desirable that respondents consider that implication explicitly.
- All methods for anchoring to the QALY scale require some states to be valued at 0 or below. That’s fine for generic instruments like the EQ-5D, but when used to value condition-specific measures for relatively mild problems (e.g., overactive bladder), there may be few such responses (Yang et al., 2009).
So, while the DCE is certainly promising, I’m not sure it’s yet been proven to be superior to the more established methods (beyond reducing costs).
Person tradeoff (PTO)
In the PTO (previously called equivalence of numbers), respondents trade off populations, in effect stating how many outcomes of one kind (e.g., curing depression) they consider as valuable as a fixed number of outcomes of another kind (e.g., saving the life of a young child).
In health economics, the PTO has fallen out of favour to the extent that it’s barely mentioned in recent reviews, perhaps because it’s no longer the primary method used to obtain disability weights for the DALY. Nevertheless, related methods have been employed by effective altruists in discussions of population ethics (e.g., Althaus, 2018), and by the Institute for Health Metrics & Evaluation to anchor disability weights to zero.
The Appendix contains a review of the PTO with a little more detail than provided above for the other methods. In brief:
- It's a cognitively quite different task from the others, e.g., because it involves consideration of others’ health (rather than one's own), and potentially distributional issues like equity. This could be considered a strength or a weakness, depending on the objective.
- The evidence base is relatively sparse and hard to interpret, partly because widely differing forms of task are used in the relevant studies. What does exist arguably suggests that it isn’t a very promising approach.
- But absence of evidence isn’t (always) evidence of absence, so further research could offer high value of information.
Other options
Much less common approaches include:
- Veil of ignorance: The respondent is presented with a description of two populations, and asked to which they would rather belong. One population contains a variable number of people in the target health state (e.g., severe asthma at age 40), and the other a fixed number in the reference health state (e.g., fatal disease at 40). The number in the target state is varied until the respondent is indifferent between the options. This may be considered a variant of the PTO or of the SG, depending on how the respondent thinks about the task. (Pinto‐Prades & Abellán‐Perpiñán, 2004; Shroufi et al., 2011)
- Magnitude estimation: The respondent states how many times worse one health state is than another (Torrance, 1986).
- Direct elicitation of the social welfare function: The respondent is directly asked about the relative importance of the dimensions and levels of an MAUI, including interactions between them (Devlin et al., 2019).
- Hybrid methods: Data from two or more methods are factored into the calculation of weights, e.g., some EQ-5D-5L value sets have combined DCE and TTO data using a common likelihood function and a Bayesian approach (Devlin et al., 2018).
- Consumption: The monetary value of health outcomes is estimated using a human capital approach (lost future earnings), revealed preferences (how much people in fact pay for the benefit in the market), or stated preferences (how much they are hypothetically willing to pay to avoid a problem). This is mainly used in cost-benefit (as distinct from cost-effectiveness) analysis (see my footnote in Part 1).
As with descriptive systems, there is already a lot of literature debating the merits and implications of the leading approaches (for reviews, see Brazier et al., 2017, ch. 4; Green, Brazier, & Deverill, 2000; Ryan et al., 2001; Drummond et al., 2015, chs. 5–6). However, it could be worth investigating some of the newer or currently unpopular methods in a bit more depth.
Possible research questions include:
- When, if ever, is the PTO the best option?
- Review of the literature since Green (2000).
- More empirical studies, perhaps working towards a more standardized format.
- Are other uncommon approaches worth considering?
- Again, a literature review and/or empirical work on magnitude estimation, veil of ignorance, direct elicitation, hybrid methods, monetary valuation, and anything else on the horizon could be illuminating.
- How should ordinal data be anchored to the HALY scale? (See discussion below.)
- This is less neglected, but potentially still impactful as the DCE becomes increasingly widespread.
- Is it worth reconsidering the VAS?
- How important is it for the task to be choice-based?
- This is relevant to wellbeing research, too (see later posts in this sequence).
- Is the theoretical basis and psychometric performance really that much worse than the alternatives, with all their flaws?
- How important is it for the task to be choice-based?
How should we handle extremely poor (and good) states?
As briefly discussed in Part 1, I think QALYs and DALYs do a particularly poor job of quantifying the disvalue from very poor health states, especially those that may be considered worse than being dead (WTD). Here I will outline the methods commonly used, the rationales typically provided, potential problems with them, and some possible avenues for improvement. More fundamental discussion about the possible asymmetry of positive and negative experiences will be left to Part 4.
The tasks used to elicit values for states worse than dead (SWTD) are naturally related to those for states better than dead (SBTD) described in the previous section, and likewise come in many variations. Below I outline just a few of the more common ones for VAS, SG, and TTO.
Visual analog scale
To ensure VAS values can be anchored to the 0–1 QALY scale, respondents are typically asked to place dead on the same scale as the state(s) being valued. This also allows the valuation of SWTD. The “raw” values (often on a 0–100 scale), whether better than dead (BTD) or WTD, are then transformed as follows:
- Adjusted value of h = Raw(h) – Raw(dead) / Raw(max) – Raw(dead)
where Raw(h) is the original rating (e.g., between 0 and 100) for the target health state, Raw(dead) is the original rating for being dead, and Raw(max) is the top of the scale (e.g., 100). For example, with a dead point of 30/100 and a rating for h of 20/100, the final value of h would be: (20 – 30) / (100 – 30) = -0.142. While technically unbounded below 0, this method should normally result in less extreme negative values: even where Raw(dead) = 70/100 and Raw(h) = 0/100, the “utility” of h would only be (0 – 70) / (100 – 70) = -2.33.
It’s unclear, however, whether this is an advantage or disadvantage. Presumably most people will place dead in the bottom half of the scale (in one study it was around 10/100 on average: Richardson & Hawthorne, 2001), which does not, in my view, leave enough room to capture the worst health states—particularly given the end-aversion phenomenon. This absence of a tradeoff may also be particularly problematic here: with a dead point of, say, 30/100, would they really be willing to endure a year at 0/100 (extreme pain, depression, etc.), to gain a year at 61/100? Pushing the other way: if faced with a year at 25/100 followed by death, would they really prefer immediate death? Whether “concealing” the implications of their decisions results in “better” values is a normative as well as a psychometric question. (This is also relevant to the use of wellbeing scales, discussed in Part 4.)
Time tradeoff
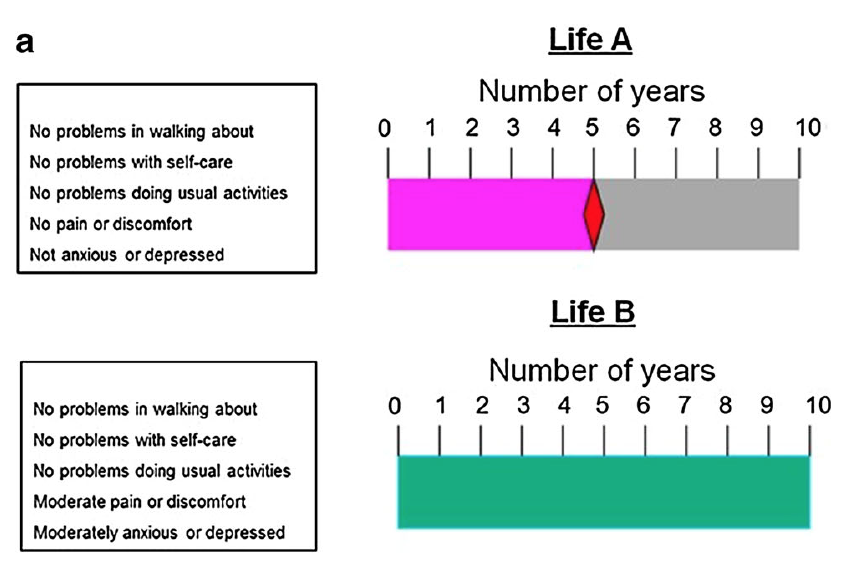
As described in Part 1, the Measuring and Valuing Health (MVH) protocol used for the UK EQ-5D-3L value set (and many others) uses a substantively different kind of time tradeoff for SWTD. Whereas the BTD task involves varying the duration in perfect health until it is equivalent to 10 years in the target health state h, the WTD task provides 10 years in total, to be shared between full health and h. The respondent must therefore simultaneously vary the duration in h and the duration in perfect health until she is indifferent between that life and immediate death.
Visual aid (“time board”) for worse-than-dead states, used by the MVH TTO protocol. From Oppe et al. (2016).
Because the tasks are so different, the validity of combining them on the same scale is in doubt. Moreover, the minimum value is determined by the fairly arbitrary choice of time increment: if 1 year, the minimum is -9; if 1 month, it’s -119.[6] (In the MVH protocol, it was three months, giving a lower bound of -39.)
To make matters worse, it became standard practice in the mid-1990s to rescale those responses to fit a lower bound of -1, using one of a few different methods that give considerably different results (Lamers, 2007). While acknowledging the lack of theoretical basis for this, analysts gave a number of justifications (see e.g., Tilling et al., 2010; Dolan, 1997; Lamers, 2007; Patrick et al., 1994):
- Convenience: It made it easier to carry out statistical modeling.
- Comprehension: Respondents may have misunderstood the task, assuming it was more like the BTD task. If so, transforming them may better reflect their true preferences, at least on aggregate.
- Plausibility:
- Some implied values (e.g., a lower bound of -39 for the UK EQ-5D-3L value set) were considered unrealistic. Richardson and Hawthorne (2001) even claimed that it was impossible to experience a state as bad as -1, and instead used a bound of -0.25 for the AQoL.[7]
- Unbounded negative values dominate calculations: a state can receive a negative mean value even when only a small minority of respondents consider it WTD, which doesn’t seem right. (One response is to use medians, but that brings its own problems.)
- Symmetry: The arbitrary figure of -1 was apparently “motivated by an equal range for positive and negative utilities” (Lamers, 2007), though it's unclear to me why this would be considered an advantage.
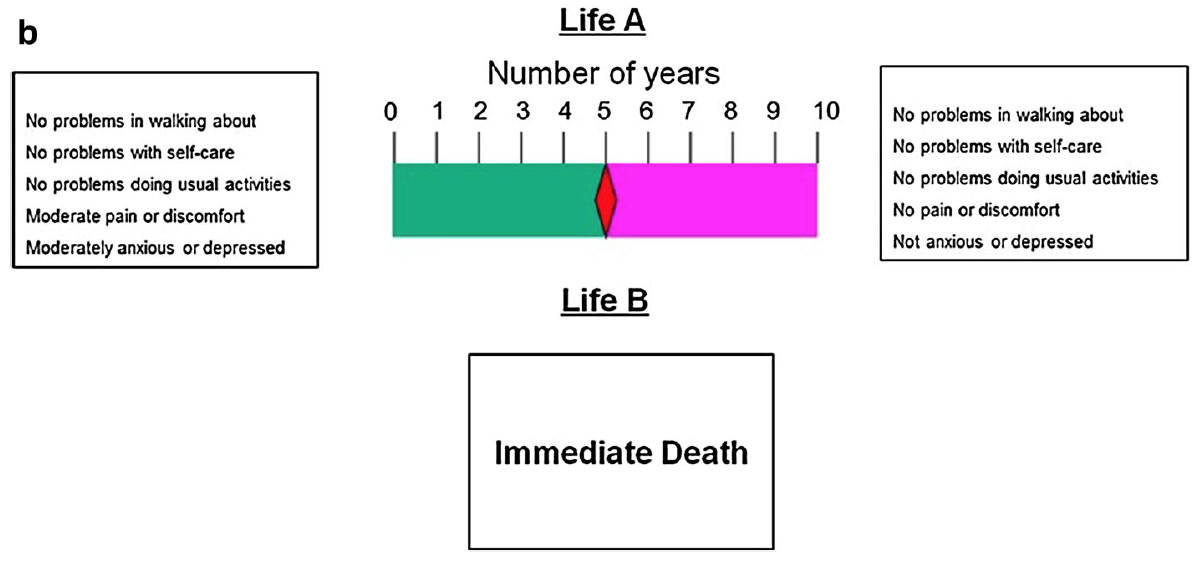
In response to these problems, more recent protocols, most notably the EuroQol Valuation Technology (EQ-VT), tend to use a variant of the “lead time” TTO (LT-TTO) (Robinson & Spencer, 2006; Devlin et al., 2010; Oppe et al., 2016; Oppe et al., 2014).[8] This presents a choice between Life A, a variable time in perfect health, and Life B, a fixed period in perfect health (the lead time) followed by a fixed period in h. The period in Life A is varied until the respondent is indifferent between the two lives. In effect, it’s asking: How much time in perfect health would you require as compensation for living the stated period in the target state?[9]
The visual aids used in the EQ-VT protocol for states worse than dead. From Oppe et al. (2016). In this example, the utility of the target state is (5 – 10) / (20 –10) = -0.5.
This approach is preferable because it produces utilities on the same scale as SBTD. However, it’s hard for some respondents to understand and is still subject to major framing effects. Most notably, results are sensitive to the duration of lead time: in a non-representative sample, Devlin et al. (2013) found a minimum value of about -1.5 when using a 2:1 ratio (e.g., 10 years lead time followed by 5 years in the target state), but about -4 when using a 5:1 ratio (though it did not affect the proportion of states deemed WTD). Around 3–5% of respondents exhausted all of their lead time, suggesting they would have given even lower values had it been possible. This is particularly concerning given that the EQ-VT (Oppe et al., 2014), which is often used to value the EQ-5D-5L, uses a 1:1 ratio (as shown in the image above).[10]
Moreover, nearly half of respondents reported taking into account the possibility that they would partially recover from the illness during the period in the target state (contrary to instructions). This would artificially raise their value for that state, because in effect they would be assessing the badness of a less severe condition.
Taken together, these findings suggests that the most common variants of the TTO for SWTD still generate minimum utilities that are far higher (healthier) than the actual preferences of the general public.
Standard gamble
The SG task for SWTD is identical to the task for SBTD, except that immediate death and the target health state h exchange places. That is, the possible outcomes of the gamble in Alternative 1 are (a) returning to full health for 10 years and (b) remaining in h for 10 years (rather than (a) full health versus (b) immediate death). Alternative 2 is certain immediate death (rather than certain 10 years in h). The probability p of being restored to full health is varied until the respondent is indifferent between the alternatives, and the utility is calculated as -p/(1 – p).
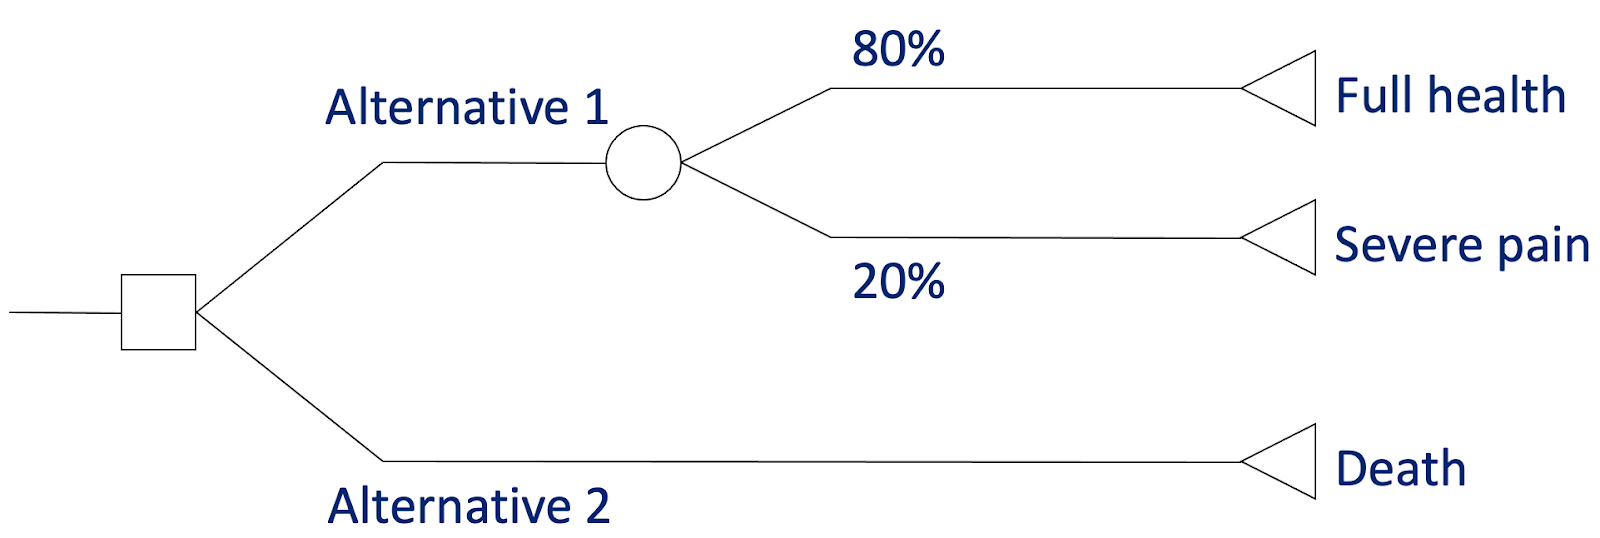
The standard gamble for states worse than dead. In this case, the respondent is willing to risk a 20% chance of 10 years in severe pain to avoid immediate death, giving a QALY value of -0.8/(1 – 0.8) = -4. (Image adapted from lecture slides by Tessa Peasgood.)[11]
However, this puts SG utilities on a scale of minus infinity to +1. As discussed above, some believe this results in implausible values, gives undue weight to negative values when calculating means, and presents difficulties for statistical analysis. Thus, as with the TTO, values are typically transformed to fit a lower bound of -1, often by simply using the negative of the indifference probability of the best outcome, i.e., -p (= -0.8 in the above example).
Discrete choice experiments
DCEs have some potential advantages when valuing SWTD. For instance, they tend to be less cognitively challenging than the TTO and SG (especially the variants for SWTD), can often be administered online without the support of an interviewer (thereby reducing costs), and can avoid “focusing effects” (e.g., instinctive aversion to death that increases values for poor states). They also use the same task for SWTD and SBTD, potentially providing better comparability across negative and positive values.
The key challenge with using DCEs (and other ordinal methods) for valuing HALYs is anchoring values to 0 and 1, which of course is also needed for handling SWTD. For generating QALYs, Rowen, Brazier, & Van Hout (2014) compared five methods to the TTO, to which I’ve added a sixth by Bansback et al. (2012):
1. Worst state = 0
The first is to assume the worst state valued (e.g., 55555 on the EQ-5D-3L) is equivalent to being dead (i.e., QALY = 0). This naturally makes SWTD impossible. While this may be compatible with some theoretical approaches to health (e.g., capability, or “functional efficiency”) there is no empirical support and it violates “common sense”: people clearly do consider some states WTD. So I don’t think this is a serious candidate.
2. Include “dead” in the DCE exercise
The second adds immediate death as one option in some choice pairs, and normalizes coefficients so that dead achieves the predicted value of zero. This is easier and cheaper to administer than most options below, but reintroduces potential focusing effects. This method has predicted SG health state values for the SF-6D and Health Utility Index pretty well (McCabe et al., 2006) but produced higher values than the TTO (Rowen, Brazier, & Van Hout, 2014). It also presents difficulties with interpreting responses from participants who do not value any states as WTD (Flynn et al., 2008): the location of their values on a HALY scale (i.e., in relation to 0) cannot easily be inferred.
3. Anchor to TTO for the worst state
The third is to normalize the coefficients using the TTO value for the worst state. In other words, the worst DCE value is anchored to the worst TTO value. This naturally requires carrying out the TTO alongside the DCE (albeit with a smaller sample), which makes it costly and time-consuming, and subject to all the usual problems with the TTO (time preference, cognitive complexity, etc.) that the DCE was designed to avoid. Due to its reliance on a single state, it produced values that were higher (healthier) and less dispersed (smaller range) than option 2 in Brazier et al. (2012), and higher than TTO in Rowen, Brazier, & Van Hout (2014).
4. Mapping DCE values to TTO
The fourth is to develop an algorithm to map (“crosswalk” in some literature) from mean DCE values to mean TTO (or SG, VAS, etc.) values for a small number of states (e.g., 10–20). This naturally assumes that the TTO values are “correct,” and the validity of the algorithm is assessed by extent to which the results match, so unsurprisingly the results are very similar. Obviously, this is not a good solution if, as I believe, there are serious problems with the TTO. The only advantage over just using TTO seems to be cost: a small TTO study plus large DCE is cheaper than a large TTO.
5. Hybrid models
TTO and DCE data can be combined using a common likelihood function and/or a Bayesian approach, which makes use of individual response data (rather than just mean values). This has been found to “perform well,” and was used in the valuation of the EQ-5D-5L (Devlin et al, 2018). But again, it presupposes the validity of the TTO responses, which I think we should be trying to avoid.
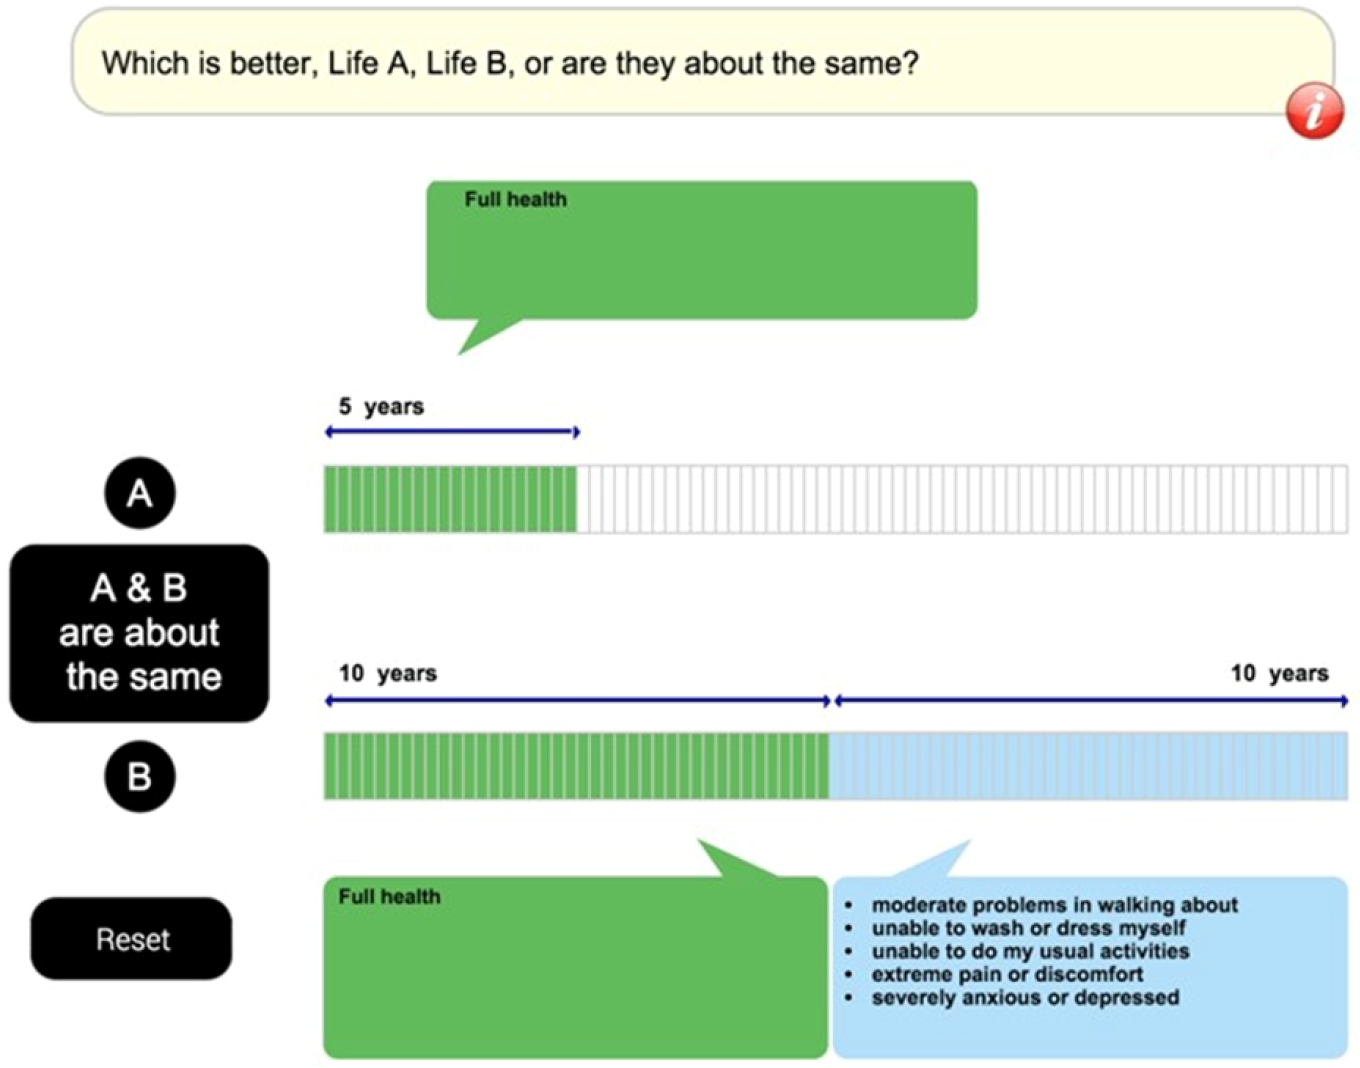
6. DCE with duration (DCETTO)
The final option, sometimes called the DCETTO, is like a normal DCE but with duration added as an attribute of the health state:
Discrete choice experiment using two EQ-5D-3L states plus duration. (From Bansback et al., 2012.)
Like in a TTO exercise, this information can be used to determine how much life expectancy the respondent is willing to give up so that the change in health state leaves the utility equal between the two options. In a study by Bansback et al. (2012) this generally performed well, e.g., most responses were logically consistent, but it lacks some key advantages of the regular DCE: it is about as cognitively challenging as the TTO, and uses a similar amount of resources due to the large sample required and complex study design and analysis. (See also Xie et al., 2020.) Overall, it produced values similar to TTO for mild states, but much lower for severe ones. Along with option 2 (including the state dead in choice pairs) the DCETTO is one of the few approaches that has the potential to address some (but not all) of the key problems with standard methods.
The differences between the values produced by the various kinds of TTO, SG, VAS and DCE are not trivial. However, the minimum value in every widely-used value set that I’m aware of is remarkably high, ranging from -0.59 for the UK EQ-5D-3L to +0.29 for the original SF-6D.[12] This implies that it would not be worth foregoing even one day in full health (which may not even be happy) to avoid a day of the most intense health-related suffering—confined to bed with unrelenting extreme pain, depression, and anxiety. For reasons I explain further in Part 4, I find this highly implausible and problematic, and it could lead to a grossly inefficient allocation of resources, particularly in countries with poor access to pain relief and mental health treatment (Knaul et al., 2017; Patel et al., 2018).
Suppose, for example, that the “correct” weight for the most severe cases of depression is -4 but the current weight for that state is 0.5. The value of bringing an extremely depressed person to 1 (full health) will be underestimated by a factor of ten—5 QALYs versus 0.5—which in an “efficient” health system based on cost-effectiveness would cause it to receive far too few resources. The overall burden of extreme depression would also be massively underestimated, which affects how much attention it gets from policy-makers, biomedical researchers, non-profit organizations, the media, the general public, and so on.
There may be two additional problems with current methods. First, some states may be wrongly classified as WTD. Because people tend to overestimate the badness (at least in terms of subjective wellbeing) of most physical illnesses and disabilities, particularly those affecting mobility, the values for some states are too low. As noted in Part 1, one study found that nearly half of respondents in states with negative EQ-5D-3L values reported themselves to be “quite satisfied,” “satisfied,” or even “very satisfied” with their lives overall (Bernfort et al., 2018). Yet extending their lives would be considered to have negative value based on some of the most popular health metrics.
Second, there may also be problems at the top of the scale. QALY 1 refers to full health, or maximum health-related quality of life, but is indifferent to improvements beyond the reduction of morbidity and mortality. There is surely some benefit in, say, being able to run a marathon rather than just walk around the park, so even from a “functional” perspective, common health utility instruments do not capture the full range of ability. Perhaps more importantly, there is also value in joy, pleasure, satisfaction, and other positive experiences that these metrics ignore.
A top priority, then, seems to be improving the way “extreme” states are handled. Some potential projects include:
- Promoting general improvements, such as those discussed above related to the selection of descriptive systems and valuation methods.
- Taking into account more psychosocial aspects of life, and incorporating the judgements of people with relevant experience, would likely lead to more accurate utilities on all parts of the scale, and extend the scale to describe a wider range of good and bad lives.
- A thorough review of common methods for handling SWTD in health economics. Surprisingly, I haven’t seen anything like this; the closest I’ve found is Tilling et al. (2010), an outdated review of TTO-based methods for SWTD, and a brief overview in the standard textbook (Brazier et al., 2017). It could address questions such as:
- How do results for SWTD differ across common methods (TTO, DCE, DG, etc.)
- What explains the differences?
- E.g. are they mostly due to the type of task/protocol or to statistical modeling decisions?
- Which seems most valid?
- Is the answer different for SWTD and SBTD?
- If so, it is feasible/reasonable to use different methods for either side of 0?
- How strong is the theoretical basis for each approach?
- To what extent are preferences “distorted” by (lack of) explicit comparison with being dead?
- What normative and psychometric questions have to be addressed to answer this?
- Is the answer different for SWTD and SBTD?
- What methodological developments are on the horizon?
- It might to good to focus on the DCE, ordinal methods in general, and hybrid models, as they are increasingly popular (and relevant to DALYs).
- What are the practical implications of the differences/reforms? How much would they actually change healthcare priorities?
- A review of less common methods, e.g.
- How are SWTD handled in person tradeoffs, magnitude estimation, and elicitation of the social welfare function?
- Is there any reason to (dis)prefer these over the more common ones?
- Can SWTD be addressed at the aggregation stage, e.g., by giving extra weight to QALYs gained by people in severe states (see below).
- An analysis of relevant policy issues, e.g.
- How and why were current methods chosen?
- Who are the key players in these decisions?
- How can the direction be influenced? (See below.)
- E.g. is it more tractable to focus on middle-income countries that are just developing their health technology assessment procedures, or on the “key players” in high-income countries?
- E.g. should we try to develop novel methods, or tweak more established processes like the EuroQol protocols?
- Advocating for specific changes, e.g.
- Adding more lead time to the LT-TTO may not require other major reforms, though it’s not without its challenges (Devlin et al., 2013).
- Further empirical research, e.g.
- Testing different amounts of lead time.
- It may even be worth experimenting with unlimited lead time, as well as with ratios such as 2:1, 5:1, 10:1 and 100:1
- Testing the effect of other methodological choices, such as the use of medians rather than means.
- Qualitative research on the plausibility/validity of extreme values.
- Do people “really mean it” when they give responses that imply values like -39 or minus infinity?
- Do they “really mean it” when they give quite high values for seemingly terrible states?
- Testing different amounts of lead time.
- Reflection on the appropriate purpose and scope of HALYs, e.g.
- Is it reasonable to expect them to capture the very worst/best (health-related) states, rather than a more “typical” range of experiences?
- E.g. if a QALY weight below -1 obtains for only, say, one in a thousand patients, and allowing lower values causes measurement problems in the rest of the scale, is it reasonable to “cap” values at -1? What if it’s one in a hundred, or one in a million?
- If not, are there ways of acknowledging more extreme cases—such as by using different outcome measures—and factoring those into decision-making?
- Is it reasonable to expect them to capture the very worst/best (health-related) states, rather than a more “typical” range of experiences?
Any work on this would also ideally consider broader issues around the (a)symmetry of valenced experience and the measurement of extreme suffering discussed in Part 4 of this sequence.
The above discussion has focused on the QALY. This is largely because, as noted in Part 1, the DALY does not even recognize SWTD—a conscious choice based, at least in part, on the desire to measure disability (defined in terms of loss of function, roughly speaking) rather than quality of life or “utility.” However, this could, in principle, change in future, either by allowing values to rise above 1 (= dead) or by switching the direction of the scale to match the QALY. In that case, the above research ideas would mostly be applicable to the DALY as well. Given the level of institutional inertia and active resistance to such changes, it may be good to start by looking into the policy aspects, e.g.
- How and why did the DALY come to be constructed this way?
- Who would need to be persuaded for there to be fundamental reforms?
- How could they be persuaded?
- How tractable are such changes? On what kind of time frame?
It’s also perhaps worth looking at how the “dead” anchor is established in the current DALY. To recap from Part 1: the main valuation procedure used pairwise comparisons (arguably a form of DCE), whereby respondents choose the “healthiest” of the two states. As with the DCE, the analysis of this ordinal data is rooted in random utility theory, which essentially claims that the frequency with which an item is chosen indicates its value relative to the alternative. To put these values on the DALY scale (which, like the QALY, arguably has ratio properties), some respondents were also asked “population health equivalence” questions (similar to PTO):
Imagine there were two different health programs.
The first program prevented 1000 people from getting an illness that causes rapid death.
The second program prevented [Number selected randomly from {1500, 2000, 3000, 5000, 10 000}] people from getting an illness that is not fatal but causes the following lifelong health problems: [Lay description for randomly selected health state inserted here, for example, “Some difficulty in moving around, and in using the hands for lifting and holding things, dressing and grooming.”].
Which program would you say produced the greater overall population health benefit?
These enabled inferences to be made about the badness of death versus living with various conditions.[13]
I don’t feel qualified to hold a strong opinion on the merits of this approach. Given that SWTD are excluded anyway, and that disability weights tend to be otherwise similar to the QALY equivalents, I suspect that developing and promoting another anchoring method should not be a high priority. However, having not looked into this in depth, I may well be mistaken.
Who should provide the values?
Whose preferences are used may matter even more than the choice of descriptive system and valuation methodology (Brazier et al., 2017, pp. 77–84; Brazier et al., 2018; Cubi-Molla, Shah, & Burström, 2018). In early versions of the DALY, disability weights were obtained from a panel of “experts,” mostly clinicians (Chen et al., 2015). In a few countries, such as Sweden and Germany (Leidl & Reitmeir, 2017), the assessment agencies require “experience-based” preferences for QALYs. These are typically from patients[14] valuing their current state using a standard method (TTO, SG, VAS, etc.), but other kinds of experience are possible (e.g., past, future, and vicarious: see Cubí-Mollá, Shah, & Burström, 2018 for a helpful framework). However, in recent years, both QALY and DALY weights have usually come from representative samples of the general public, most of whom have not experienced most of the states being valued; this is a requirement of most relevant agencies, including NICE.
The choice of “experienced” versus “hypothetical” preferences does seem to affect the resulting values. In general, experienced QALY weights are higher (healthier), especially for mobility-related dimensions (Cubí-Mollá, Shah, & Burström, 2018; Peeters & Stigglebout, 2010), although one meta-analysis found no difference when the standard gamble was used (Peeters & Stigglebout, 2010). However, the reverse seems to hold for at least some mental health conditions, with patients (and sometimes carers) providing lower values for dementia (Rowen et al., 2015), anxiety and depression (Pyne et al., 2009; Schaffer et al., 2002; Papageorgiou et al., 2015), and schizophrenia (Aceituno et al., 2020).
Three main reasons have been offered to explain the discrepancy between experienced and hypothetical values (Brazier et al., 2017, pp. 78–9):
- Inadequate descriptions (or inadequate imaginations): Any descriptive system, not just an MAUI like the EQ-5D, will only cover a few aspects of life with the condition. The (non-experienced) respondent will then focus on these (usually negative) elements, and “fill in the gaps” with their assumptions about other areas of life, which may not be accurate.
- Adaptation: In valuation tasks, people may focus on what it’s like to initially acquire the health condition, rather than to live with it for an extended period. In general, people don’t fully recover from a major adverse event (Cubí-Mollá, Jofre-Bonet, & Serra-Sastre, 2017; Howley & O’Neill, 2018; Lucas, 2007; Luhmann & Intelisano, 2018; Oswald & Powdthavee, 2008; Powdthavee, 2009), but they do tend to underpredict the extent to which they will adapt (Kahneman, 2000; Gilbert & Wilson, 2000; McTaggart-Cowan et al. 2011; Dolan, 2011; Karimi et al., 2017). This can involve both practical changes, such as learning to walk with a stick or taking up new hobbies, and psychological ones, such as lowering expectations, changing one’s view of what matters in life, or simply focusing less on the health problem. Note that this is not a measurement problem: adaptation causes the actual (not just perceived) wellbeing to improve relative to predictions, which may be seen as positive. However, as noted in Part 1, people tend to underpredict the severity of some mental disorders (e.g., Pyne et al., 2009; Schaffer et al., 2002; Papageorgiou et al., 2015): by their very nature, these conditions put distressing thoughts and feelings at front of mind, making them inherently resistant to adaptation.
- Response shift (also called scale recalibration): Patients may have lower internal standards for what counts as “healthy” or “good quality of life,” perhaps due to lowered expectations (Sprangers & Schwartz, 1999). For instance, someone with cystic fibrosis may compare themselves to others with the same condition, rather than to completely healthy individuals, whether or not they have adapted. That is, there could be a real difference in quality of life between people who give the same values, which is potentially a serious (and hard-to-quantify) measurement problem.
There has been considerable debate over the appropriate source of utilities. Below is a brief summary of the cases for and against public preferences and own-state (e.g., patient) values (adapted from: Brazier et al., 2017, p. 89; Helgesson et al., 2020; Brazier et al., 2018; Brazier et al., 2005).
Using preferences of the general population
For:
- The “veil of ignorance” argument was advocated by the Washington Panel on Cost-Effectiveness in Health and Medicine: a lack of “vested interest” was considered important (Gold et al., 1996).
- Public funding (in the form of taxation, for example) can essentially be seen as public insurance and so it may seem appropriate that ex ante public preferences determine health states. In other words, since the general population will be supplying the resources, they should be the ones determining how they are used. This has some support in the extra-welfarist tradition discussed in Part 1 (which often seeks to use “social” rather than individual values).
- Whatever the normative arguments, the use of population values may help generate public support for decisions based on cost-effectiveness analysis.
- It’s more straightforward to obtain large amounts of (by some measures) high quality data: it's easier to survey a simple random sample of adults than large numbers of patients with the relevant conditions.
Against:
- Members of the general population generally have little or no first-hand experience of the health states being valued, making them especially vulnerable to cognitive biases, misunderstandings, and other errors.
- While members of the public want to be involved in healthcare decision making, it’s not clear that they want to be asked to value health states specifically (Litva et al. 2002). There are other ways of involving the public, as noted below.
Using experience-based (own-state) values
For:
- Patients know their own health state better than anyone trying to imagine it, so in most cases it’s reasonable to assume that their values more accurately represent its severity.
- It’s the well-being of the patient that we’re interested in, since ultimately it’s (primarily) the patients who will be the losers and gainers from a public program. This is in keeping with welfare economics, discussed in Part 1, in which welfare is understood as the aggregation of individual (“consumer”) utilities (although many members of the public will also consume healthcare at some point, so it isn’t entirely clear welfarism implies the use of own-state values). It’s also consistent with some other “maximizing” theories, such as classical utilitarianism, given certain assumptions (e.g., that all relevant effects are on the patient rather than, say, relatives—or at least that the spillover effects correlate more strongly with patient than public preferences).
Against:
- Patients may behave strategically; for example, they may exaggerate the severity of their condition in order to obtain better treatment. Consciously or not, they do tend to rate conditions similar to their own as more severe (Álvarez & Rodríguez-Míguez, 2011).
- There are significant practical challenges. Some patients are unable (e.g., in severe dementia) or unwilling to provide values—or it may be unethical to ask, such as in terminal conditions when it may cause distress. This can lead to small and unrepresentative samples in poor health states (which are perhaps the ones that would benefit most from own-state valuation)—although this problem can be mitigated with careful methodological choices.
- Patients may be “penalized” for adapting to a health problem. Some non-utilitarians (e.g., Sen, 1997, pp. 45–46)[15] argue that some kinds of psychological adaptation, such as lowering expectations, should not count against the patient when it comes to resource allocation, even if it would lessen the (experienced) utility from treatment.
- Patients may be “penalized” for having a different subjective scale (e.g., due to response shift). For instance, if people rate their mobility in comparison to others of their age group, older people may consider themselves to have “moderate problems” and younger people “severe problems” for the same objective level of mobility. Interventions that alleviate mobility problems in older people may therefore seem relatively less cost-effective.
- Own-state valuation using some common preference elicitation tasks (TTO, SG, etc.) are not “experienced utility” in the Kahneman or Benthamite sense. They still involve imagining future health (e.g., staying in the current health state for 10 years), and thus may be vulnerable to many of the same “biases” as with valuation of hypothetical states, e.g., the patient may focus on the health state rather than other aspects of life, presume some change in severity over time, fail to grasp small probabilities, or have “irrational” time preferences—and, of course, they will still have to imagine the “full health” and “being dead” comparators. (VAS may avoid some of these issues, but has other problems, as noted above.) They could also be subject to additional distortions, such as the “negativity bias” associated with depression, so it is not impossible that some are less accurate than their hypothetical equivalents.
For these reasons, some advocate a “middle way” that better accounts for patient experience without relying entirely on own-state valuation. Options (adapted from Brazier et al., 2018) include:
- Improve the descriptive systems, e.g., include wellbeing dimensions that better reflect the impact on the lives of those experiencing the health states. This is discussed above. Of course, it’s also possible to combine a better descriptive system with patient preferences (something which I’d tentatively endorse for some purposes).
- Encourage more deliberation and reflection in the task, perhaps alongside more information. For example, in small-scale studies general population respondents have been given more detailed descriptions of life with the condition (audio, video, photographs), including information on adaptation; been told patients’ own-state TTO values; participated in simulations (such as goggles for vision problems); and been allowed to discuss potential responses in small groups. Results have been mixed, with some but not all leading to values closer to patients’ own (McTaggart-Cowen, 2011; Murphy et al., 2020). An alternative is using “citizens’ juries” or multi-criteria decision analysis (MCDA) to elicit utilities, which involve a small group of non-experts considering a particular policy issue in depth. It’s unclear how practical this is for generating whole value sets.
- Provide decision-makers with two incremental cost effectiveness ratios or net benefit values using (a) general population hypothetical values and (b) own health state values. This would increase the burden on analysts, and there would still be a need for some principled weighting of the two findings, so it does not seem like a sustainable solution.
- Use subjective well-being to reweight an existing health state classification system, such as the EQ-5D. Common criticisms include the fact it isn’t preference-based (and so may go against the wishes of the taxpayer and/or patients), and is not easily anchored to the 0–1 scale. This option is discussed in Part 3.
Overall, I’m moderately confident that experience-based values are, in many cases, preferable to the purely hypothetical values currently used for most value sets, but they have a lot more limitations than I realized at first. Given that most agencies are unlikely to accept experience-based utilities any time soon, it may be worth looking into ways of improving elicitations from the general population.
Some possible research questions include:
- How important is the value source relative to other factors (e.g., choice of MAUI and valuation task)?
- This may be available in, or deducible from, existing literature.
- How much more accurate are “experience-based” values? How does this vary by condition, type of experience (e.g., past, current, caring for a patient), and other factors? What is the “gold standard” for determining accuracy?
- What are the best ways of improving hypothetical preferences?
- Review of “informed preference” studies, i.e., an update of McTaggart-Cowen (2011).
- New empirical studies, or replications of previous ones.
- Would recent advances in virtual reality technology help?
- Is there some way of combining own-state and general public preferences, or using each more selectively?
- E.g. could we use own-state values only for conditions that are particularly hard for the general public to understand?
- E.g. could we use public values only when it is hard to get meaningful own-state values?
- E.g. could we take a weighted average of own-state and public preferences?
- How would we determine the weighting?
- Does the general public actually want to provide the values, if they are given evidence that they are misleading?
- What would it take to persuade institutions like NICE and IHME to use own-state values?
How should we handle spillover effects?
Becoming sick or disabled has implications beyond the individual patient. Most obviously, carers and family members can experience increased mental health problems, financial distress, and disruption to work, school, sleep, and social activities (for examples, see Peasgood, Foster, & Dolan, 2019, p. 39). They can also experience benefits, such as a sense of fulfilment (Cohen, Colantonio, & Vernich, 2000; Mackenzie & Greenwood, 2012) and even reduced mortality (Brown et al., 2003). Beyond the family, health problems can have implications for crime, antisocial behaviour, productivity, expenditure on a range of public services, and so on. If we take a consequentialist or (quasi-)welfarist perspective, which seeks to maximize the amount of “good” done with the available resources, it is important to capture these “indirect” effects in our economic assessments. Doing so is likely to have considerable impact on our priorities (Krol, Papenburg, & Exel, 2015).
Two broad, and not necessarily mutually exclusive, approaches to this have been taken so far. The first is to incorporate them into the numerator of the cost-effectiveness ratio; for example, by putting a dollar value on the time a relative spends caring for the patient, the income lost due to the condition, and the cost of future “unrelated” medical care (e.g., the cost of treatment for disease B that will only be incurred if treatment for disease A extends the patient’s life). This is often done in analyses that claim to be from a “societal” perspective (as opposed, for example, to a “payer” or “health service” perspective). It is often criticized on equity grounds; for instance, preventing morbidity and mortality among high-earners will look better than equivalent gains to the less “productive,” and counting future unrelated costs “biases” evaluations against the elderly and chronically ill. It also faces a number of practical measurement challenges, e.g., there are several competing approaches to measuring productivity loss, the value of informal care, and the value of intangibles such as travel time and leisure time; and there’s no consensus on which of these should be counted in the first place.
The second approach, then, is to add them to the denominator. The relatives, carers, etc., can be given the same questionnaire (e.g., EQ-5D) and their change in HALYs added to the patient’s. As with societal-perspective costing, this is not done consistently. But more fundamentally, it is clear that current health-focused metrics are not able to capture many of the most important indirect effects on either the patient or other members of society. This is one of the key motivations for the development of a wellbeing approach and “hybrid” health/wellbeing measures, most notably the E-QALY, which is explicitly designed for use with carers as well as patients.
However, there is a further concern that applies to any health or wellbeing measure, and to the translation of effects into costs, namely the risk of double counting. It seems to be widely assumed that respondents in valuation tasks consider only the impact of the health state on themselves, yet the limited available evidence suggests they often incorporate other-regarding factors as well. For example, in qualitative studies alongside time tradeoff and standard gamble exercises, participants considered a number of non-health consequences when valuing health states, including the potential for being a physical or psychological burden on others, ability to carry out parental duties, and the effect of bereavement on others (Baker & Robinson, 2004; Karimi, Brazier, & Paisley, 2017). At the same time, it seems reasonable to assume health state values do not fully reflect the consequences for the rest of society—something that would be impossible for most respondents to predict, even if they were wholly altruistic.
Thus, relying entirely on a valuation from the perspective of the patient is likely to underestimate the benefits of an intervention, whereas summing the HALYs of the patients and all others affected is likely to overestimate it. To give a simplified example: if having Disease A would cause a burden to one’s child (e.g., through caring responsibilities or disrupted education), one may be tempted to give up more time in the TTO (i.e., assign a lower QALY weight) to account for that—but this would not cover all negative effects on the child, let alone the rest of the family, carers, and the broader community. On the other hand, assessing the effect from the perspective of the child is likely to count not only the caring burden, but also the child’s preference for the parent to be better, which is already covered by the QALY weight for the patient. So counting just the parent’s valuation would underestimate the impact, but counting both the parent’s and the child’s would overestimate it. Similar issues are faced when dealing with costs, e.g., respondents may consider effects on income or leisure time when valuing the state, so subtracting them from the numerator as well could overestimate the benefits of treatment.[16]
This would seem to have major implications for the development, selection, and application of QALY and DALY instruments. For example, it seems possible (though perhaps unlikely) that health-focused measures based on judgements of the general public, like the DALY and most EQ-5D value sets, capture the total burden of an illness better than those that correlate more strongly with the subjective wellbeing of the patient—at least when they are not also administered to relatives, carers, etc. Blindness, for instance, seems to have surprisingly limited long-term consequences for the happiness of the blind person (Pinquart & Pfeiffer, 2017), but incurs significant costs to the rest of society through reduced productivity, caring requirements, etc. (Köberlein et al., 2013). If respondents take things like this into account when assigning values to conditions, or if by coincidence[17] conditions that cause the greatest overestimation of disutility for the individual tend to have the greatest indirect effects, narrowly health-focused measures could be superior to (quasi-)wellbeing measures from a wellbeing perspective in at least some scenarios.
Even within mental health it may substantially affect priorities. Schizophrenia and bipolar disorder, for instance, have much greater effects on families and communities than do depression and anxiety, so the overall disease burden and the cost-effectiveness of treatment may depend on how far these are taken into account.
Of course, a more robust approach to capturing total utility loss and gain would likely involve applying better instruments (i.e., ones that correlate more strongly with wellbeing) alongside any other necessary methodological adjustments, such as careful cost accounting and gathering information about effects on relevant individuals, while being careful to avoid double counting. But perhaps we should be hesitant to recommend a shift to such measures that isn’t conditional on these other changes. I would speculate that this applies even more strongly to population health summaries like the global burden of disease than to economic evaluations, as the former necessitate a broad-brush approach without, for example, the opportunity to present some outcomes as costs.
Projects in this area (both reviews and empirical work) might address questions like:
- Which effects beyond the individual respondent/patient are captured by the various measures, to what extent are they captured, and how much of the actual utility loss (to all those affected) does this represent for various conditions?
- When, if ever, are health-focused instruments a better proxy for wellbeing outcomes than wellbeing or hybrid measures?
- What effect do differing methods/framings/instructions have on the results? For example, are different values obtained when respondents are asked to consider only the effect of a state on their own life, versus certain categories of individuals (family, carers, colleagues...), versus everyone potentially affected?
- Are people capable of accurately accounting for the health/wellbeing of others (to avoid the need to survey people other than the direct targets of interventions)?
- Are they capable of excluding other-regarding effects (to avoid double counting)?
- If neither, how do we determine the actual utility loss/gain?
- For one approach, see the next section on aggregating HALYs.
- When surveying third parties, where do we stop? A huge number of people (not to mention nonhuman animals) are affected directly or indirectly by many interventions, and it isn't practical to try to account for all impacts. So who should we give questionnaires to? Just immediate family? Extended family? Unrelated carers? Friends? Colleagues and those affected by lost productivity? The local community? Clinicians? It seems hard to draw a principled line, and to be consistent across evaluations.
- What about effects on individuals incapable of providing information, such as babies, future generations, those with severe dementia, and nonhuman animals? This poses both practical and theoretical challenges.
- What are the ethical implications, and how can they be addressed? For instance, some interventions may benefit the patient but have a net negative effect overall, such as by making life harder for carers. Rejecting such interventions would seem to conflict with traditional medical ethics, which focuses on the individual patient, and even a staunch utilitarian may accept that it's better in the long run to have rules that prioritize the patient in such circumstances. There are ways of avoiding such issues, like giving extra weight to patients when summing the utilities, or considering rights-based arguments at the decision stage, but it seems likely to become quite messy, both philosophically and practically.
How should HALYs be aggregated?
Unless otherwise stated, the following is adapted from Brazier et al. (2017, ch. 10) and lecture slides by Aki Tsuchiya.
As noted in Part 1, the default assumption by most users of the QALY (and recently the DALY) is so-called “Principle Q”: a HALY has equal value no matter who gets it. More formally, it assumes a health-related social welfare function (HR-SWF) under a fixed budget in which health-related welfare (W) is the simple sum of the level of health (h) of all individuals in the population:
- W0 = h1 + h2 + … + hn
However, many have argued that QALYs should be weighted differently, offering three main types of reason:[18]
- Variation in the social value of health for efficiency reasons depending on whose health it is. Increasing the health of some individuals creates more benefits beyond the patient, such as to family, carers, or the economy. For instance, helping the young may, on average, have more “investment value” and productivity benefits than helping the elderly.[19]
- Variation in the social value of health for equity reasons depending on whose health it is. Some individuals “deserve” an extra unit of health more than others; for instance, if they didn't cause the condition (Dworkin, 1981a, 1981b), or if they have worse access to healthcare due to geographic location.
- Diminishing marginal social value of health for equity reasons as the level of health increases. A unit of health has more value when given to someone of poorer health status. This is associated with various kinds of prioritarianism, e.g.: Alan Williams’ (1997) “fair innings” argument, which gives extra weight to those with lower lifetime expected QALYs; Erik Nord’s related (2005) suggestion that we only consider prospective health (thus ignoring age); and Nord’s earlier (1993) proposal to focus on the initial severity of the health state.
(1) and (2) can be accounted for in the following HR-SWF:
- W1 = a1h1 + a2h2 + … + anhn
where ai represents the weight given to the health of the individual.
(3) is about how the units of health themselves (rather than the people) are aggregated. This requires a slightly more complex formula:
- W2 = [h1−b + h2−b + ... + hn−b]−1/b
where b ≥ -1; b ≠ 0. Thus, social welfare is a non-linear function of the exponents of the levels of individual health.
W1 and W2 can be combined into a more flexible health-related SWF:
- W3 = [a1(h1)-b + a2(h2)-b + … + a3(h3)-b]-1/b
For a review of the normative arguments for and against weighting, empirical evidence on public opinion, methods for obtaining weights, and practical implications, see Brazier et al. (2017, ch. 10). Some key takeaways include:
- A variety of methods can be used to obtain the weights, including “budget pie exercises” where participants allocate a budget across patient groups, binary choice exercises (like DCEs), and PTOs. Modes of administration include individual face-to-face interviews, telephone/postal/online surveys, and group discussion. These all have advantages and disadvantages, and tend to produce different results.
- There is no clear consensus among experts or the general public on which adjustments are morally justified, in part due to methodological differences across studies and difficulty of interpreting results. That said, a majority of lay people seem to favour giving some additional weight to the young and the severely ill, and less weight to those with a self-induced illness or of high socioeconomic status. There may also be some preference for increasing duration rather than quality of life, except at the end of life. There is little or no support for a higher cost-effectiveness threshold at the end of life, despite that being implemented by NICE. (See, e.g., Gu et al., 2015; Nicolet et al., 2020)
- Arguably, a policy can/should only be implemented in liberal democracies if there is both theoretical and popular support.
- There are serious practical challenges in applying weights in cost-effectiveness analysis (Wailoo, Tsuchiya, & McCabe, 2009).
See also Caro et al. (2019) for a concise review of other approaches to factoring in objectives beyond QALY maximization, including using different cost-effectiveness thresholds for different conditions (or severities), “efficiency frontiers” specific to therapeutic areas, and multicriterion decision analysis.
Thus, some potential projects include:
- Developing a more rigorous, standardized approach to eliciting and applying the weights in cost-effectiveness analyses and population health summaries.
- Carrying out such studies to obtain and apply the weights.
- Considering how these methods could be used to overcome some shortcomings of the current HALYs, e.g., can they be used to “reverse” the artificial compression of negative responses to TTO tasks, or account for indirect effects? Would that be cheaper/easier/more reliable than “fixing” the metrics themselves?
- Considering how the planned aggregation method should influence the design of the HALY+, e.g., if equity weights are to be applied at the aggregation stage, it’s probably not a good idea to use a valuation method (such as the PTO) that’s likely to be influenced by attitudes to equity.
Should we focus on improving the QALY or the DALY?
I’ve long assumed that it makes sense to focus efforts on improving the DALY rather than the QALY.
- The DALY the most common metric in low- and middle-income countries, which bear about 88% of the total disease burden.
- It seems to be more neglected, with most methodological work by health economists focusing on the QALY. The impact of a marginal researcher could therefore be higher.
- It appears to be developed, or at least overseen, by a single entity (IHME), albeit with support from academic institutions. Any changes would therefore affect future Global Burden of Disease studies and most future DALY-based cost-effectiveness analyses. In contrast, there are countless versions of the QALY around the world, with various combinations of descriptive system and valuation method, and localized value sets—the impact of developing yet another one would depend in large part on who could be persuaded to adopt it, and that’s likely to be a small subset of QALY users.
However, it’s worth bearing in mind the following:
- QALYs have so far been used in about ten times as many cost-effectiveness analyses as DALYs.[20] I’m not sure whether the ratio is changing, or in which direction, but QALYs are increasingly used in upper middle- as well as high-income countries (Zhao et al., 2018). More countries will enter these income brackets before any work we do comes into effect, and bodies such as NICE International and the International Decision Support Initiative are actively assisting the foundation of health technology assessment agencies that are likely to recommend QALYs, or be agnostic between QALYs and DALYs.
- It seems possible, in principle, to have a single global value set for the QALY, much as for the DALY— or at least a “default” set that can be switched for local ones where available.
- It seems much more tractable (though far from easy) to influence the QALY, especially in the direction of wellbeing. (In this case the neglectedness of the DALY may make it less tractable than the QALY, which seems to have more funding for methodological research.) As noted in Part 1, the primary developers of the DALY appear to be resolutely opposed to trying to measure anything but a fairly narrow conception of health (e.g., Salomon et al., 2003).
- If influencing the DALY is feasible at all, methodological work on the QALY could potentially trickle through to the DALY at some point. This is hard to predict, but there are connections between the relevant academics.
- For evaluating interventions, the QALY is theoretically superior to the DALY (in its current form), partly because it admits states worse than dead. It can also be used for measuring something like the burden of disease (Sánchez‐Iriso, Rodríguez, Hita, 2017)—though I haven’t looked into that much, and it seems unlikely to be adopted by IHME. It’s unclear, however, whether this counts in favor of a QALY focus: the DALY’s additional “room for improvement” may make marginal research more valuable.
- Some claim that DALY-based analyses like the Global Burden of Disease and Disease Control Priorities studies are not as consequential as I had assumed (Glassman et al., 2012).[21]
I'm therefore not sure which would be the better focus for additional research. It’s probably worth spending significant time looking into this further before embarking on any major projects.
How can we influence the development and use of HALYs?
There’s no point developing a theoretically ideal metric if nobody will use it. Thus, the impact of many projects outlined in this post (and the rest of the series) depends not just on their technical tractability but on the ability to influence key decision-makers. How best to do so is potentially a whole research project (or series of projects) in itself, but it’s probably wise to involve key stakeholders from the beginning. The E-QALY project, for example, involves consultation with academic experts, patients, social care users, carers, NICE, EuroQol (which developed the EQ-5D), and others with an interest in the results. Some other key institutions and individuals are listed below.
On the QALY:
- A very large proportion of the relevant work, including some on wellbeing, comes out of the University of Sheffield’s School of Health & Related Research, which offers a fully-funded doctoral training programme.
- John Brazier is the key figure there, but it’s a pretty large team.
- York, Birmingham, Glasgow, and the London School of Hygiene & Tropical Medicine are also significant players in the UK.
- My impression is that York is considered the best place in the world for health economics, though Sheffield is perhaps better for cost-effectiveness modeling and outcome measures.
- In Australia, Melbourne, Monash, ANU, and UQ are among the universities doing health economics research, but I don't have a great sense of which is best.
- The AQoL was developed at Monash, and much work on the EQ-5D happens at Melbourne.
- “Consumers” of the QALY include about 40 national agencies (Zhao et al., 2018).
- NICE has a particularly strong influence over research in this field (Sculpher & Palmer, 2020).
- Of the handful of NICE analogues in low- and middle-income countries, Thailand’s Health Intervention & Technology Assessment Program (HITAP) seems to be among the strongest.
- NICE International, the International Decision Support Initiative (iDSI), and HITAPs International Unit promote health technology assessment globally.
- iDSI’s reference case (guidelines) allow either the QALY or DALY to be used as the measure of benefit.
On the DALY:
- IHME, led by Chris Murray, carries out the GBD studies.
- I recommend Murray’s biography, Epic Measures, for an interesting account of how the DALY and GBD came about.
- The University of Washington has links to IHME and offers a PhD programme in global health metrics—the only one of its kind, as far as I can tell—though it seems to focus on impact evaluation rather than DALYs per se.
- Josh Salomon, who leads much of the relevant research (including the surveys to obtain the disability weights), is based at Stanford and is an adjunct professor at Harvard, both of which run fully-funded health policy PhD programs.
- The Bill & Melinda Gates Foundation funds a very large proportion of DALY-based analyses, including the Disease Control Priorities projects.
- I don’t think it works on the DALY itself, but if it wanted to measure outcomes differently I suspect researchers would have to listen.
- Erik Nord is at the Norwegian Institute for Public Health in Oslo. He has led research on the person tradeoff and has published critiques of both QALYs and DALYs, often with a view to prioritizing according to severity.
These lists are no doubt biased by my own background; there are probably other good places to work on these issues. There is also a large literature on translating research into policy, but I’m not very familiar with it so I won’t try to give advice—I’d love to hear suggestions from people with more experience in this area. Ideally, a complete “theory of change” would be developed before beginning any major projects.
I’ve generally been assuming that the topics in this post would be taken on by individual researchers, such as students looking for a thesis project or considering career options. The ideal candidate might be:
- Skilled in relevant areas, such as health economics, psychology, statistics, public policy, qualitative data collection, or perhaps even philosophy—or able and willing to gain those skills.
- Connected to relevant organizations or individuals—or able and willing to gain those connections.
- Pragmatic: With so many competing interests and opinions, you are unlikely to end up with your ideal metric.
- Patient: Many of the projects will take a lot of time, most will probably have no impact, and any changes would likely be implemented several years down the line.
But research towards a HALY+ could also be an attractive option for major non-profit donors like Open Philanthropy, which could gather a relatively large team to address a number of these issues simultaneously, and apply them to real-world priority setting. However, funders that are unconstrained by the needs of public institutions may prefer to work on an overtly wellbeing-focused measure like the sHALY or WELBY.
ITN assessment of work on the HALY+
The importance, tractability, and neglectedness will naturally vary widely from project to project, but here are some general thoughts.
Importance
The incremental changes discussed here avoid some plausible critiques of a full wellbeing approach (e.g., that it may be wrong in principle, impractical, or just unpopular) while potentially achieving most of the benefits of a sHALY. Some projects, such as on states worse than dead, could substantially affect the absolute and relative weights for certain health conditions.
If that is correct, the impact of implementing a HALY+ could be considerable. HALYs seem to have increasing influence over healthcare decision-making, both through health technology assessment (principally the QALY in high- and upper middle-income countries) and population health summaries (mostly the DALY in low- and middle-income settings). Informally, I’ve also heard that some effective altruism organizations refer to the Global Burden of Disease and Disease Control Priorities studies when deciding which problems to focus on.
On the other hand, the most likely form of HALY+ may represent a fairly modest improvement, retaining many of the serious limitations of traditional QALYs and DALYs. For instance, it will probably only be extended to social care, will still rely on questionable preferences of some sort, and is unlikely to capture the true severity of the worst experiences. There is a risk that working on these projects would distract attention and resources from more fundamental reforms.
Worse, there is some chance that it could backfire entirely. For instance, the use of own-state preferences may improve measurement of patients’ health, but without better means of capturing effects on others this might result in less accurate assessments of overall impact. Or it could create harmful path dependence, “locking in” flawed ideas for a long time. These seem fairly unlikely, but not wholly implausible.
Tractability
Most of these projects seem much more feasible than the wellbeing-focused alternatives. They generally build on a significant body of previous work, could draw on existing expertise, and could perhaps access the usual sources of funding for health economics research. And because they are relatively “mainstream,” it may be easier to convince researchers outside the effective altruism community to carry out much of the work. Importantly, these reforms are also likely to face less resistance from key stakeholders; indeed, some already have considerable support among the general public, academics, and even decision-making bodies like NICE.
That said, the challenges should not be underestimated. Some of the most important reforms, such as better capturing extreme suffering, must overcome major theoretical and technical hurdles, as well as institutional inertia and strong opposition from some quarters.
Neglectedness
Most of these topics are less neglected than those discussed in the rest of this series, which may indicate they are less promising as a focus for additional research (diminishing marginal returns). However, some of the most important ones still receive relatively little attention, such as indirect effects, extremely poor states, and high-level prioritization across metrics. For instance, a PhD scholarship on states worse than dead at Sheffield University was advertised in 2018 but apparently they didn’t have any suitable applicants, which makes me think there is a dearth of good people who want to work on it.
Health economics in general is a pretty small (but growing) field; I’ve been told by several well-informed researchers that the demand for health economists far outstrips the supply. Most of the research I’ve seen on outcome metrics comes from just a few dozen people—and a high proportion of that is led by a few key individuals at a few institutions. This may suggest that one or two talented people could have considerable impact on the direction of the field as a whole.
Moreover, I’m not sure to what extent diminishing returns applies to some of these projects. As noted above, the existence of research infrastructure, interest, expertise, and previous work can increase the tractability of such efforts. It would not surprise me if the impact of progress on some of these “incremental” reforms were greater than work on more radical ones, in part due to their non-neglectedness.
Conclusions
This post summarized some of the leading debates in the ongoing development of the QALY and DALY, and highlighted some potential avenues for incremental improvement. I conclude by discussing how well the resulting “HALY+” addresses the five core problems outlined in Part 1:
1. They neglect non-health consequences of health interventions
The descriptive system can be expanded to include aspects of life that correlate more closely with subjective wellbeing, such as relationships, emotions, and self-worth. Using “experience-based” weights, or improving respondents’ understanding of the effects of the health states, may also improve the valuation of non-health consequences. Some valuation methods, such as the person tradeoff, encourage a broader perspective, though the limited available evidence suggests these do not generally perform very well.
2. They rely on poorly-informed judgements of the general public
Many states could be valued using the preferences of people with relevant experience (such as patients), though this retains some of the problems with purely hypothetical preferences, and introduces a number of others. Alternatively, responses from the general public could be improved, such as by providing more information on the consequences of the health condition, and/or allowing more deliberation—though these have arguably shown relatively little promise thus far.
3. They fail to acknowledge extreme suffering (and happiness)
General improvements to the classification system and valuation methods would likely go some way to preventing states being over- or under-valued. Specific changes worth investigating include removing the arbitrary lower bound of -1 (and in practice much higher) that’s typically applied to health state values, and giving extra weight to severe states when aggregating HALYs. Much work needs to be done to figure out how bad the worst states really are relative to being maximally healthy, and whether a HALY for everyday use can reasonably be expected to account for them. This seems to be a particularly important, neglected, and somewhat tractable area, and will be discussed further from a wellbeing perspective in Part 4.
4. They are difficult to interpret, capturing some but not all spillover effects
Consequences of a health problem beyond the individual patient can be accounted for through adjustments to the costs in an economic evaluation, or to the way HALYs are aggregated, but in practice these approaches are messy and difficult. As well as better valuing non-health effects on the patient, a HALY with a broader descriptive system could be administered to other individuals affected by the state. Further research is needed to ensure this captures all significant spillovers while avoiding double counting.
5. They are of little use in prioritizing across sectors or cause areas
A better descriptive system would enable a metric to at least be used in social care as well as health, and it may be worth investigating whether it could be stretched to other domains, such as poverty relief. Progress on Problems 2–4 should also assist these efforts. But realistically, any such moves are likely to come at the cost of psychometric performance and (perceived or actual) relevance within healthcare.
The key “selling point” for work on the HALY+ is its tractability. Not only are the technical challenges (in many cases) manageable, but the results are more likely to be taken seriously by important stakeholders outside of the effective altruism movement. That said, some topics have probably already reached steeply diminishing returns, and the relatively narrow impact of a successful effort (compared, for example, to the creation of a universally-accepted WELBY) must be borne in mind.
Thus, as in career decisions more broadly, personal fit is likely to be crucial in deciding whether to go ahead with a project. In most cases, it would help to have a pragmatic attitude, strong quantitative skills, and an understanding of the normative issues at stake.
In the remaining (and much shorter) posts in this series, I will discuss more ambitious efforts based on subjective wellbeing rather than preferences.
Credits

This post is a project of Rethink Priorities. It was written by Derek Foster. Thanks to Jason Schukraft, David Rhys Bernard, Julian Jamison, Paul Frijters, David Moss, Ulf Johannson, Peter Hurford, and Michael Aird for helpful feedback on previous drafts. If you like our work, please consider subscribing to our newsletter. You can see all our work to date here.
Appendix: The person tradeoff
The PTO asks questions of the form:
If there are x people in adverse health situation A and y people in adverse health situation B, and you can only help (cure/save) one group, which group would you choose?
The value of y is varied until the respondent is indifferent between the two options, and x/y is how many times worse B is than A.
This method can be used to compare curing one disease with curing another, saving the lives of one group versus saving another, or curing disease versus saving lives. By anchoring responses to a scale where 0 = dead and 1 = averting the death of a child, it was intended to be used to generate an alternative metric, saved young life equivalents (SAVE) (Nord, 1992). But it can also be used with MAUIs such as the EQ-5D to obtain weights on the regular QALY scale.
Cognitively, the PTO differs from standard QALY valuation techniques in several ways (Ubel et al., 1998):
- It compares conditions in terms of numbers of beneficiaries rather than time (TTO), risk (SG), or the nature of the conditions themselves (VAS).
- It focuses on the benefits of treatment, rather than the (risk of) death or lost health.
- It typically involves consideration of others’ health, not one’s own.
- It involves consideration of whom to treat, potentially including characteristics other than health status.
These features are considered by some to be major advantages over methods to elicit individual self-regarding preferences. By adopting the perspective of the decision-maker, the choices may more closely reflect the context in which the resulting values will be implemented, e.g., by agencies such as NICE or non-profit organizations. They may also incorporate considerations beyond utility maximization, most commonly distributional concerns; for instance, some (but not all) studies have found a preference for prioritizing people with more severe initial health states or younger age (e.g., Petrou et al., 2013; Reckers-Droog, van Exel, & Brouwer, 2019). Qualitative research confirms that respondents take into account non-maximizing principles such as equality of life, especially when choosing between life-saving interventions (Damschroder et al., 2005). At the same time, it’s choice-based, which some claim is a necessary condition for establishing preferences.
However, the PTO has been criticized on the grounds of practicality, reliability, and validity.
Practicality
In the most recent review I could find, Green (2000) concluded:
Current evidence on the acceptability and feasibility of the PTO technique is inconclusive. With the exception of the postal survey by Nord et al. [21], the technique has only been used on small experimental groups, often students with some economics, or health valuation knowledge. Problems with the framing and the context of PTO choices have been highlighted by commentators and a number of studies report findings from a range of alternative approaches. Early studies report that respondents have had difficulty completing the PTO choices. It would seem that respondents often require greater explanation of the task than can be offered through a written survey instrument.
In subsequent studies, Damschroder et al. (2004, 2007) found that at least one version of the PTO could be completed on a computer without sacrificing validity (as can the TTO, SG, and VAS) but that many respondents decline to answer the question. This was usually for one of two reasons:
1) They say that 2 treatment programs have equal value, that curing 100 of X is just as good as curing 100 of Y, even if X is a less serious condition than Y, or 2) they say that the 2 programs are incomparable, that millions of people need to be cured of X to be as good as curing 100 of Y.
Similar issues were experienced in unpublished studies by Rethink Priorities.
Reliability
Reliability is the ability to produce the same value for the same health state across two time points (test-retest reliability), individuals (inter-rater reliability), parts of the same task, or other irrelevant differences (e.g., online versus face-to-face administration). Green’s review found “very little on which to base a judgement over the reliability of the PTO technique”:
Empirical evidence on the reliability of the PTO is virtually non-existent, and does not offer a basis on which the PTO technique can be promoted as a useful operational tool. If reliability is deemed to be important in the elicitation of social preferences, further inquiry into the reliability of the PTO is necessary.
Since then, the few studies to have examined the reliability of PTO have had inconsistent findings, with one suggesting it is poor,[22] one adequate (Pinto-Prades and Abellán‐Perpiñán, 2005), and one uncertain (Robinson, 2011). This may be due, at least in part, to different exercises being used in each case.
Validity
Loosely speaking, validity is the extent to which a measure measures what it’s trying to measure. Unfortunately, the PTO’s apparent lack of theoretical grounding makes it hard to determine what standards to judge it against.
PTO is a choice-based technique; however, it relates to social choice, i.e. choices concerning the welfare of others and the opportunity cost is not directly borne by the individual. Due to the relation between the choice presented within the PTO technique, standard theories of consumer choice can not be applied. Although the technique is seen as intuitively appealing, there are no theoretical underpinnings advocated in the current literature other than psychometric qualities surrounding adjustment or equivalent stimuli. There is support for the potential interval scale properties of the PTO due to the fact that there is a clear and comprehensible meaning to the PTO (where the numbers are specified). Nevertheless, there presently appears to be no formal theoretical support within economics to underpin the PTO technique. It may be that the PTO, due to its social preference perspective, can be linked to the economics literature surrounding the valuation of externalities, but this has not been pursued so far. (Green, 2000)
There have been subsequent attempts to establish conditions in which it would be valid, but these are quite restrictive and seem not to be met in practice (Doctor, Miyamoto, and Bleichrodt, 2010; Østerdal, 2009; Doctor & Miyamoto, 2014). Alan Williams (1999), in a critique of early DALY estimation methods, complained that the PTO muddles valuation of health states and distributional issues: its purported strength makes it hard to interpret.
The PTO also seems highly subject to framing effects and associated “biases.” For example:
- In Ubel, Richardson, and Baron (2002), values were strongly influenced by which question came first, especially when the first exercise required a numerical response. This is likely due, at least in part, to anchoring effects.
- In Dolan & Green (1998), values were different depending on whether respondents were valuing their own state or others’.
- In some framings, respondents tended to give similar priority to treating illnesses of similar severity, even if one produced much greater improvement.
Consequently, many responses must be considered empirically “invalid,” at least using standard criteria such as internal consistency and ability to predict other stated preferences (e.g., TTO, ordinal preferences). For example:
- Schwartzinger et al. (2004) found that responses lack multiplicative transitivity, i.e., “if people consider treatment of 1 in state A to be equivalent to treating 10 in state B, and 1 in state B to be equivalent to 10 in state C, then they should find 1 in state A equivalent to 100 in state C.”
- In Dolan & Tsuchiya (2002), responses from almost all individual respondents lacked cardinal transitivity (i.e., if A is 0.2 higher than B, and B is 0.3 higher than C, then A is 0.5 higher than C), although aggregate responses did satisfy this condition after excluding respondents who failed a test of ordinal transitivity (i.e., if A is better than B, and B better than C, then A is better than C).
Some have also found a strong random element to responses, so even if answers are valid “on average,” studies are likely to require a very large sample size to obtain reasonably precise estimates. While invalid responses occur across all preference elicitation methods, my impression is that they tend to be more severe in the versions of the PTO tested thus far.
So overall the PTO does not seem all that promising, and is unlikely to be adopted by major users of the QALY. However, it may still be under-studied, and the other methods also have their flaws, so it might be worth considering whether a particular version could be the best option in some circumstances—at least for “unofficial” use by private organisations.
References
Aceituno, D., Pennington, M., Iruretagoyena, B., Prina, A. M., & McCrone, P. (2020). Health state utility values in schizophrenia: A systematic review and meta-analysis. Value in Health, 23(9), 1256–1267. https://doi.org/10.1016/j.jval.2020.05.014
Adler, M. D., Dolan, P., & Kavetsos, G. (2017). Would you choose to be happy? Tradeoffs between happiness and the other dimensions of life in a large population survey. Journal of Economic Behavior & Organization, 139, 60–73. https://doi.org/10.1016/j.jebo.2017.05.006
Althaus, D. (2018). Descriptive population ethics and its relevance for cause prioritization. Effective Altruism Forum. https://forum.effectivealtruism.org/posts/CmNBmSf6xtMyYhvcs/descriptive-population-ethics-and-its-relevance-for-cause
Álvarez, B., & Rodríguez-Míguez, E. (2011). Patients’ self-interested preferences: Empirical evidence from a priority setting experiment. Social Science & Medicine, 72(8), 1317–1324. https://doi.org/10.1016/j.socscimed.2011.02.037
Anand, S., & Hanson, K. (1997). Disability-adjusted life years: A critical review. Journal of Health Economics, 16(6), 685–702. https://doi.org/10.1016/S0167-6296(97)00005-2
Baker, R., & Robinson, A. (2004). Responses to standard gambles: Are preferences ‘well constructed’? Health Economics, 13(1), 37–48. https://doi.org/10.1002/hec.795
Bernfort, L., Gerdle, B., Husberg, M., & Levin, L.-Å. (2018). People in states worse than dead according to the EQ-5D UK value set: Would they rather be dead? Quality of Life Research, 27(7), 1827–1833. https://doi.org/10.1007/s11136-018-1848-x
Bradley, R. A., & Terry, M. E. (1952). Rank analysis of incomplete block designs: I. The method of paired comparisons. Biometrika, 39(3/4), 324–345. https://doi.org/10.2307/2334029
Brazier, J., & Deverill, M. (1999). A checklist for judging preference-based measures of health related quality of life: Learning from psychometrics. Health Economics, 8(1), 41–51. https://doi.org/10.1002/(sici)1099-1050(199902)8:1<41::aid-hec395>3.0.co;2-#
Brazier, J. E., Rowen, D., Mavranezouli, I., Tsuchiya, A., Young, T., Yang, Y., Barkham, M., & Ibbotson, R. (2012). Developing and testing methods for deriving preference-based measures of health from condition-specific measures (and other patient-based measures of outcome). Health Technology Assessment (Winchester, England), 16(32), 1–114. https://doi.org/10.3310/hta16320
Brazier, John, Akehurst, R., Brennan, A., Dolan, P., Claxton, K., McCabe, C., Sculpher, M., & Tsuchyia, A. (2005). Should patients have a greater role in valuing health states? Applied Health Economics and Health Policy, 4(4), 201–208. https://doi.org/10.2165/00148365-200504040-00002
Brazier, John, Ara, R., Rowen, D., & Chevrou-Severac, H. (2017). A review of generic preference-based measures for use in cost-effectiveness models. PharmacoEconomics, 35(1), 21–31. https://doi.org/10.1007/s40273-017-0545-x
Brazier, John, & Deverill, M. (1999). A checklist for judging preference-based measures of health related quality of life: Learning from psychometrics. Health Economics, 8(1), 41–51. https://doi.org/10.1002/(SICI)1099-1050(199902)8:1<41::AID-HEC395>3.0.CO;2-#
Brazier, John Edward, Rowen, D., Lloyd, A., & Karimi, M. (2019). Future directions in valuing benefits for estimating QALYs: Is time up for the EQ-5D? Value in Health, 22(1), 62–68. https://doi.org/10.1016/j.jval.2018.12.001
Brazier, John, Green, C., McCabe, C., & Stevens, K. (2003). Use of visual analog scales in economic evaluation. Expert Review of Pharmacoeconomics & Outcomes Research, 3(3), 293–302. https://doi.org/10.1586/14737167.3.3.293
Brazier, John, & McCabe, C. (2007). ‘Is there a case for using visual analogue scale valuations in CUA’ by Parkin and Devlin a response: ‘Yes there is a case, but what does it add to ordinal data?’ Health Economics, 16(6), 645–647. https://doi.org/10.1002/hec.1246
Brazier, John, Ratcliffe, J., Salomon, J., & Tsuchiya, A. (2017). Measuring and valuing health benefits for economic evaluation (2nd edition). Oxford University Press.
Brazier, John, Roberts, J., & Deverill, M. (2002). The estimation of a preference-based measure of health from the SF-36. Journal of Health Economics, 21(2), 271–292. https://doi.org/10.1016/S0167-6296(01)00130-8
Brazier, John, Rowen, D., Karimi, M., Peasgood, T., Tsuchiya, A., & Ratcliffe, J. (2018). Experience-based utility and own health state valuation for a health state classification system: Why and how to do it. The European Journal of Health Economics, 19(6), 881–891. https://doi.org/10.1007/s10198-017-0931-5
Brazier, John, & Tsuchiya, A. (2015). Improving cross-sector comparisons: Going beyond the health-related qaly. Applied Health Economics and Health Policy, 13(6), 557–565. https://doi.org/10.1007/s40258-015-0194-1
Brouwer, W. B. F., Culyer, A. J., van Exel, N. J. A., & Rutten, F. F. H. (2008). Welfarism vs. Extra-welfarism. Journal of Health Economics, 27(2), 325–338. https://doi.org/10.1016/j.jhealeco.2007.07.003
Brown, S. L., Smith, D. M., Schulz, R., Kabeto, M. U., Ubel, P. A., Poulin, M., Yi, J., Kim, C., & Langa, K. M. (2009). Caregiving behavior is associated with decreased mortality risk. Psychological Science, 20(4), 488–494. https://doi.org/10.1111/j.1467-9280.2009.02323.x
Caro, J. J., Brazier, J. E., Karnon, J., Kolominsky-Rabas, P., McGuire, A. J., Nord, E., & Schlander, M. (2019). Determining value in health technology assessment: Stay the course or tack away? PharmacoEconomics, 37(3), 293–299. https://doi.org/10.1007/s40273-018-0742-2
Chen, A., Jacobsen, K. H., Deshmukh, A. A., & Cantor, S. B. (2015). The evolution of the disability-adjusted life year (DALY). Socio-Economic Planning Sciences, 49, 10–15. https://doi.org/10.1016/j.seps.2014.12.002
Cohen, C. A., Colantonio, A., & Vernich, L. (2002). Positive aspects of caregiving: Rounding out the caregiver experience. International Journal of Geriatric Psychiatry, 17(2), 184–188. https://doi.org/10.1002/gps.561
Cubí‐Mollá, P., Jofre‐Bonet, M., & Serra‐Sastre, V. (2017). Adaptation to health states: Sick yet better off? Health Economics, 26(12), 1826–1843. https://doi.org/10.1002/hec.3509
Cubi-Molla, P., Shah, K., & Burström, K. (2018). Experience-based values: A framework for classifying different types of experience in health valuation research. The Patient - Patient-Centered Outcomes Research, 11(3), 253–270. https://doi.org/10.1007/s40271-017-0292-2
Damschroder, L. J., Baron, J., Hershey, J. C., Asch, D. A., Jepson, C., & Ubel, P. A. (2004). The validity of person tradeoff measurements: Randomized trial of computer elicitation versus face-to-face interview. Medical Decision Making, 24(2), 170–180. https://doi.org/10.1177/0272989X04263160
Damschroder, L. J., Roberts, T. R., Goldstein, C. C., Miklosovic, M. E., & Ubel, P. A. (2005). Trading people versus trading time: What is the difference? Population Health Metrics, 3, 10. https://doi.org/10.1186/1478-7954-3-10
Damschroder, L. J., Roberts, T. R., Zikmund-Fisher, B. J., & Ubel, P. A. (2007). Why people refuse to make tradeoffs in person tradeoff elicitations: A matter of perspective? Medical Decision Making, 27(3), 266–280. https://doi.org/10.1177/0272989X07300601
Devlin, N., Buckingham, K., Shah, K., Tsuchiya, A., Tilling, C., Wilkinson, G., & Hout, B. van. (2013). A comparison of alternative variants of the lead and lag time TTO. Health Economics, 22(5), 517–532. https://doi.org/10.1002/hec.2819
Devlin, N. J., Shah, K. K., Feng, Y., Mulhern, B., & Hout, B. van. (2018). Valuing health-related quality of life: An EQ-5D-5L value set for England. Health Economics, 27(1), 7–22. https://doi.org/10.1002/hec.3564
Devlin, N. J., Shah, K. K., Mulhern, B. J., Pantiri, K., & van Hout, B. (2019). A new method for valuing health: Directly eliciting personal utility functions. The European Journal of Health Economics, 20(2), 257–270. https://doi.org/10.1007/s10198-018-0993-z
Doctor, J. N., Miyamoto, J., & Bleichrodt, H. (2009). When are person tradeoffs valid? Journal of Health Economics, 28(5), 1018–1027. https://doi.org/10.1016/j.jhealeco.2009.06.010
Doctor, J. N., & Miyamoto, J. M. (2005). Person tradeoffs and the problem of risk. Expert Review of Pharmacoeconomics & Outcomes Research, 5(6), 677–682. https://doi.org/10.1586/14737167.5.6.677
Dolan, P. (1997). Modeling valuations for EuroQol health states. Medical Care, 35(11), 1095–1108. https://doi.org/10.1097/00005650-199711000-00002
Dolan, P., & Green, C. (1998). Using the person trade-off approach to examine differences between individual and social values. Health Economics, 7(4), 307–312. https://doi.org/10.1002/(sici)1099-1050(199806)7:4<307::aid-hec345>3.0.co;2-n
Dolan, Paul. (2011). Thinking about it: Thoughts about health and valuing QALYs. Health Economics, 20(12), 1407–1416. https://doi.org/10.1002/hec.1679
Dolan, Paul, & Stalmeier, P. (2003). The validity of time trade-off values in calculating QALYs: Constant proportional time trade-off versus the proportional heuristic. Journal of Health Economics, 22(3), 445–458. https://doi.org/10.1016/S0167-6296(02)00120-0
Dolan, Paul, & Tsuchiya, A. (2003). The person trade-off method and the transitivity principle: An example from preferences over age weighting. Health Economics, 12(6), 505–510. https://doi.org/10.1002/hec.731
Drummond, M. F., Sculpher, M. J., Claxton, K., Stoddart, G. L., & Torrance, G. W. (2015). Methods for the economic evaluation of health care programmes (Fourth Edition). Oxford University Press.
Dworkin, R. (1981a). What is equality? Part 1: equality of welfare. Philosophy & Public Affairs, 10(3), 185–246. https://www.jstor.org/stable/2264894
Dworkin, R. (1981b). What is equality? Part 2: equality of resources. Philosophy & Public Affairs, 10(4), 283–345. https://www.jstor.org/stable/2265047
Eyal, N., Hurst, S. A., Murray, C. J. L., Schroeder, S. A., & Wikler, D. (Eds.). (2020). Measuring the Global Burden of Disease: Philosophical Dimensions (1st edition). OUP USA.
Flynn, T. N., Louviere, J. J., Marley, A. A., Coast, J., & Peters, T. J. (2008). Rescaling quality of life values from discrete choice experiments for use as QALYs: A cautionary tale. Population Health Metrics, 6(1), 6. https://doi.org/10.1186/1478-7954-6-6
Gilbert, D. T., & Wilson, T. D. (2000). Miswanting: Some problems in the forecasting of future affective states. In Thinking and feeling: The role of affect in social cognition (pp. 178–197). Cambridge University Press. https://dash.harvard.edu/handle/1/14549983
Glassman, A., Chalkidou, K., Giedion, U., Teerawattananon, Y., Tunis, S., Bump, J. B., & Pichon-Riviere, A. (2012). Priority-setting institutions in health: Recommendations from a center for global development working group. Global Heart, 7(1), 13–34. https://doi.org/10.1016/j.gheart.2012.01.007
Gold, M. (1996). Panel on cost-effectiveness in health and medicine. Medical Care, 34(12), DS197–DS199. https://www.jstor.org/stable/3766373
Green, C., Brazier, J., & Deverill, M. (2000). Valuing health-related quality of life. PharmacoEconomics, 17(2), 151–165. https://doi.org/10.2165/00019053-200017020-00004
Gu, Y., Lancsar, E., Ghijben, P., Butler, J. R., & Donaldson, C. (2015). Attributes and weights in health care priority setting: A systematic review of what counts and to what extent. Social Science & Medicine, 146, 41–52. https://doi.org/10.1016/j.socscimed.2015.10.005
Hausman, D. M. (2012). Health, well-being, and measuring the burden of disease. Population Health Metrics, 10, 13. https://doi.org/10.1186/1478-7954-10-13
Hausman, D. M. (2015). Valuing health: Well-being, freedom, and suffering. Oxford University Press.
Helgesson, G., Ernstsson, O., Åström, M., & Burström, K. (2020). Whom should we ask? A systematic literature review of the arguments regarding the most accurate source of information for valuation of health states. Quality of Life Research, 29(6), 1465–1482. https://doi.org/10.1007/s11136-020-02426-4
Howley, P., & O’Neill, S. (2018). Prevention is better than cure: The legacy effects of ill-health on psychological well-being (SSRN Scholarly Paper ID 3184842). Social Science Research Network. https://doi.org/10.2139/ssrn.3184842
Kahneman, D. (2000). Evaluation by moments: Past and future. In A. Tversky & D. Kahneman (Eds.), Choices, Values, and Frames (pp. 693–708). Cambridge University Press. https://doi.org/10.1017/CBO9780511803475.039
Karimi, M., Brazier, J., & Paisley, S. (2017a). How do individuals value health states? A qualitative investigation. Social Science & Medicine (1982), 172, 80–88. https://doi.org/10.1016/j.socscimed.2016.11.027
Karimi, M., Brazier, J., & Paisley, S. (2017b). Are preferences over health states informed? Health and Quality of Life Outcomes, 15(1), 105. https://doi.org/10.1186/s12955-017-0678-9
Knaul, F. M., Farmer, P. E., Krakauer, E. L., Lima, L. D., Bhadelia, A., Kwete, X. J., Arreola-Ornelas, H., Gómez-Dantés, O., Rodriguez, N. M., Alleyne, G. A. O., Connor, S. R., Hunter, D. J., Lohman, D., Radbruch, L., Madrigal, M. del R. S., Atun, R., Foley, K. M., Frenk, J., Jamison, D. T., … Zimmerman, C. (2018). Alleviating the access abyss in palliative care and pain relief—an imperative of universal health coverage: The Lancet Commission report. The Lancet, 391(10128), 1391–1454. https://doi.org/10.1016/S0140-6736(17)32513-8
Köberlein, J., Beifus, K., Schaffert, C., & Finger, R. P. (2013). The economic burden of visual impairment and blindness: A systematic review. BMJ Open, 3(11), e003471. https://doi.org/10.1136/bmjopen-2013-003471
Krol, M., Papenburg, J., & van Exel, J. (2015). Does including informal care in economic evaluations matter? A systematic review of inclusion and impact of informal care in cost-effectiveness studies. PharmacoEconomics, 33(2), 123–135. https://doi.org/10.1007/s40273-014-0218-y
Lamers, L. M. (2007). The transformation of utilities for health states worse than death: Consequences for the estimation of EQ-5D value sets. Medical Care, 45(3), 238–244. https://www.jstor.org/stable/40221407
Leidl, R., & Reitmeir, P. (2017). An experience-based value set for the EQ-5D-5L in Germany. Value in Health, 20(8), 1150–1156. https://doi.org/10.1016/j.jval.2017.04.019
Litva, A., Coast, J., Donovan, J., Eyles, J., Shepherd, M., Tacchi, J., Abelson, J., & Morgan, K. (2002). ‘The public is too subjective’: Public involvement at different levels of health-care decision making. Social Science & Medicine, 54(12), 1825–1837. https://doi.org/10.1016/S0277-9536(01)00151-4
Lucas, R. E. (2007). Adaptation and the set-point model of subjective well-being: Does happiness change after major life events? Current Directions in Psychological Science, 16(2), 75–79. https://doi.org/10.1111/j.1467-8721.2007.00479.x
Luhmann, M., & Intelisano, S. (2018). Hedonic adaptation and the set point for subjective well-being. In Handbook of wellbeing. DEF Publishers. https://www.nobascholar.com/books/1
Mackenzie, A., & Greenwood, N. (2012). Positive experiences of caregiving in stroke: A systematic review. Disability and Rehabilitation, 34(17), 1413–1422. https://doi.org/10.3109/09638288.2011.650307
McCabe, C., Brazier, J., Gilks, P., Tsuchiya, A., Roberts, J., O’Hagan, A., & Stevens, K. (2006). Using rank data to estimate health state utility models. Journal of Health Economics, 25(3), 418–431. https://doi.org/10.1016/j.jhealeco.2005.07.008
McDonough, C. M., & Tosteson, A. N. A. (2007). Measuring preferences for cost-utility analysis. PharmacoEconomics, 25(2), 93–106. https://doi.org/10.2165/00019053-200725020-00003
McFadden, D. (1973). Conditional logit analysis of qualitative choice behavior. In Frontiers in econometrics. Academic Press.
McTaggart-Cowan, H. (2011). Elicitation of informed general population health state utility values: A review of the literature. Value in Health, 14(8), 1153–1157. https://doi.org/10.1016/j.jval.2011.05.046
McTaggart-Cowan, H. M., O’Cathain, A., Tsuchiya, A., & Brazier, J. E. (2012). Using mixed methods research to explore the effect of an adaptation exercise on general population valuations of health states. Quality of Life Research, 21(3), 465–473. https://doi.org/10.1007/s11136-011-9994-4
Mukuria, C., & Brazier, J. (2013). Valuing the EQ-5D and the SF-6D health states using subjective well-being: A secondary analysis of patient data. Social Science & Medicine, 77, 97–105. https://doi.org/10.1016/j.socscimed.2012.11.012
Mulhern, B. J., Bansback, N., Norman, R., Brazier, J., & SF-6Dv2 International Project Group. (2020). Valuing the SF-6D-v2 classification system in the United Kingdom using a discrete-choice experiment with duration. Medical Care, 58(6), 566–573. https://doi.org/10.1097/MLR.0000000000001324
Murphy, R. P., Boyce, C. J., Dolan, P., & Wood, A. M. (2020). Valuing the Q in QALYs: Does providing patients’ ratings affect population values? Health Psychology, 39(1), 37–45. https://doi.org/10.1037/hea0000806
Murray, C. J. L., & Acharya, A. K. (1997). Understanding DALYs. Journal of Health Economics, 16(6), 703–730. https://doi.org/10.1016/S0167-6296(97)00004-0
Murray, C. J. L., & Evans, D. B. (Eds.). (2003). Health systems performance assessment: Debates, methods and empiricism (1st edition). World Health Organization.
Nicolet, A., Asselt, A. D. I. van, Vermeulen, K. M., & Krabbe, P. F. M. (2020). Value judgment of new medical treatments: Societal and patient perspectives to inform priority setting in The Netherlands. PLOS ONE, 15(7), e0235666. https://doi.org/10.1371/journal.pone.0235666
Nord, E. (1992). An alternative to QALYs: The saved young life equivalent (SAVE). British Medical Journal, 305(6858), 875–877. https://doi.org/10.1136/bmj.305.6858.875
Nord, Erik. (1993). The trade-off between severity of illness and treatment effect in cost-value analysis of health care. Health Policy, 24(3), 227–238. https://doi.org/10.1016/0168-8510(93)90042-N
Nord, Erik. (2005). Concerns for the worse off: Fair innings versus severity. Social Science & Medicine, 60(2), 257–263. https://doi.org/10.1016/j.socscimed.2004.05.003
Oppe, M., Devlin, N. J., van Hout, B., Krabbe, P. F. M., & de Charro, F. (2014). A program of methodological research to arrive at the new international EQ-5D-5L valuation protocol. Value in Health, 17(4), 445–453. https://doi.org/10.1016/j.jval.2014.04.002
Oppe, M., Rand-Hendriksen, K., Shah, K., Ramos‐Goñi, J. M., & Luo, N. (2016). EuroQol protocols for time trade-off valuation of health outcomes. Pharmacoeconomics, 34(10), 993–1004. https://doi.org/10.1007/s40273-016-0404-1
Østerdal, L. P. (2009). The lack of theoretical support for using person trade-offs in QALY-type models. The European Journal of Health Economics, 10(4), 429–436. https://doi.org/10.1007/s10198-009-0150-9
Oswald, A. J., & Powdthavee, N. (2008). Does happiness adapt? A longitudinal study of disability with implications for economists and judges. Journal of Public Economics, 92(5), 1061–1077. https://doi.org/10.1016/j.jpubeco.2008.01.002
Papageorgiou, K., Vermeulen, K. M., Schroevers, M. J., Stiggelbout, A. M., Buskens, E., Krabbe, P. F. M., van den Heuvel, E., & Ranchor, A. V. (2015). Do individuals with and without depression value depression differently? And if so, why? Quality of Life Research, 24(11), 2565–2575. https://doi.org/10.1007/s11136-015-1018-3
Parkin, D., & Devlin, N. (2006). Is there a case for using visual analogue scale valuations in cost-utility analysis? Health Economics, 15(7), 653–664. https://doi.org/10.1002/hec.1086
Patel, V., Saxena, S., Lund, C., Thornicroft, G., Baingana, F., Bolton, P., Chisholm, D., Collins, P. Y., Cooper, J. L., Eaton, J., Herrman, H., Herzallah, M. M., Huang, Y., Jordans, M. J. D., Kleinman, A., Medina-Mora, M. E., Morgan, E., Niaz, U., Omigbodun, O., … UnÜtzer, Jü. (2018). The Lancet Commission on global mental health and sustainable development. The Lancet, 392(10157), 1553–1598. https://doi.org/10.1016/S0140-6736(18)31612-X
Patrick, D. L., Starks, H. E., Cain, K. C., Uhlmann, R. F., & Pearlman, R. A. (1994). Measuring preferences for health states worse than death. Medical Decision Making, 14(1), 9–18. https://doi.org/10.1177/0272989X9401400102
Peasgood, T., Foster, D., & Dolan, P. (2019). Priority setting in healthcare through the lens of happiness. In Global Happiness & Wellbeing Policy Report 2019 (pp. 29–52). Global Council for Happiness and Wellbeing.
Peeters, Y., & Stiggelbout, A. M. (2010). Health state valuations of patients and the general public analytically compared: A meta-analytical comparison of patient and population health state utilities. Value in Health, 13(2), 306–309. https://doi.org/10.1111/j.1524-4733.2009.00610.x
Pinquart, M., & Pfeiffer, J. P. (2011). Psychological well-being in visually impaired and unimpaired individuals: A meta-analysis. British Journal of Visual Impairment, 29(1), 27–45. https://doi.org/10.1177/0264619610389572
Pinto‐Prades, J.-L., & Abellán‐Perpiñán, J.-M. (2005). Measuring the health of populations: The veil of ignorance approach. Health Economics, 14(1), 69–82. https://doi.org/10.1002/hec.887
Powdthavee, N. (2009). What happens to people before and after disability? Focusing effects, lead effects, and adaptation in different areas of life. Social Science & Medicine, 69(12), 1834–1844. https://doi.org/10.1016/j.socscimed.2009.09.023
Pyne, J. M., Fortney, J. C., Tripathi, S., Feeny, D., Ubel, P., & Brazier, J. (2009). How bad is depression? Preference score estimates from depressed patients and the general population. Health Services Research, 44(4), 1406–1423. https://doi.org/10.1111/j.1475-6773.2009.00974.x
Reckers-Droog, V., Exel, J. van, & Brouwer, W. (2019). Equity weights for priority setting in healthcare: Severity, age, or both? Value in Health, 22(12), 1441–1449. https://doi.org/10.1016/j.jval.2019.07.012
Richardson, J. (1994). Cost utility analysis: What should be measured? Social Science & Medicine, 39(1), 7–21. https://doi.org/10.1016/0277-9536(94)90162-7
Richardson, J., McKie, J., & Bariola, E. (2014). Multiattribute utility instruments and their use. In A. J. Culyer (Ed.), Encyclopedia of Health Economics (pp. 341–357). Elsevier. https://doi.org/10.1016/B978-0-12-375678-7.00505-8
Richardson, J. R. J., Hawthorne, G., & Centre for Health Program Evaluation (Australia). (2001). Negative utility scores and evaluating the AQoL all worst health state. Centre for Health Program Evaluation.
Richardson, J, Chen, G., Khan, M. A., & Iezzi, A. (2015). Can multi-attribute utility instruments adequately account for subjective well-being? Medical Decision Making, 35(3), 292–304. https://doi.org/10.1177/0272989X14567354
Richardson, J, Iezzi, A., & Khan, M. A. (2015). Why do multi-attribute utility instruments produce different utilities: The relative importance of the descriptive systems, scale and ‘micro-utility’ effects. Quality of Life Research, 24(8), 2045–2053. https://doi.org/10.1007/s11136-015-0926-6
Richardson, J, Iezzi, A., Khan, M. A., Chen, G., & Maxwell, A. (2016). Measuring the sensitivity and construct validity of 6 utility instruments in 7 disease areas. Medical Decision Making, 36(2), 147–159. https://doi.org/10.1177/0272989X15613522
Robinson, A., Spencer, A., & Moffatt, P. (2015). A framework for estimating health state utility values within a discrete choice experiment: Modeling risky choices. Medical Decision Making, 35(3), 341–350. https://doi.org/10.1177/0272989X14554715
Robinson, S. (2011). Test–retest reliability of health state valuation techniques: The time trade off and person trade off. Health Economics, 20(11), 1379–1391. https://doi.org/10.1002/hec.1677
Roudijk, B., Donders, A. R. T., & Stalmeier, P. F. M. (2020). A head-on ordinal comparison of the composite time trade-off and the better-than-dead method. Value in Health, 23(2), 236–241. https://doi.org/10.1016/j.jval.2019.10.006
Rowen, D., Brazier, J., & Van Hout, B. (2015). A comparison of methods for converting DCE values onto the full health-dead QALY scale. Medical Decision Making, 35(3), 328–340. https://doi.org/10.1177/0272989X14559542
Rowen, D., Mulhern, B., Banerjee, S., Tait, R., Watchurst, C., Smith, S. C., Young, T. A., Knapp, M., & Brazier, J. E. (2015). Comparison of general population, patient, and carer utility values for dementia health states. Medical Decision Making, 35(1), 68–80. https://doi.org/10.1177/0272989X14557178
Ryan, M., Scott, D. A., Reeves, C., Bate, A., van Teijlingen, E. R., Russell, E. M., Napper, M., & Robb, C. M. (2001). Eliciting public preferences for healthcare: A systematic review of techniques. Health Technology Assessment (Winchester, England), 5(5), 1–186. https://doi.org/10.3310/hta5050
Salomon, J. A., Haagsma, J. A., Davis, A., de Noordhout, C. M., Polinder, S., Havelaar, A. H., Cassini, A., Devleesschauwer, B., Kretzschmar, M., Speybroeck, N., Murray, C. J. L., & Vos, T. (2015). Disability weights for the Global Burden of Disease 2013 study. The Lancet Global Health, 3(11), e712–e723. https://doi.org/10.1016/S2214-109X(15)00069-8
Salomon, J. A., Haagsma, J. A., Davis, A., Noordhout, C. M. de, Polinder, S., Havelaar, A. H., Cassini, A., Devleesschauwer, B., Kretzschmar, M., Speybroeck, N., Murray, C. J. L., & Vos, T. (2015). Disability weights for the Global Burden of Disease 2013 study. The Lancet Global Health, 3(11), e712–e723. https://doi.org/10.1016/S2214-109X(15)00069-8
Salomon, J. A., Vos, T., Hogan, D. R., Gagnon, M., Naghavi, M., Mokdad, A., Begum, N., Shah, R., Karyana, M., Kosen, S., Farje, M. R., Moncada, G., Dutta, A., Sazawal, S., Dyer, A., Seiler, J., Aboyans, V., Baker, L., Baxter, A., … Murray, C. J. (2012a). Common values in assessing health outcomes from disease and injury: Disability weights measurement study for the Global Burden of Disease Study 2010. The Lancet, 380(9859), 2129–2143. https://doi.org/10.1016/S0140-6736(12)61680-8
Salomon, J. A., Vos, T., Hogan, D. R., Gagnon, M., Naghavi, M., Mokdad, A., Begum, N., Shah, R., Karyana, M., Kosen, S., Farje, M. R., Moncada, G., Dutta, A., Sazawal, S., Dyer, A., Seiler, J., Aboyans, V., Baker, L., Baxter, A., … Murray, C. J. (2012b). Common values in assessing health outcomes from disease and injury: Disability weights measurement study for the Global Burden of Disease Study 2010. The Lancet, 380(9859), 2129–2143. https://doi.org/10.1016/S0140-6736(12)61680-8
Sánchez‐Iriso, E., Rodríguez, M. E., & Hita, J. M. C. (2019). Valuing health using EQ-5D: The impact of chronic diseases on the stock of health. Health Economics, 28(12), 1402–1417. https://doi.org/10.1002/hec.3952
Schaffer, A., Levitt, A. J., Hershkop, S. K., Oh, P., MacDonald, C., & Lanctot, K. (2002). Utility scores of symptom profiles in major depression. Psychiatry Research, 110(2), 189–197. https://doi.org/10.1016/S0165-1781(02)00097-5
Schwarzinger, M., Lanoë, J.-L., Nord, E., & Durand‐Zaleski, I. (2004). Lack of multiplicative transitivity in person trade-off responses. Health Economics, 13(2), 171–181. https://doi.org/10.1002/hec.808
Sculpher, M., & Palmer, S. (2020). After 20 years of using economic evaluation, should NICE be considered a methods innovator? PharmacoEconomics, 38(3), 247–257. https://doi.org/10.1007/s40273-019-00882-6
Sen, A. (2003). On ethics and economics (Reprinted). Lecture, Oxford. Blackwell.
Sprangers, M. A. G., & Schwartz, C. E. (1999). Integrating response shift into health-related quality of life research: A theoretical model. Social Science & Medicine, 48(11), 1507–1515. https://doi.org/10.1016/S0277-9536(99)00045-3
Thurstone, L. L. (1927). A law of comparative judgment. Psychological Review, 34(4), 273–286. https://doi.org/10.1037/h0070288
Tilling, C., Devlin, N., Tsuchiya, A., & Buckingham, K. (2010). Protocols for time tradeoff valuations of health states worse than dead: A literature review. Medical Decision Making, 30(5), 610–619. https://doi.org/10.1177/0272989X09357475
Tilling, C., Krol, M., Tsuchiya, A., Brazier, J., & Brouwer, W. (2010). In or out? Income losses in health state valuations: a review. Value in Health: The Journal of the International Society for Pharmacoeconomics and Outcomes Research, 13(2), 298--305. https://doi.org/10.1111/j.1524-4733.2009.00614.x
Tilling, C., Kro, M., Tsuchiya, A., Brazier, J., van Exel, J., & Brouwer, W. (2012). Does the EQ-5D reflect lost earnings? PharmacoEconomics, 30(1), 47–61. https://doi.org/10.2165/11539910-000000000-00000
Torrance, G. W. (1986). Measurement of health state utilities for economic appraisal: A review. Journal of Health Economics, 5(1), 1–30. https://doi.org/10.1016/0167-6296(86)90020-2
Ubel, P. A., Loewenstein, G., Scanlon, D., & Kamlet, M. (1998). Value measurement in cost-utility analysis: Explaining the discrepancy between rating scale and person trade-off elicitations. Health Policy, 43(1), 33–44. https://doi.org/10.1016/S0168-8510(97)00077-8
Ubel, P. A., Richardson, J., & Baron, J. (2002). Exploring the role of order effects in person trade-off elicitations. Health Policy, 61(2), 189–199. https://doi.org/10.1016/S0168-8510(01)00238-X
Wailoo, A., Tsuchiya, A., & McCabe, C. (2009). Weighting must wait. PharmacoEconomics, 27(12), 983–989. https://doi.org/10.2165/11314100-000000000-00000
Williams, A. (1997). Intergenerational equity: An exploration of the ‘fair innings’ argument. Health Economics, 6(2), 117–132. https://doi.org/10.1002/(SICI)1099-1050(199703)6:2<117::AID-HEC256>3.0.CO;2-B
Williams, A. (1999). Calculating the global burden of disease: Time for a strategic reappraisal? Health Economics, 8(1), 1–8. https://doi.org/10.1002/(SICI)1099-1050(199902)8:1<1::AID-HEC399>3.0.CO;2-B
Xie, S., Wu, J., He, X., Chen, G., & Brazier, J. E. (2020). Do discrete choice experiments approaches perform better than time trade-off in eliciting health state utilities? Evidence from SF-6Dv2 in China. Value in Health, 23(10), 1391–1399. https://doi.org/10.1016/j.jval.2020.06.010
Yang, Y., Brazier, J., Tsuchiya, A., & Coyne, K. (2009). Estimating a preference-based single index from the Overactive Bladder Questionnaire. Value in Health, 12(1), 159–166. https://doi.org/10.1111/j.1524-4733.2008.00413.x
Young, T. A., Rowen, D., Norquist, J., & Brazier, J. E. (2010). Developing preference-based health measures: Using Rasch analysis to generate health state values. Quality of Life Research, 19(6), 907–917. https://doi.org/10.1007/s11136-010-9646-0
Zhao, Y., Feng, H., Qu, J., Luo, X., Ma, W., & Tian, J. (2018). A systematic review of pharmacoeconomic guidelines. Journal of Medical Economics, 21(1), 85–96. https://doi.org/10.1080/13696998.2017.1387118
Notes
As in Part 1, the key text I draw upon is:
- Brazier, J., Ratcliffe, J., Salomon, J., & Tsuchiya, A. (2017). Measuring and Valuing Health Benefits for Economic Evaluation. Oxford University Press.
Some good review papers covering some of these topics include:
- Brazier, J. E., Rowen, D., Lloyd, A., & Karimi, M. (2019). Future Directions in Valuing Benefits for Estimating QALYs: Is Time Up for the EQ-5D? Value in Health, 22(1), 62–68. https://doi.org/10.1016/j.jval.2018.12.001
- Brazier, J., & Tsuchiya, A. (2015). Improving Cross-Sector Comparisons: Going Beyond the Health-Related QALY. Applied Health Economics and Health Policy, 13(6), 557–565. https://doi.org/10.1007/s40258-015-0194-1
- Caro, J. J., Brazier, J. E., Karnon, J., Kolominsky-Rabas, P., McGuire, A. J., Nord, E., & Schlander, M. (2019). Determining Value in Health Technology Assessment: Stay the Course or Tack Away? PharmacoEconomics, 37(3), 293–299. https://doi.org/10.1007/s40273-018-0742-2
- Chen, A., Jacobsen, K. H., Deshmukh, A. A., & Cantor, S. B. (2015). The evolution of the disability-adjusted life year (DALY). Socio-Economic Planning Sciences, 49, 10–15.https://doi.org/10.1016/j.seps.2014.12.002
- Glassman, A., Chalkidou, K., Giedion, U., Teerawattananon, Y., Tunis, S., Bump, J. B., & Pichon-Riviere, A. (2012). Priority-setting institutions in health: Recommendations from a center for global development working group. Global Heart, 7(1), 13–34. https://doi.org/10.1016/j.gheart.2012.01.007
Anyone who is seriously interested in this field should probably read his critiques, and contrary arguments he cites by John Broome (2002, pp. 91–114). Some philosophical issues around the DALY, including whether health can be measured, are also addressed in a more recent volume:
- Eyal, N., Hurst, S. A., Murray, C. J. L., Schroeder, S. A., & Wikler, D. (Eds.). (2020). Measuring the Global Burden of Disease: Philosophical Dimensions(1st edition). Oxford University Press.
See Part 1 for a brief discussion. For reviews, see for example: Brazier et al., 2017, ch. 7–8; Finch, Brazier, & Mukuria, 2017; Brazier, Ara, Rowen, & Chevrou-Severac, 2017; Richardson et al., 2016; Richardson, Iezzi, et al., 2015; Richardson, Chen et al., 2015; McDonough & Tosteson, 2007. But note that comparison of health state values (weights), including in some of these papers, often fails to distinguish between differences due to the classification system (EQ-5D, SF-6D, etc.) and other factors such as the valuation method (time tradeoff, standard gamble, etc.) and source of values (patients, general public, etc.). ↩︎
Between 2004 and 2010, 63.2% of studies published on the Web of Science database that used a GPBM used the EQ-5D, followed by the Health Utilities Index Mark 3 (9.8%) and the Short Form Six Dimensions (8.8%) (Richardson, McKie, & Bariola, 2014). The reasons for the EQ-5D's dominance are not entirely clear. Brazier et al. (2019) note that its key strengths—brevity, face validity among clinicians, decent psychometric performance in a range of conditions—are shared by some other GPBMs, and claim that "its widespread adoption is likely to be as much to do with the influence of the developers as the science per se." These days, it seems that its "popularity" is self-reinforcing: EQ-5D-based results can be directly compared to many other studies, and are required by agencies such as NICE largely for that reason. ↩︎
See Part 1 or Brouwer et al. (2008) for a discussion of welfarism and extra-welfarism. In short: there is no clear definition of the latter, but extra-welfarists do not only value individual utility, whether defined in terms of preferences (as in modern welfarist economics) or subjective wellbeing (as in classical utilitarianism). Rather, they tend to endorse value pluralism, the view that more than one thing has intrinsic (not just instrumental) value. Many endorse a capabilities approach, in which what matters is the freedom or opportunity to do, be, or have certain things, perhaps including health itself. ↩︎
Note that requiring all the time to be in perfect health would imply a value of minus infinity, which is not accepted as a response due to mathematical intractability: just one response like this would imply a mean value of minus infinity. ↩︎
This presumably explains why an otherwise great metric, the AQoL-8D, has such a high minimum value. It's worth reading their justification, mostly on pages 8–9 of their paper, especially this paragraph:
With the AQoL, the upper value (full health: 1.00) was based upon two considerations, the first theoretical and the second empirical. The theoretical argument arose from a reconsideration of the meaning of 'utility'. While this term has been used by economists in several different ways (Richardson 1994) the general and most useful interpretation is that 'utility' represents the intensity of a person's preferences. With this interpretation the literal meaning of a utility score of -1.00 is that the change in the intensity of a person's preference between a utility of 0.00 and -1.00 is just as great as the change in the intensity between the utility of 1.00 (full health) and the utility of 0.00 (death). For a health state to be equivalent to death — to be sufficiently bad that a person will override their most basic instinct to live — it must be truly awful and certainly close to the limits of a person's endurance. The interval between full health and this terrible health state is correspondingly large. It is simply not plausible that a human being is capable of experiencing an intensity of preference in any meaningful psychological sense that is so great that it could further reduce intensity by the same quantitatively enormous interval. Restating this, it is implausible that there could be a health state so terrible that in any psychological sense it could further reduce the quality of life by a quantum equivalent to the interval between full health and death. This implies that disutilities in the vicinity of -1.00 have, at best, ordinal meaning.
I find this extraordinary. To me, it seems incredibly obvious that some states are much, much worse than being dead (i.e., experiencing nothing). It is also perhaps a little misleading to characterise a "state equivalent to death" as "sufficiently bad that a person will override their most basic instinct to live." Most states worse than dead are temporary, so they do not imply that death would be preferable, just that it would be better to be dead (i.e., not conscious) for their duration (that's why most of the literature uses the term "worse than dead," not "worse than death"). ↩︎
Note that the lead-time TTO is sometimes called the composite TTO (e.g., Roudijk et al., 2020)—though that term also includes the lag-time TTO, in which the extra time in full health is placed after, rather than before, the state being valued. The lead-time TTO is preferred largely because it is less influenced by time preference (Devlin et al., 2013). ↩︎
Originally an identical task was used for states better and worse than dead, with a period in the target state following the period in perfect health in Life A, and no explicit judgement of whether a state was BTD or WTD. However, many of respondents who provided negative values actually believed, when asked directly, that the state was BTD, and vice versa (Devlin et al., 2013). The EQ-VT protocol, like the MVH, therefore establishes whether the respondent considers the state BTD or WTD before presenting him with the appropriate valuation task (Oppe et al., 2014). ↩︎
The reasons for this are unclear; the paper simply notes that some respondents use up all their lead time, and that "[f]urther research will be undertaken to explore methods that might be used to model these 'censored' values." ↩︎
Note that Fig. 4.3 on page 53 of Brazier et al. (2017), which purports to show the task for SWTD, is the same as Fig. 4.2, the task for BTD states. I think 4.3 is an error. ↩︎
Below is a list of all the major generic preference-based measures and their minimum values, with some explanation.
- The UK EQ-5D-3L value set bottoms out at -0.59. As noted above, this is because the analysis rescaled all negative values (some as low as -39) to fit between -1 and 0, on the grounds that it was easier to model and that some respondents may have misunderstood the scale (Dolan, 1997).
- One value set for the newer EQ-5D-5L (Devlin et al., 2018) used the "lead time TTO" (explained above) in combination with discrete choice experiments. The task for states worse than dead mirrored the task for states better than dead, allowing respondents to require up to 10 years in full health as compensation for living 10 years in the target health state. While the form of task is doubtless better, as it is on the same linear scale as for states better than dead, the lowest possible value was still -1, and the aggregate value for the worst state (55555) was just -0.208.
- The first version of the SF-6D had a minimum value of +0.29 (Brazier, Roberts, & Deverill, 2002), based on valuation with the standard gamble. As with the EQ-5D-3L, this was due in part to rescaling responses to -1, with the authors acknowledging this has no theoretical support. A newer version, with a tweaked descriptive system and valued using discrete choice experiments (with duration included, to allow anchoring to 0 and 1), produced a minimum value of -0.574 (Mulhern et al., 2020).
- HUI-3 has a minimum of -0.36, based on the visual analog scale (VAS) transformed into standard gamble.
- The Australian value set for AQoL-8D, based on a visual analog scale transformed into TTO, has a minimum of -0.04. As detailed in a previous footnote, the authors considered any value below -0.25 to be very implausible (Richardson & Hawthorne, 2001). This is particularly disappointing given that it otherwise correlates strongly with SWB (Richardson, Chen, et al., 2015).
From Salomon et al. (2012):
Responses to population health equivalence questions were modelled with censored regression. To anchor the results from the probit regression analysis on the disability weight scale ranging from zero to one, we first ran a linear regression of the probit coefficients from the pooled analysis on disability weight estimates derived from the population health equivalence responses. On the basis of previous empirical evidence indicating that disability weights are well characterised by a logit-normal distribution,94 we undertook the rescaling in logit-transformed space. We then used numerical integration to obtain mean estimates of disability weights on the natural zero-to-one scale. First, we simulated normal random variates on the logit scale with means defined by the rescaled probit coefficients and variance by the standard deviation across survey-specific estimates. Then we transformed each of these simulated values through an inverse-logit function. Finally, we computed the mean across the resulting values for each health state. To estimate uncertainty intervals around the mean disability weights, we drew 1000 bootstrap samples from the pooled dataset and repeated the estimation steps for each sample.
For convenience I'm using patient to describe the person experiencing the state. They may not actually be a patient as such; for instance, a blind person may not be receiving medical care related to their blindness. And of course patients can value states other than their own. That's why the more precise term own-state preferences is used in some of the literature (but even that leaves open the possibility that it's a past state that's being valued). ↩︎
The relevant passage:
A person who has had a life of misfortune, with very limited opportunities, and rather little hope, may be more easily reconciled to deprivations than others reared in more fortunate and affluent circumstances. The metric of happiness may, therefore, distort the extent of deprivation, in a specific and biased way. The hopeless beggar, the precarious landless labourer, the dominated housewife, the hardened unemployed or the overexhausted coolie may all take pleasures in small mercies, and manage to suppress intense suffering for the necessity of continued survival, but it would be ethically deeply mistaken to attach a correspondingly small value to the loss of their well-being because of this survival strategy. ↩︎
That said, most studies have found that income considerations have little effect on health state values (Tilling et al., 2010; Tilling et al., 2012). ↩︎
It may not be a total coincidence: the features of the most visible or vividly imaginable conditions (loss of mobility, sight, etc.) may relate somewhat predictably to effects on others. ↩︎
These are presented roughly as in Brazier et al. (2017, ch. 10). There are other ways of categorizing normative considerations. ↩︎
This was one justification for the age weighting in some early forms of the DALY (Murray & Acharya, 1997; for a critique, see Anand & Hanson, 1997), and also influenced GiveWell's moral weights. ↩︎
This is according to registries of QALY- and DALY-based analyses maintained by Tufts Medical Center. ↩︎
A report for the Centre for Global Development claimed:
Global-level attempts to support priority setting have been undertaken for at least 3 decades, but these efforts have tended to focus on only a few aspects of priority setting, such as gathering evidence or creating methods, and have yet to result in broad improvements via more systematic decision making in LMIC (Glassman et al., 2012). ↩︎
Unfortunately, I don't recall which paper this was, and haven't been able to find it again within a reasonable time period. If anyone knows what it might be, please get in touch. ↩︎
Hey Derek, once again a great post!
You might not know this, but the EA forum allows you to store a sequence of posts into an ordered sequence. If you go to https://forum.effectivealtruism.org/sequences you can see all the other sequences. When you click on the button on the right:
you can create your own sequence. Once you click on it you will be asked to write a short introduction and add a banner and card image. I haven't written any sequences, but as you can see I have designed most of them. I'm sure you can write a good introduction, but if you want a snazzy card image and banner, I've made some for you:
Here's how it will look among the other sequence cards:
Hope you like them.
Done: https://forum.effectivealtruism.org/s/2nMw7ASQNQ35iAz4T
Thanks Bob! I will probably do this after publishing the next post.