Sequence contents
- Background on QALYs and DALYs
- The HALY+: Improving preference-based health metrics
- The sHALY: Developing subjective wellbeing-based health metrics
- The WELBY (i): Measuring states worse than dead
- The WELBY (ii): Establishing cardinality
- The WELBY (iii): Capturing spillover effects
- The WELBY (iv): Other measurement challenges
- Applications in effective altruism
- Applications outside effective altruism
- Conclusions
Key takeaways from Part 3
- The sHALY (subjective wellbeing-based health-adjusted life-year) describes health states using a conventional QALY or DALY classification system, or ideally a broader “HALY+” system described in Part 2. But it assigns values (“weights”) to those states according to their effect on life satisfaction and/or hedonic wellbeing.
- This helps avoid some problems with hypothetical preferences, such as the difficulty of imagining what it’s like to be in a different health state and the neglect of non-health consequences of health conditions.
- For the QALY, preliminary SWB weights exist for the EQ-5D-3L, SF-6D, and ICECAP (a measure of “capabilities”), but more research is needed to construct a robust metric.
- It seems that no efforts have been made towards a SWB-weighted DALY. Ideally this would be based on panel data from a massive international study, but alternatives include a smaller cross-sectional study, extracting data from clinical trials, and mapping from a SWB-based QALY.
- All forms of sHALY pose significant (but not insurmountable) technical and logistical challenges, and arguably presuppose solutions to general issues in the measurement of wellbeing, such as establishing a “dead point” (below which are states worse than dead) on relevant scales.
- The development of a sHALY would open up major opportunities such as a wellbeing-based Global Burden of Disease study, as well as SWB-focused cost-effectiveness analyses. This could lead to a radical shift in healthcare resources towards mental health, but it would also enable better prioritization within physical health.
- However, the impact of a sHALY is partly contingent on its acceptance by stakeholders, especially decision-making bodies like the Institute for Health Metrics & Evaluation and the UK's National Institute for Health & Care Excellence, which are currently very resistant to a wellbeing approach.
- Nevertheless, this appears to be a very neglected, reasonably tractable, and potentially important topic that is worthy of serious consideration by individuals with a good personal fit, and by large non-profits that can avoid the constraints faced by public institutions.
Introduction to Part 3
This is the third in a sequence of posts on the measurement of health and wellbeing. Part 1 reviewed the structure, descriptive system, valuation methods, application, and interpretation of the most common health-adjusted life-years (HALYs), namely the quality-adjusted life-year (QALY) and disability-adjusted life-year (DALY), and highlighted five problems with them:
- They neglect non-health consequences of health interventions.
- They rely on poorly-informed judgements of the general public.
- They fail to acknowledge extreme suffering (and happiness).
- They are difficult to interpret, capturing some but not all externalities.
- They are of little use in prioritizing across sectors or cause areas.
Part 2 examined ways in which these shortcomings could be (partially) addressed through relatively modest, incremental improvements to those metrics, resulting in what I call a HALY+. This increases correlation with subjective wellbeing (SWB), which is arguably what matters most, by adding psychosocial dimensions to the descriptive system and/or by using valuation methods that better capture the experiences of those most affected by the health state. However, as well as being limited to health and social care, it still relies on stated preference exercises, which are subject to serious biases.
This (much shorter) post therefore presents another alternative: the “subjective wellbeing-based HALY.” The sHALY uses the descriptive system of the HALY+ (or, less ambitiously, the original QALY or DALY), but values the health states using SWB.
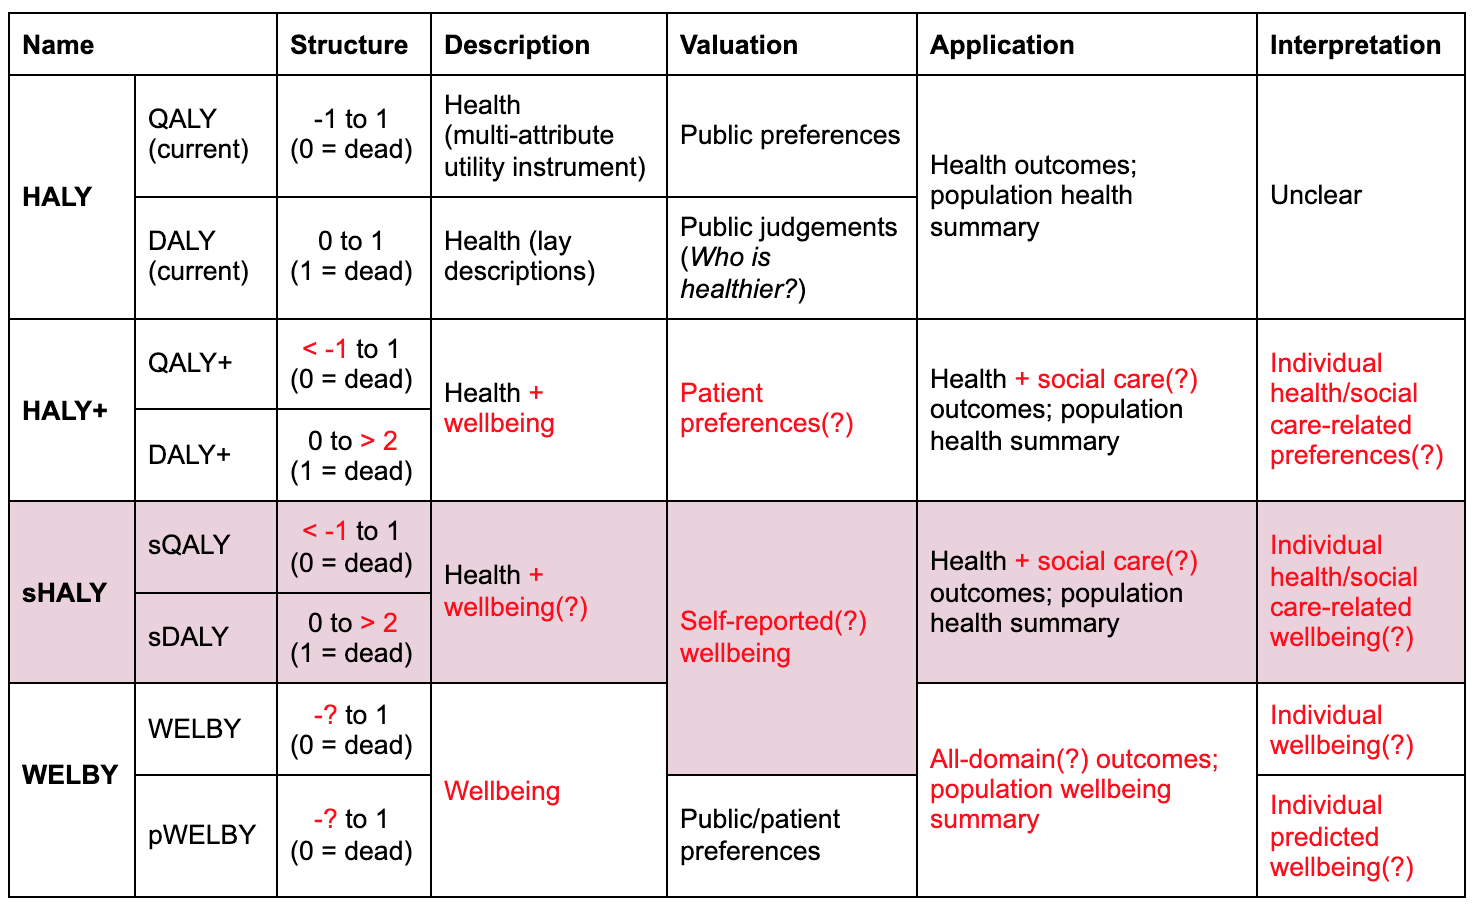
HALYs and their alternatives. Red text indicates departures from current practice. Question marks indicate optional or uncertain features.
I begin by explaining why this approach may be preferable to current metrics and to the HALY+, summarize previous attempts at creating a SWB-weighted QALY (sQALY), and list the steps needed to construct a better version. I then outline several possible ways of obtaining weights for the sDALY, explaining some of the advantages and disadvantages of each. I conclude with a brief assessment of the importance, tractability, and neglectedness of work on the sHALY relative to the HALY+ and wellbeing-adjusted life-year (WELBY), and a summary of how well it addresses the five central problems listed above.
Why should we consider working on the sHALY?
This section mostly recaps background information from Parts 1 and 2, and Chapter 3 of the Global Happiness & Wellbeing Policy Report (Peasgood, Foster, & Dolan, 2019)[1]—feel free to skip it if you’ve read any of those recently.
As explained in Part 1, estimating QALYs typically involves both description and valuation of health states. The states are usually described using generic classification systems that can be applied to a broad range of conditions. For example, the widely-used EQ-5D-3L defines health in terms of mobility, self-care, ability to perform one’s usual activities, pain/discomfort, and depression/anxiety, each of which has three levels of severity. The relative values or “weights” for these domains (and levels within domains) are then derived from people’s preferences over different lives described by the domains. The time tradeoff, for instance, asks respondents how many years in full health (11111 on the EQ-5D) they consider to be equivalent to a longer period with moderate pain or discomfort and some problems walking about (21121): the fewer the number of years in full health, the worse the health state. There are value sets for the EQ-5D (and many other instruments) based on responses to these questions, which are now being used as the measure of benefit in healthcare assessment in many countries (Rowen, Zouraq, Chevrou-Severac, & Hout, 2017).
In low- and middle-income countries (LMICs), the disability-adjusted life-year (DALY) is used more frequently than the QALY, both as a measure of benefit in cost-effectiveness analyses (CEAs) and to quantify the overall burden of diseases, injuries and risk factors. A DALY attaches a disability weight to a year lived in a health state where 0 represents full health and 1 represents death, so it can be loosely thought of as the inverse of a QALY (though in practice they are not quite equivalent: Augustovski, 2018 and Maertens de Noordhout et al., 2017). To generate these weights, members of the public are presented with examples of two hypothetical people in different health states, briefly described in lay terms. For example, a person with severe anemia “feels very weak, tired and short of breath, and has problems with activities that require physical effort or deep concentration”, while someone with profound hearing loss “is unable to hear and understand another person talking, even in a quiet place, is unable to take part in a phone conversation, and has great difficulty hearing anything in any other situation. Difficulties with communicating and relating to others often cause worry, depression, and loneliness.” (The name of the health state is not usually stated in the exercise.) Respondents are then asked: “Who do you think is healthier overall, the first person or the second person?” In the 2019 Global Burden of Disease study (GBD 2019) there are approximately 440 such states, about half of which are unique (i.e., not combinations of other states).[2]
One drawback of these HALYs is that they focus narrowly on health domains, when health is not the only thing that matters. As well as failing to value many important consequences of health conditions on the patient (e.g., for relationships, work, and hobbies; Problem 1 in my list), this contributes to difficulties quantifying effects beyond the patient (e.g., on carers and the wider community; Problem 4), and hinders comparison across sectors or cause areas (e.g., healthcare versus social care versus education; Problem 5). As explained in Part 2, these problems can be addressed to some extent by expanding the descriptive system to include psychosocial dimensions that correlate strongly with subjective wellbeing, as done by the E-QALY project. Since the sHALY can be based on any descriptive system, I won’t say much in this post about the choice of instrument, except to reiterate that it has a large effect on the resulting weights.
Another major concern, explained in more detail in Parts 1 and 2, is that the weights normally rely on the poorly-informed preferences of the general public (Problem 2). As a general rule, people think physical health changes will have a much bigger effect on their wellbeing than in fact they do, while underestimating the impact of at least some mental health conditions. Assuming that SWB (or something close to it) matters more than hypothetical preferences, this leads to a major distortion of priorities. For instance, many people with lives considered “worse than dead” according to the EQ-5D-3L report being reasonably happy (Bernfort et al., 2018), yet extending their lives would be considered to have negative value in a CEA. Meanwhile, some states that are much worse than dead are not properly recognised as such (Problem 3), and treatment for depression and anxiety is given a far smaller share of the resources than it warrants from a wellbeing perspective.
One “HALY+” response to this is to consider using “experience-based” preferences. Generally, this entails asking patients to value their current state—though “experience” can take many forms, including having been in that state previously or being a carer for someone with the condition (Cubí-Mollá, Shah, & Burström, 2018). However, as noted in Part 2, this has many serious drawbacks, and responses are vulnerable to many of the same biases as general population preferences; for instance, respondents still have to imagine other states (“full health” and “being dead”), and may still focus excessively on their health rather than other aspects of their lives while forming responses (Dolan & Kahneman, 2008). “Intermediate” approaches, like providing the general public with more information about the state and allowing more time for deliberation, are worth exploring further but do not fully overcome these problems (McTaggart-Cowen, 2011).
Thus, there is a strong prima facie case for the sHALY; that is, weighting health states according to the effect they tend to have on the SWB of people experiencing those states. This could be based on any self-reported SWB measure—an evaluative one, such as life satisfaction; an assessment of hedonic states, such as questions about happiness and anxiety; or some weighted combination. In principle, it could also use more “objective” data on SWB, such as cortisol levels, though these currently seem less valid than self-reports (Diener, Lucas, & Oishi, 2018). The choice of measure matters (Dolan, Kudrna, & Stone, 2017) so both the practical and theoretical case for each option in this context is one potential area of fruitful research. But for the purpose of this post, I’ll remain agnostic about the best measure, and assume a suitable one exists or can be developed.
The sHALY also presupposes solutions to significant challenges with using SWB scales to value HALYs, such as establishing a place on the scale equivalent to being dead (Part 4), mapping between the wellbeing measure and the HALY scale (Part 5), and capturing spillover effects (Part 6)—though arguably there’s enough evidence on those to construct a preliminary sHALY already.
Completing this project would open up a number of possibilities, including a GBD study showing which health problems cause the most unhappiness around the world, a revised list of disease control priorities, or comparing a smaller selection of candidate interventions in terms of their impact on wellbeing (see Parts 8 and 9).
Reweighting the QALY with SWB
This section outlines previous studies that gathered information relevant to generating SWB-based QALY weights, and suggests some next steps.
Existing research
I’m aware of four studies designed to obtain SWB weights for multi-attribute utility instruments (MAUIs) commonly used to generate preference-based QALYs. Two reweight the EQ-5D-3L, one the SF-6D (version 1), and one both of those measures. A more recent study did something similar for the Investigating Choice Experiments CAPability measure for Adults (ICECAP-A) and the equivalent for older people (ICECAP-O). As the names suggest, these are based on the capabilities approach and hence reflect an “objective list” notion of wellbeing. While they do not result in QALYs as such, and are not normally used to evaluate health interventions, they do play a roughly analogous role in social care, so they seem relevant to the present discussion. All five papers are summarized in the table below.
 Studies that obtained SWB-based values for classification systems used in health and social care. See here for a copy of the table with functioning hyperlinks.
The Appendix contains more detail about each paper. In brief:
- The four cross-sectional studies (A, B, C, E) asked respondents both to report their SWB and to complete the relevant health/capability questionnaire at a single time point. The association between SWB and each level of each dimension of the classification system was estimated using standard regression methods, controlling for demographic variables and other potential confounders.
- The longitudinal study (C) followed the same people over time, recording both health status and SWB at each time point. This helps avoid some drawbacks with cross-sectional studies, particularly issues with reverse causality: SWB can affect health as well as the other way around, so knowing which changed first can make the data easier to interpret.
- By assuming the cardinality (interval scale properties) of the SWB measures, they generated values on a 0–1 scale resembling QALY weights—though one study (D) also presented results that assumed only ordinality.
- All of them took zero as the lower bound, precluding states worse than dead, because there is no unambiguous dead point on wellbeing scales. This makes it impossible to make direct comparisons to preference-based weights, though overall patterns can still be identified.
The results were generally, though not entirely, unsurprising:
- In all cases, and in contrast to the corresponding preference-based value sets, SWB weights were highest for dimensions related to mental wellbeing.
- All studies found a positive association with some physical limitations (e.g., mobility problems seem to make you happier), but these were generally not statistically significant and are probably a statistical artifact.
- Findings for pain were somewhat inconsistent, but overall it seems less important that I would have expected—though by global standards I suspect these studies (most of which were done in high-income countries) understate the SWB loss from pain, since respondents were presumably not enduring the severe, untreated pain that is common in low-resource settings (Knaul et al., 2018).
- The choice of SWB instrument seems fairly important: compared to measures of affect (emotions; hedonic states; “happiness”), life satisfaction weights were higher for physical and social functioning, though only one study (B) compared them directly.
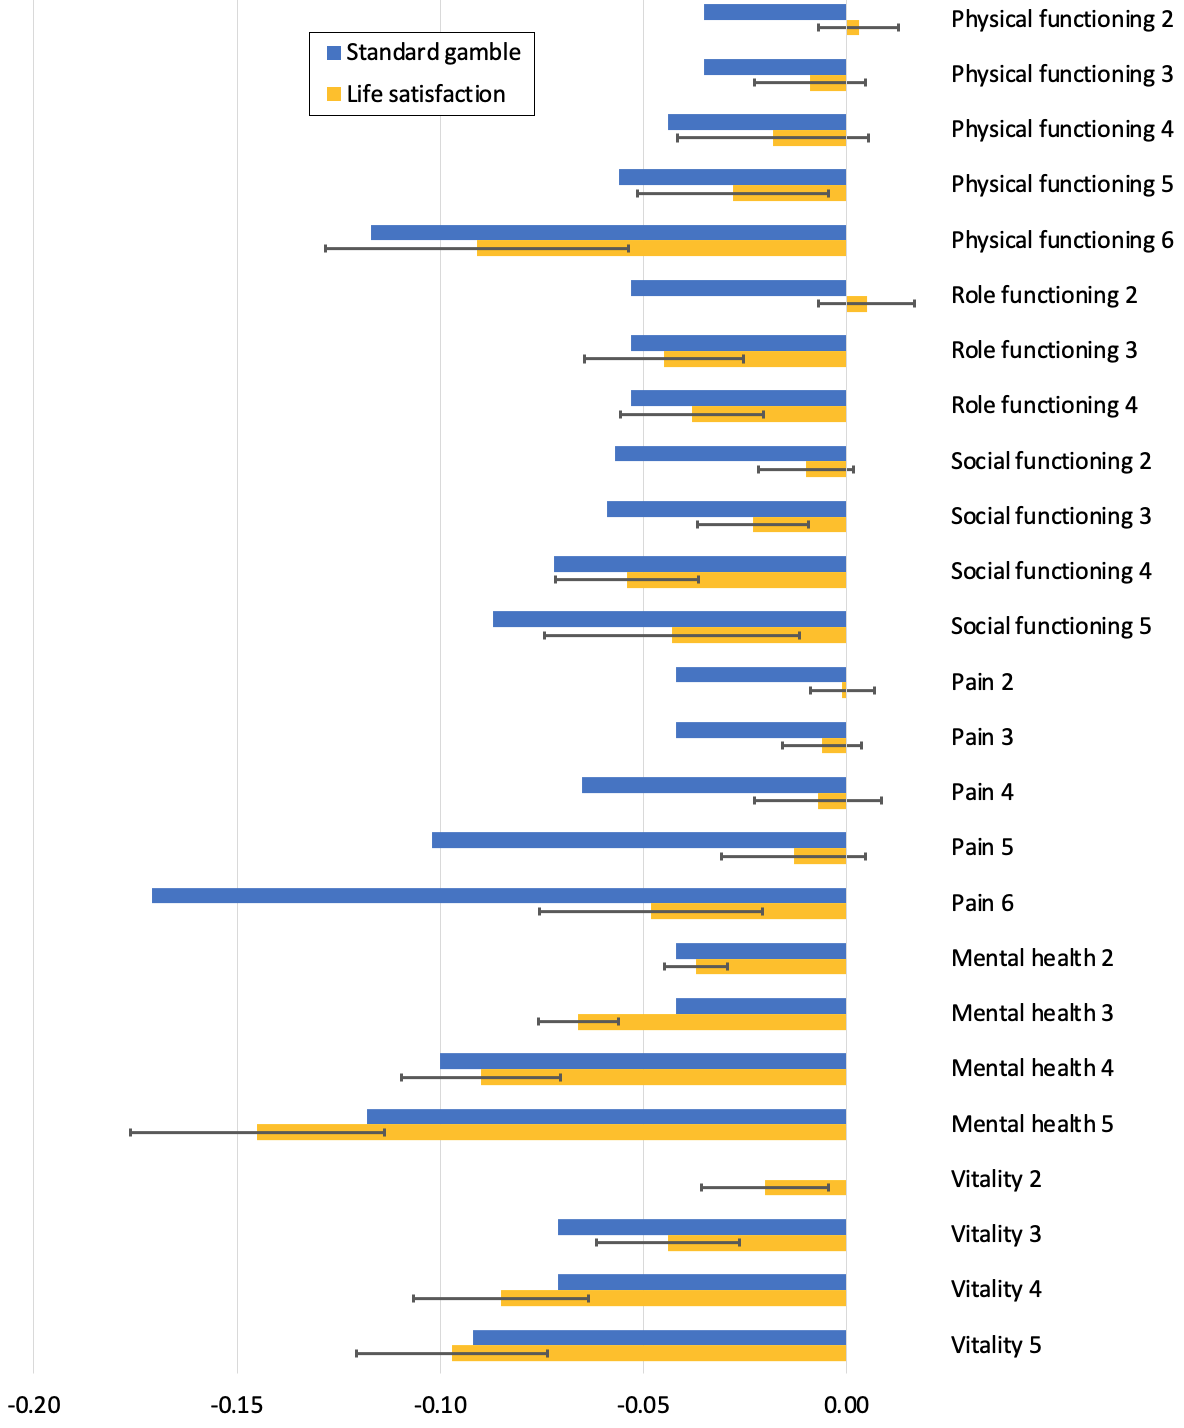
The chart below shows the main findings from Dolan, Lee, and Peasgood (2012). Arguably, this is the most methodologically sound study due to the use of panel data, so it might be the best “default” source of preliminary sQALY weights. However, I haven’t examined it in depth and it still has a number of clear limitations (most of which are shared by the other studies), e.g.:
- Most weights are imprecise, and some are not statistically different from zero.
- Some dimensions violate monotonicity (i.e., higher levels do not always have lower weights).
- It doesn’t recognize states worse than dead.
- A single-item life satisfaction instrument was the only SWB measure.
- Direct comparison of hedonic and evaluative measures, and/or an average of multiple measures, would be informative and mitigate some kinds of error.
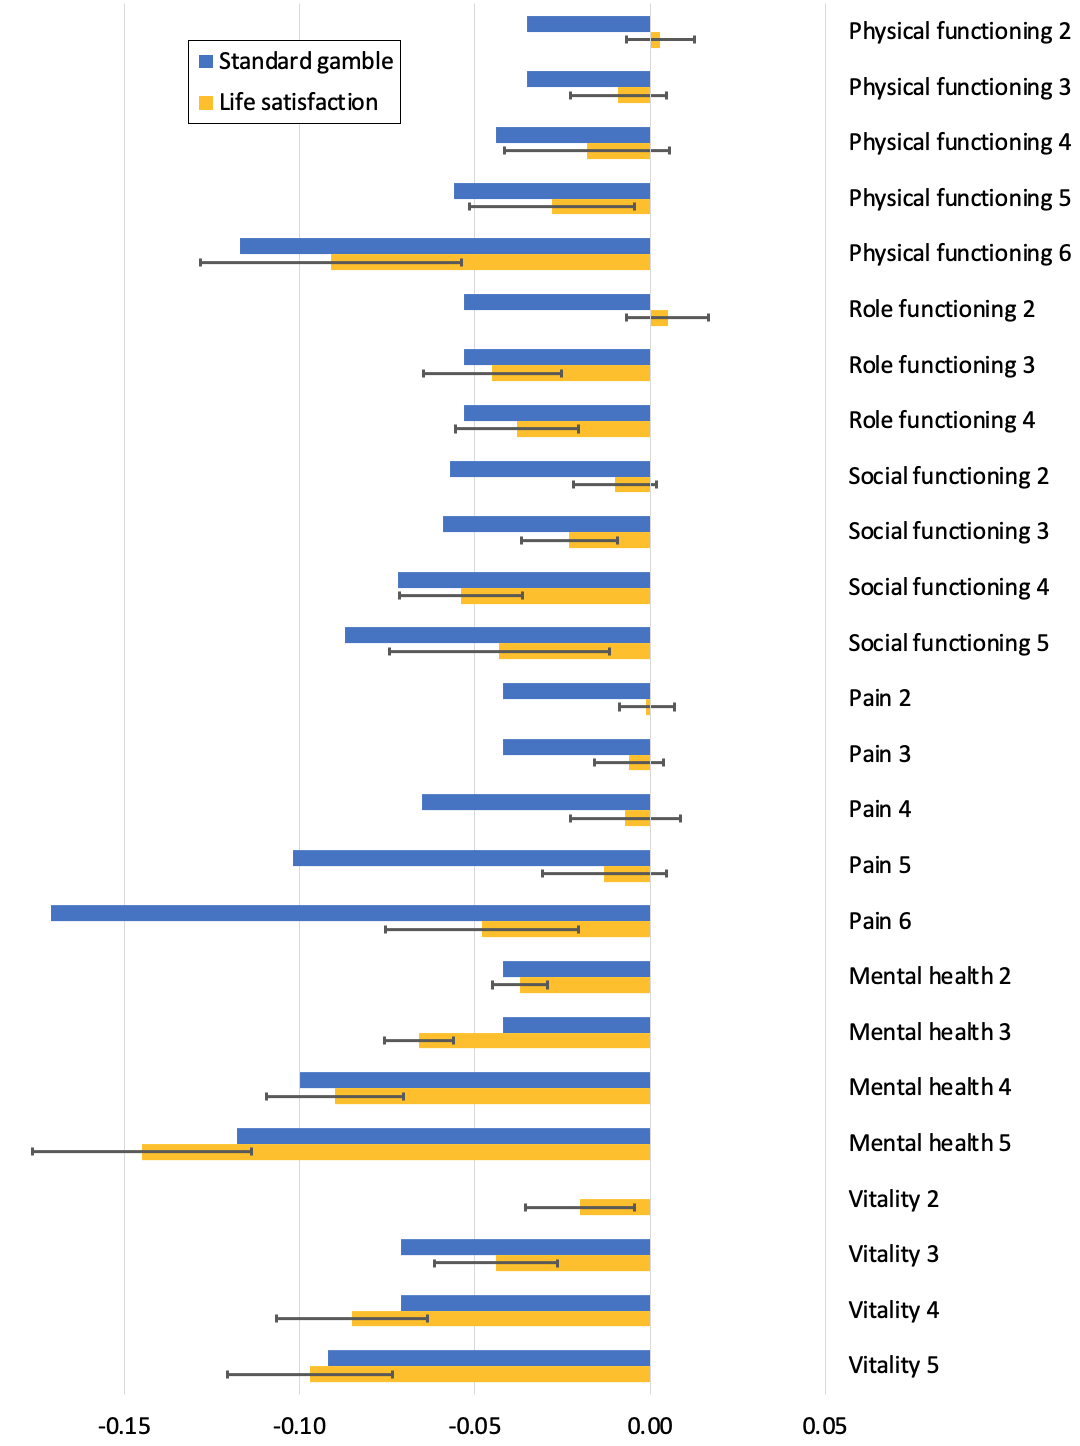
Life satisfaction and standard gamble (preference) “weights” for the SF-6D-v1 in Dolan, Lee, and Peasgood (2012). (“Vitality” is about energy/tiredness.) Error bars represent 95% confidence intervals. Original spreadsheet available here.
Further research
It may be possible to create a preliminary, “proof-of-concept” sQALY using existing data plus some shaky assumptions:
- Choose the best study from those summarized above.
- Consider using a weighted average of multiple studies and/or multiple wellbeing scales.
- Figure out what to do about positive, non-significant, and non-monotonic values. (This will require some “common sense” adjustments.)
- E.g. for Dolan, Lee, and Peasgood (2012; see chart above):
- Level 2 of physical functioning and role functioning could be zero (or maybe half of level 3).
- The values for levels 3 and 4 of role functioning, and levels 5 and 6 of social functioning, could swap places (to achieve monotonicity).
- For all others, use the point estimates.
- E.g. for Dolan, Lee, and Peasgood (2012; see chart above):
- Choose a dead point on the relevant wellbeing scale(s).
- As noted in Part 4, a reasonable default is perhaps about 2/10, though this is highly uncertain, and does not allow the worst states to be captured (minimum QALY value = -0.2).
But clearly that involves some very hard-to-justify assumptions, so much more research is needed to generate a robust sQALY. The process for doing so could look something like this:
- Confirm that the sQALY would actually get used in priority-setting projects (otherwise there’s no point doing this work).
- See Parts 8 and 9 for potential applications, e.g., a new GBD or cost-effectiveness analyses of candidate interventions.
- See Part 2 on involving key stakeholders and key objections that need to be addressed.
- Analyze existing studies in more depth, to see what lessons can be learned for future studies.
- How can we overcome their limitations?
- Choose a health state classification system—most likely a generic MAUI.
- The EQ-5D is the worst in many ways, but is by far the most popular (so a lot of studies could be re-analyzed using SWB weights).
- It might make sense to use the 5L version, as that is starting to replace the 3L and has better psychometric performance—although so far there have been more studies using the 3L.
- The SF-6D is generally a better system (as it includes more dimensions related to mental health) but has not been used as widely.
- Again, the new version (Mulhern et al., 2020) is an improvement over the first, but it hasn't been used much yet.
- The E-QALY could be a very good option in theory, but as it’s still under development there would be no opportunity to re-analyze past studies, and it may never become widely-used.
- See Part 2 for more comparison of MAUIs.
- The EQ-5D is the worst in many ways, but is by far the most popular (so a lot of studies could be re-analyzed using SWB weights).
- Decide which component(s) of SWB to measure.
- I don’t see any reason not to get data on both life satisfaction and affect.
- The final measure could use one of these or a weighted average, depending on normative considerations and psychometric performance.
- For affect, decide which elements to focus on (and how to weight them): Happiness? A sense of meaning? Physical pain? Irritability? Pride? Alertness? Anxiety?
- This is mostly a normative issue, but could involve consultation with stakeholders such as patients.
- I don’t see any reason not to get data on both life satisfaction and affect.
- Choose the most suitable wellbeing questionnaire(s) for this purpose.
- It may be best to take a weighted average of multiple measures, to mitigate any shortcomings with a single instrument, such as insensitivity to certain changes in health status.
- For similar reasons, multi-item measures (e.g., Satisfaction With Life Scale; Positive & Negative Affect Schedule) may perform better than single-item measures (e.g., Cantril’s Ladder; 0–10 happiness), although shorter measures are generally easier to administer in large surveys.
- If possible, figure out how to overcome any validity concerns, e.g., response shift (Sprangers & Schwartz, 1999).
- Establish the dead point on relevant wellbeing scales, and figure out how to properly value the most extreme states.
- This is potentially quite a big project in itself, and there will likely remain high uncertainty, but any sensible option is likely to be better than current approaches.
- This is discussed further in Part 4.
- Decide how to map between the SWB and QALY scales.
- Some studies suggest it makes little difference whether ordinality or cardinality is assumed for wellbeing scales; that is, moving from 1 to 2 seems to represent about the same change in wellbeing as from 5 to 6 or 9 to 10.
- A QALY scale is also cardinal by stipulation: moving from 0.1 to 0.2, or 0.9 to 1, for a year both represent one tenth of a year of healthy life.
- So for the sQALY, it’s natural to assume a linear relationship between wellbeing and QALYs, e.g., with a dead point of 2/10 on the wellbeing scale, moving from 2 to 4, or from 8 to 10, for a year is worth a quarter of a sQALY.
- But there is preliminary evidence that most people reject this assumption (Peasgood et al., 2019).[3] In particular, they are willing to give up more life expectancy to gain life satisfaction nearer the bottom of the scale, suggesting prioritarian-like preferences (at least with regard to their own lives) and/or a non-cardinal interpretation of the wellbeing scale.[4]
- What to do about this is discussed in Part 5.
- Figure out how best to measure spillover effects of health states/interventions, such as carer burden and income loss.
- Options include valuing effects in monetary terms (e.g., using willingness-to-pay studies), administering the same outcome measure to others who may be affected (e.g., family), and making post hoc adjustments at the aggregation stage (e.g., giving extra weight to QALYs that are likely to affect others).
- Some wellbeing measures and health state classification systems may capture more spillovers than others, so it would be ideal to consider this when selecting the measures.
- Related issues are discussed in Parts 2 and 6.
- Carry out empirical studies to obtain the SWB weights (i.e., better versions of the studies described above).
- Ideally they would be:
- Longitudinal (collecting panel data), to help establish causality.
- Very big, to reduce sampling error (i.e., to get more precise weights, especially for rare/severe states).
- Multinational, to generate a single global value set and/or several local/regional ones.
- See the sDALY section below for further comparison of surveys.
- Ideally they would be:
- Make post hoc adjustments as necessary.
-
Stakeholders may reject pure SWB weights for normative reasons. For instance, there could be an overwhelming demand to assign some value to the alleviation of mild physical disabilities and cognitive impairments that don't affect SWB. It may be desirable to make such amendments in order to gain support for a general focus on SWB, or because moral uncertainty demands that we give some weight to other accounts of wellbeing.
-
There may be issues with measurement and/or analysis. For example:
- The measure may lack construct validity (i.e., the health state causes changes to actual SWB, but these are not captured by the responses). For instance, people may not factor in occasional headaches, nausea, or a sense of purpose when responding to questions about "happiness," even if the intention is to capture all hedonic states.
- The measure may be perfectly valid but the effect not statistically significant due to high variance and/or small sample sizes for certain states. For instance, mild pain surely has some effect on SWB but the confidence interval may cross zero in all but the largest studies. For some states (severe dementia, psychosis, etc.) it could be hard to get self-reports at all.
- There may be systematic biases. For instance, the SWB decrements for "extreme" problems with pain and mental health are likely to be underestimated due to selection effects: people in the most severe states are unable to respond to surveys.
- A real effect may not be identified, or the magnitude/direction misreported, due to statistical artifacts. In the studies reported above, for instance, it would be wrong to conclude that mild physical health problems increase SWB.
In such cases, it seems reasonable to adjust the effect sizes based on external data—using different measures, different respondents (e.g., patients' family), larger samples, qualitative feedback, etc.—plus theory/common sense.
-
Reweighting the DALY with SWB
About 90% of the global burden of disease is borne by individuals in low- and middle-income countries, and it looks like most research in those places will continue to use the DALY for the foreseeable future. Thus, it may be more impactful to create SWB weights for the DALY (though see Part 2 for possible reasons to prefer work on the QALY). To my knowledge, nobody has attempted to do this.
The overall process could largely mirror that suggested for the sQALY in the previous section, so I won’t repeat all the steps here. But due to the more complex descriptive system—including about 230 unique health states, each of which has its own description and disability weight—obtaining a new value set is likely to be more challenging.
Potential approaches to the main empirical work (roughly corresponding to step 9 above) include:
- A very large panel study collecting data on SWB and DALY health states.
- A large cross-sectional study doing the same (and/or the extraction of this data from existing studies).
- Mapping from a sQALY.
These options, including some advantages and disadvantages of each, are outlined below, but I would welcome further suggestions.
(a) Massive panel study
Select a representative sample of the general public, ideally in a large number of countries representing various world regions/cultures/income levels, and follow them for several years. At regular intervals, ask them to record both their SWB and their health status in terms of the DALY health states. Weights are derived from the change in SWB after gaining a health state.
It may not be realistic to do this directly for all weights—presumably respondents won’t read through the descriptions for all ~230 unique health states and indicate which apply to them—but there may be ways to simplify the process. For instance:
- They could be asked about a subset of health states, representing different types of condition and severity levels, and statistical modelling could predict values for the remaining states.
- They could be asked about their health more generally rather than specific health states. For example, the US Medical Expenditure Panel Survey allows respondents to enter free text describing their health problems, and these can be mapped to International Classification of Diseases and Related Problems codes (as was done in Burnstein et al., 2015). Since the GBD cause hierarchy is partly based on these codes, it should thereby be possible to get “weights” for causes at level 4 (e.g., dysthymia, major depressive disorder) or level 3 (e.g., depressive disorders). This would not permit the granular analyses—including cost-effectiveness analyses—enabled by weights for the health states (level 6), which represent different severity levels with different functional consequences. But it should allow us to compare the total burden of disease (in terms of SWB) associated with, for example, schizophrenia versus anxiety disorders (level 3), mental disorders versus cardiovascular diseases (level 2), or injuries versus non-communicable diseases (level 1).[5]
Pros
- Compared to a cross-sectional study, this is less prone to reverse causation (low SWB causing poor health).
- Proof-of-concept has been established for the QALY by Dolan, Lee, and Peasgood (2012), albeit on a smaller scale and using pre-existing datasets.
Cons
- Expensive and time-consuming, unless the questions can be tagged onto another study. Some suggest a sample size of about 150 per health state for EQ-5D-3L valuation studies (Chuang & Kind, 2011), which would imply over 30,000 respondents in total for the DALY (similar to the number used to obtain the current disability weights: Salomon et al., 2012; Salomon et al., 2015), but I’m not sure how generalizable their estimate is to other instruments and to panel data.
- Importantly, respondents can't be specifically selected for having the target states (since we want to know their baseline SWB), so even a very large study may struggle to get sufficient observations for some less common states—though there are ways to mitigate this problem, like sampling populations that are most likely to experience the target states, or modeling weights based on values for similar states.
- Difficulty getting self-reports of the worst states. People don't tend to answer surveys when they're dying in agony or experiencing a psychotic episode, and if they do their answers may not be very reliable, so other methods would have to be used as well (such as carers’ valuations or expert opinion).
- Challenges with statistical analysis. I don’t understand this fully, but multi-way interactions between the health states, plus other factors like gender, income, and age, will introduce significant complexity and subjective judgement. That said, such difficulties haven’t stopped progress in other areas (e.g., cost-effectiveness modeling), and seem to have been handled adequately in other studies that generate disability weights (e.g., Burnstein et al., 2015).
Tentative verdict
This is probably the theoretically ideal approach, but I can’t endorse it without looking further into the feasibility of data collection and analysis, including sources of funding. It’s possible that only a big organisation like the World Health Organisation or Institute for Health Metrics and Evaluation (IHME) would have the financial and logistical power to carry it out, and I assume there is very little chance of that happening given their deep-seated opposition to the use of wellbeing metrics.
But it’s worth checking whether such questions could be added to other studies, such as the Global Flourishing Study (which doesn’t seem to be fully-funded yet) or national efforts like the British Household Panel Survey (BHPS) and the US Medical Expenditure Panel Survey (MEPS). Perhaps some large effective altruism grantmakers, such as Open Philanthropy, would also consider funding something like this?
(b) Large cross-sectional study
Get a large sample of the global general public, but only obtain their SWB and DALY health status at one point in time.
Pros
- Cheaper and quicker than a longitudinal study.
- Can deliberately select participants with the target health states to ensure sample sizes are adequate for even fairly rare states (though care must be taken to avoid selection bias).
- Proof-of-concept has been established by the cross-sectional QALY studies described in the previous section.
- Could conceivably piggy-back on existing global studies, such as the Gallup World Poll, or on some of the numerous national health surveys.
Cons
- All of the usual issues with cross-sectional studies, e.g., reverse causality (SWB influences health, and patients may be symptomatic prior to diagnosis).
- Some of the same issues as other self-reports, e.g., few and unreliable responses for the worst states.
- Still need a really big sample in order to get precise values for all health states, so it could be expensive—unless it could be attached to an existing survey.
Tentative verdict
This might be the best we can hope for in the coming few years; and even if a longitudinal study were possible, it would be nice to get preliminary weights from a study like this.
(c) Mapping from the QALY
Use an MAUI like the EQ-5D-3L to describe each DALY state, e.g.:
- Infectious disease, acute episode, mild (description: "has a low fever and mild discomfort, but no difficulty with daily activities") could be 11121 (moderate pain/discomfort and no problems with anything else).
- Infectious disease, acute episode, severe ("has a high fever and pain, and feels very weak, which causes great difficulty with daily activities") might be 22321 (moderate problems with mobility, self-care, and pain/discomfort; severe problems with performing usual activities; and no anxiety/depression).
SWB weights for the MAUI could then be applied to these states and the inverse used as the DALY weight (e.g., QALY 0.25 = DALY 0.75).
There are at least two ways of doing this mapping. The first is to make hypothetical judgements about how the DALY description corresponds to each dimension of the MAUI, as I did in the previous paragraph. This approach has already been attempted in two pilot studies using the newer five-dimension EQ-5D-5L (Maertens de Noordhout et al., 2017):
- In the first, 81 public health students supplied EQ-5D profiles for just four DALY health states (including acute schizophrenia), in the presence of a researcher who could clarify as necessary.
- In the second, 393 members of the public assessed 27 states in an online survey.
The first survey gave sensible answers, perhaps because the respondents were well-informed or could ask questions, but the second set of responses had a very large standard deviation (indicating a wide variety of opinions). This is perhaps unsurprising: even with a “straightforward” case like total blindness, it’s not obvious to me how much that would “on average” affect mobility, self-care, usual activities, or depression/anxiety, so there would be a wide range of plausible EQ-5D-3L profiles (22212, 11211, etc.), and therefore a wide range of plausible sDALY weights.[6]
The second approach, then, is to use studies in which both DALY states (or their corresponding sequelae) and MAUI scores are self-reported (or deducible). For instance, surveys could identify people with mild, moderate, and severe malaria and ask them to complete the EQ-5D questionnaire. The SWB weights for the reported EQ-5D profile can then be applied to obtain the new disability weight.
Pros
- Using hypothetical ratings, this could be quick and easy, at least to get preliminary results.
- Describing each DALY state in terms of, say, the EQ-5D could perhaps be done in a few hours, assuming only a small number of “expert” raters.
- There would be no special problems getting weights for rare or severe health states.
- It may not be difficult to get self-reports for both QALY and DALY states.
- For some states there may be existing data, such as from clinical trials. For instance, the DALY state “moderate anemia” has a reasonably clear clinical definition, and is a common sequela of various health conditions, so I suspect it would be easy to find its associated EQ-5D or SF-6D scores.
- Assuming we only want cross-sectional data (MAUI and DALY descriptions at the same time point), the relevant patient populations can potentially be targeted in the sampling, which reduces costs and/or increases sample sizes for rare states.
- If a large cross-sectional study was deemed necessary—for instance, to avoid selection bias—it would still be much cheaper and quicker than a large panel study.
- There are a lot of national (e.g., BHPS, MEPS), and a few international (e.g., Gallup), surveys to which these questions could potentially be added (though I haven’t looked into how one would go about making this happen).
Cons
- As noted above, getting valid hypothetical ratings could be challenging:
- Using a convenience sample, or “expert” raters (e.g., with clinical knowledge), the judgements may not reflect the views of the general population.
- Using a representative sample of the general public, there may be very high variance and/or heterogeneity in responses.
- Using either method, there is a risk of systematic bias, particularly if the MAUI contains dimensions that are not reflected in the DALY descriptions: it would be up to raters to “fill in the gaps” with their own assumptions. For instance, it’s plausible that malaria causes loss of “vitality” (a dimension of the SF-6D relating to energy/tiredness), but raters may not realize this if they haven’t experienced it themselves.
- On the other hand, I haven’t confirmed that it’s straightforward to get self-reports for all relevant health states.
- For rare or “extreme” conditions (e.g., severe dementia), it could be hard to get sufficient valid responses.
- Establishing causality may be tricky, especially in cross-sectional studies, and particularly if the QALY and DALY descriptions differ considerably. For instance, if people with tuberculosis report anxiety (a feature of the MAUI but not the DALY health state description), it may be unclear whether this is due to indirect effects of the disease (e.g., worrying about income loss) that should be included in the sDALY weight, anxiety increasing susceptibility to infection (reverse causation), or some third factor causing both (confounding). Panel studies may therefore be preferable, but are more expensive, time-consuming, and logistically challenging.
- Mapping to an MAUI introduces some of the flaws in QALYs. For example, the EQ-5D is generally insensitive to problems with vision, hearing, intellectual disability, schizophrenia, dementia and a number of other conditions, because the symptoms cannot be adequately described using the five dimensions, whereas it gives undue influence to mobility relative to other factors that affect our wellbeing, even if the SWB weight for mobility problems is fairly low, simply by having that as one of its dimensions. (See Parts 1 and 2 for further discussion.)
- This isn’t a good reason to prefer current DALYs (sQALY-weighted sDALYs would still better track SWB), but it may be a reason to prefer option (a) or (b).
- It’s also worth re-emphasizing that the choice of QALY instrument would affect the results (see Part 2 and Richardson et al., 2015). For instance, the SF-6D, AQoL, or E-QALY would probably produce more severe weights for mental health problems than the EQ-5D.
- As discussed in the previous section, the currently-available SWB weights for the EQ-5D and SF-6D are highly imprecise (wide error bars) and are potentially biased. So even with a perfect mapping procedure, the results are not going to be great until there’s a better sQALY.
- A fully-developed sQALY would include states worse than dead. There’s no reason why the DALY couldn’t go above 1 (= dead), e.g., QALY -0.2 = DALY 1.2, but if that was rejected for some reason we would have to consider how to transform those values.
Tentative verdict
Something like this may be worth attempting, assuming we have at least a preliminary sQALY and assuming it isn’t possible to do option (a) or (b) in the near future. As a proof-of-concept, perhaps it could be done with a small number of states using existing self-report data and/or hypothetical ratings from a convenience sample. If it seems worthwhile, it can be expanded to more states and/or more representative raters. But until a better sQALY is available, it may not be wise to spend a lot of resources on this; and if we have the capacity to create a good sQALY, perhaps those resources could be better invested in option (a) or (b).
ITN assessment
The importance, tractability, and neglectedness will naturally vary widely among specific projects and sub-projects, but here are some general thoughts.
Importance
Adopting the sHALY would have radical implications for the distribution of healthcare (and potentially social care) resources, shifting them strongly in the direction of interventions that improve psychological wellbeing. Applying it to major projects such as the Global Burden of Disease and Disease Control Priorities studies, national systems for healthcare evaluation, or project selection by major non-profits (see Parts 8 and 9) could potentially shift the direction of millions if not billions of dollars.
However, compared to the widespread adoption of a full WELBY, the sHALY may be considered relatively low-impact, especially outside healthcare. One study suggests that a QALY (i.e., a move from 0 to 1 on the scale for a year) is only equivalent to about 2.3 points on a 0–10 life satisfaction scale (Huang et al., 2018), underlining the obvious fact that health is only one of numerous determinants of our happiness (though the correlation would obviously be stronger with a sHALY). Even the best HALY descriptive systems, such as the E-QALY and AQoL, can only really be extended to social care, so even an ideal sHALY would have limited reach. That said, the viability of a WELBY, especially in healthcare, is very questionable, so the sHALY may be the best wellbeing-focused option in this domain.
Compared to a very good HALY+ the additional benefits may also be negligible, though it remains to be seen how well the HALY+ could account for wellbeing. Taking into account moral uncertainty, it’s even possible that some kind of HALY+ that factors in various conceptions of wellbeing could be better in principle. Nevertheless, depending on the details, some non-utilitarians would still consider the sHALY a better metric—and by almost any reasonable standard it seems like an improvement over current QALYs and DALYs.
The relative impact of developing a sQALY versus a sDALY is unclear to me. It will depend on a wide range of factors, including general issues raised in Part 2 and how exactly one intends to use the metric. These should be considered very carefully before choosing a project.
Tractability
As noted above, the tractability of a very good version of the sHALY depends heavily on the tractability of related projects, such as establishing the dead point on wellbeing scales (Part 4), the tradeoff between wellbeing and years of life (Part 5), and a method to deal with spillover effects (Part 6). While these will be challenging, and I don’t expect ideal solutions, I suspect they could be resolved to an extent that some kind of sHALY becomes viable. It’s important not to make the perfect the enemy of the good—particularly when the counterfactual is as unappealing as current HALYs.
Assuming those issues have been adequately addressed, it shouldn’t be too hard to develop a decent sQALY. It might just require a large, high-quality study (or series of studies in different populations) to collect information using at least one generic health status questionnaire and a selection of SWB measures—ideally in the same individuals over time (i.e., panel data). There may, however, be a need for ad hoc adjustments to the resulting values, and/or the incorporation of data from other studies, to address measurement issues or normative concerns.
I’m less confident about a sDALY. The large number of unique health state descriptions could make it hard to obtain precise SWB weights for all states from population surveys, and using “expert” raters, or mapping from the sQALY, introduces potential biases. However, the feasibility of at least some weighting options can be established at low cost, so it certainly seems worth investigating further—at least for a selection of high-priority health conditions.
In my view, the strongest reason not to do this project is the apparent lack of interest among key stakeholders. Clinicians, patients, and major HALY “consumers” such as NICE and IHME seem strongly opposed to a pure SWB measure, even if focused on dimensions of health, and to the use of patient-reported values more broadly. As discussed in previous posts, this is due to a combination of normative concerns, such as the belief that those who pay for healthcare have the right to determine its distribution or that disability has disvalue beyond its effect on wellbeing, and doubts about the practicality of SWB measures in these domains.
So this project may only be worth considering if the sHALY would be useful for non-governmental purposes (e.g., within effective altruism), or in “supplementary” analyses alongside more standard methods (e.g., to highlight how QALYs neglect mental health). Either that, or changing the minds of large numbers of influential stakeholders will have to be a major part of the project—which may not be entirely unrealistic, given the increasing prominence of wellbeing in the public sector. We should also consider the possibility that projects such as this, which offer a viable alternative to the status quo, would themselves help to shift opinion.
Neglectedness
As shown above, there have been steps toward a sQALY, but I’m not sure whether anyone is attempting to resolve the outstanding issues in order to produce a very good version. As far as I can tell, nobody has done any work towards a sDALY, but it’s not impossible that someone else is pursuing something similar. If you're interested in taking on either of these projects, I can help you identify any ongoing efforts.
Conclusions
This post outlined the rationale, previous work, and future directions for the development of a health-focused metric based on SWB. Such a measure would address some but not all of my core criticisms of current HALYs:
1. They neglect non-health consequences of health interventions.
The sHALY allows non-health effects of health states (and treatment) to be valued, within the limits of a health-focused descriptive system.
2. They rely on poorly-informed judgements of the general public.
It avoids this problem by using self-reported patient values, though of course SWB values are not entirely free of bias. Other approaches would also be needed to obtain weights for states that preclude self-reporting, such as severe dementia.
3. They fail to acknowledge extreme suffering (and happiness).
It doesn’t directly address this, but with an appropriate wellbeing scale it should be able to capture both positive and negative experiences more accurately, including their classification as better than or worse than dead. That said, there are particular challenges in obtaining self-reports from people in extreme physical or mental pain, as discussed in Part 4.
4. They are difficult to interpret, capturing some but not all spillover effects.
It should represent the approximate SWB loss to the patient caused by health problems; the extent to which it captures effects on other people will depend, in part, on the choice of classification system and SWB instrument, and will likely remain somewhat unclear. As with regular HALYs and WELBYs, this issue will probably have to be addressed through broader evaluation methodology, such as administering health/wellbeing measures to close family and/or assigning a monetary value to spillovers in cost-effectiveness analyses (see Part 6).
5. They are of little use in prioritizing across sectors or cause areas.
It doesn’t address this issue directly, and by definition would not be as widely applicable as a WELBY; but it could be paired with a broad descriptive system like the E-QALY to enable application in at least social care (see Part 2).
A preliminary sQALY can be constructed using existing data (given some tenuous assumptions), and a more robust version seems quite feasible. I’m less confident about the tractability of creating a sDALY from scratch, but it doesn’t seem impossible. It appears that few researchers are working on these metrics, and their widespread adoption would have quite radical implications for the distribution of healthcare resources, most notably a shift from physical to mental health.
However, I’m uncertain whether this topic merits a lot of additional resources. While almost any sHALY would probably represent an improvement over current QALYs and DALYs, and may be useful for high-level prioritization among effective altruists interested in global health, key decision-makers outside our community seem unlikely to pay much attention to it. Depending on one’s skills and opportunities, perhaps it would be better first to focus on solving some key problems in the measurement of wellbeing, on which the success of this project is arguably contingent, beginning with establishing the dead point on relevant scales. That is the subject of my next post.
Credits

This post is a project of Rethink Priorities. It was written by Derek Foster. Thanks to Jason Schukraft, David Rhys Bernard, Julian Jamison, Paul Frijters, Tessa Peasgood, David Moss, and Peter Hurford for helpful feedback on previous drafts. If you like our work, please consider subscribing to our newsletter. You can see all our work to date here.
Appendix: Study summaries
This appendix summarizes the methods and findings of five studies that obtained SWB weights for health and capability descriptive systems:
- A. Graham, Higuera, & Lora, 2011
- B. Dolan & Metcalfe, 2012
- C. Dolan, Lee, & Peasgood, 2012
- D. Mukuria & Brazier, 2013
- E. Himmler, van Exel, & Brouwer, 2020
Note that I haven’t fully evaluated the studies; for now, I’m just taking the reports at face value.
A. Graham, Higuera, & Lora, 2011
This cross-sectional study used data from the 2007 Gallup World Poll in 19 Latin American countries. Respondents first rated their life satisfaction[7] using Cantril’s Ladder:
Please imagine a ladder/mountain with steps numbered from zero at bottom to ten at the top. The top of the ladder/mountain represents the best possible life for you and the bottom represents the worst possible life for you. On which step of the ladder would you say that you personally feel that you stand at this time, assuming that the higher the step the better you feel about your life and the lower the step the worst you feel about it? Which step comes closest to the way that you feel?
They then described their own health state with the EQ-5D-3L questionnaire, i.e., no problems (level 1), moderate problems (level 2), or severe problems (level 3) on each of the five dimensions: mobility, self-care, usual activities, pain/discomfort, and anxiety/depression. Standard standard regression methods were used to observe the association between SWB and health states.
Life satisfaction (Cantril’s Ladder) “weights” for the EQ-5D-3L in Graham, Higuera, & Lora (2011). Error bars represent 95% confidence intervals. Original spreadsheet available here.
Though the error bars are very wide, it’s clear that problems with mental health, pain, and performing usual activities had the greatest association with life satisfaction. Problems with mobility and self-care did not seem to have much, if any; in fact, there was a small (and statistically insignificant) positive association, suggesting reduced functioning in these areas increased wellbeing. Initially I thought this could be due to random error (in which case a larger sample size in these groups would give a more accurate impression) or some unmeasured confounding variable (something that independently causes both increased life satisfaction and poor physical health). But other studies have found similar results, including most of those discussed below, so I then thought it could be a real effect. For instance, I wouldn’t be that surprised if having someone else look after you—as required when you are unable to wash or dress yourself—increases positive social contact to the extent that it “outweighs” the additional hardship in some cases. However, Mukuria & Brazier (2013) say that it’s a “statistical effect” due to the inclusion of mental health dimensions in the utility instrument[8] (the sign of the effect switches when those are excluded), so for now I’ll assume that’s the case.
This study also made “equivalent income calculations” for health states. These show how much respondents in each state would have to be compensated financially in order to achieve life satisfaction equivalent to not having the state.
The average respondent in Latin America would need to be compensated approximately twice baseline income for moderate problems with [usual activities], and three times for moderate anxiety. Extreme pain was more ‘expensive’ in life satisfaction terms: almost five average incomes, while extreme anxiety was the most ‘expensive’: 13.5 times. This suggests that improvements in health, and in particular reductions of extreme forms of damage to quality of life, contribute a lot to human happiness compared with gains in income.
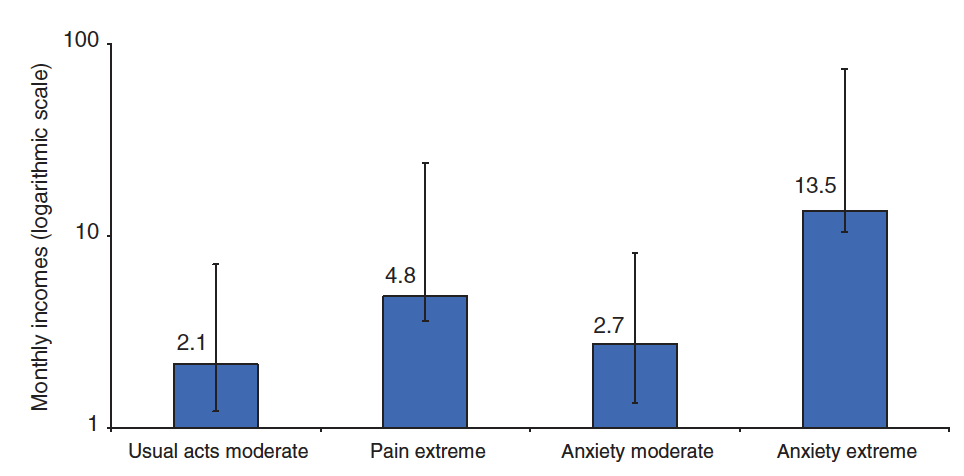
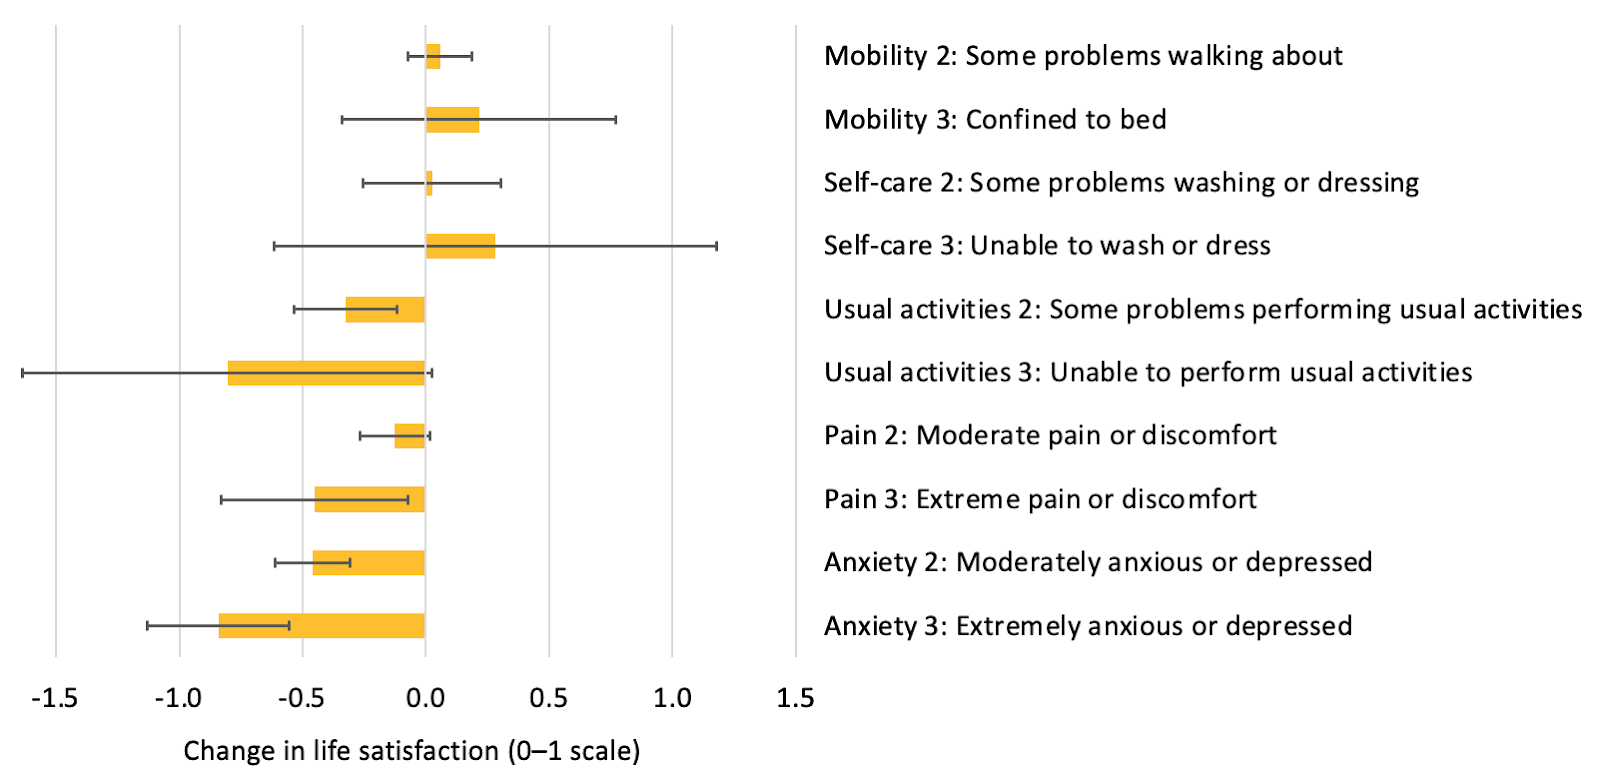
Income required to compensate, in terms of life satisfaction, for health problems described by the EQ-5D-3L (Graham, Higuera, & Lora, 2011, Figure 1).
B. Dolan & Metcalfe, 2012
This cross-sectional study used two separate samples of the US general public. The first used the time tradeoff method, as detailed in Parts 1 and 2, to value a range of hypothetical health states described by the EQ-5D-3L. The second described their own health state with the EQ-5D-3L questionnaire and also assessed their own happiness using two measures:
- Life satisfaction: “Overall, how satisfied are you with your life?” (on a scale of 0–6).
- Day affect: “Overall, how did you feel yesterday? Please rate each feeling on the scale given. A 0 means that you did not experience that feeling at all, and a 6 means that you experienced that feeling very strongly.’’
- The feelings were friendly, lethargic, stressed, happy, sad, calm, angry, tired, depressed, and worried.
- Day affect was taken as the difference between the average of positive and negative affect.
All measures were rescaled onto a 0–1 scale (so states “worse than dead” were not possible, if these are interpreted as QALY weights). Again, standard regression methods were used to compare responses.
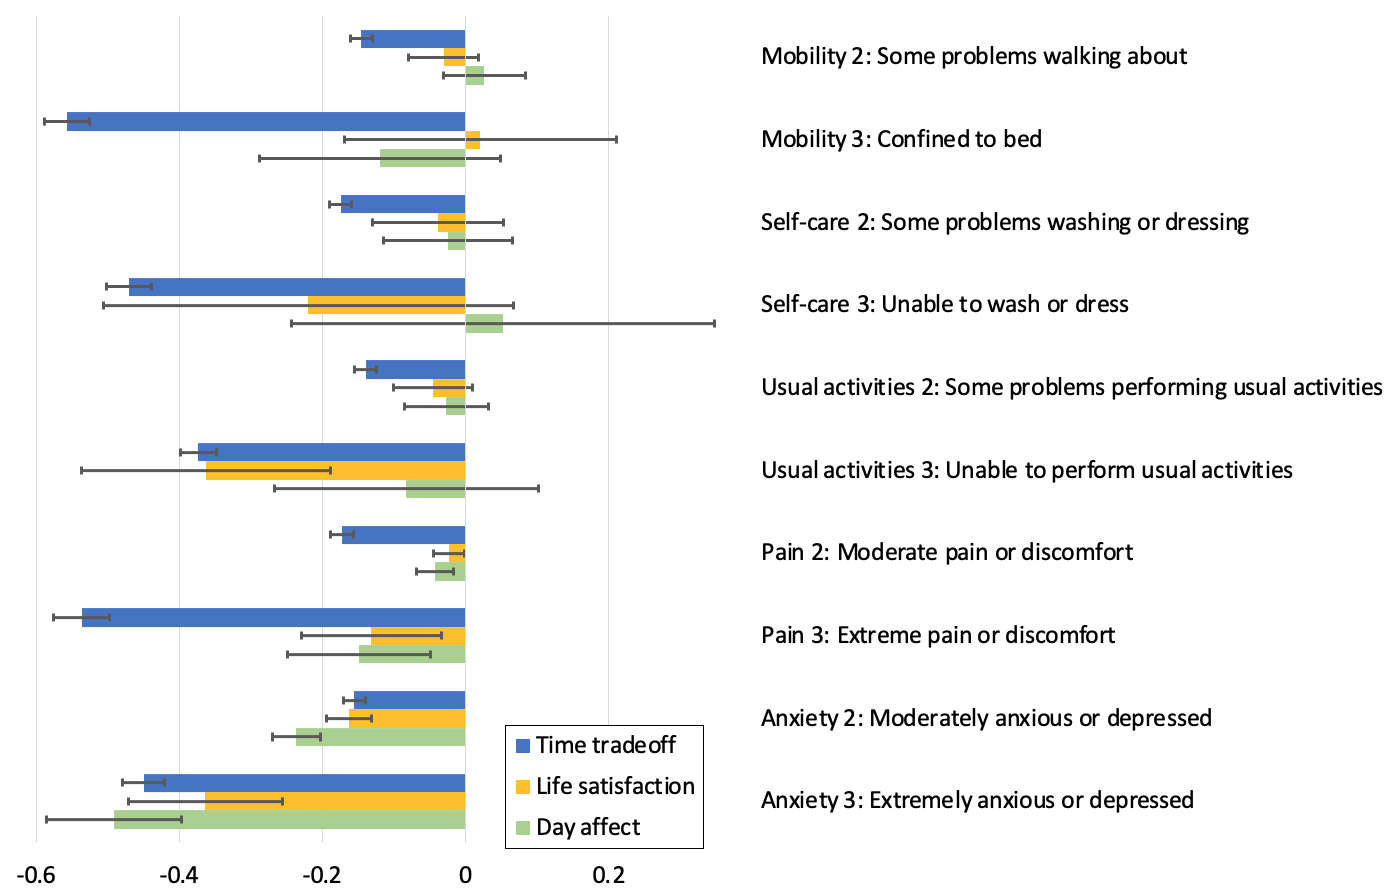
Life satisfaction, day affect, and time tradeoff “weights” for the EQ-5D-3L in Dolan & Metcalfe (2012). Error bars represent 95% confidence intervals. Original spreadsheet available here.
As shown in the graph, the results are broadly comparable to Graham, Higuera, & Lora (2011). Experiencing anxiety/depression appears to be by far the worst in terms of affect, followed by extreme pain/discomfort, while life satisfaction scores were similar for extreme anxiety/depression and being unable to perform one’s usual activities. However, the error bars are very wide for some dimensions, often crossing zero. Some point estimates suggest problems with mobility and self-care slightly improve wellbeing, but these are again not statistically significant and may be a statistical artifact.
C. Dolan, Lee, & Peasgood, 2012
Unlike the other studies presented here, this used panel data, i.e. measurements from the same people at multiple time points. This makes it easier to determine causality: changes in health can both cause and be caused by changes in wellbeing, so knowing which came first chronologically is very helpful (though handling potential confounders can still be challenging). In this case, the data came from the British Household Panel Survey (BHPS).
For describing health, the study used the first version of the Short Form Six Dimension (SF-6D-v1). The dimensions are:
- Vitality (5 levels)
- Mental health (5 levels)
- Social functioning (5 levels)
- Role functioning (4 levels)
- Pain (6 levels)
- Physical functioning (6 levels)
The original preference-based value set for the UK obtained weights from the general public using the standard gamble method, as described in Parts 1 and 2 (Brazier, Roberts, & Deverill, 2002).[9]
For SWB, the study used life satisfaction: “How dissatisfied or satisfied are you with your life overall?” (0–7 scale, rescaled to 0–1).
As shown in the graph below, the general pattern of responses was similar to the previous EQ-5D studies: dimensions related to psychological wellbeing (vitality, i.e., energy/tiredness, and mental health) have much greater effect on life satisfaction than those related to physical health (including pain).[10]
Life satisfaction and standard gamble “weights” for the SF-6D-v1 in Dolan, Lee, & Peasgood (2012). Error bars represent 95% confidence intervals. Original spreadsheet available here.
In a less extensive analysis for our chapter of the Global Happiness & Wellbeing Policy report (Peasgood, Foster, & Dolan, 2019, pp. 38–39), Tessa Peasgood found similar results using more recent data from the same BHPS survey:
we find that people with depression score slightly higher (hence are judged to be healthier) on the SF-6D relative to a sample (matched for age and gender) with mobility problems. This contrasts with the substantially lower value of mean life satisfaction for the depressed group (0.64 lower on the 1 to 7 scale).
D. Mukuria & Brazier, 2013
This cross-sectional study examined the association with SWB of both EQ-5D-3L and SF-6D-v1. However, it differs from the other cross-sectional studies reported here in three respects:
- Population: The respondents were hospital patients rather than members of the general public. Since the aim is to understand the subjective consequences of health states, it is important to obtain values from people who have experienced a wide range of conditions.
- SWB measure: The SWB measure aimed to capture frequency, rather than intensity, of experience. It asks “Have you been happy?” and respondents choose from: all of the time (5), most of the time (4), some of the time (3), a little of the time (2), or none of the time (1).
- Analysis: The primary analysis used an ordered logit model. This assumes that the SWB responses are interpersonally ordinally comparable (your 5 is higher than your 4, and my 5 is higher than my 4) but not necessarily cardinally comparable, i.e., not on an interval scale (moving from a 4 to a 5 may be better or worse than moving from a 1 to a 2). Since cardinality is required for QALY weights, and for comparability with previous studies, the authors also report results for an ordinary least squares (OLS) model that assumes cardinality.
Despite these differences, the results were broadly similar to previous studies. For the EQ-5D, the ordered logit model showed that happiness had the strongest (negative) association with anxiety/depression, followed by usual activities, pain/discomfort, and self-care. Problems with mobility had a small, non-significant positive association. The OLS model gave broadly similar weights as the day affect measure in Dolan & Metcalfe (2012) reported above, though the association with extreme pain was notably lower.
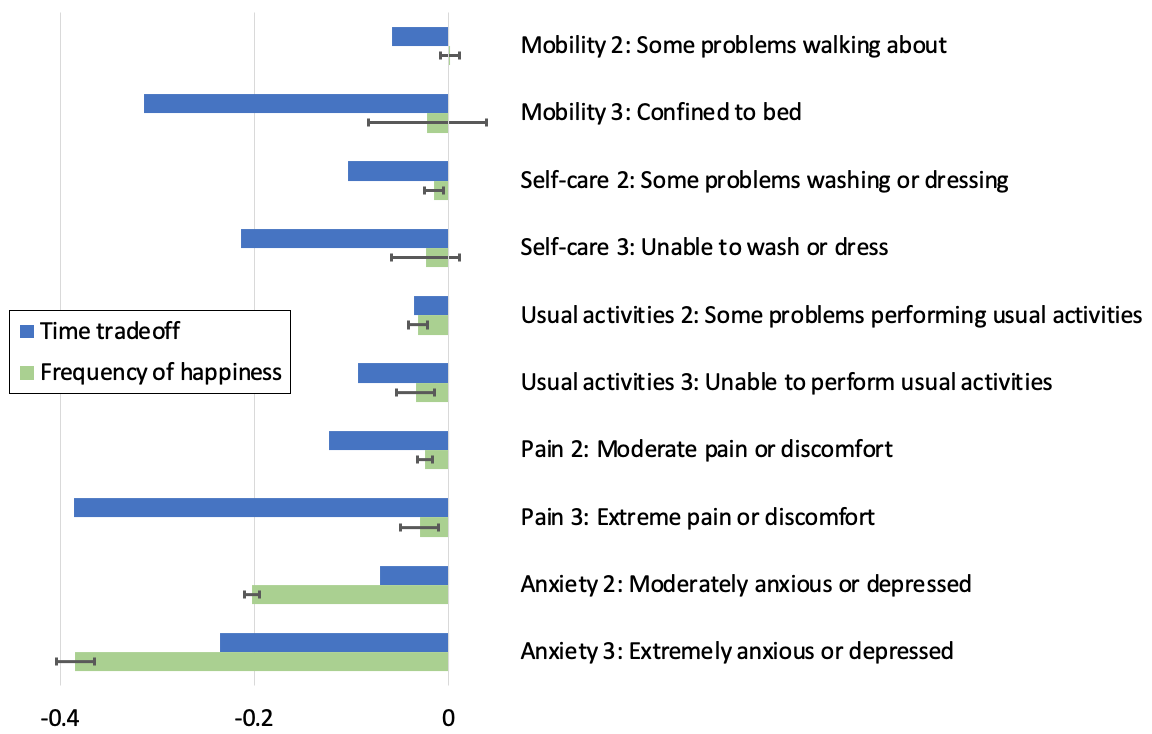
Happiness frequency and time tradeoff “weights” for the EQ-5D-3L in Mukuria & Brazier (2013, Table 3), based on an ordinary least squares model. Error bars represent 95% confidence intervals. Original spreadsheet available here.
For the SF-6D, the strongest associations were with mental health and vitality, followed by social functioning, role functioning, and pain.[11] Physical functioning showed a statistically significant positive association (i.e., worse physical health predicts more happiness), but this effect is reduced when vitality is removed from the model, and reversed when mental health is excluded, suggesting that physical health problems are bad for SWB due to their effect on energy and mental health.
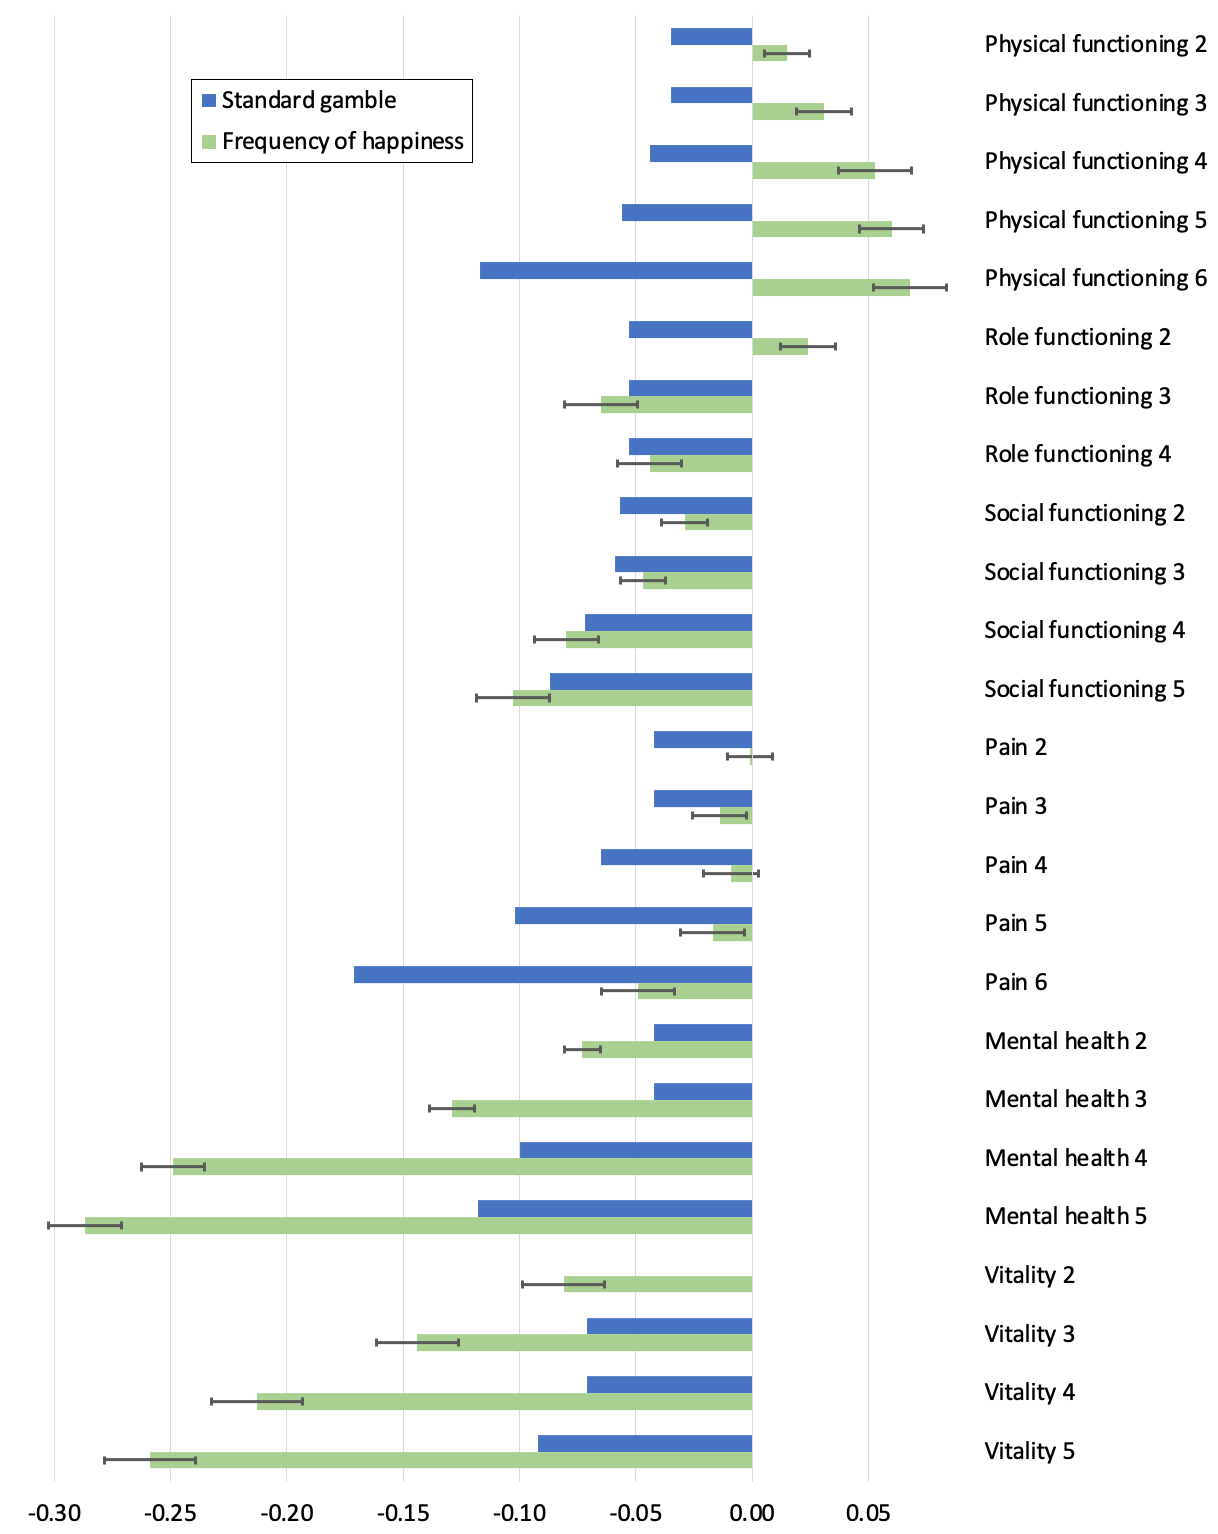
Happiness frequency and standard gamble “weights” for the SF-6D-v1 in Mukuria & Brazier (2013, Table 4), based on an ordinary least squares model. Error bars represent 95% confidence intervals. Original spreadsheet available here.
Consistent with other studies (Richardson et al., 2015), the SF-6D dimensions were a better predictor of happiness than the EQ-5D dimensions: R2 = 0.5 versus 0.34. This highlights the importance of choosing a good descriptive system, not just a good valuation method.
E. Himmler, van Exel, & Brouwer, 2020
This paper reports two cross-sectional studies that obtained SWB weights for the Investigating Choice Experiments CAPability measure for Older people (ICECAP-O) and a similar measure for adults (ICECAP-A).[12] These are primarily used in economic evaluation of social care programmes, but are intended as a general measure of wellbeing from a capabilities perspective. Here I focus on the ICECAP-A as it has wider applicability.
The ICECAP-A questionnaire (Al-Janabi, Flynn, & Coast, 2012) has one question for each of five dimensions:
- Attachment (an ability to have love, friendship, and support)
- Stability (an ability to feel settled and secure)
- Achievement (an ability to achieve and progress in life)
- Enjoyment (an ability to experience enjoyment and pleasure)
- Autonomy (an ability to be independent)
Each of these has four levels, resulting in profiles such as 11242 and 44343. As with QALY instruments, weights are normally assigned to each level of each dimension using preferences of the general public. In this case, it used best-worst scaling, an ordinal method in which the respondent identifies the best (most preferred) and worst (least preferred) of several given states (Flynn et al., 2015). The values are anchored to 0 and 1, where 0 is no capability on any dimension (11111) and 1 is full capability on all dimensions (44444). Unlike the QALY, zero does not represent dead as it’s possible to be alive with no capability.
In Himmler, van Exel, & Brouwer (2020), these were reweighted using two measures of life satisfaction: Cantril’s Ladder, as described above, and the Satisfaction With Life Scale. The SWLS contains five statements:
- In most ways my life is close to my ideal.
- The conditions of my life are excellent.
- I am satisfied with my life.
- So far I have gotten the important things I want in life.
- If I could live my life over, I would change almost nothing.
The respondent assigns a score between 1 (strongly disagree) and 7 (strongly agree) to each statement, giving a total between 5 and 35. Scores on both measures were rescaled to 0–1 and, in the primary analysis, a simple average used as the weight. The regression model assumed cardinality.
Results were considerably different from preference-based weights in all dimensions except achievement. The biggest absolute differences in weights were for attachment and autonomy, which were both much less important from a SWB perspective. This makes sense for autonomy, which is an abstract notion with no direct connection to valenced experience, but I’m a bit surprised about attachment, given the known importance of relationships to SWB.
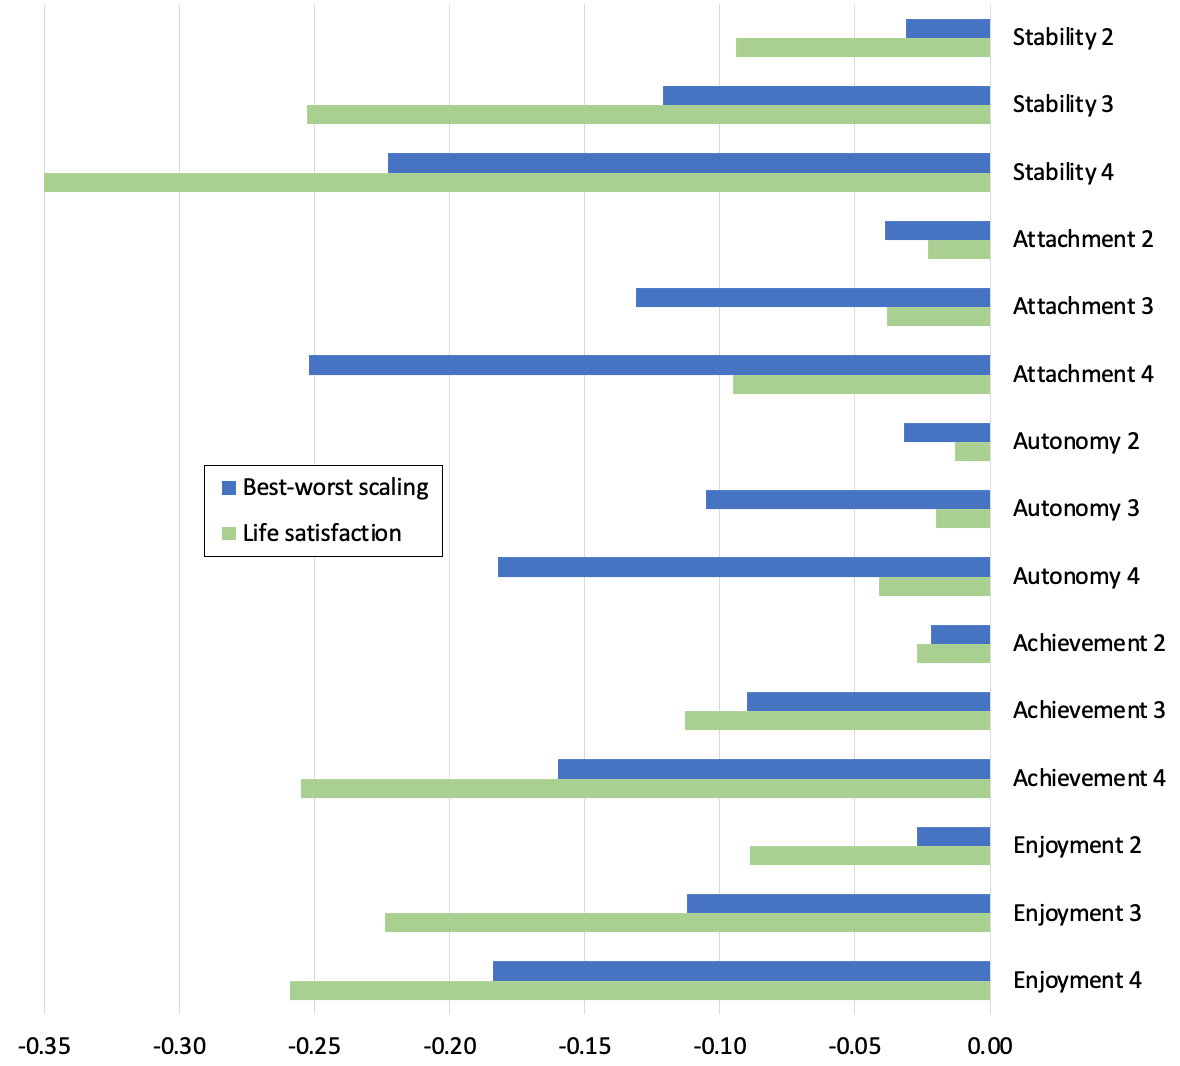
Life satisfaction and best-worst scaling (preference) “weights” for the ICECAP-A in Himmler, van Exel, & Brouwer (2020, Table 3). Original spreadsheet available here.
The rank order of dimensions also differed:

In contrast to QALY findings, weights were lower (more severe) on average using SWB, as illustrated below. Overall, ICECAP-A (plus sociodemographic controls) explained about 66% of variance in life satisfaction, which is better than any health-focused instrument.
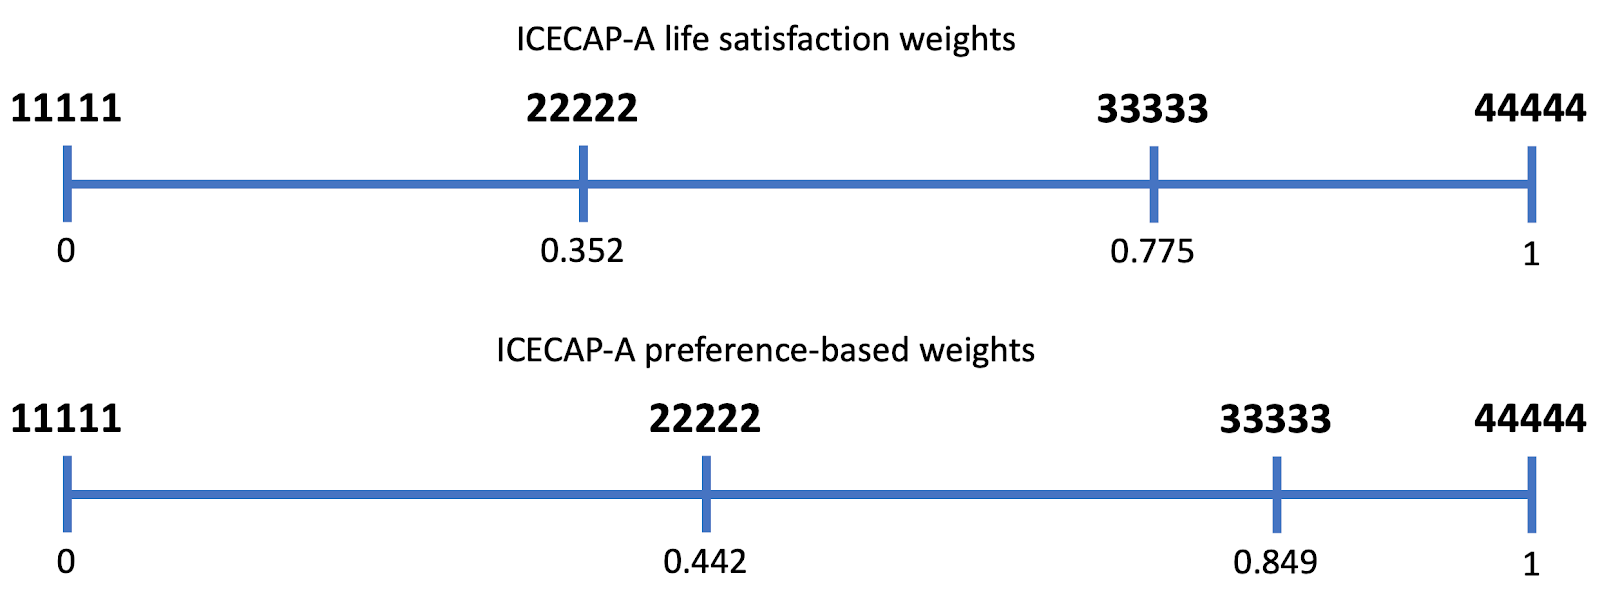
ICECAP-A weights for sample health states based on life satisfaction and best-worst scaling. (Adapted from Himmler, van Exel, & Brouwer, 2020, Figure 2a.)
So, broadly speaking, these five papers confirm that understanding the subjective experience associated with objective states is feasible, and that using such information implies more emphasis should be put on mental wellbeing than on physical health or some common components of “objective list” theories. This is further supported by less granular comparison of health and wellbeing measures (Mukuria et al., 2016; Johnson et al., 2016; Huang et al., 2018). However, more research is needed to convert this into a robust QALY based on SWB.
References
Al-Janabi, H., N Flynn, T., & Coast, J. (2012). Development of a self-report measure of capability wellbeing for adults: The ICECAP-A. Quality of Life Research, 21(1), 167–176. https://doi.org/10.1007/s11136-011-9927-2
Augustovski, F., Colantonio, L. D., Galante, J., Bardach, A., Caporale, J. E., Zárate, V., Chuang, L. H., Pichon-Riviere, A., & Kind, P. (2017). Measuring the benefits of healthcare: DALYs and QALYs – does the choice of measure matter? A case study of two preventive interventions. International Journal of Health Policy and Management, 7(2), 120–136. https://doi.org/10.15171/ijhpm.2017.47
Bernfort, L., Gerdle, B., Husberg, M., & Levin, L.-Å. (2018). People in states worse than dead according to the EQ-5D UK value set: Would they rather be dead? Quality of Life Research, 27(7), 1827–1833. https://doi.org/10.1007/s11136-018-1848-x
Brazier, J. E., Rowen, D., Lloyd, A., & Karimi, M. (2019). Future directions in valuing benefits for estimating QALYs: Is time up for the EQ-5D? Value in Health, 22(1), 62–68. https://doi.org/10.1016/j.jval.2018.12.001
Brazier, J., Roberts, J., & Deverill, M. (2002). The estimation of a preference-based measure of health from the SF-36. Journal of Health Economics, 21(2), 271–292. https://doi.org/10.1016/S0167-6296(01)00130-8
Burstein, R., Fleming, T., Haagsma, J., Salomon, J. A., Vos, T., & Murray, C. JL. (2015). Estimating distributions of health state severity for the global burden of disease study. Population Health Metrics, 13. https://doi.org/10.1186/s12963-015-0064-y
Chuang, L.-H., & Kind, P. (2011). The effect of health state selection on the valuation of EQ-5D. Medical Decision Making: An International Journal of the Society for Medical Decision Making, 31(1), 186–194. https://doi.org/10.1177/0272989X10371231
Cubi-Molla, P., Shah, K., & Burström, K. (2018). Experience-based values: A framework for classifying different types of experience in health valuation research. The Patient - Patient-Centered Outcomes Research, 11(3), 253–270. https://doi.org/10.1007/s40271-017-0292-2
Diener, E., Lucas, R. E., & Oishi, S. (2018). Advances and open questions in the science of subjective well-being. Collabra: Psychology, 4(15). https://doi.org/10.1525/collabra.115
Dolan, P., & Kahneman, D. (2008). Interpretations of utility and their implications for the valuation of health. The Economic Journal, 118(525), 215–234. https://doi.org/10.1111/j.1468-0297.2007.02110.x
Dolan, P., Kudrna, L., & Stone, A. (2017). The measure matters: An investigation of evaluative and experience-based measures of wellbeing in time use data. Social Indicators Research, 134(1), 57–73. https://doi.org/10.1007/s11205-016-1429-8
Dolan, P., Lee, H., & Peasgood, T. (2012). Losing sight of the wood for the trees. PharmacoEconomics, 30(11), 1035–1049. https://doi.org/10.2165/11593040-000000000-00000
Dolan, P., & Metcalfe, R. (2012). Valuing health: A brief report on subjective well-being versus preferences. Medical Decision Making, 32(4), 578–582. https://doi.org/10.1177/0272989X11435173
Flynn, T. N., Huynh, E., Peters, T. J., Al-Janabi, H., Clemens, S., Moody, A., & Coast, J. (2015). Scoring the ICECAP-A capability instrument. Estimation of a UK general population tariff. Health Economics, 24(3), 258–269. https://doi.org/10.1002/hec.3014
Graham, C., Higuera, L., & Lora, E. (2011). Which health conditions cause the most unhappiness? Health Economics, 20(12), 1431–1447. https://doi.org/10.1002/hec.1682
Himmler, S., van Exel, J., & Brouwer, W. (2020). Happy with your capabilities? Valuing ICECAP-O and ICECAP-A states based on experienced utility using subjective well-being data. Medical Decision Making, 40(4), 498–510. https://doi.org/10.1177/0272989X20923015
Huang, L., Frijters, P., Dalziel, K., & Clarke, P. (2018). Life satisfaction, QALYs, and the monetary value of health. Social Science & Medicine, 211, 131–136. https://doi.org/10.1016/j.socscimed.2018.06.009
Johnson, R., Jenkinson, D., Stinton, C., Taylor-Phillips, S., Madan, J., Stewart-Brown, S., & Clarke, A. (2016). Where’s WALY? : A proof of concept study of the ‘wellbeing adjusted life year’ using secondary analysis of cross-sectional survey data. Health and Quality of Life Outcomes, 14(1), 126. https://doi.org/10.1186/s12955-016-0532-5
Kahneman, D., Wakker, P. P., & Sarin, R. (1997). Back to Bentham? Explorations of Experienced Utility. The Quarterly Journal of Economics, 112(2), 375–406. https://doi.org/10.1162/003355397555235
Knaul, F. M., Farmer, P. E., Krakauer, E. L., Lima, L. D., Bhadelia, A., Kwete, X. J., Arreola-Ornelas, H., Gómez-Dantés, O., Rodriguez, N. M., Alleyne, G. A. O., Connor, S. R., Hunter, D. J., Lohman, D., Radbruch, L., Madrigal, M. del R. S., Atun, R., Foley, K. M., Frenk, J., Jamison, D. T., … Zimmerman, C. (2018). Alleviating the access abyss in palliative care and pain relief—an imperative of universal health coverage: The Lancet Commission report. The Lancet, 391(10128), 1391–1454. https://doi.org/10.1016/S0140-6736(17)32513-8
Maertens de Noordhout, C., Devleesschauwer, B., Gielens, L., Plasmans, M. H. D., Haagsma, J. A., & Speybroeck, N. (2017). Mapping EQ-5D utilities to GBD 2010 and GBD 2013 disability weights: Results of two pilot studies in Belgium. Archives of Public Health, 75(1), 6. https://doi.org/10.1186/s13690-017-0174-z
McTaggart-Cowan, H. (2011). Elicitation of informed general population health state utility values: A review of the literature. Value in Health, 14(8), 1153–1157. https://doi.org/10.1016/j.jval.2011.05.046
Mukuria, C., & Brazier, J. (2013). Valuing the EQ-5D and the SF-6D health states using subjective well-being: A secondary analysis of patient data. Social Science & Medicine, 77, 97–105. https://doi.org/10.1016/j.socscimed.2012.11.012
Mukuria, C., Peasgood, T., Rowen, D., & Brazier, J. (2016). An empirical comparison of wellbeing measures used in the UK (No. RR0048). Policy Research Unit in Economic Evaluation of Health and Care Interventions.
Mulhern, B. J., Bansback, N., Norman, R., Brazier, J., & SF-6Dv2 International Project Group. (2020). Valuing the SF-6Dv2 classification system in the United Kingdom using a discrete-choice experiment with duration. Medical Care, 58(6), 566–573. https://doi.org/10.1097/MLR.0000000000001324
Peasgood, T., Foster, D., & Dolan, P. (2019). Priority setting in healthcare through the lens of happiness. In Global Happiness & Wellbeing Policy Report 2019 (pp. 29–52). Global Council for Happiness and Wellbeing.
Peasgood, T., Mukuria, C., Karimi, M., & Brazier, J. (2019). Anchoring life satisfaction onto a QALY scale. Manuscript submitted for publication.
Richardson, J., Chen, G., Khan, M. A., & Iezzi, A. (2015). Can multi-attribute utility instruments adequately account for subjective well-being? Medical Decision Making, 35(3), 292–304. https://doi.org/10.1177/0272989X14567354
Rowen, D., Azzabi Zouraq, I., Chevrou-Severac, H., & van Hout, B. (2017). International regulations and recommendations for utility data for health technology assessment. PharmacoEconomics, 35(1), 11–19. https://doi.org/10.1007/s40273-017-0544-y
Salomon, J. A., Haagsma, J. A., Davis, A., Noordhout, C. M. de, Polinder, S., Havelaar, A. H., Cassini, A., Devleesschauwer, B., Kretzschmar, M., Speybroeck, N., Murray, C. J. L., & Vos, T. (2015). Disability weights for the Global Burden of Disease 2013 study. The Lancet Global Health, 3(11), e712–e723. https://doi.org/10.1016/S2214-109X(15)00069-8
Salomon, J. A., Vos, T., Hogan, D. R., Gagnon, M., Naghavi, M., Mokdad, A., Begum, N., Shah, R., Karyana, M., Kosen, S., Farje, M. R., Moncada, G., Dutta, A., Sazawal, S., Dyer, A., Seiler, J., Aboyans, V., Baker, L., Baxter, A., … Murray, C. J. (2012). Common values in assessing health outcomes from disease and injury: Disability weights measurement study for the Global Burden of Disease Study 2010. The Lancet, 380(9859), 2129–2143. https://doi.org/10.1016/S0140-6736(12)61680-8
Sprangers, M. A. G., & Schwartz, C. E. (1999). Integrating response shift into health-related quality of life research: A theoretical model. Social Science & Medicine, 48(11), 1507–1515. https://doi.org/10.1016/S0277-9536(99)00045-3
Vos, T., Lim, S. S., Abbafati, C., Abbas, K. M., Abbasi, M., Abbasifard, M., Abbasi-Kangevari, M., Abbastabar, H., Abd-Allah, F., Abdelalim, A., Abdollahi, M., Abdollahpour, I., Abolhassani, H., Aboyans, V., Abrams, E. M., Abreu, L. G., Abrigo, M. R. M., Abu-Raddad, L. J., Abushouk, A. I., … Murray, C. J. L. (2020). Global burden of 369 diseases and injuries in 204 countries and territories, 1990–2019: A systematic analysis for the Global Burden of Disease Study 2019. The Lancet, 396(10258), 1204–1222. https://doi.org/10.1016/S0140-6736(20)30925-9
Notes
Much of this section, especially the first two paragraphs, is adapted from that chapter (Peasgood, Foster, & Dolan, 2019). ↩︎
GBD 2019 doesn't report how many of the states are unique. In GBD 2017 it was 220, and 12 new causes (health conditions, roughly speaking, not health states) were added to the latest study, so I'm guessing there are about 220–240 unique states in GBD 2019. For details of DALY estimation for the 2019 Global Burden of Disease study (GBD 2019), see Vos et al. (2020, Appendix 1), or the first post in this series. ↩︎
This is a small, unpublished study in which hypothetical improvements in life satisfaction were traded off against additional years of life, using the same time tradeoff methods that are commonly used to value health states. Overall, respondents were willing to trade off more time for improvements at the bottom of the scale, and values below about 2/10 were considered worse than dead. Qualitative interviews alongside the study found that many respondents perceived the top of the scales (10/10 life satisfaction) as unrealistic, and struggled to imagine the life near the bottom of the scale. ↩︎
As evidence for the latter, the qualitative feedback included comments like: "I assume 8 and 10 are quite similar on the scale" and "once you get to 9 and 10 the difference is so small it is irrelevant." ↩︎
Of course, a GBD-style analysis like this requires far more work than simply obtaining the relevant disability weights, as discussed in Part 9. ↩︎
Something similar was done by Burnstein and colleagues (2015). A convenience sample described 62 health states using the SF-12, a popular health status questionnaire, and the results were used to estimate the severity distribution for some common conditions for the GBD studies. The SF-12 data did not generate QALYs, but this study could nevertheless constitute evidence of the feasibility of that method, particularly since their analysis could account for comorbidities. Nevertheless, even with a broader set of raters, I would still be concerned about systematic biases analogous to the ones that make preference-based weights unreliable. ↩︎
The question doesn't actually use the term "satisfaction" but it's commonly interpreted as a life satisfaction measure. ↩︎
From Mukuria & Brazier (2013):
The strong reverse effect for physical functioning and level 2 for role limitation was tested by analysing the association of the individual variables with happiness. Correlations indicate that these dimensions are negatively associated with happiness. Interactions with other dimensions were not significant. Addition of other dimensions to the model with physical functioning indicates that inclusion of vitality has a strong impact on this dimension, reducing its impact and further inclusion of mental health causes reversal of the coefficients. The vitality dimension refers to energy and is therefore correlated with physical functioning although likelihood ratio tests indicate that excluding either physical functioning or vitality does not improve the model. It is also important to note that most of the dimensions of the SF-6D have high correlations (>0.5). […]
The positive effect that occurs for dimensions/levels related to physical functioning is a statistical effect that occurs when vitality and mental health are taken into account. Individually physical functioning is negatively associated with happiness. Graham et al. (2011) and Dolan and Metcalfe (2012) also find that mobility (EQ- 5D) and physical functioning (SF-6D) are positive or close to zero in their analysis using life satisfaction and daily affect although the effect is stronger in this patient data. Other studies that have focused on non-preference-based measures of HRQoL have found that physical limitations (problems walking, seeing), had a significant negative effect only when emotional dimensions were excluded (Michalos, Hubley, Zumbo, & Hemingway, 2001; Uppal, 2006) with some indication that the effect was indirect through other dimensions such as activity limitation (Bookwala, Harralson, & Parmelee, 2003; Heyl, Wahl, & Mollenkopf, 2005). This indirect effect is a plausible explanation for the findings that we report. Further work will consider structural equation modelling to assess whether this is the case. However, this result raises a different issue with regards to which dimensions of HRQoL to include or exclude. HRQoL covers a wide range of dimensions that are often highly correlated. When modelling based on preferences for health, this may not be a problem but it can be a problem when considering broader measures such as happiness. Dolan et al. (2008) note that coefficients can change when different variables are included/excluded when analysing factors associated with well-being which is what we have found. Misspecification biases due to missing variables may lead to endogeneity problems. The two HSCs used in this analysis have broadly similar dimensions with similar outcomes for dimensions with direct overlap. However, differences in R__2 indicate that the SF-6D dimensions are better predictors of SWB in this patient group than EQ-5D. Further work is required to assess how results would differ for HSCs that include other dimensions of health such as vision and hearing. However, even where an HSC covers all the relevant dimensions, the endogenous nature of health and well-being would need to be addressed and future work should identify suitable instruments to deal with this problem. ↩︎
The new version of the SF-6D used discrete choice experiments (Mulhern et al., 2020). ↩︎
Note that the absolute values for SWB and the standard gamble cannot be unproblematically compared due to scale differences. As the paper notes:
In considering this comparison it should be borne in mind that the scales do not share the same anchors. The SF-6D scale is anchored at dead (0) to full health (1), whereas, in the case of life satisfaction, for example, the bottom of the scale represents 'not satisfied' with your life overall. The models also have a different lowest value (when all health dimensions are at their lowest level), e.g. the lowest value in the Brazier et al.[5] tariff is 0.301, whereas in the life satisfaction data it is 0.427.
The same applies to the SWB "weights" from the other studies—hence the use of quotation marks. ↩︎
Levels 2 and 4 of the pain dimension were not statistically significant, and level 2 of role functioning showed a weaker association than the (more severe) levels 3 and 4. The authors think this is due to the way those levels are described in the questionnaire, e.g., the higher levels of role functioning refer to problems with physical health, which are associated with more happiness. ↩︎
Note that the paper says these weights represent "experienced utility." However, when Kahneman coined that term he was referring to hedonic states only (Kahneman, Wakker, & Sarin, 1997), whereas this paper bases weights on life evaluations. ↩︎
Hi Derek, just in case something in there would be useful to you: https://docs.google.com/document/d/1OTCQlWE-GkY_V4V-OfJAr7Q-vJyIR8ZATpeMrLkmlAo/edit
Interesting, thanks!