Summary: Mission hedgers want to hedge the quantity of a good, but can only directly hedge the price. As a motivating example, can we mission hedge climate change using oil futures or oil company stock? Based on a cursory empirical analysis, it appears that we can, and that oil stock makes for the better hedge. But this answer relies on some questionable data (either that, or my methodology is bad).
Cross-posted to my website.
Introduction
The purpose of mission hedging is to earn more money in worlds where your money matters more. For instance, if you're working to prevent climate change, you could buy stock in oil companies. In worlds where oil companies are more successful and climate change is worse, you make more money—at least in theory. But it might be hard in practice to find a good way to hedge climate change.
Let's start with a simple example. Suppose you're considering hedging climate change by buying oil futures. Does that work?
If people burn more oil, that directly contributes to climate change. You'd like to make money as the quantity of oil goes up. If you buy oil futures, you will make money as the price of oil goes up. The problem is, the quantity and price of oil aren't necessarily related.
Before we talk about the economics of oil prices, let's clarify some terminology.
Supply and demand
The basic drivers of supply and demand:
- Consumers are willing to buy more of some product if the price is lower.
- Producers are willing to sell more of the product if the price is higher.
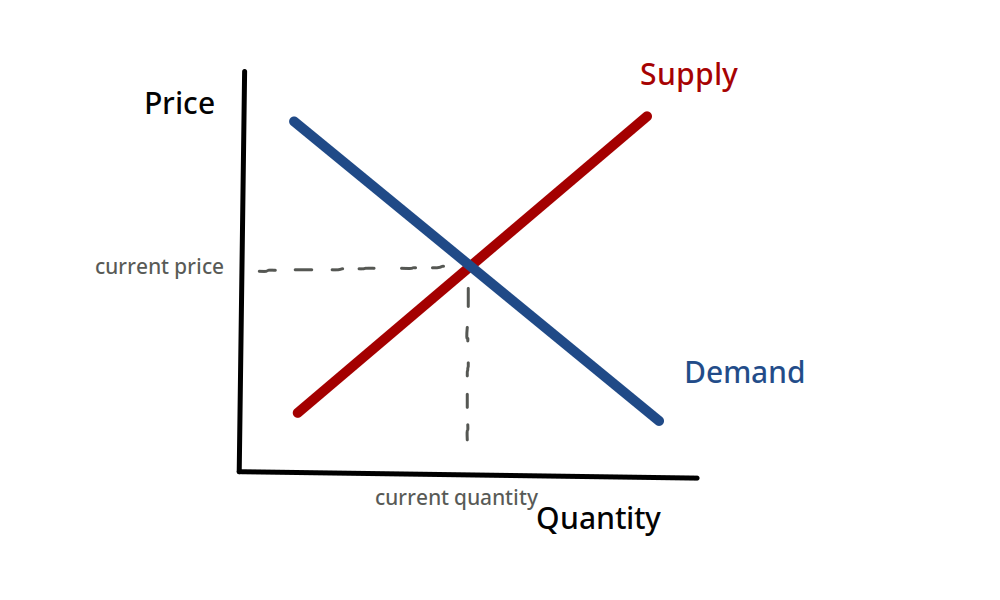
In aggregate, consumers' willingness to buy the product creates a downward-sloping demand curve, which indicates the quantity consumers will buy at any given price—or, conversely, the price they will pay for any given quantity. Similarly, producers' willingness to sell gives us an upward-sloping supply curve. These two curves cross over at some point, and that point tells us the actual market price and quantity of a product.
A poorly-drawn illustration of what the supply and demand curves look like:
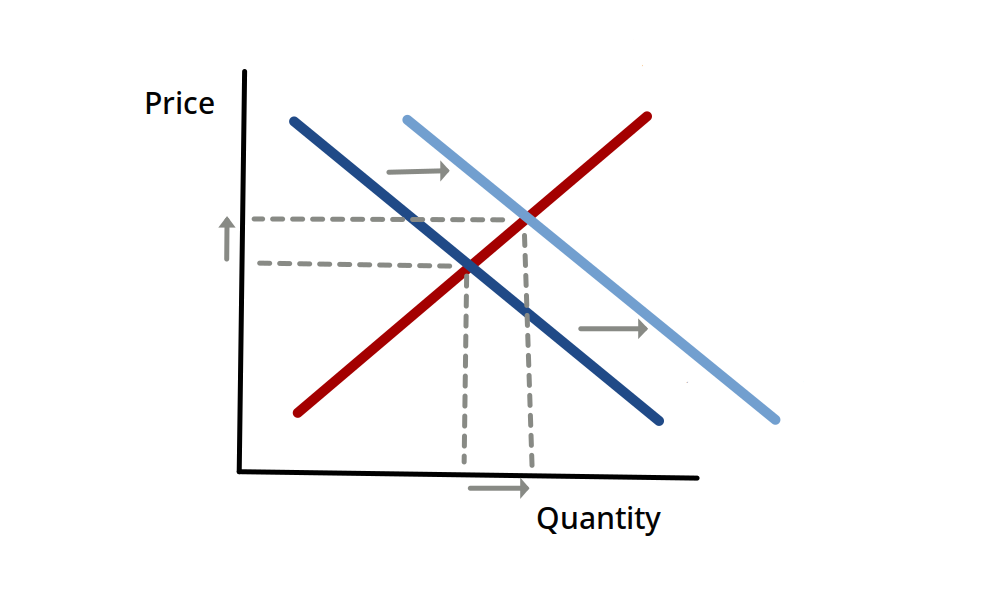
Demand for oil might increase if, say, people start owning more cars. If demand increases, both the price and quantity of the good go up:
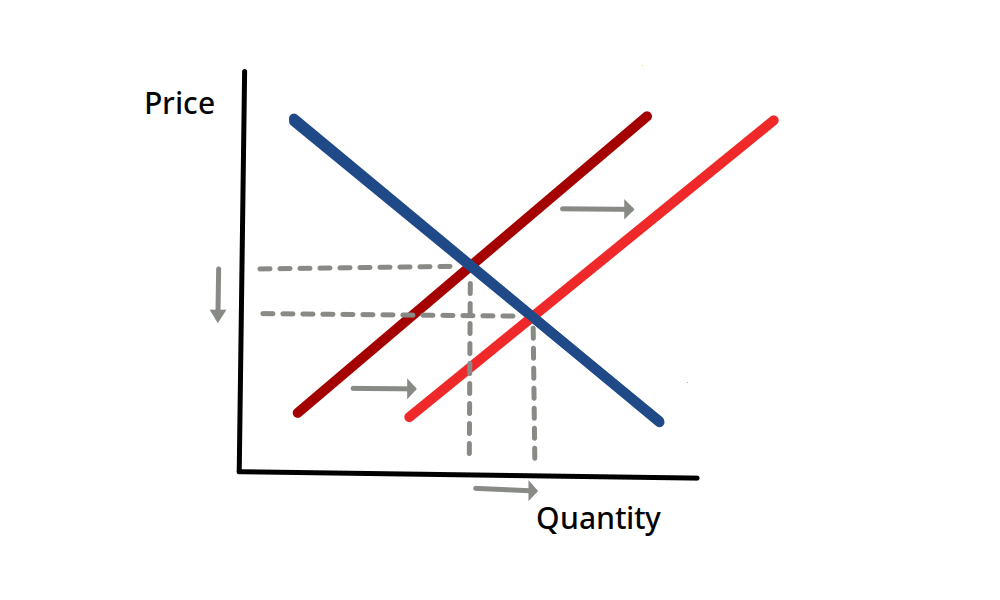
Supply increases when produces are willing to sell more. For example, supply of oil could increase if oil companies discover a new source of oil. If supply increases, quantity goes up and price goes down:
And, naturally, supply and demand can move in the other direction:
- If demand decreases, both quantity and price go down.
- If supply decreases, quantity goes down while price goes up.
Back to mission hedging
So, can we mission hedge by buying oil futures?
If we own oil futures, we make money when the price goes up. But climate change gets worse when the quantity goes up. And there's no obvious relationship between price and quantity. If demand changes, price and quantity move together. But if supply changes, price and quantity move oppositely.
If oil prices are mostly driven by changes in demand, we can mission hedge by buying oil futures. If prices are mostly driven by supply, we can hedge by short-selling oil. If supply and demand matter about equally, price and quantity will be uncorrelated and we can't use oil futures as a hedge.
What's the relationship between oil price and quantity in practice? I did about 10 minutes of research and found some data from the U.S. Energy Information Administration (EIA)'s Short-Term Energy Outlook. Based on this data, it appears that price and quantity are moderately correlated (r=0.67, p<1e-16). If this is correct, we can at least moderately hedge climate change by buying oil futures.
(I'm not at all confident that this 0.67 figure is accurate. I found a different, seemingly-reasonable data set that shows a negative correlation—see Methodological concerns.)
Hedging with oil stocks
Can we do better by buying/short-selling stock in oil companies instead?
We want to make money when the quantity of oil goes up. It takes four steps to get from quantity to stock return:
- The revenue of an oil company roughly equals [quantity of oil sold] x [price of oil].
- Profit equals revenue multiplied by profit margin.
- Companies can return value to shareholders by paying out dividends and buybacks.
- The price of a stock (theoretically) equals the long-run value of all profit that will be returned to shareholders. Stock return equals dividends plus buybacks plus price change due to changes in future expectations.
Each step in this chain [quantity -> revenue -> profit -> dividends -> stock return] leaves some wiggle room. It's not obvious that any step is correlated with the next step, much less that the first step correlates with the last.
In a perfectly competitive market, increases in revenue should incentivize competition, driving down profit margins such that profits don't change at all. So we should see no correlation between oil quantity and stock return. But markets are not perfectly competitive, so that argument might not apply in practice.
We could answer this empirically by looking at the correlation between oil stock returns and the quantity of oil consumed.
I took the Energy Information Administration data from before and combined it with historical returns for the Vanguard Energy Fund (VGENX). They had a correlation of 0.85 (p<1e-36)—much stronger than the relationship between the oil quantity and oil futures prices. (A correlation of 0.85 means changes in the quantity of oil consumption explain 72% of the variation in VGENX's price (0.85^2 = 0.72). So we might say we can hedge 72% of climate change by buying oil stock.)
How much of this comes from a correlation between oil consumption and stocks in general? It happens that oil consumption correlates with the S&P 500 at 0.83 (p<1e-33). Oil stocks barely do better, with r=0.85. However, a combined portfolio of 50% S&P 500, 50% VGENX correlates with oil consumption at r=0.96 (p<1e-68). So according to this, VGENX does provide some hedging power beyond what the S&P 500 gives.
But as with the data on oil futures, we have some reason to question this empirical result.
Methodological concerns
In an earlier draft of this essay, I didn't realize EIA had data on world consumption, so I used the closest proxy I could find—non-OPEC oil production—combined with their data on WTI real prices (GDP deflated). I found a correlation of –0.21 (p < 0.07). Later, I found EIA's data on world oil consumption and used that instead.
I would expect these two pairs of datasets to produce slightly different correlations, but I'm surprised by just how different they look. Why does one pair show a meaningful positive correlation, and the other shows a weak negative correlation? The first suggests mission hedging works pretty well, and the second suggests it barely works at all. Which one is correct?
Where does the difference come from? EIA-reported real oil prices correlate with investing.com-reported oil futures prices at r=0.95 (p<1e-42). World oil consumption correlates with non-OPEC oil production at r=0.15 (p<0.17). That's weirdly low—according to EIA, non-OPEC countries produce 60% of the world's oil, so their production should strongly relate to world consumption. This seems to suggest that non-OPEC oil production is not a good metric to look at. But also, even though EIA oil prices look very similar to oil futures prices, and oil futures prices moderately correlate with world oil consumption (r=0.67, p<1e-16), EIA oil prices only weakly correlate with oil consumption (r=0.11, p<0.33). Part of this happens due to a difference in time horizons: the VGENX, world consumption, and futures data go back to 1990, but EIA oil prices and non-OPEC production only goes to 2001. If I only include data starting in 2001, futures prices only correlate with world consumption at r=0.26 (p<0.02). This seems weird both in that it's still a lot stronger than the EIA price <> world consumption correlation, and it's much worse than the full time series (I'd expect shortening the time series to increase the p-value, but not to change the correlation much).
World oil consumption seems more relevant than non-OPEC production. But slide 7 on an EIA slideshow claims "price increases have coincided with lower consumption", which suggests the correlation should be negative, not positive. That makes me suspicious of the data on world oil consumption, or suspicious of my methodology.
It's possible that there's something wrong with my methodology. On the one hand, I don't have much experience with data analysis, so I could have made a mistake. On the other hand, all I'm doing is correlating two lists of numbers, how hard could that be?
In conclusion, I'm confused.
Questions for future research
- Why do these different data sources produce seemingly contradictory results?
- What is the portfolio with the strongest correlation to oil consumption?
- We actually want to hedge global temperature, which isn't perfectly related to oil consumption. Is there a better hedge we could use?
- How can we apply this same approach to other areas worth hedging, such as factory farming or AI progress?
Notes


Great points, thanks for raising them!
One potential takeaway could be that we may want to set up the financial products we'd like to use for hedging ourselves – e.g., by setting up prediction markets for the quantity of oil consumption. (Perhaps FTX would be up for it, though it won't be easy to get liquidity.)
Historically it has been hard to get similar products off the ground. Virtually every human has native exposures to housing prices and the overall level of GDP in their country, but for some reason virtually no-one is interested in actually trading them. According to bloomberg on most days literally zero contracts trade for even the front-month Case-Shiller housing composite future.
It's possible there might be some natural short interest for oil quantity contracts from e.g. pipelines, whose revenue is determined by the volume of oil sent through them? But this would likely be quite local, and I think you would struggle to find interest in the global quantity.