I came away with the same impression when I read it. Thanks for taking the time to highlight specific examples of misinterpretation and lack of nuance. And for running it by the original study authors.
After reading quite a bit of climate doomer literature like Six Degrees, I've become less interested in the extent of exaggeration and portrayed helplessness and more interested in why people are telling the climate story this way. It seems counter-productive. It gives fodder to opponents of action to say the problem is exaggerated. And for the scrupulous it creates noise and the possibility for over-correction or over-reaction. I'm worried the EA movement will develop a well-founded bias to dismiss or ignore studies of potentially serious climate impacts because of the extent of media exaggeration of scientific studies. Looking forward to your climate risk report which I hope will mitigate some of the effects of bad climate science writing.
He responded to my initial email, though he hasn't responded to my follow ups. I have invited him to comment if he wants. I'm not sharing his response because my understanding is that the norm is not to share private email correspondence or to give the gist of it, without his permission.
This is a crosspost from the new Animal Welfare Alignment Newsletter by Anima International. You can subscribe on Substack if you are interested in following these efforts. Audio reading also available on Substack.
The goals of this post are to:
1. Raise a question I see as crucially important to the goal of aligning AI to animal welfare...
Hello! I'm Justin Portela. I got hired by GWWC to make YouTube videos after AI in Context did such a kickass job.
My channel is using that same cinematic, high-production value beauty to talk about everything in the EA universe that isn't AI.
...
This is a linkpost for Request for Proposals: Research and Applied Work on Digital Minds.
I'm glad to announce a request for proposals for research and applied work on digital minds at Longview Ph...
Reviewed work: Mark Lynas, Our Final Warning: Six Degrees of Climate Emergency, HarperCollins Publishers (2020).
In the new edition of his book Our Final Warning: Six Degrees of Climate Emergency, Mark Lynas argues climate change will be truly catastrophic. He claims that, at 4°C above pre-industrial levels, advanced industrial civilisation would be tottering (p. 168). At 5°C, humanity would cling on in small refuges surrounded by deserts, forests in flame and rising seas (p. 222). At 6°C, we face possible human extinction (p. 262ff).
I am a fan of Lynas’ other work on nuclear power and GM food. I have invited him to speak at several events. I recommended him as a guest for the 80,000 Hours podcast and introduced him to the team there. Like Lynas, I also think climate change is an important problem: I helped to set up the Founders Pledge Climate Change Fund, which has moved millions of dollars to climate change charities.
However, in my opinion, Six Degrees is very disappointing. Throughout, Lynas misinterprets evidence and ignores nuance. The consistent effect that this has is to bias his conclusions in a pessimistic direction.
I shared this post with Mark Lynas before publishing. Thanks to Max Daniel and Abie Rohrig for comments.
1. Misinterpreted evidence
Throughout Six Degrees,Lynascites up-to-date peer reviewed science to support its claims. However, Lynas often misinterprets studies that are key to his conclusions, sometimes dramatically so. Moreover, he almost always fails to consider the extent to which people in the future might be able to adapt to climate change using new technology or increased wealth.
I will discuss three examples. The first two are egregious, but are representative of how Lynas uses evidence in Six Degrees.
The US Dust Bowl and crop yields
Lynas provides this overview of Glotter and Elliot (2016):[1]
“When droughts are added into the picture, the future for food production looks even scarier. The authors of one recent paper analysed the US Dust Bowl of the 1930s and then factored in the temperature increases expected later this century from global warming. While the worst Dust Bowl years led to crop losses of up to a third between 1933 and 1939, add in four degrees of warming and the losses soar to 80% or more. Just the warming effect on its own would mean that a typical year would see yields equivalent to the terrible Dust Bowl year of 1936. The researchers warn in the paper’s introduction that ‘damages at these extremes are highly sensitive to temperature, worsening by ~25% with each degree centigrade of warming.’ For four-degree temperature rises, losses could therefore be reaching 100%, obliterating the entire harvest. These conclusions hold not just for maize in the central Dust Bowl area, but for wheat, soy and other crops across the Great Plains and Midwestern states. Four degrees of global warming, in other words, turns virtually the entire area that produces crops in the US into a Dust Bowl state.” [My emphasis] (p. 192)
This misunderstands the Glotter and Elliott (2016) study in several important ways. Glotter and Elliott (2016) explore what the effects of warming would be on the assumption that dust bowl conditions - similar to the extreme droughts experienced in the US in the 1930s - reemerge. This study does not say that warming would cause dust bowl conditions to reemerge.
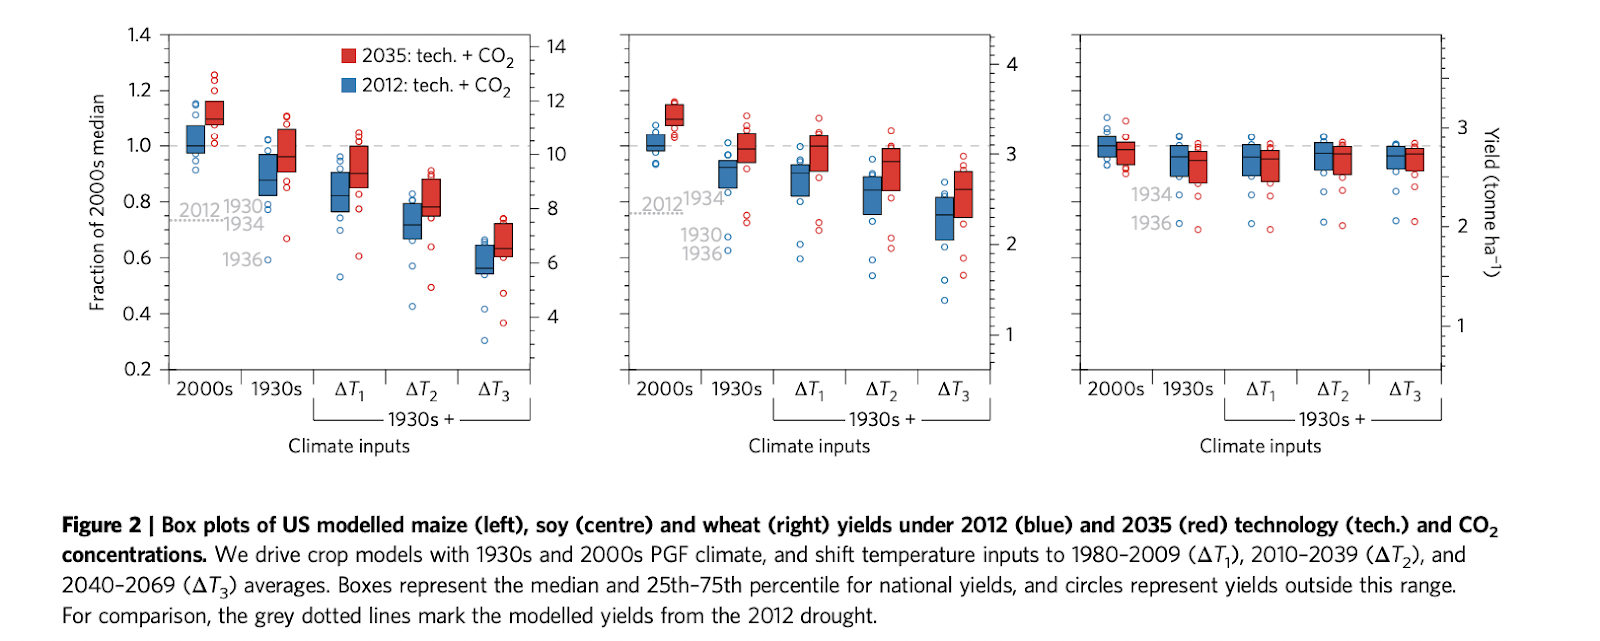
Furthermore, it is simply not true to say that the study shows that the entire US harvest of maize, soy and wheat would be obliterated at 4°C. The actual findings of the study are shown below:
Michael Glotter and Joshua Elliott, ‘Simulating US Agriculture in a Modern Dust Bowl Drought’, Nature Plants 3, no. 1 (12 December 2016): 1–6, https://doi.org/10.1038/nplants.2016.193
The relevant parts of this Figure are the red bars and red dots. They show the yield loss assuming:
1930s Dust Bowl drought conditions.
Different levels of warming above 1930s levels.
2035 levels of CO2 and technology, on RCP8.5 (which is the high emissions scenario considered by the IPCC).
The 3 columns on the right therefore ask “what if we had 1930s type climate but 1 or 2 or 3 degrees warmer?” The chart shows that for 2035 technology and CO2 level, and for 1936 levels of drought:
For maize: the median yield loss increases from 30% at 1930s temperatures to 60% for when temperatures are 3°C higher.
For soy: the median yield loss increases from 25% at 1930s temperatures to 45% for when temperatures are 3°C higher.
For wheat: the median yield loss is roughly constant at 30%, regardless of warming.
The 25% loss per degree centigrade that Glotter and Elliott refer to in the abstract is not a percentage point decline in yield, but rather the increase in the yield loss due to warming, as a percentage of the original 1930s yield loss. Moreover, it would be clear to anyone who had read the paper that this decline does not apply to wheat, as Lynas suggests.
I emailed the authors of the paper and they told me that Lynas’ interpretation of their work is “definitely not correct”.
Canadian crop yields
When discussing the findings of Qian et al (2019), Lynas says
“The latest projections, published in Environmental Research Letters in 2019, now show that even Canada – once the great hope of future food production – will see production declines of wheat, canola and maize once global temperatures pass 2.5°C.” (p. 141)
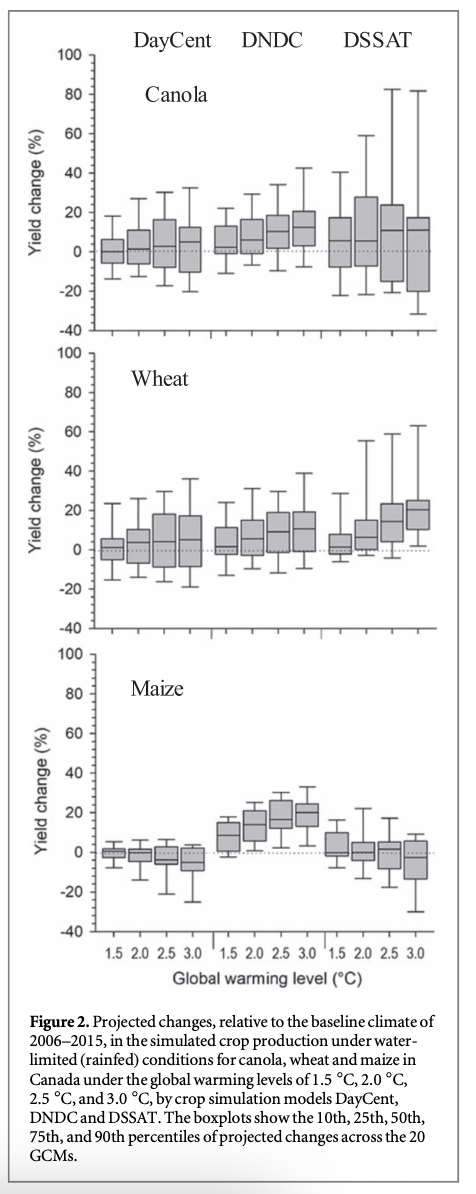
Here is the figure from Qian et al (2019) summarising their findings:
Source: Qian et al ‘Climate change impacts on Canadian yields of spring wheat, canola and maize for global warming levels of 1.5°C, 2.0°C, 2.5°C and 3.0°C’ Environ. Res. Lett. (2019)
These findings clearly do not show that yields of all three crops will decline at 3°C of warming. It would have been more accurate to say that for 3°C of warming:
For wheat: yields are higher relative to today and relative to 2.5°C.
For canola: median yield is higher relative to today on all models, and mean yield is higher on two of the models. Relative to 2.5°C, the median projected yield is higher on two models and similar on one model, though uncertainty increases with higher levels of warming
For maize: One of the models projects that maize yields would increase, while two project a small median decrease, though uncertainty increases with higher levels of warming.
Moreover, these findings are overly pessimistic because they do not account for the introduction of new crop cultivars which might be better suited to a warmer environment.[2] Indeed, it is important to point out the wider context that, at the global level, yields for the major food crops have increased by more than 200% in all regions over the last 60 years, despite warming of around 1°C.
I emailed lead author Budong Qian about Lynas’ interpretation of his paper. He told me that Lynas’ interpretation of their study is not correct.
Drought in the Mediterranean
Lynas summarises the findings of Samaniego et al (2018)[3] as follows:
“according to projections published in 2018, the average Mediterranean drought will last a decade or more when three degrees is reached.” (p. 137)
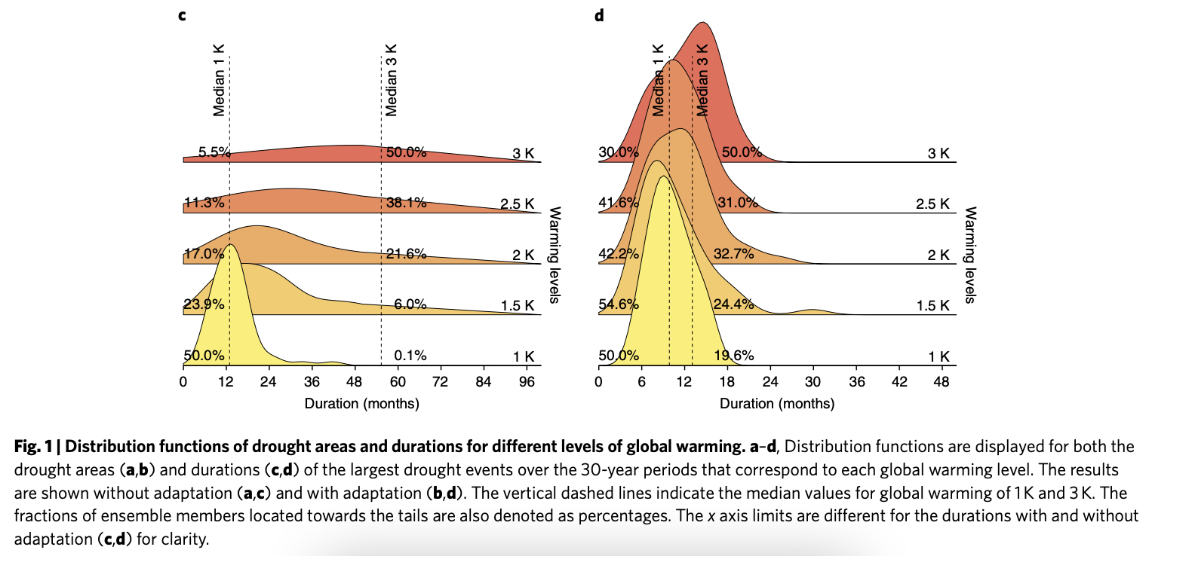
This is what Samaniego et al (2018) find, on the assumption that no adaptation measures are taken to counteract drought. The contrast between their findings with and without adaptation is shown below. The effects on drought duration across the whole of Europe without adaptation are shown on the bottom left, and with adaptation on the bottom right. Note that the x-axis scale on the right is half as long as the one on the left.
L. Samaniego et al., ‘Anthropogenic Warming Exacerbates European Soil Moisture Droughts’, Nature Climate Change 8, no. 5 (May 2018): 421–26, https://doi.org/10.1038/s41558-018-0138-5.
The figure above shows drought duration across the whole of Europe and not just the Mediterranean; Samaniego et al (2018) do not specify how long the average Mediterranean drought would last at 3°C of warming, with adaptation. But the figure does show that droughts will last for less than two years everywhere in Europe. There would also be clear incentives for Mediterranean countries to take the adaptation measures required.
Even if one thinks they would not take the adaptation measures, the context above should be provided to the reader. The problem here is not misinterpretation of key findings, but rather lack of crucial nuance. If we want to understand climate risk, we need to understand likely impacts given how people are likely to respond.
How widespread is the misinterpreted evidence?
The examples I have given above are not cherrypicked examples of Lynas' worst mistakes. Lynas' interpretation of most of the scientific evidence that he surveys is similarly biased. For instance, the dust jacket of Six Degrees includes the following claims, among others:
3 DEGREES
Global food crisis
Amazon rainforest collapse
4 DEGREES
Much of China and India uninhabitable
5 DEGREES
Humans reduced to polar refugees
6 DEGREES
Possible human extinction
These claims are false, extreme exaggerations, or held only by a small minority of climate scientists. I am writing a long report on climate risk, which will discuss such claims in more depth. It is currently being reviewed by experts and will be released in the autumn. In the meantime, I hope that the summary I have provided here gives some indication of how Lynas treats the scientific evidence.
2. Misleading paleoclimate analogues
Throughout Six Degrees, Lynas compares future levels of warming to episodes from our paleoclimate past, i.e. in the distant past before we had instrumental data. The way he does this is very misleading.
Five degrees and the Paleocene-Eocene Thermal Maximum
Lynas argues that the best paleoclimate analogue for 5°C of warming is an event known as the Paleocene-Eocene Thermal Maximum. He writes:
“As we enter the five-degree world, we have now made the planet hotter than at any point for over 50 million years. The closest geological analogue for our new super-greenhouse climate is a ‘hyperthermal’ event that took place at the boundary of the Palaeocene and Eocene epochs, about 56 million years ago, when the planet’s temperature rose between five and nine degrees alongside CO2 levels of 1,000–2,000 ppm. The Palaeocene–Eocene Thermal Maximum (PETM) has long provoked interest among climate scientists because it closely parallels the world we will be heading into if we continue to rapidly increase our consumption of fossil fuels. This was an inhospitable and violent world, barely recognisable from the Earth humans have always known” (p.226)
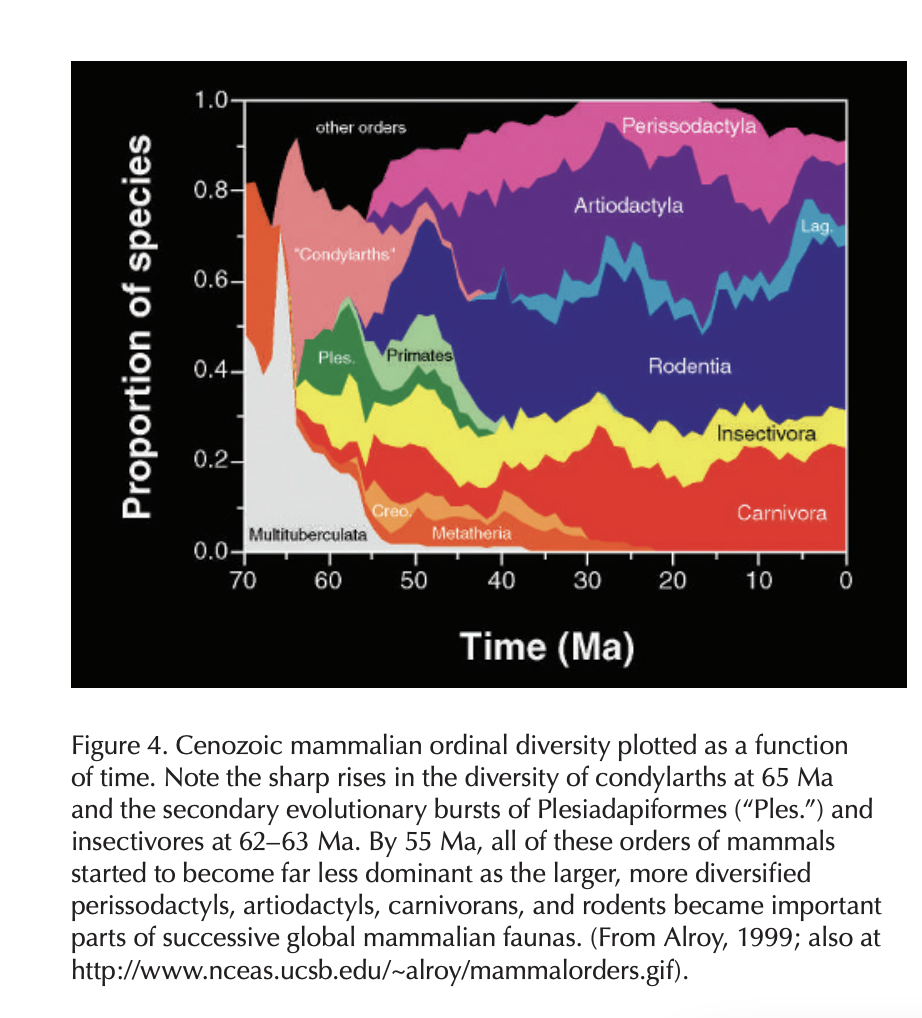
Over the next 12 pages, Lynas discusses various environmental impacts experienced during the Paleocene-Eocene Thermal Maximum and early Eocene, painting a generally catastrophic picture. In my view, this picture is not accurate. It is true that ocean ecosystems were damaged, with declines in the abundance and diversity of some species.[4] Still, the only thing that went extinct were benthic foraminifera, single-celled organisms that live in the deep ocean.[5] No fish went extinct, there were no land-based extinctions, and the Eocene was in many respects a time of ecological flourishing:[6] the name “Eocene” comes from the Ancient Greek ēṓs, ("dawn"), and kainós, ("new") and refers to the "dawn" of modern ('new') fauna that appeared during the epoch.[7]
For example, there was a sharp increase in ordinal diversity from the start of the Eocene:
Source: David E. Fastovsky and Peter M. Sheehan, ‘The Extinction of the Dinosaurs in North America’, Gsa Today 15, no. 3 (2005): 4–10.
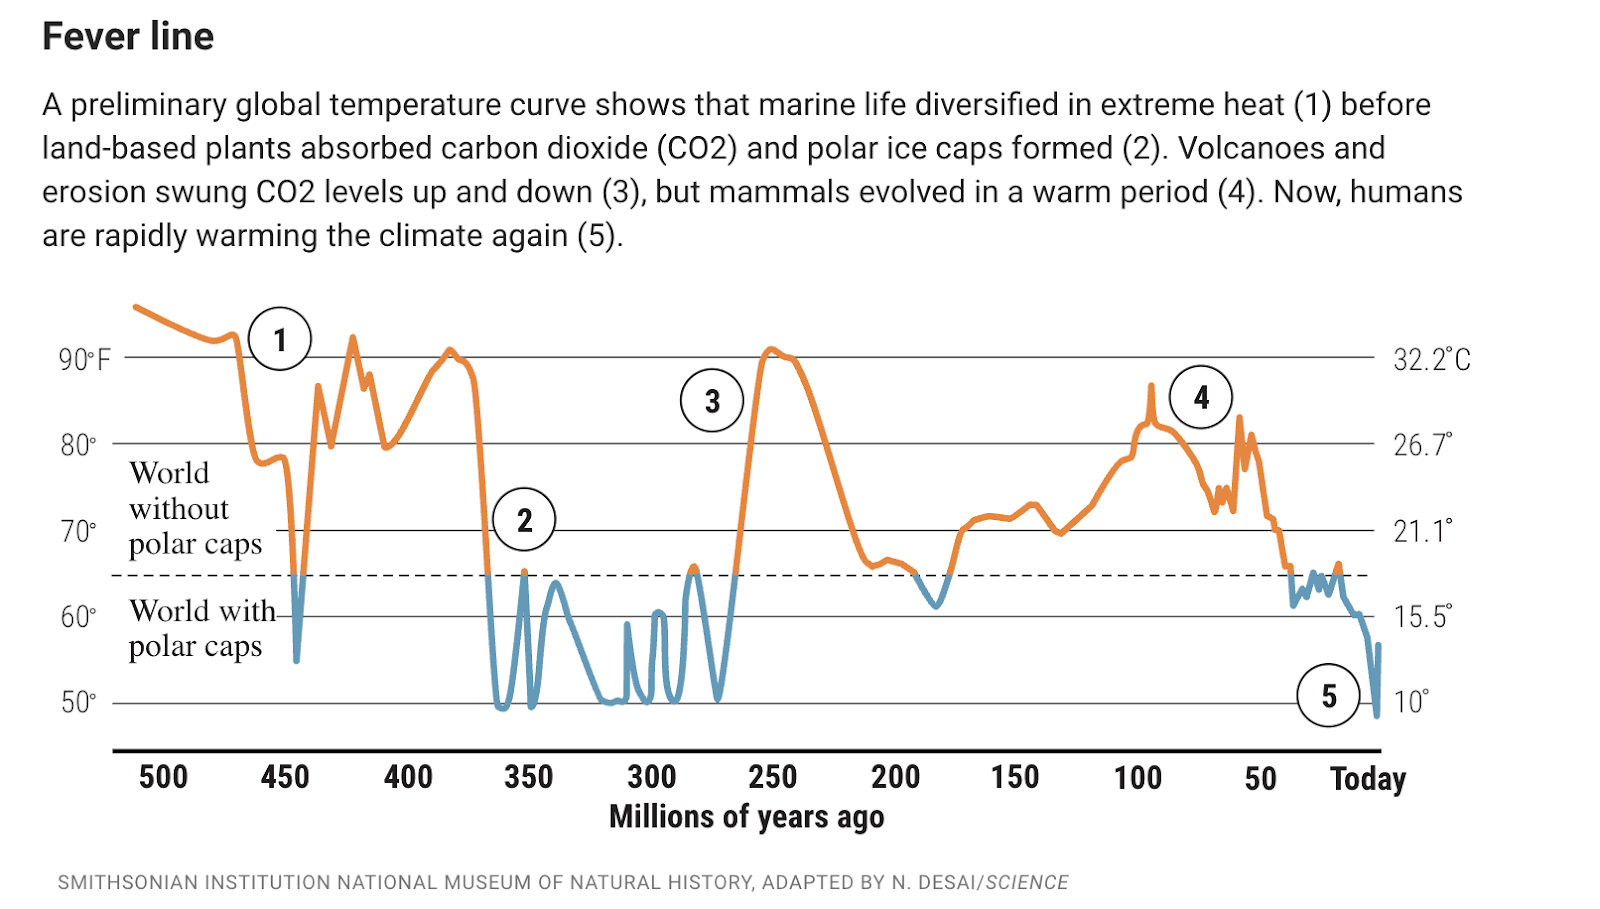
But the more important point, which Lynas does not mention in his 12 page discussion of the PETM, is that the PETM was seventeen degrees warmer than pre-industrial times, not 5°C warmer.[8] The chart below from the latest IPCC report (Working Group I) shows global temperatures over the last 60 million years:
IPCC, Climate Change 2021: The Physical Science Basis, Working Group I, Assessment Review 6, Chapter 2,Cross-Chapter Box 2.1, Figure 1.
It is true that during the PETM, temperatures rose by 5°C, but this was on top of a background climate that was 12°C warmer than pre-industrial levels. This renders almost all of Lynas’ discussion of the ecological effects of the PETM and early Eocene irrelevant.
First, Lynas discusses impacts on land. He says that during the Paleocene-Eocene Thermal Maximum, the land surface was denuded by desertification and extreme floods.[9] Lynas comments on one denuded area in Spain.
“These [flood] deposits were all located at a similar latitude 55 million years ago, so the Spanish PETM remains provide a plausible glimpse into the future for the Mediterranean region as our climate once again moves into an extreme greenhouse regime.” (p. 228)
There is a differenceof 12 degrees celsius between the Paleocene-Eocene Thermal Maximum and warming of 5°C above pre-industrial levels, so this statement is not correct.
Second, he discusses how during the early Eocene there was sub-tropical flora and fauna in the Arctic and Antarctic. At no point does Lynas explain to the reader that such changes are not at all on the cards of five degrees of warming. This is highly misleading.
Finally, Lynas discusses how PETM warmth was very bad for marine life because it would have exposed marine life to thermal stress and ocean anoxia. Lynas notes that tropical sea temperatures during the PETM probably exceeded 40°C, whereas equatorial sea temperatures today have an annual mean temperature of around 25°C to 30°C.[10] Sea temperatures above 36°C ‘are considered uninhabitable for most marine eukaryotic [higher] organisms today’ (p. 231). Lynas notes that “With water temperatures so high, the PETM oceans also began to haemorrhage oxygen, leading to widespread anoxia”, (p. 233) which is again damaging to marine life.
Lynas concludes by saying
“All told, the extreme climate would have collapsed the marine food chain, wiping out multicellular organisms from most of the Earth’s seas. Needless to say, this does not provide a happy model for our hotter future.” (p. 233)
The impacts that Lynas highlights - thermal stress and ocean anoxia - depend primarily on how hot it is, not on the speed of warming. So, it is obviously relevant that the PETM was 17°C warmer than today, rather than 5°C warmer than today.
Lynas argues that the rate of warming is an important determinant of impacts on ecosystems, which is true. However, the absolute level of temperature is also very important, which undermines most of Lynas’ arguments.
Six degrees and the end-Permian extinction
The mass extinction at the transition from the Permian period to the Triassic 252 million years ago coincided with huge carbon release from the Siberian Traps volcanic event. This was the greatest ecological disaster of all time.[11] Lynas argues that it is an apt paleoclimate analogue for 6°C of warming. Consequently, unless we change course, we risk ushering in something close to Hell on Earth:
“Superimpose what palaeoclimatic science tells us about conditions at the Permian–Triassic boundary onto Earth today and we can try to visualise at least some of the scenes. Imagine all the world’s forests burning simultaneously, from the Arctic to the equator. Night fails to fall, as the world is lit by flames. When the smoke clears away, all that is left of the world’s once-teeming tropical forests and snow-covered boreal woodlands is a layer of soot and charcoal spread thickly on the bare ground. Imagine all the resulting dead and dying plant remains being washed into the oceans by monsoons of biblical intensity. The layers of wood and debris combine with the carcasses of animals to form floating mats that wash up with the dead tides along the world’s shorelines. The heat is so extreme that only a few animals can survive, hidden in burrows from the fierce daytime sun, or cowering in cooler nooks and crannies along rocky watercourses. Ecosystems and food webs cease to exist in any functional sense. In the daily battle for survival, the big winners are those that feast on the dead – detritivores, bacteria and fungi.” (pp. 260-261)
The case of the Permian is somewhat different to the PETM because the initial Permian warming event in which many of the extinctions occurred was closer to the current climate. This is shown on the chart below from Wing and Huber, which shows, in broad brush strokes, global temperatures over the last 500 million years:
Over the course of the whole Permian-Triassic extinction event, there was warming of upwards of 20°C,[12] and global average surface temperatures were upwards of 17 degrees hotter than today.
Lynas argues that the end-Permian is an appropriate analogue because the initial warming pulse at the end-Permian was 6°C (p. 259). This would have indeed occurred when global temperatures were relatively close to the present day. However, many of the impacts that Lynas discusses were felt during the extreme heat at the end of the Permian-Triassic disaster and temperatures were upwards of 17°C above pre-industrial levels. For example, in the passage I quoted above, Lynas says “The heat is so extreme that only a few animals can survive, hidden in burrows from the fierce daytime sun, or cowering in cooler nooks and crannies along rocky watercourses.” Even if this were what the world was like in the Permian, temperatures were upwards of 17°C higher, not 6°C higher, so it is almost completely irrelevant to the potential impact of 6°C.
It is an interesting and important question why carbon release and warming caused such huge extinctions during the end-Permian and at other times, but didn't during the PETM or at other times in the last 145 million years. There is a high quality and nuanced treatment of this question in Paul Wignall's The Worst of Times, which I review here, and will discuss in my forthcoming report on climate risk.
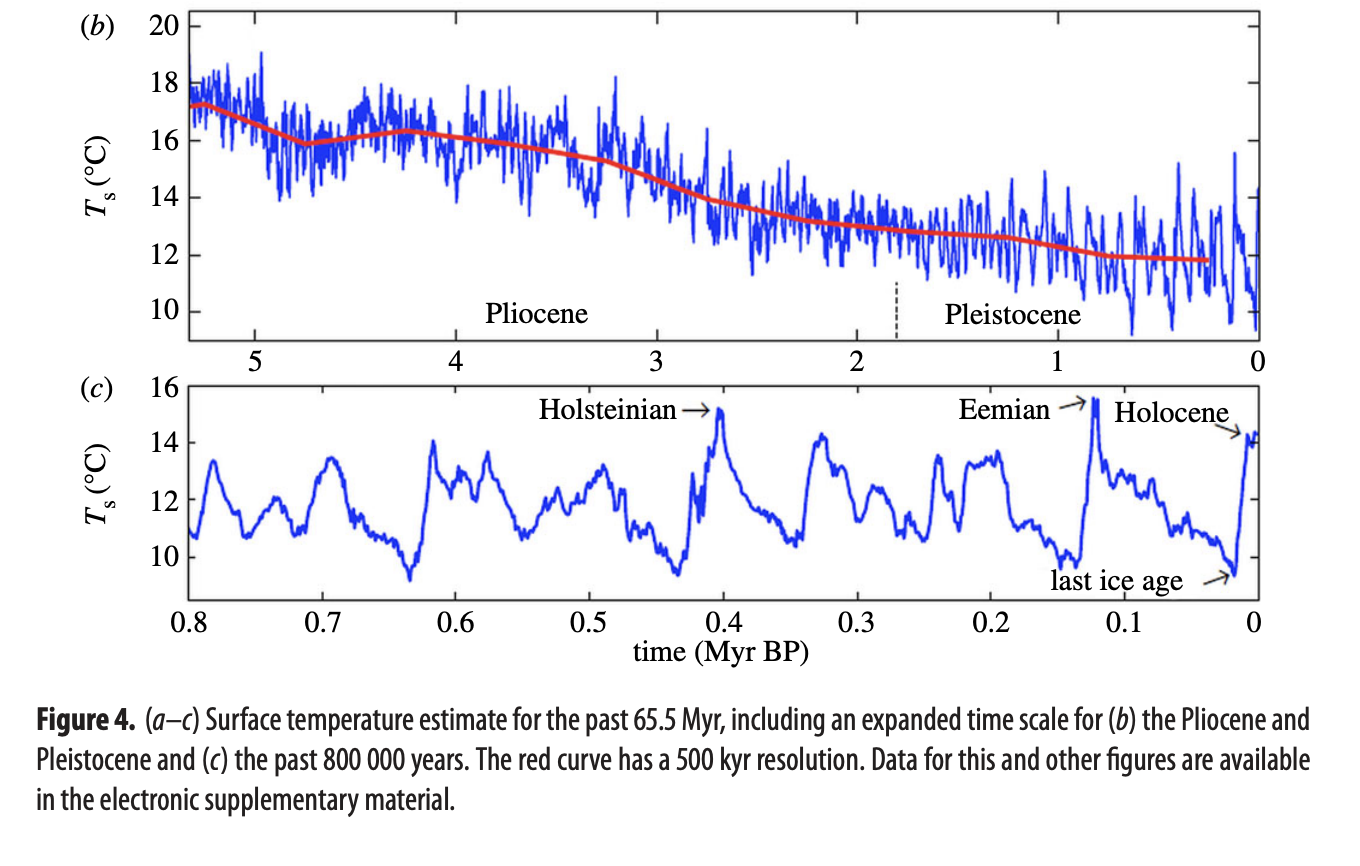
If Lynas' view is that the magnitude of the temperature increase is what matters, regardless of the baseline it is from, then it is not clear why he would focus on the paleoclimate analogues that he does rather than on the various other times that global temperatures increased by 4°C to 5°C in geologically short periods. For instance, here is one rendering of global temperatures over the last 5 million years:
James Hansen et al., ‘Climate Sensitivity, Sea Level and Atmospheric Carbon Dioxide’, Phil. Trans. R. Soc. A 371, no. 2001 (28 October 2013): 20120294, https://doi.org/10.1098/rsta.2012.0294
As this shows, global temperatures have increased by 4 to 6 degrees over a geologically short period of time several times over the last 800,000 years as the world has cycled in and out of glacial and interglacial periods. Indeed, anatomically modern humans had already evolved and survived through two such transitions: into the Eemian interglacial, and from the last ice age into the Holocene, our current interglacial.
It might reasonably be argued that the baseline from which warming happens is also important. Indeed so. But the same criticism could be made of Lynas' treatment of the PETM and of Permian warming.
Conclusion
Lynas’ aim in Six Degrees seems to be to motivate people to take action on climate change. I agree that this is a laudable aim. However, it is important that while we do this, we are as faithful to the science as possible. Six Degrees falls well short on this front.
Michael Glotter and Joshua Elliott, ‘Simulating US Agriculture in a Modern Dust Bowl Drought’, Nature Plants 3, no. 1 (12 December 2016): 1–6, https://doi.org/10.1038/nplants.2016.193
“As stated previously, these projections are based on current crop cultivars. Proactive adaptation measures including the introduction of new cultivars, which can take advantage of an extended growing season and increased crop heat units, would result in larger increases in crop yields.” Budong Qian et al., ‘Climate Change Impacts on Canadian Yields of Spring Wheat, Canola and Maize for Global Warming Levels of 1.5 °C, 2.0 °C, 2.5 °C and 3.0 °C’, Environmental Research Letters 14, no. 7 (July 2019): 8, https://doi.org/10.1088/1748-9326/ab17fb
“We attribute a massive drop in dinoflagellate abundance and diversity at peak warmth to thermal stress, showing that the base of tropical food webs is vulnerable to rapid warming.” Joost Frieling et al., ‘Extreme Warmth and Heat-Stressed Plankton in the Tropics during the Paleocene-Eocene Thermal Maximum’, Science Advances 3, no. 3 (1 March 2017): e1600891, https://doi.org/10.1126/sciadv.1600891.
“For years scientists considered the PETM to be the supreme example of the opposite extreme: the fastest climate shift ever known, rivaling the gloomiest projections for the future. In that light, the PETM’s outcomes did not seem so bad. Aside from the unlucky foraminifera in the deep sea, all animals and plants apparently survived the heat wave—even if they had to make some serious adaptations to do so. Some organisms shrank. In particular, mammals of the PETM are smaller than both their predecessors and descendants. They evolved this way presumably because smaller bodies are better at dissipating heat than larger ones. Burrowing insects and worms, too, dwarfed.” Lee R. Kump, ‘The Last Great Global Warming’, Scientific American 305, no. 1 (2011): 56–61.
"Persistence therefore appears to have been the predominant response in the plant fossil record for this warm interval in Earth’s history." K. J. Willis and G. M. MacDonald, ‘Long-Term Ecological Records and Their Relevance to Climate Change Predictions for a Warmer World’, Annual Review of Ecology, Evolution, and Systematics 42, no. 1 (2011): Fig. 2, https://doi.org/10.1146/annurev-ecolsys-102209-144704
“A major new compilation of proxy temperature data (Hollis et al., 2019) analysed using multiple statistical approaches (Inglis et al., 2020) indicates that GMST was 10°C–25°C (90% range) warmer than 1850–1900, or about 5°C warmer relative to the pre-PETM state. A related synthesis study also estimates that PETM warmed by 5°C (no uncertainty assigned; Zhu et al., 2019). A recent benthic isotope compilation (Westerhold et al., 2020) transformed to GMST based on the formulation by Hansen et al. (2013c) (Cross-Chapter Box 2.1, Figure 1), and adjusted to 1850-1900 by adding 0.36°C, shows an increase of GMST by about 10°C during the PETM.” IPCC, Sixth Assessment Report: Working Group I The Physical Science Basis, sec. 2.3.1.1.1.
“All these regions suggest that the land surface was devastated and denuded by a deadly sequence of desertification and extreme floods. One can only imagine the intensity of the heatwaves that accompanied them.” (p. 228)
Yadong Sun et al., ‘Lethally Hot Temperatures During the Early Triassic Greenhouse’, Science 338, no. 6105 (19 October 2012): Fig. 2, https://doi.org/10.1126/science.1224126.
“With 90% marine species loss, widespread devastation on land including the only recorded mass extinction of insects it is Earth's greatest ever biotic crisis.” Bond and Grasby, ‘On the Causes of Mass Extinctions’, 10.
P. B. Wignall, The Worst of Times: How Life on Earth Survived Eighty Million Years of Extinctions (Princeton: Princeton University Press, 2015), p. 97-98.


Mark Lynas also said it was "now or never" for climate action in 2005. This kind of messaging is just wildly miscalibrated and counter-productive.