There is one part of the model that I disagree with:
When looking closely at the US cage-free campaigns, only one (Whole Foods) out of the 20 companies affecting the highest number of hens has switched to cage-free (though most deadlines are for planned for 2025). Those companies account for 66% of hens that, in theory, would be affected by the campaign. Which means that companies that met their deadline (average of 54% rate globally, across different issues), had a smaller impact that the 20 that didn’t follow through. 5% of pledges is going to affect 66% of hens. That might suggest that enforcement will become more difficult as reforms become more significant for the animals and more costly to the industry.
You then use this in the model as a piece of evidence about the expected follow-through rate of all corporate commitments: All other top 20 companies (with a possible exception of Costco which seems to be close to being cage-free anyway) have their deadlines set in the future, as you say, mostly 2025. You can’t say that they did not follow-through, we just have to wait until 2025 and see if they will, nobody expected them to be 100% cage-free this early. If I were you, I would remove this cell from the model.
Thank you for the suggestion. I agree that we can’t extrapolate the conclusion about predicted follow-through rate based on what percentage of companies have followed through on the commitment so far. I looked at it again, and I think that if analyzed correctly it still provides valuable information, so I will leave it in the model, but I’ll move it to the section on updates based on qualitative data and change the values based on the information below. I think that a good proxy for the information is whether the top 20 biggest companies are making progress and will eventually switch is if they responded to EggTrack. We can break it down to: * Companies that passed their deadline: Whole Foods (2004) - 100% follow-through Costco (2018) - as of July 2017, 78% and 100% converted to liquid *Those that didn’t respond to EggTrack are Walmart, Albertsons, McDonald’s, Target, Sysco, ALDI, Burger King, Tim Hortons, Southeastern, and Wendy's. * Those that did respond and reported progress: Kroger (21% as of 2017), Publix (50%), SUPERVALU (as of 2016, 12%) * Those in 20 that I do not have information on US Foods, IGA, Inc., Associated Grocers of Florida.
I will estimate the value in this cell based on this information unless you have info that could fill in the gaps.
I generally think that with all very uncertain estimates, whatever the result, it should be only treated as a cautious update and be combined with prior estimates of value.
As a meta comment, I think I’m less concerned about an error in one of the parameters than you seem to be because of the different goals of the research. My goal is to reach broadly good conclusions about which intervention should be executed from a given list of options given a limited amount of time, rather than get the right answer to a specific question, even if it takes me an extremely large amount of time. I think that using cluster approach is superior in such cases. If you are using cluster approach, the more perspectives you take into account the lower the odds of your decision being wrong, and so I trade other aspects (eg. number of interventions compared in a given time frame and how accurate a single estimate need to be) differently. One contradicting factor also cannot overpower the whole decision, etc. A completely different method should be used when we are trying to have as accurate beliefs about the world as possible vs getting to a good decision.
I think I’m less concerned about an error in one of the parameters than you seem to be because of the different goals of the research.
Just to be clear, I wasn't concerned about the error, I saw that deleting the cell and then making other appropriate changes increases the estimated probability by only 3%. I only commented about it because I thought that it is easy to fix. I agree that the approach you chose has its benefits.
I love the set of summaries in the main report, as well as the color-coding. I've suddenly learned a lot more about a topic that really interests me -- thanks for posting!
However, I'm confused about the step where all of these color-coded possibilities turn into a chart with probability distributions, and I wish I could learn more about the Guesstimate model.
In particular, seeing reviewers' comments on individual cells would be great -- why did two different people estimate that "probability that all companies defect in a Prisoner's Dilemma scenario" was ~100 times as meaningful a consideration as "what. ACE thinks makes an effective campaign"?
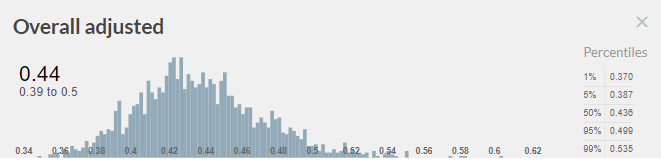
It also took me a while to parse how the "qualitative update" figure meshed with the "quantitative update" figure to create the final 0.44 number.
One other specific question (which stands in for several I had reading the model): Why are farmers' opinions about the industry weighted equally with observed evidence about what companies are actually doing? I can see the appeal of evenly weighting all major factors for simplicity, but in general I like to rely on observed evidence much more than opinion surveys, and I would assume CE has the same preference. (I may be misunderstanding something about the model, though!)
When it comes to the step between research questions and the probability distribution, full research, answering each question, can be seen in the full report. In the report, we also address some of the concerns you have with the judgement calls on each of the “qualitative” parameters.
Each update incorporates the weight we put on this factor, the directionality and strength. Those factors, again, rely on other information. With the example, you cited ”what ACE thinks makes an effective campaign” vs “probability that all companies defect in a Prisoner's Dilemma scenario". For example, ACE’s opinion on the importance of public support when launching corporate campaigns is formed based on the intervention report they have researched in November 2014, and as they currently claim “is not up to our current standards.”. The landscape has changed since then. As of recent, we can observe that there is a strong track record of successful corporate campaigns in countries where the society didn’t have sympathetic views toward animals (e.g. Lithuania or Japan). I think we can rely more and more on rigorous and generalizable conclusions from research on real-life examples and on the application of game theory to predict the behaviour of the companies.
I agree I wish we had enough time to flesh out the reasoning for each of the factors. Sadly, due to limited time we are constantly having to make trade-offs about whether we should put time into explaining the reasoning more deeply to the broader community vs discussing with the CE candidates vs researching more to get a deeper internal understanding. We generally plan on going deeply into these factors with the specific entrepreneurs looking to start this project or others, who are going to work/are working in the field in the near term, but not publish much more on the topic publicly after our full report.
I’m a little puzzled about how to interpret the results though, and it’s related with a maths problem that I’ve been confused about for a while. However, I have to warn that this is confusing and it might be counterproductive to think about it because of that.
Do you mean that if you start a new campaign for a new ask, then you expect 39% - 50% of companies that make commitments to follow through? If that is the case, the confidence interval seems to be very narrow. My 90% Subjective Confidence Interval (SCI) for that would be 0% - 100%. For example, there can be commitments like stopping chick culling which depend on the creation of new technologies. Scientists might fail to create such technologies in which case it’s 0%. Or they might make them very cheap and then everyone fulfils their commitments (100%).
Another way to interpret the result is that it is your subjective probability that a given company will follow through. But then I’m not sure it makes sense to have a 90% SCI of what your own subjective probability is. What would that even mean? How would you check that the true value is in the confidence interval?
But even if in your cost-effectiveness estimate you would use a point estimate (44%) instead of a SCI (39% - 50%) for the probability, I wouldn’t be sure about how to interpret the results. The result would still be a SCI because you will probably use SCIs in other parts of your calculations. But then that wouldn’t be a 90% SCI of the number of animal affected. It would be a 90% SCI of the expected value of the number of animals affected. But then again, I don’t know how to interpret a 90% SCI of an expected value.
I think that one way to model cost-effectiveness in a way that makes mathematical sense is to have a probability distribution of the percentage of companies that will follow through. The distribution would have some weight on 0%, some weight on 100% and some weight in between. Another way would be to use point estimates everywhere and say that it is an expected value. Of course, no one will die if you mix these two things, but the result might be difficult to interpret.
If anyone thinks that my reasoning here is wrong, I’d be very curious to hear because I encounter this problem quite often nowadays. And currently I am making a cost-effectiveness model of corporate campaigns myself, and I don’t quite know what to do with the uncertainty about following through...
I agree that there is no obvious way to model it and the method would even depend on the goal of the model, and it might not necessarily cross-apply to seemingly similar cases.
The estimate reflects a probability distribution of the percentage of corporations that have pledged a welfare improvement that will follow through on those pledges. Note here that it doesn’t inform about what percentage of companies in a country that the organization operate will implement the improvement, but rather the percentage of companies out of companies that have already pledged. Here the 39% - 50% is the most plausible outcome, but the model also includes, for example, the small probability of just 5% of companies following-through. We are also trading the accuracy of the result for the value of the information it provides. Of course, I feel fully confident that the true outcome will be somewhere between 0% and 100%, but this result is not that informative when we need to make a call.
I was modelling in mostly having in mind CE’s asks recommendations: food fortification and management of DO levels. That enabled us to narrow it down and make it more generalizable. I agree it won’t be generalizable for other asks, like the one that you used or even for the broiler asks for the same reasons.
Given your aims, you can use my estimates but just give any prior estimate, given that presumably, your priors aren't flat or 1.
An alternative to that method might be estimating number of animals affected rather than percentage of corporations since presumably animals aren't distributed evenly across corporations and so it seems possible that you might hit >x% of animals with x% of corporations. That would require modelling it for a very specific case if you want to get a “usable” result.
Of course, I feel fully confident that the true outcome will be somewhere between 0% and 100%, but this result is not that informative when we need to make a call.
If your 90% CI is between 0% and 100%, it can be a little bit informative to put that in the model (preferably with a custom probability distribution), because it would help to distinguish between interventions that help 0-2 animals per dollar spent, and interventions that help 1 animal per dollar spent. You should of course prefer the latter to avoid the optimizer's curse. If you end up not having actual 90% subjective confidence intervals because you want to make things simpler, I guess you should keep that in mind when filling the column for the strength of evidence in your Priority Asks table.
Thanks for the suggestions! As we were discussing above, combining this estimate with a prior estimate using Bayes’ rule might be a solution here. Taking the uncertainty of the model into account, we indeed score this approach quite poorly when it comes to the evidence-base aspect of it. We have a different research template for approaches than the one you linked. I expect to publish the whole report on corporate outreach pretty soon.
Another way to interpret the result is that it is your subjective probability that a given company will follow through. But then I’m not sure it makes sense to have a 90% SCI of what your own subjective probability is. What would that even mean? How would you check that the true value is in the confidence interval?
Karolina has already answered, my response here is very late and you've already worked on corporate campaign research, so I'd guess you're already satisfied, but hopefully this will be useful for anyone else who comes by or might still be useful to you.
Polling, e.g. for elections, is a useful comparison, if the follow-through rate in cage-free campaigns is interpreted as as the proportion of pledged companies that will actually go cage-free, rather than a probability that a given (or random) company will go cage-free.
Here, for each pledged company (ignoring those that haven't pledged), we have a binary random variable (Bernoulli trial) whose outcome is whether or not it follows through on its commitment. In polling, the binary variable for each individual from the population from which respondents are sampled is whether or not they would vote for candidate X if an election were held the day of polling (and then we might extrapolate the estimate to the actual election held in the future, but this would not really be justified under frequentism).
Checking that the true value is in the confidence interval would just mean checking for each pledged company (pledged by a given date, or pledged by the time we check), whether or not it has followed through, and calculating the proportion that have followed through.
In polling, the population of interest is the votes of actual voters on the day of the actual election, but not all poll respondents will vote, and surely not all actual voters were polled. Furthermore, even respondents may change their mind between the day of polling and the actual election, so even if we polled all and only the actual future voters, because they can change their mind, the statistical populations, in the technical sense, between poll responses and actual future votes could still differ, since it's the responses/votes that make up the statistical populations, not the people.
For cage-free campaigns, the population of interest is the set of companies that have made pledges by some date (e.g. before today, so only companies that have already made pledges). If we base our estimate only on companies that have already made pledges, we don't "poll anyone who won't vote", so our sample population is a subset of (possibly equal to) the population of interest. I suppose this might be complicated if we consider companies that have actually followed through by the time we've finished collecting data for our estimate and then start using cages again; this would be like poll respondents changing their minds.
More space per chicken is just one of the requirements. Probably the most important requirement is to use higher welfare breeds, which generally grow more slowly. But there are more requirements regarding lighting, enrichments, etc. You can see the full ask in the European Chicken Commitment. Asks for other regions are similar and can be seen here.
35 Independent Pieces of Evidence for Why New Corporate Campaigns Might (or Might Not) Work
The following report is a part of ongoing research by Charity Entrepreneurship looking into corporate outreach as a potential approach used to implement asks.
The full report and answers to the research questions are available for download here.
Introduction
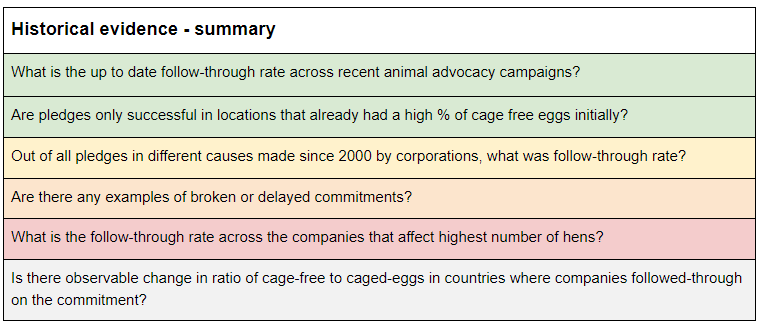
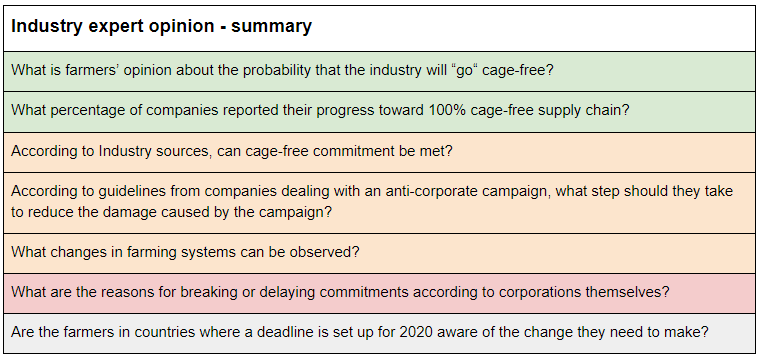
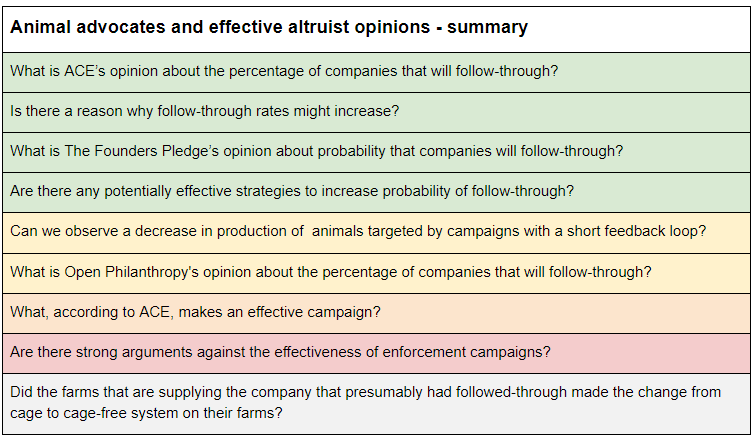
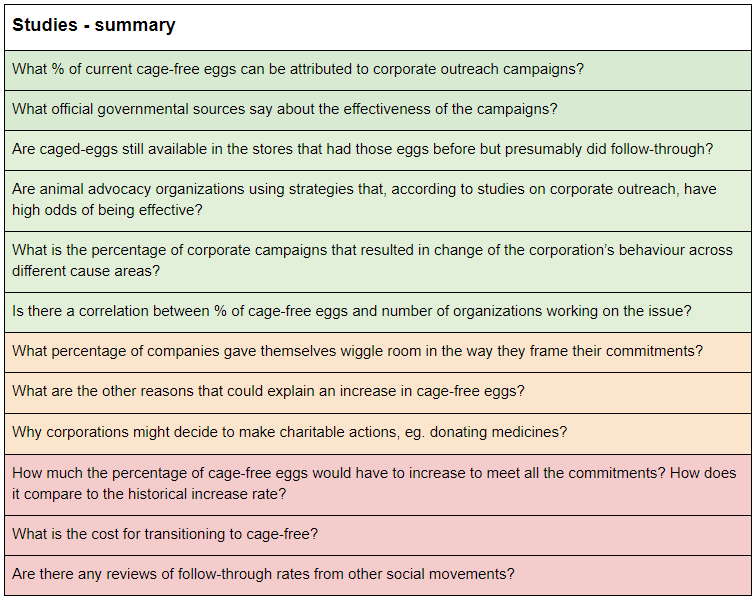
If most corporations tend to follow through with their corporate social responsibility pledges, starting a new charity that campaigns for welfare improvements for animals would be one of the highest impact opportunities out there. But what if only a tiny fraction do? Then, it might not be worth investing in. This is why one of the key crucial considerations, when considering the launch of a new corporate outreach campaign, is the ability to enforce the pledges and ensure that companies follow through on their commitments to improve animal welfare. There are some concerns that commitments have been broken, or will be, and therefore the impact of past campaigns is significantly reduced. To estimate the expected value of launching a new corporate campaign, we need to first estimate the probability of companies following through with their commitments . We approached answering this question using a cluster approach, looking at the issue using many different sources of evidence: historical evidence, industry expert opinions, animal advocacy and effective altruism expert opinions, and studies. Below, we offer a summary of conclusions from this research. The color coding represents the type of update each group of evidence gave us. Green denotes a generally positive update (making us more confident in the odds of corporate follow through), yellow stands for a neutral update, orange for a minor negative update, and red for a more negative update. Gray is where information was unavailable. Taking into account all the evidence, I estimated that on average ~44% of companies will follow through on the welfare commitments.
Using the principle of indifference and assigning equal probability to all possible distributions of the follow-through rate, in response to evidence presented above, I came to the following conclusion about the probability distribution of % of companies that will follow-through:
A 39% - 50% confidence interval is going to be used to model cost-effectiveness of launching another corporate campaign. It is not an estimate about effectiveness of past corporate campaigns on egg-laying hens and broilers issues!
The full model can we seen here. You can copy it and insert your inputs on the weight of evidence and strength of direction of a given parameter.
This is a crosspost from the new Animal Welfare Alignment Newsletter by Anima International. You can subscribe on Substack if you are interested in following these efforts. Audio reading also available on Substack.
The goals of this post are to:
1. Raise a question I see as crucially important to the goal of aligning AI to animal welfare...
Hello! I'm Justin Portela. I got hired by GWWC to make YouTube videos after AI in Context did such a kickass job.
My channel is using that same cinematic, high-production value beauty to talk about everything in the EA universe that isn't AI.
...
I used AI to fix transcription errors, rerrarange the ideas, and suggest tweaks to the title and some sentences.
Three of the most exciting projects to come out of EA in recent years are, in a vague sense, CEA spinouts:
* Kairos is directly a spinout of CEA and now handles most support for university AI safety groups. Basically everyone I've found who knows them is really excited about what they do
* NEST is an opinionated ideas-fi...


There is one part of the model that I disagree with:
You then use this in the model as a piece of evidence about the expected follow-through rate of all corporate commitments:

All other top 20 companies (with a possible exception of Costco which seems to be close to being cage-free anyway) have their deadlines set in the future, as you say, mostly 2025. You can’t say that they did not follow-through, we just have to wait until 2025 and see if they will, nobody expected them to be 100% cage-free this early. If I were you, I would remove this cell from the model.
Thank you for the suggestion. I agree that we can’t extrapolate the conclusion about predicted follow-through rate based on what percentage of companies have followed through on the commitment so far. I looked at it again, and I think that if analyzed correctly it still provides valuable information, so I will leave it in the model, but I’ll move it to the section on updates based on qualitative data and change the values based on the information below.
I think that a good proxy for the information is whether the top 20 biggest companies are making progress and will eventually switch is if they responded to EggTrack. We can break it down to:
* Companies that passed their deadline:
Whole Foods (2004) - 100% follow-through
Costco (2018) - as of July 2017, 78% and 100% converted to liquid
*Those that didn’t respond to EggTrack are Walmart, Albertsons, McDonald’s, Target, Sysco, ALDI, Burger King, Tim Hortons, Southeastern, and Wendy's.
* Those that did respond and reported progress: Kroger (21% as of 2017), Publix (50%), SUPERVALU (as of 2016, 12%)
* Those in 20 that I do not have information on US Foods, IGA, Inc., Associated Grocers of Florida.
I will estimate the value in this cell based on this information unless you have info that could fill in the gaps.
I generally think that with all very uncertain estimates, whatever the result, it should be only treated as a cautious update and be combined with prior estimates of value.
As a meta comment, I think I’m less concerned about an error in one of the parameters than you seem to be because of the different goals of the research. My goal is to reach broadly good conclusions about which intervention should be executed from a given list of options given a limited amount of time, rather than get the right answer to a specific question, even if it takes me an extremely large amount of time. I think that using cluster approach is superior in such cases. If you are using cluster approach, the more perspectives you take into account the lower the odds of your decision being wrong, and so I trade other aspects (eg. number of interventions compared in a given time frame and how accurate a single estimate need to be) differently. One contradicting factor also cannot overpower the whole decision, etc. A completely different method should be used when we are trying to have as accurate beliefs about the world as possible vs getting to a good decision.
Just to be clear, I wasn't concerned about the error, I saw that deleting the cell and then making other appropriate changes increases the estimated probability by only 3%. I only commented about it because I thought that it is easy to fix. I agree that the approach you chose has its benefits.