Comments

Accurately quantifying animal suffering is a critical step in ensuring that welfare interventions are evidence-based and lead to meaningful improvements.
We are excited to share this transcript from our workshop at EAG: London 2024, where we introduced the methodology behind the Welfare Footprint Project. We would like to take this opportunity to thank the organizers, Stien van der Ploeg for being a wonderful MC and for the kind introduction, Niko Bjork for all the help, for putting together this transcript and inviting us to submit it to the EA Forum, and finally, the audience for their insightful questions during the talk and the follow-up office hours in this incredible event.
This talk highlights the importance of quantifying animal welfare to effectively prioritize and implement interventions. We introduce the Welfare Footprint Project, which provides a structured approach to measuring welfare impacts across different species and production systems.
At the core of this project is the Pain-Track tool, a method that breaks down negative affective experiences into measurable phases and estimates the intensity of suffering using all available scientific evidence. This method enables the calculation of a welfare metric known as Cumulative Time in Pain of Different Intensities, or simply “Cumulative Pain.” This metric is universally applicable and presented in a way that is easy to understand, making it a powerful tool for evaluating welfare loss.
We also demonstrate how we leverage the power of artificial intelligence to facilitate broader adoption of the Welfare Footprint. We showcase the Pain-Track Custom GPT, a freely available tool that generates quick, data-driven reports on various sources of animal suffering, helping to streamline the analysis and application of welfare metrics.
Check out the Welfare Footprint Project’s Pain-Track tool in ChatGPT here.
Key Points:
Please note that this transcript has been edited for improved clarity, and contains detailed descriptions of animal suffering, including graphic descriptions of male piglet castration.
Wladimir: Welcome to our workshop!
Thank you all for being here, and welcome to our workshop! Since we’re in London and at an Effective Altruism conference, I thought it would be fitting to begin by drawing a connection between the Welfare Footprint Project and the work of Jeremy Bentham, the philosopher and reformer widely regarded as the founder of utilitarian ethics.
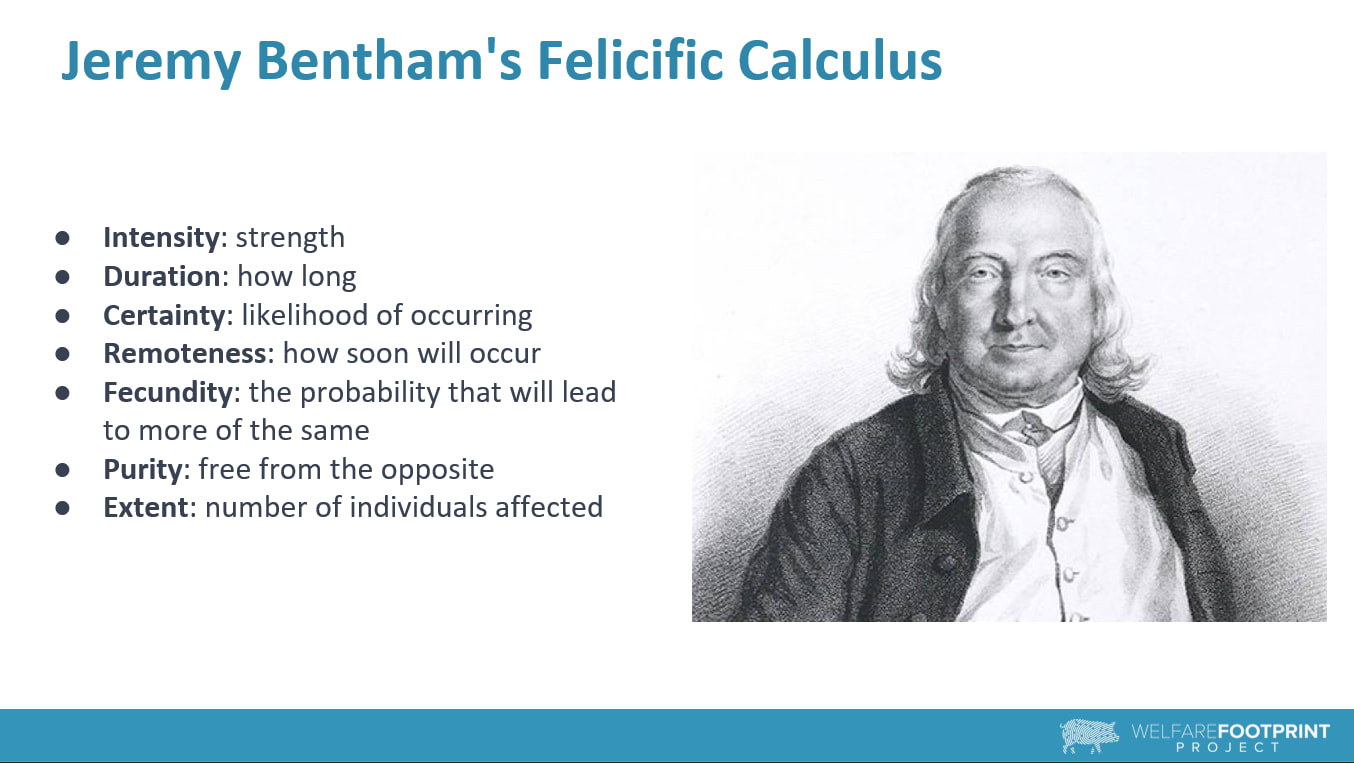
Bentham, a Londoner himself, made significant contributions to ethical theory, and one of his most notable ideas was the Felicific Calculus—a framework designed to evaluate the impact of actions in terms of maximizing happiness and minimizing suffering. Fun fact: Bentham left instructions in his will for his body to be preserved and displayed at social gatherings! Today, you can still visit his preserved figure at the University College London campus, not far from here.
Bentham’s Felicific Calculus breaks down into seven key components:
It’s exciting for us to see how the Welfare Footprint method draws on the philosophical foundations laid by Bentham, while also benefiting from cutting-edge advancements in artificial intelligence. These tools allow us to perform analyses on a scale that wasn’t possible before. In fact, we believe that with the right strategic collaborations in AI, we could soon have the capacity to quantify virtually all suffering experienced by farmed animals—at a high level of precision—within the next decade.
After Cynthia’s presentation, I’ll return to show how the Welfare Footprint method is especially well-suited to leverage new AI models for describing and quantifying affective states. We’ll even run some live demonstrations, using your examples of pain in various sentient species..
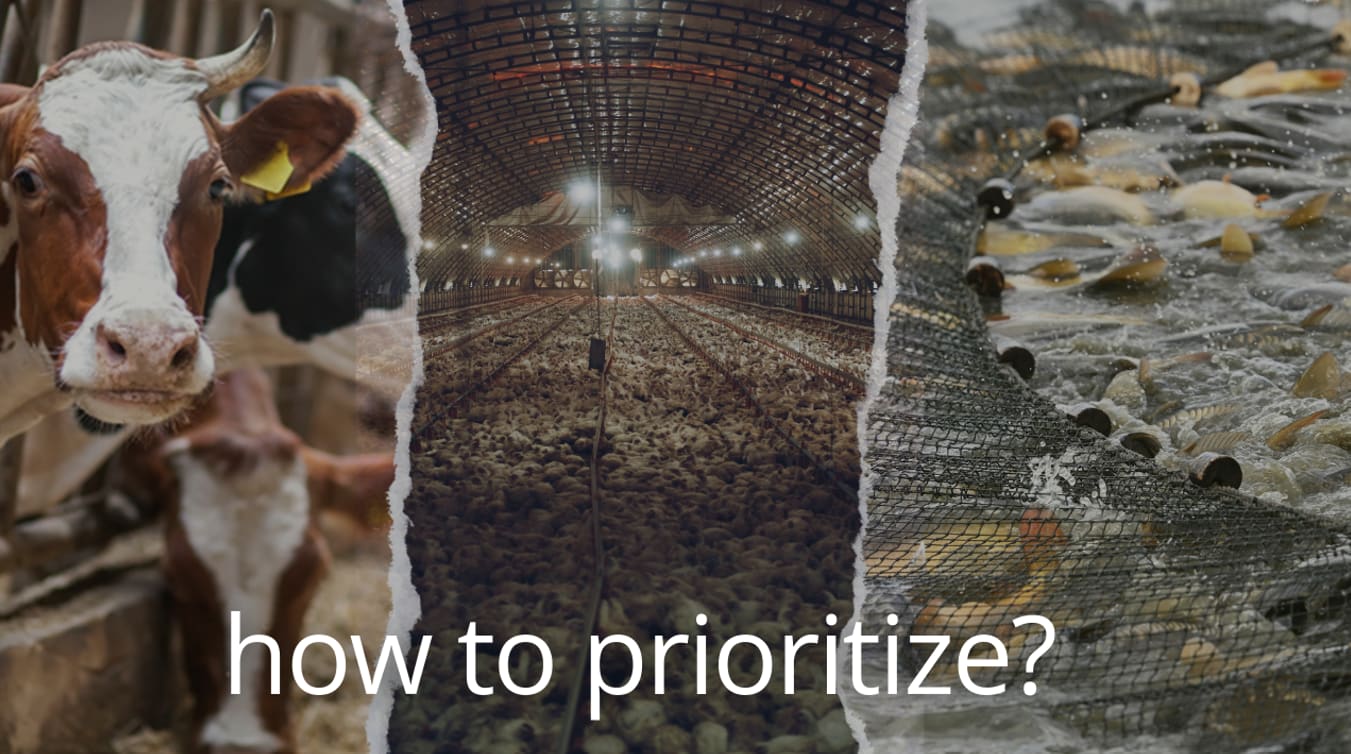
Cynthia: Good morning, everyone! I know that everyone here is well aware of the numerous sources of suffering in the world, affecting both humans and non-human animals. To effectively prioritize our time and resources, it’s crucial that we understand the scale of suffering each source causes. That’s exactly the focus of our work, and I’m excited to share more about it with you today.
Before I continue, I’d like to get a quick sense of your thoughts.
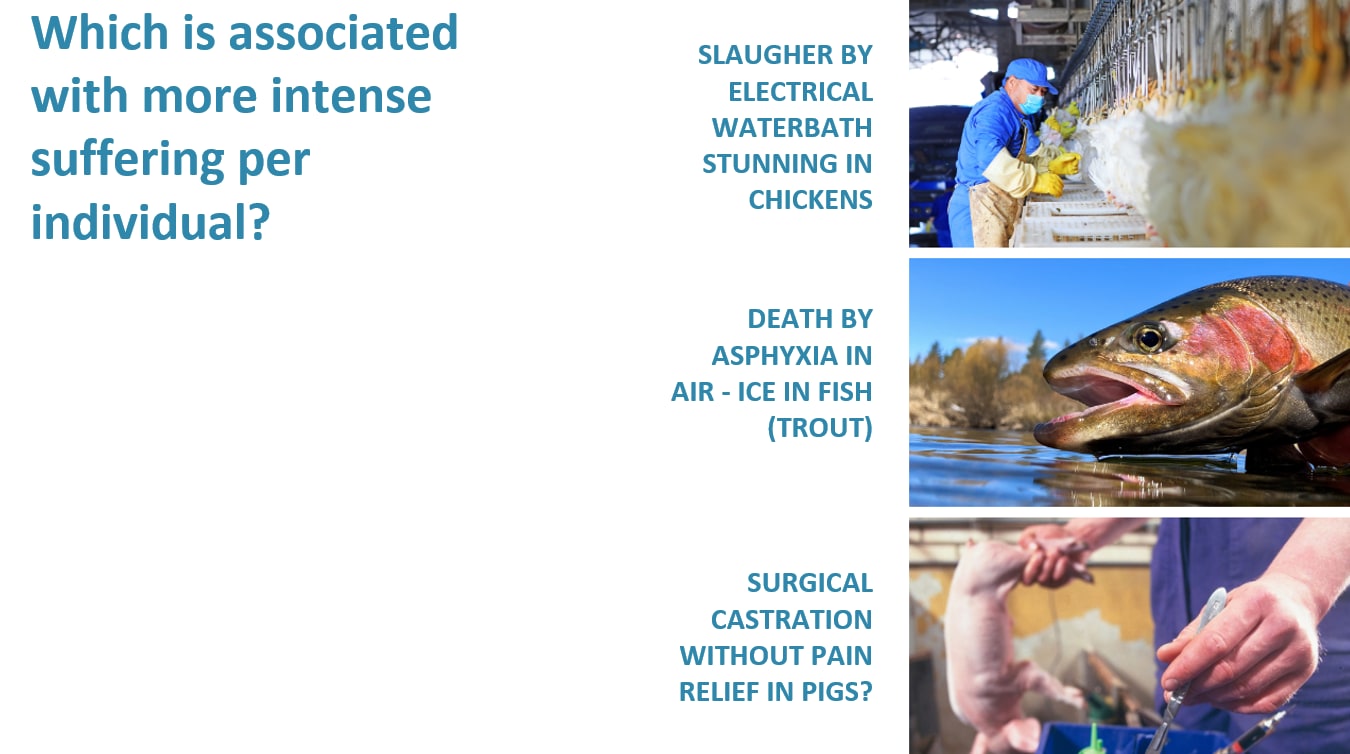
Which of the following situations do you think is associated with the most intense suffering for the individual animal?
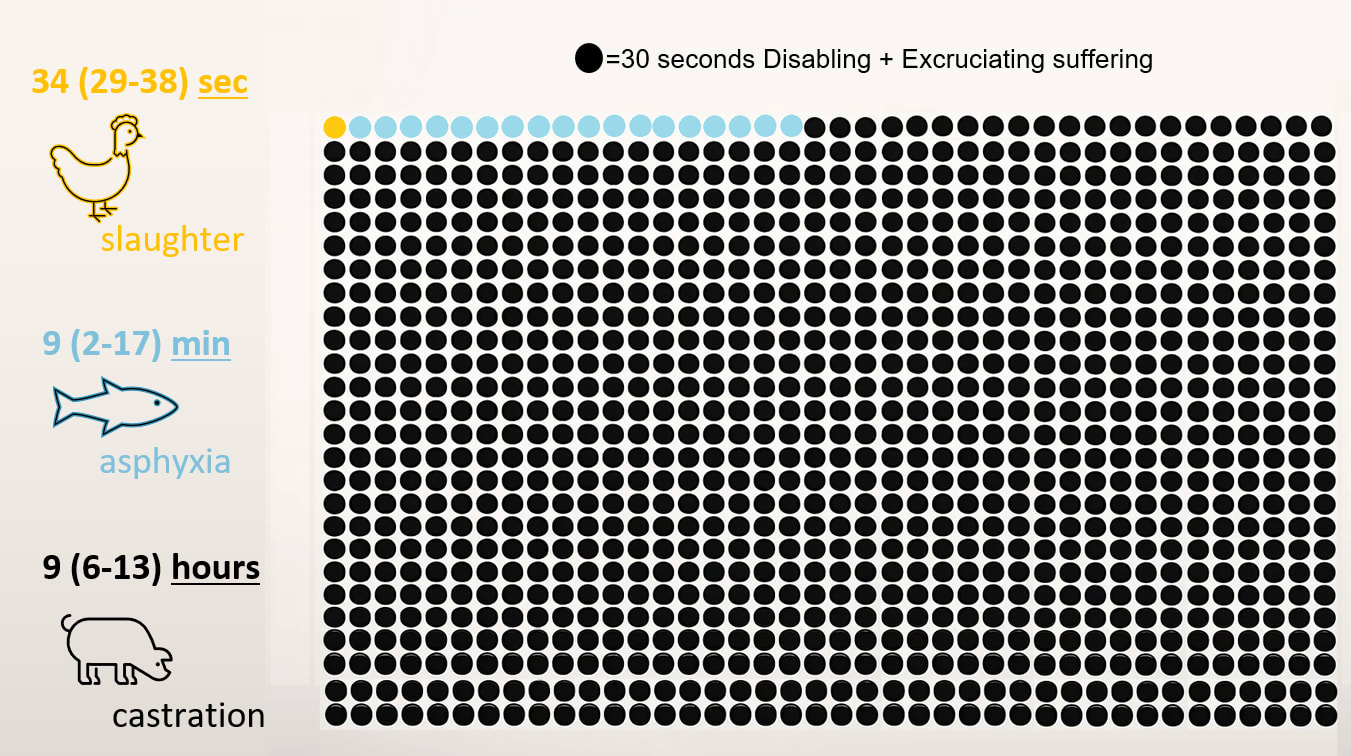
Now, using this framework, we’ve estimated the amount of suffering per individual in each of these cases. Let me share the results with you.
To give you a sense of what this means, I’ll explain it in terms of time spent in intense pain. Each circle I’ll refer to represents about 30 seconds of extreme pain—what we describe as disabling and excruciating:
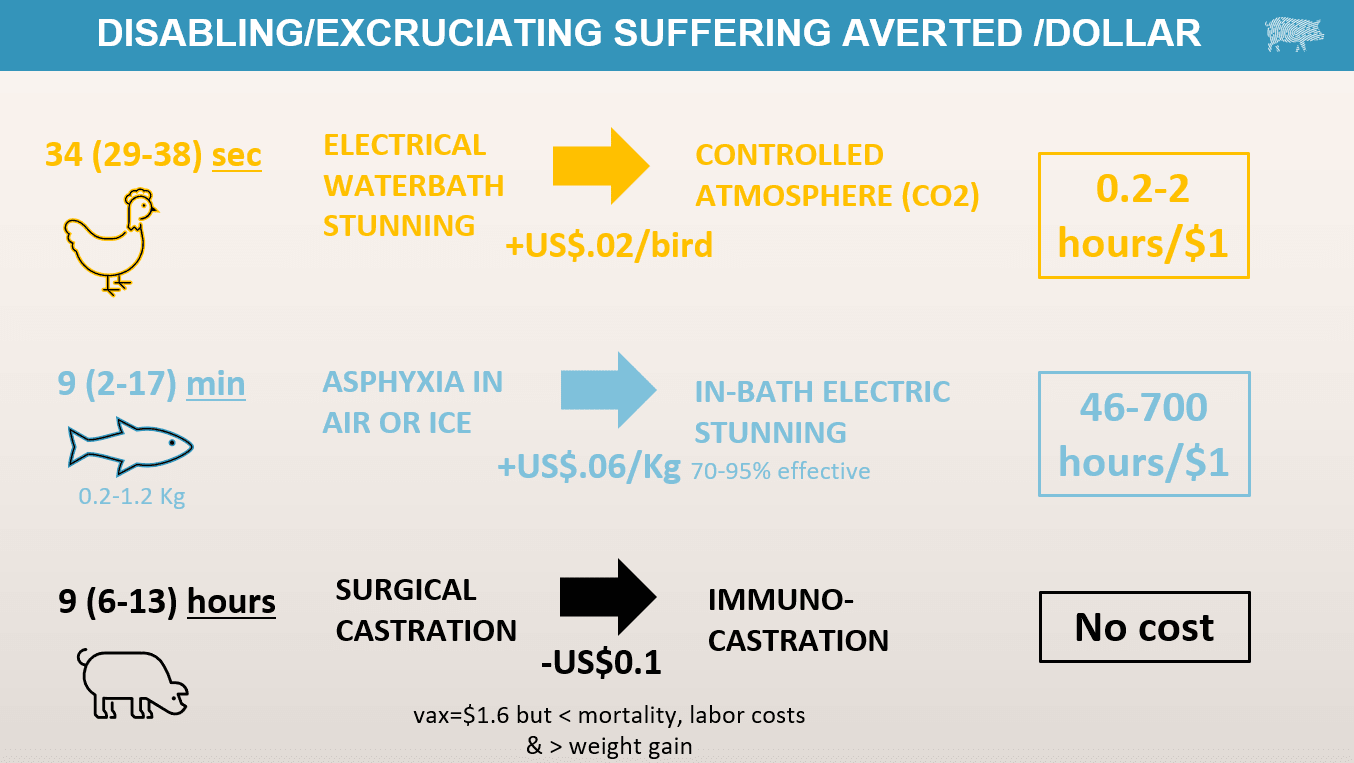
If you had to work on an intervention to mitigate the suffering associated with each of these causes, and you knew the cost of these interventions, per bird, or per kilo of meat, then you would have the cost effectiveness of the intervention.
For example:
Let’s break down how the Welfare Footprint framework works by walking through the key steps. This example will help illustrate how we arrive at the numbers I mentioned earlier. The process involves three main steps—the first two are relatively straightforward, while the third is the core of the method.
Just like in a life cycle analysis (LCA), the first thing you need to do in any welfare assessment is to define the goals and the boundaries of analysis.
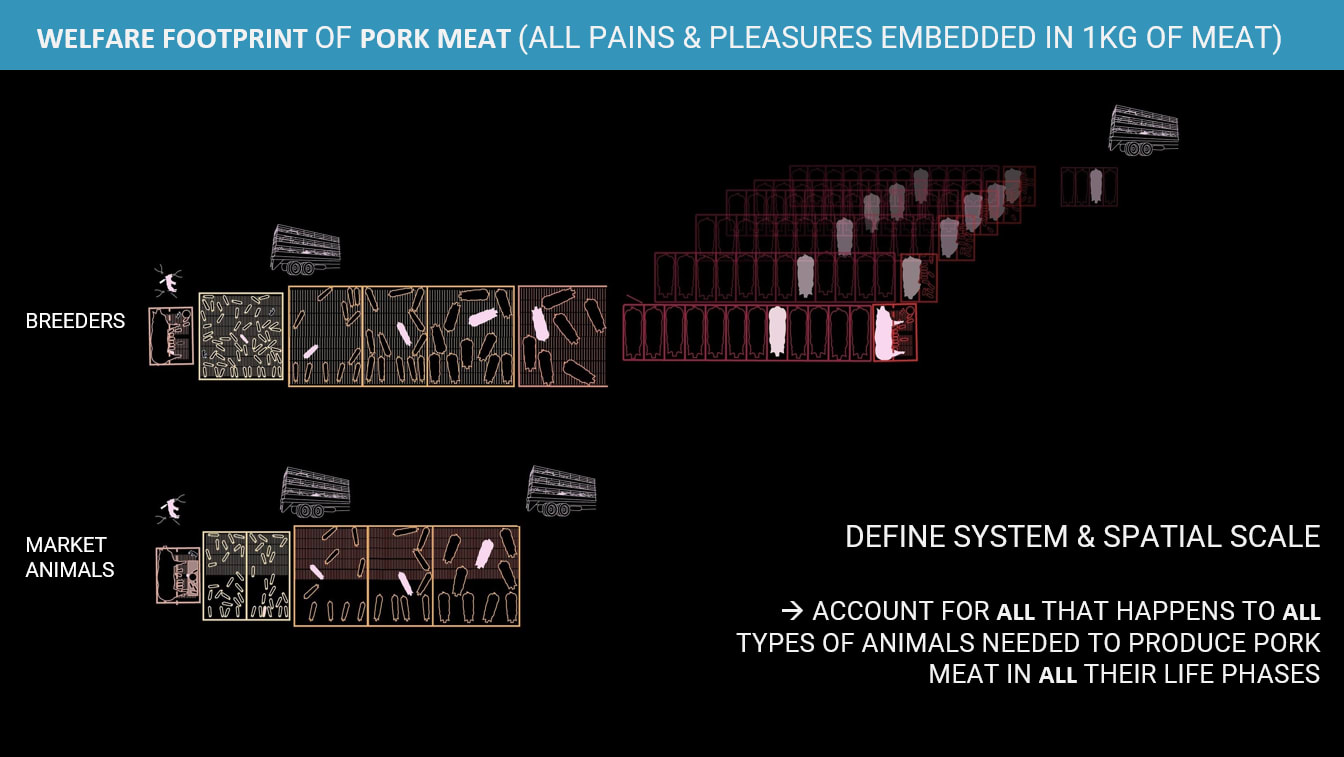
For instance, if we wanted to calculate the welfare footprint of one kilogram of pork meat, we’d essentially be calculating all the pain and pleasure embedded in producing that kilogram of meat.
In this case, we first need to define the system and the spatial scale that we want to focus on. Let's say intensive production systems in the UK or in Brazil. Within that system and scale, we need to account for all that happens to all the types of animals used in the production chain; the breeders, the market animals, the animals used as feed, pre-slaughter mortalities, all the animals in the system from birth to death, as you would in a life cycle analysis.
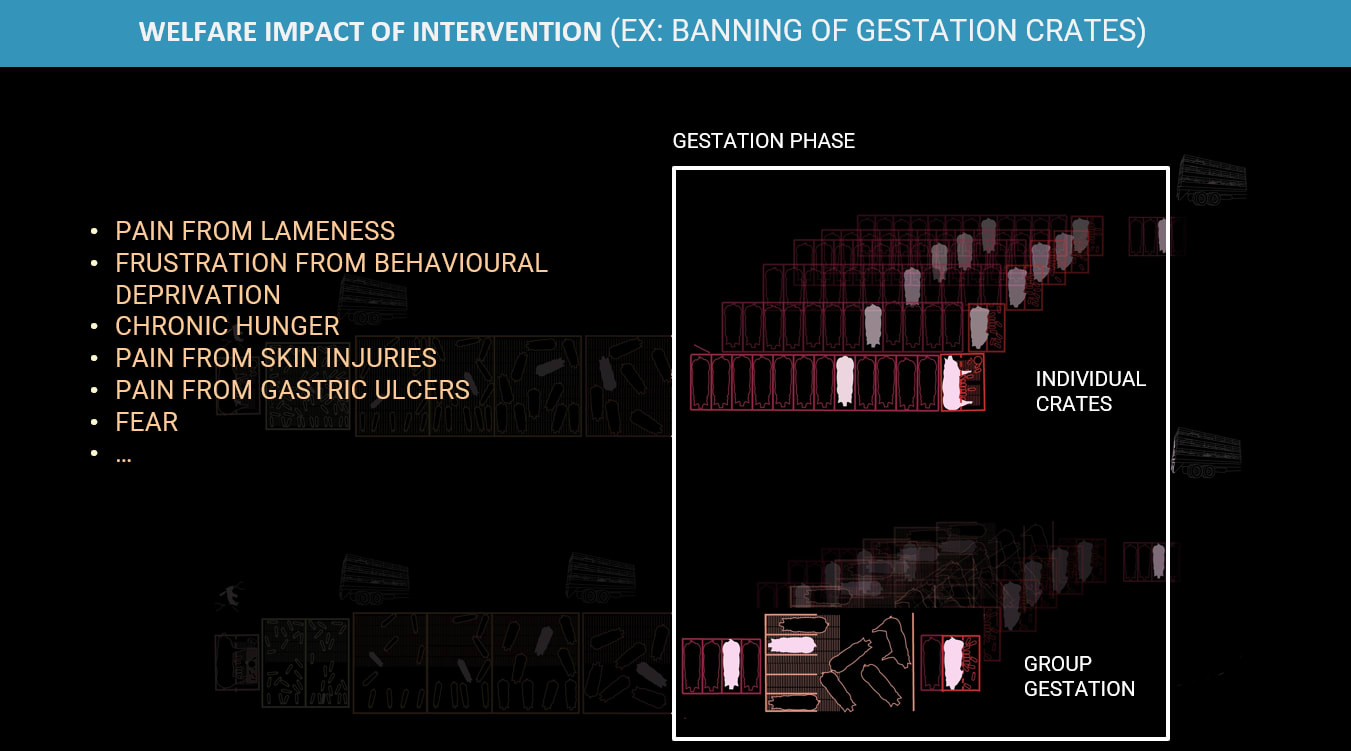
Now, if we wanted to calculate the Welfare impact of an intervention, then we can narrow down the analysis to the effects of the intervention.
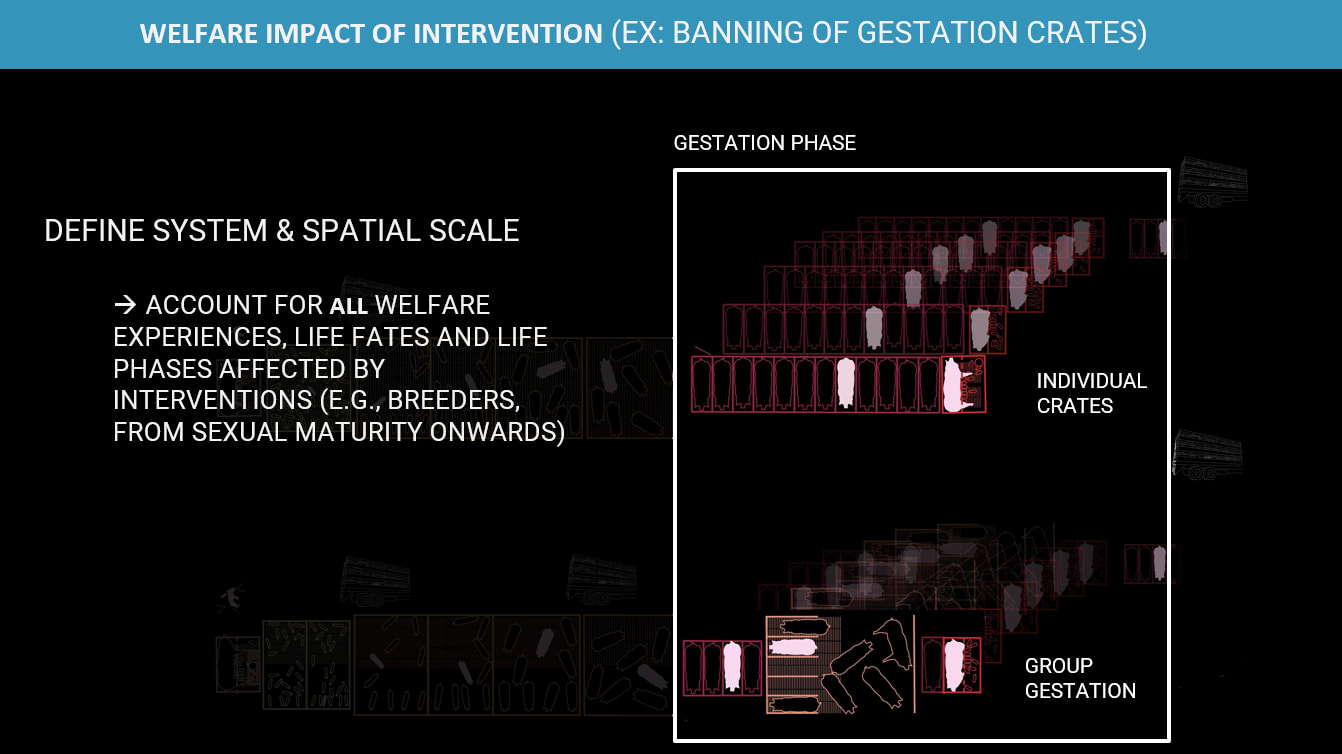
For example, when evaluating the welfare impact of banning gestation crates, we first define the system and spatial scale, as well as account for the welfare experiences of all affected animals. In this case, we would focus on the life-fates of female breeders and compare their welfare in individual crates versus group gestation systems. We would need to consider how the intervention affects the gestation phase and possibly the farrowing phase.
Once we have defined the goals and scope of our analysis, the next step is to map out the affective experiences we want to measure—both positive and negative. This includes physical and psychological experiences, such as:
In the context of the Welfare Footprint, when we talk about pain, we’re referring to both physical pain and psychological distress—essentially, any negative affective experience.
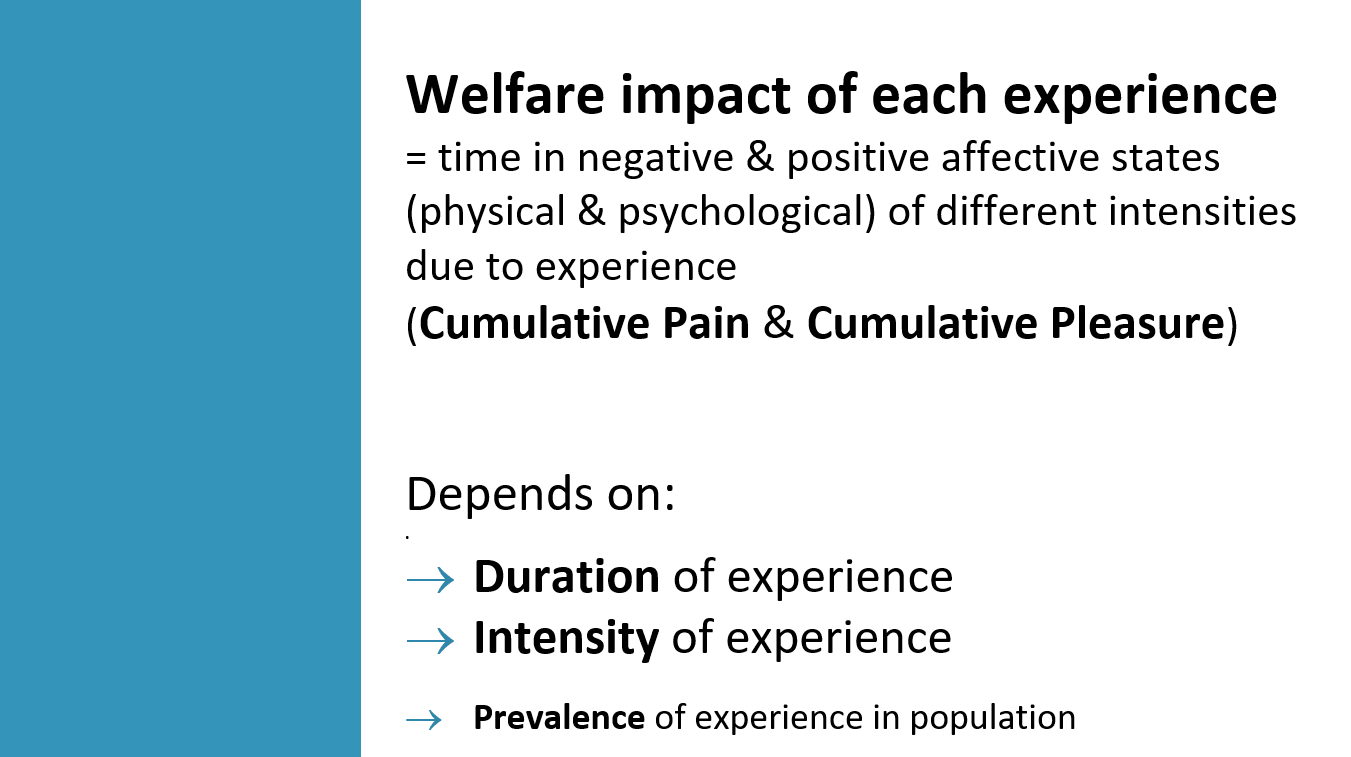
The key metric we use to quantify the amount of suffering is called Cumulative Time in Pain of Different Intensities, or simply "Cumulative Pain." I’ll explain how we calculate this in a moment, but essentially, it’s based on describing two main dimensions of each experience: its duration and intensity. And this description is done with a notation method called the “Pain-Track”.
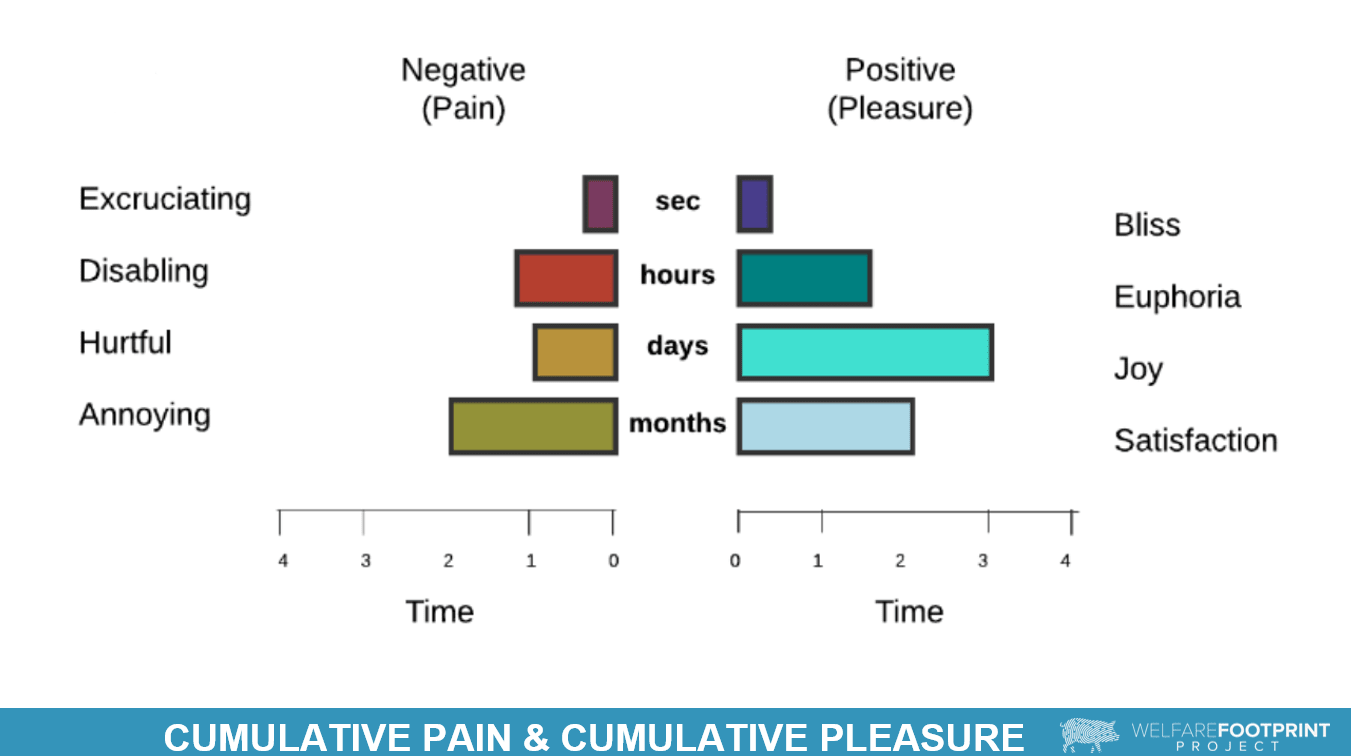
Similarly, we use the same approach to measure positive affective states, with the metric we call Cumulative Pleasure.
As with any measurement involving individuals, when we scale this to entire populations, we also consider basic statistics—like the prevalence of the experience across the population. For example, if we want to calculate the Cumulative Pain resulting from fractures in a specific population, we would first need to know what percentage of that population—let's say 80%—typically suffers from these types of fractures.
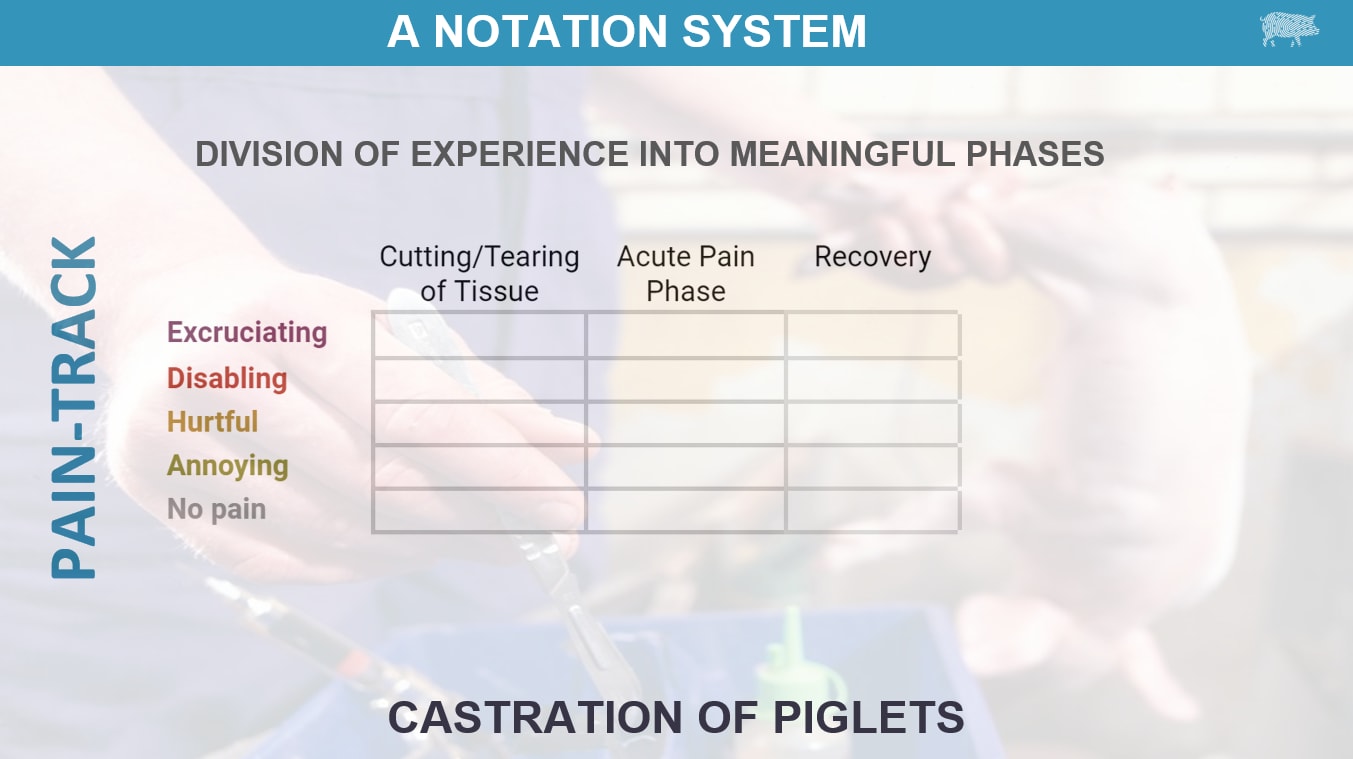
To perform these calculations, we use a system we call Pain-Track. This system allows us to describe how the intensity of pain or unpleasantness evolves over time. The Pain-Track is organized into a simple table where the columns represent different temporal phases of an experience, and the rows correspond to five levels of intensity, ranging from most intense to least.
The first step in creating a pain track is to understand the temporal evolution of the experience. Let's take an everyday example: getting a flu shot. The unpleasantness of a flu shot isn’t uniform throughout the process—it comes in phases. First, there’s the sharp pain of the needle entering the skin, then soreness in your arm, and later you might have mild flu-like symptoms. Each of these is a distinct phase of the experience, and we would break it down into:
We use this same approach to break down every painful experience into phases.
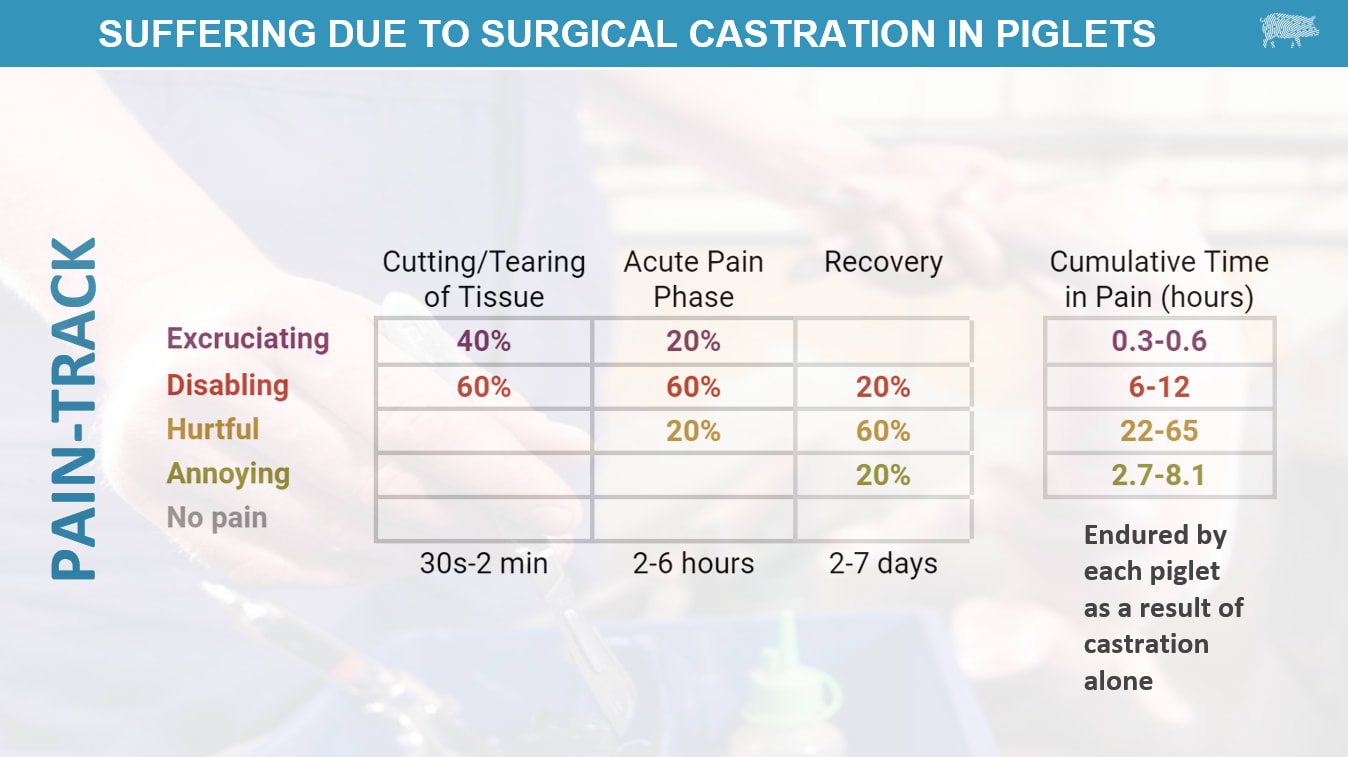
For example, in the case of piglet castration, we divide the experience into three phases:
After identifying these phases, we estimate both the duration and intensity of each one. This is the core of the Pain-Track system.
The beauty of Pain-Track is that it makes these estimates transparent—anyone can see, understand, and criticize them. It also clearly lays out the justifications and assumptions behind the estimates.
By breaking down the experience into specific phases, we can capture the dynamics of pain at different levels of intensity. This level of detail enables the analysis to be backed by existing biological evidence for each segment. This approach allows us to ground that every assumption and estimate into evidence.
First of all, can the affective experiences of nonverbal creatures—like a baby, for instance—be measured quantitatively? The answer is yes, but indirectly, using several sources of evidence.
It’s important to remember that any method aiming to improve the well-being of animals relies on assumptions about what positively or negatively affects their quality of life—that is, their feelings. While these assumptions can be reasonable and supported by evidence, they’re still incomplete and provisional. If we waited until affective states could be directly measured, no meaningful intervention or prioritization of actions to improve welfare would be possible.
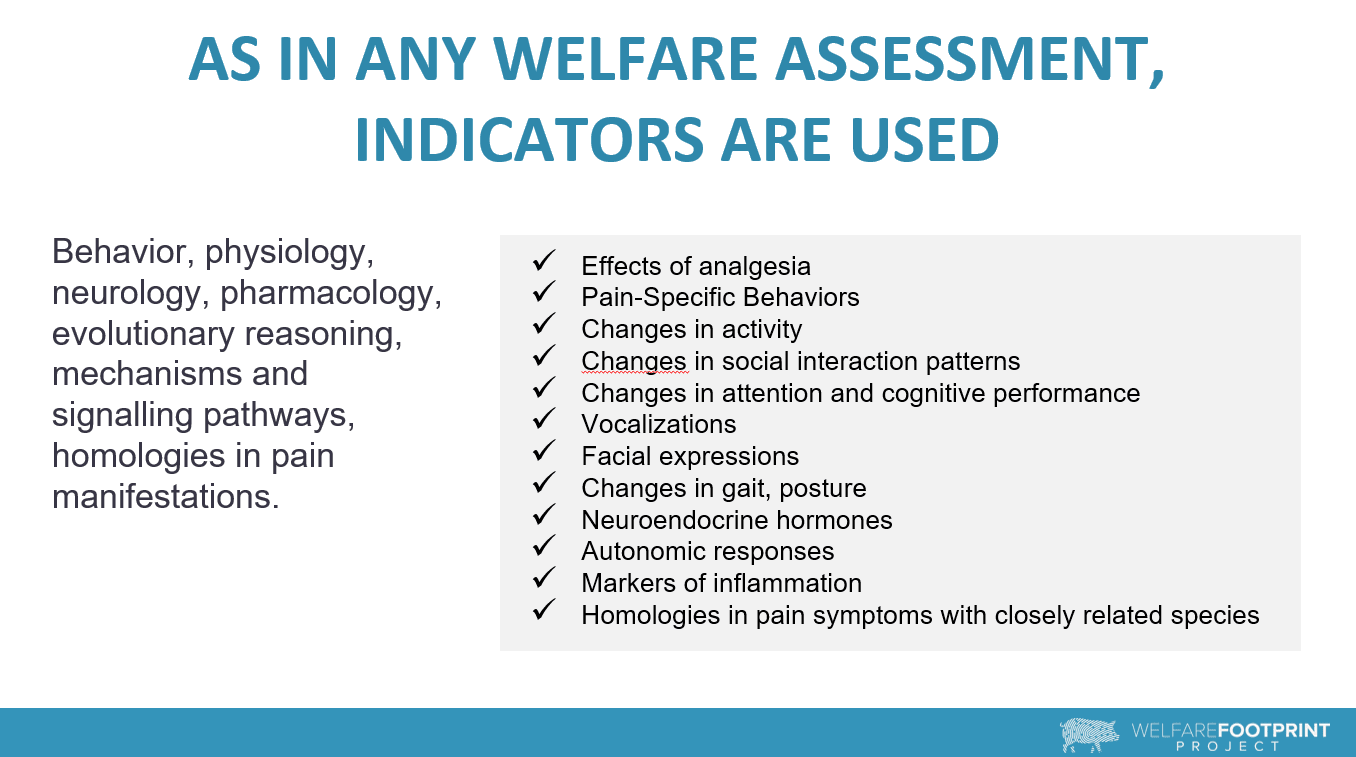
This reliance on indirect information is not unique to our method; every welfare assessment system relies on indicators that are more or less correlated with the affective experiences of animals. They can include:
To give you a few specific examples of such indicators:
These indicators provide valuable insights into the subjective affective experiences of animals. And even though no system is perfect, using this broad range of evidence allows us to come up with informed and evidence-based estimates.
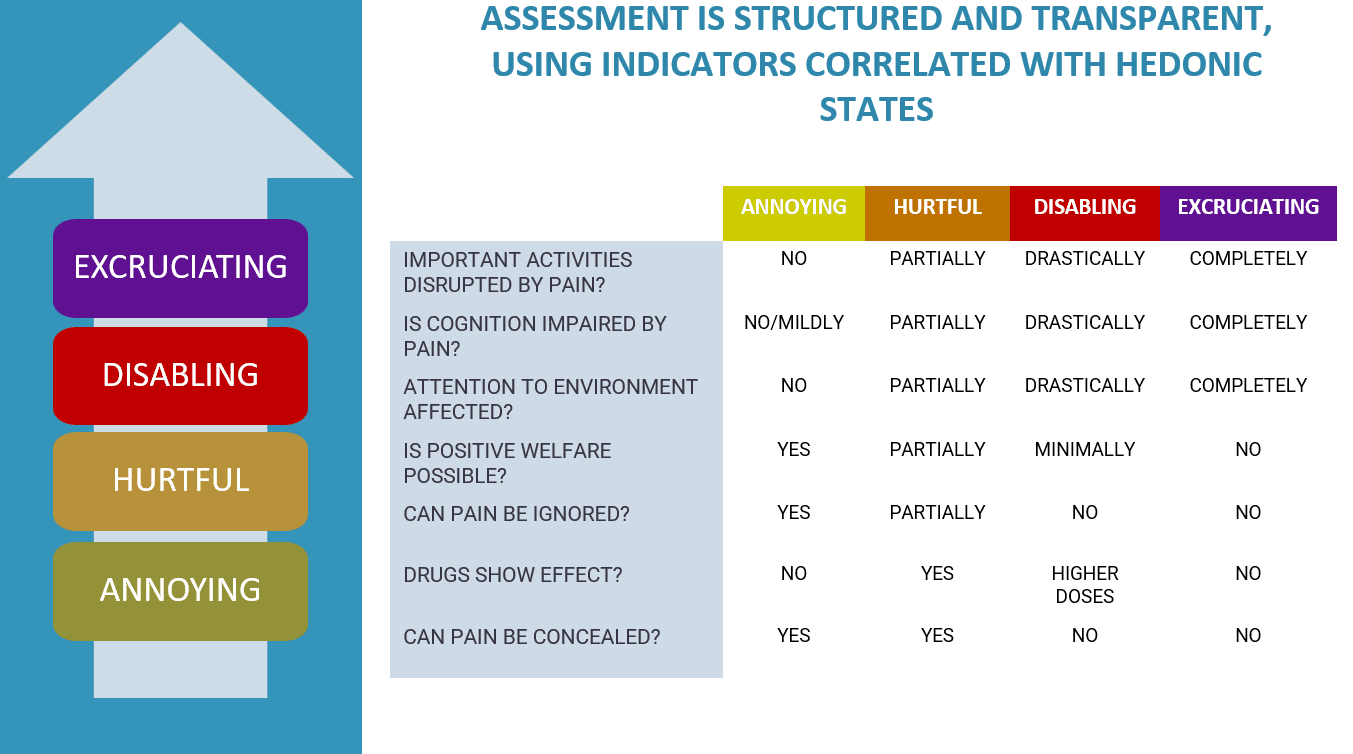
We classify pain into four levels of intensity, ranging from annoying to excruciating, with each level defined by specific criteria.
To estimate intensity, we ask several key questions. For example:
We apply these kinds of questions across various dimensions:
By asking these types of questions, we can more accurately assess whether the pain an animal experiences is annoying, hurtful, disabling, or excruciating.
Let’s look at the case of surgical castration in piglets.
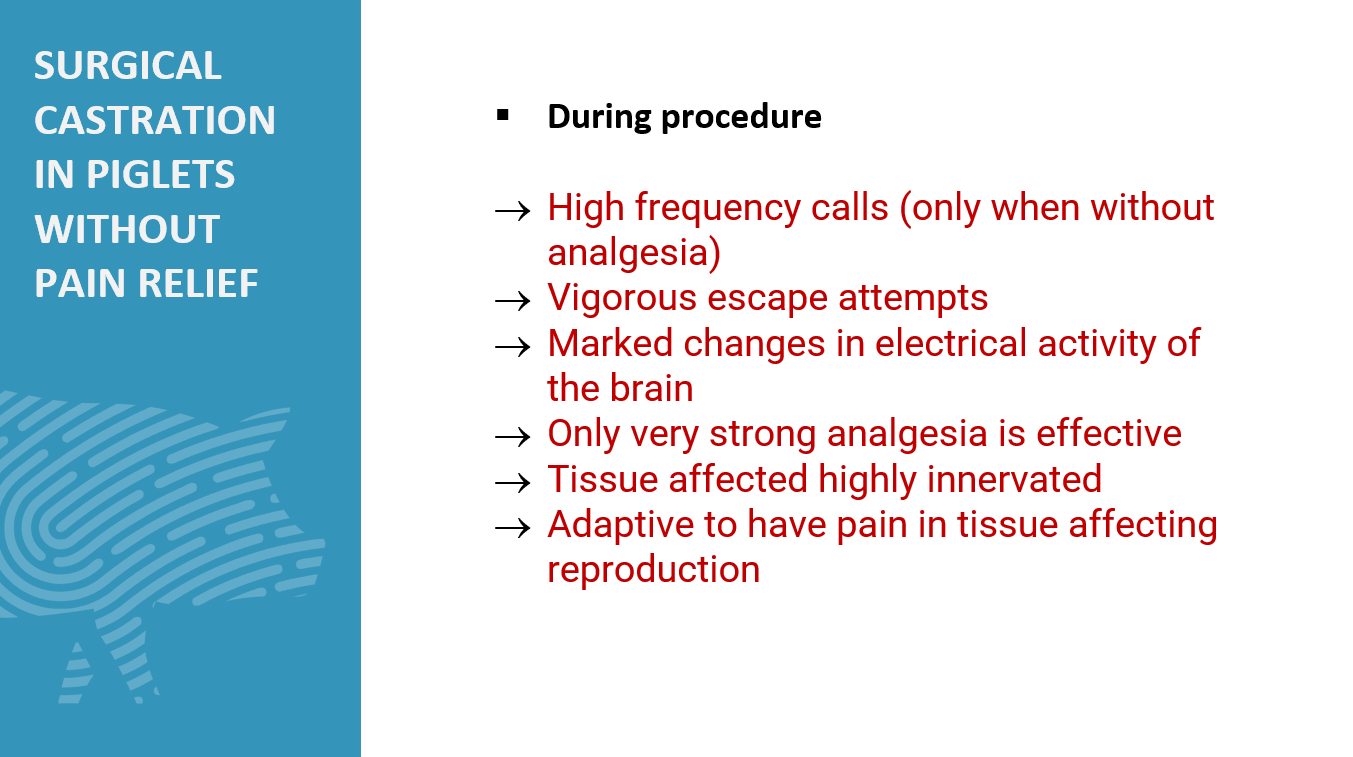
The first phase of this experience occurs when the tissue is being cut and torn as the testicles are removed. According to the literature, piglets without strong analgesics often exhibit a high frequency of vocalizations, such as screams and calls, which are typically clear signs of distress. We also observe vigorous escape attempts and changes in the brain's electrical activity, indicating intense pain. Brainwave patterns shift during this phase, and the only way to significantly reduce the behaviors associated with pain is through the use of very strong analgesics. Also, since this area of the body is highly innervated, it’s adaptive for animals to feel intense pain when it’s damaged, as these areas are crucial for survival and reproduction.
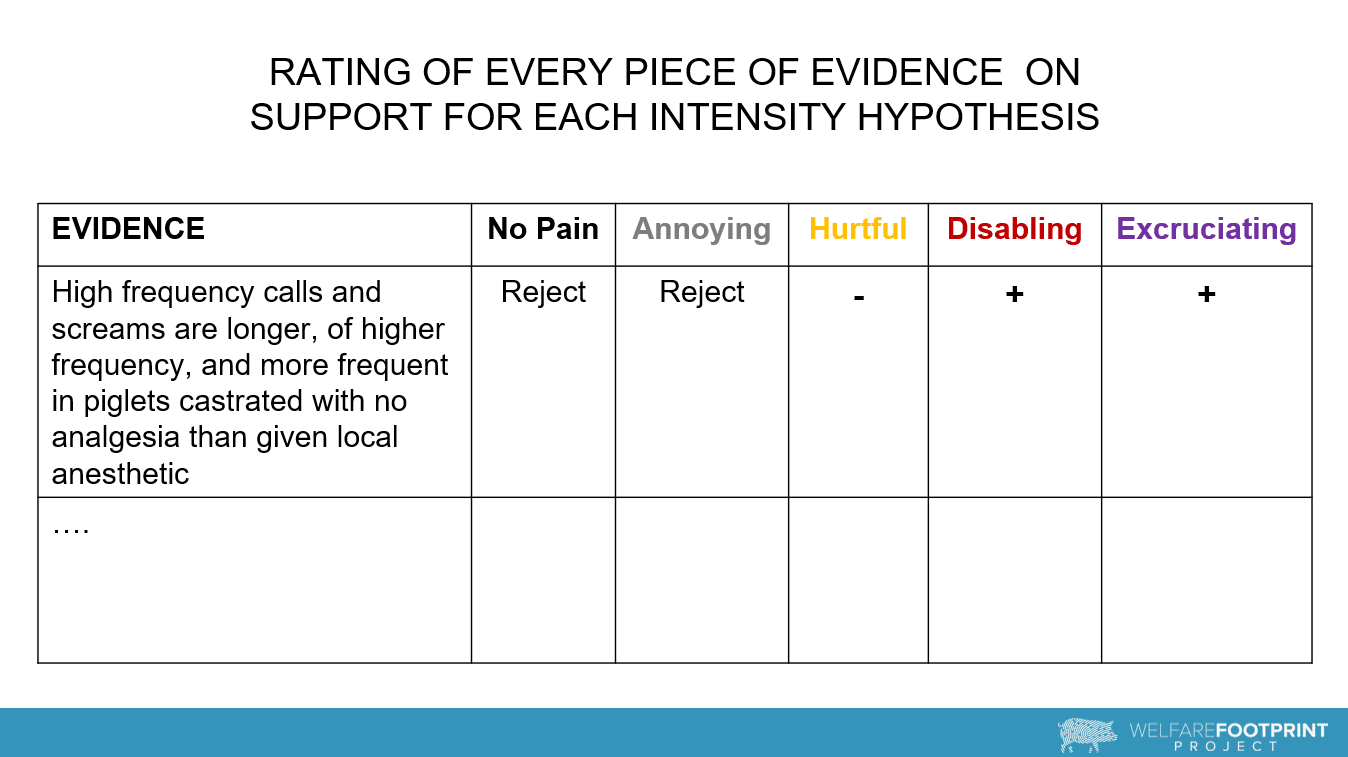
In a recent refinement of our method, for each piece of evidence we evaluate how well it supports different levels of pain intensity.
For example, the high-frequency screams seen in piglets undergoing castration without analgesia are longer, more frequent, and higher-pitched compared to those given local anesthetics. This evidence rejects the hypothesis of no pain or just annoying pain. It’s inconsistent with hurtful pain, and more aligned with the criteria defining disabling or excruciating pain.
We go through this process for every single piece of evidence, assessing how well it fits the criteria defining each level of pain intensity. By the end, we arrive at a comprehensive set of ratings that indicate the most likely intensity of pain experienced in each phase.
Once we have ratings for the likelihood of pain intensity, we can estimate the probability of the pain being at each intensity level. This can be done subjectively or by applying a fixed rule that automatically converts the ratings into probabilities for each pain intensity.
We’ve applied that method here, generating a probability for each phase of the experience to estimate the pain intensity. Once we’ve filled out a pain track with these estimates of intensity and duration for each segment, it becomes relatively straightforward to calculate cumulative time in pain.
For each segment, we multiply the probability of each intensity by its duration. This process is repeated for every phase of the experience, and the results are summed up to determine cumulative time in pain. On the right side of the slide, you can see the cumulative pain endured by each piglet as a result of physical castration alone.
In addition to our pain scale, we’ve developed a scale for positive affective experiences, which ranges from satisfaction to bliss.
The logic behind this scale is similar to the pain scale, but with one key difference. For pain, we assess the degree of disruption across various levels—pharmacological, neurological, physiological, immunological, and so on. However, for positive experiences, we focus on the degree of engagement with the experience to estimate different levels of pleasure intensity.
For more detailed definitions and insights, you can refer to the information available on our website.
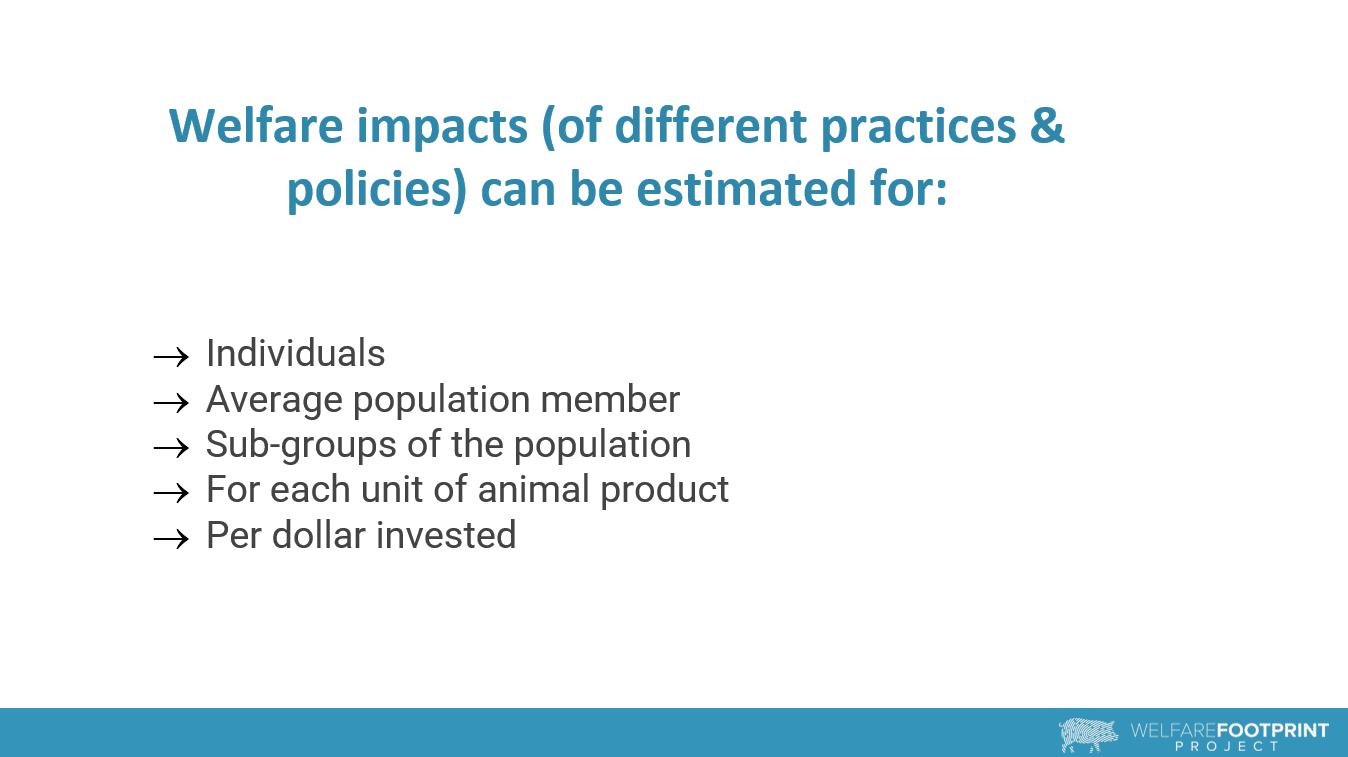
The welfare impacts of different practices and interventions can be estimated for various populations and contexts.
We can calculate these impacts for:
Because time spent in pain or pleasure can be aggregated, this method allows us to calculate cumulative experiences across a range of situations, providing insights into the overall welfare impact of various practices.
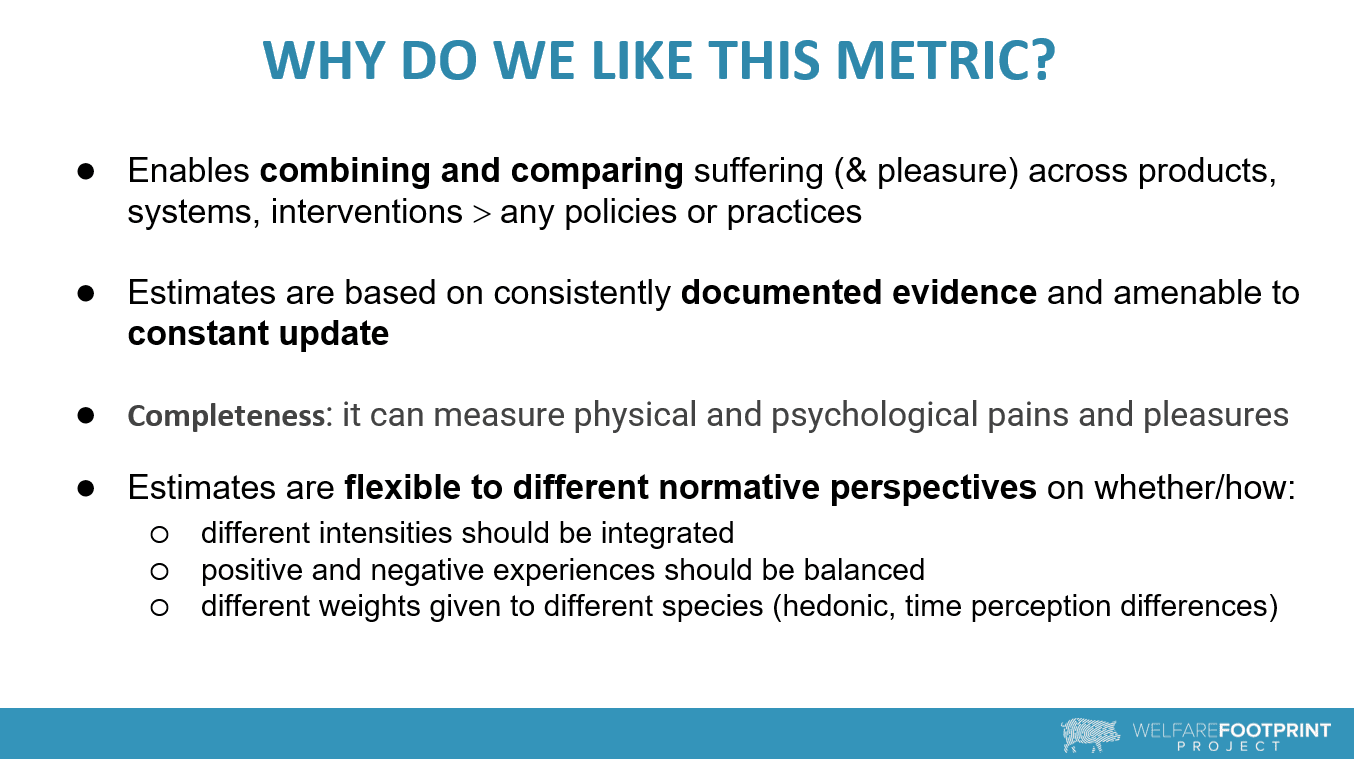
We find this metric highly effective because it allows for the comparison of both suffering and pleasure across different products, systems, interventions, or policies. The estimates are grounded in consistently documented evidence, making the tool evidence-based and open to constant updates. This means that as new knowledge and feedback are incorporated, the estimates can be refined and improved over time.
Additionally, the metric is complete, enabling the measurement of both physical and psychological pain or pleasure.
Another advantage is the flexibility of the estimates, which can adapt to different normative perspectives. For instance:
This flexibility allows organizations, researchers, and individuals to apply their own normative views when using the metric.
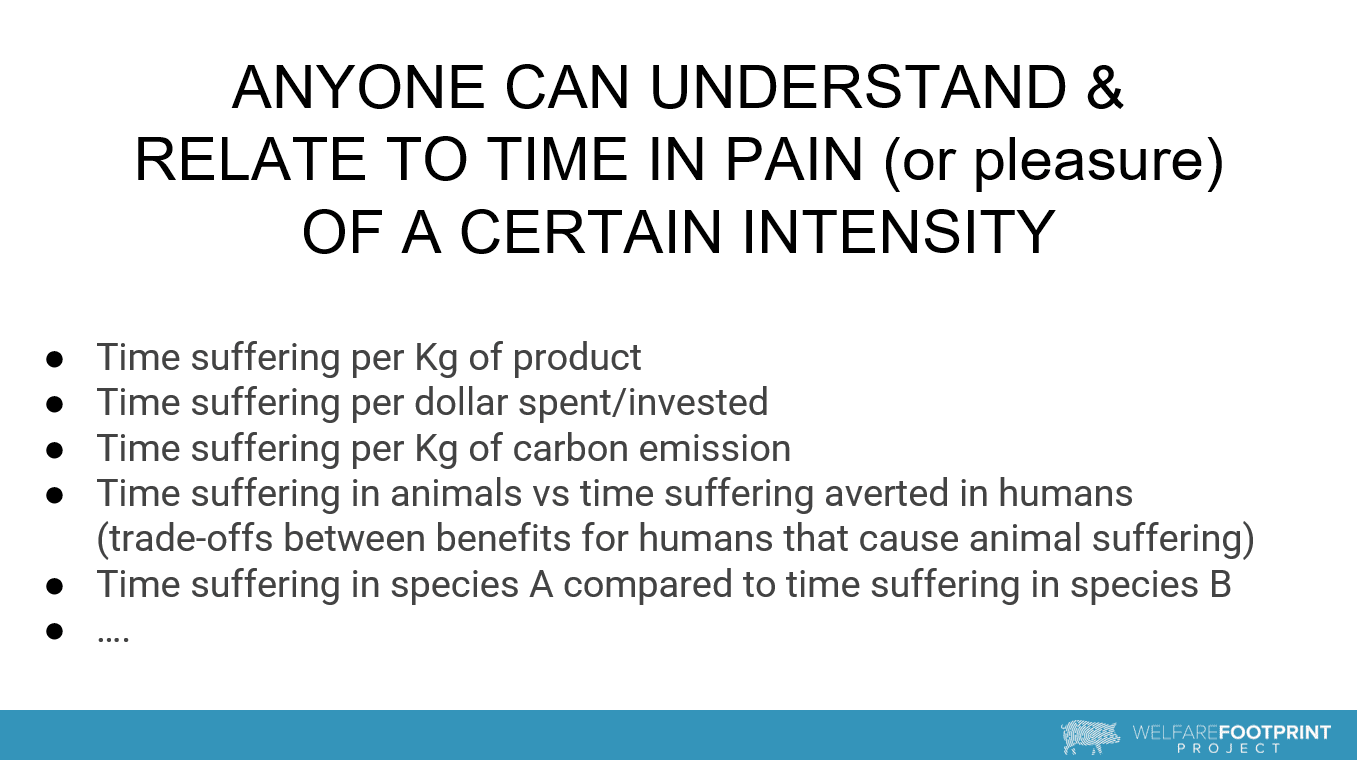
Lastly, a key strength of the system is its intuitive nature—anyone can understand and relate to the concept of time spent in pain or pleasure at a given intensity. We don’t rely on abstract scores but rather on a direct, comprehensible framework.
It’s easy for people to grasp concepts like time spent suffering per kilogram of product, or time spent suffering per dollar invested, and this makes it easier to evaluate trade-offs.
For instance, consider time suffering per kilogram of carbon emission. You might reduce one kilogram of carbon emissions, but in doing so, increase suffering by 10 hours of intense pain for animals. You can also compare time suffering in animals versus time suffering averted in humans. For example, when developing a drug that will prevent pain in humans, animal testing may cause suffering. You can calculate both the time suffering averted in humans and the time suffering endured by the animals in testing, and make comparisons.
Similarly, you can compare time in disabling pain or annoying pain across species, whether it’s shrimp, fish, pigs, or humans.
Wladimir: The Welfare Footprint Framework was created in 2018, with its entire analytical approach originally designed to be carried out by human experts. These experts come from various fields, such as veterinary science, animal welfare science, neuroscience, and more. This human-centered approach remains at the heart of the WFF. However, since then, the rise of Large Language Models has opened new possibilities. Early on, we recognized the potential for these models to assist in the most laborious and intricate parts of our process: gathering evidence needed to justify the estimates of pain intensity and duration.
Given the structured nature of the Welfare Footprint Framework, it turned out to be particularly well-suited for AI assistance. We began by using the GPT model - although we remain open to other models -, and more recently, we've explored the potential of Custom GPTs to help our work.
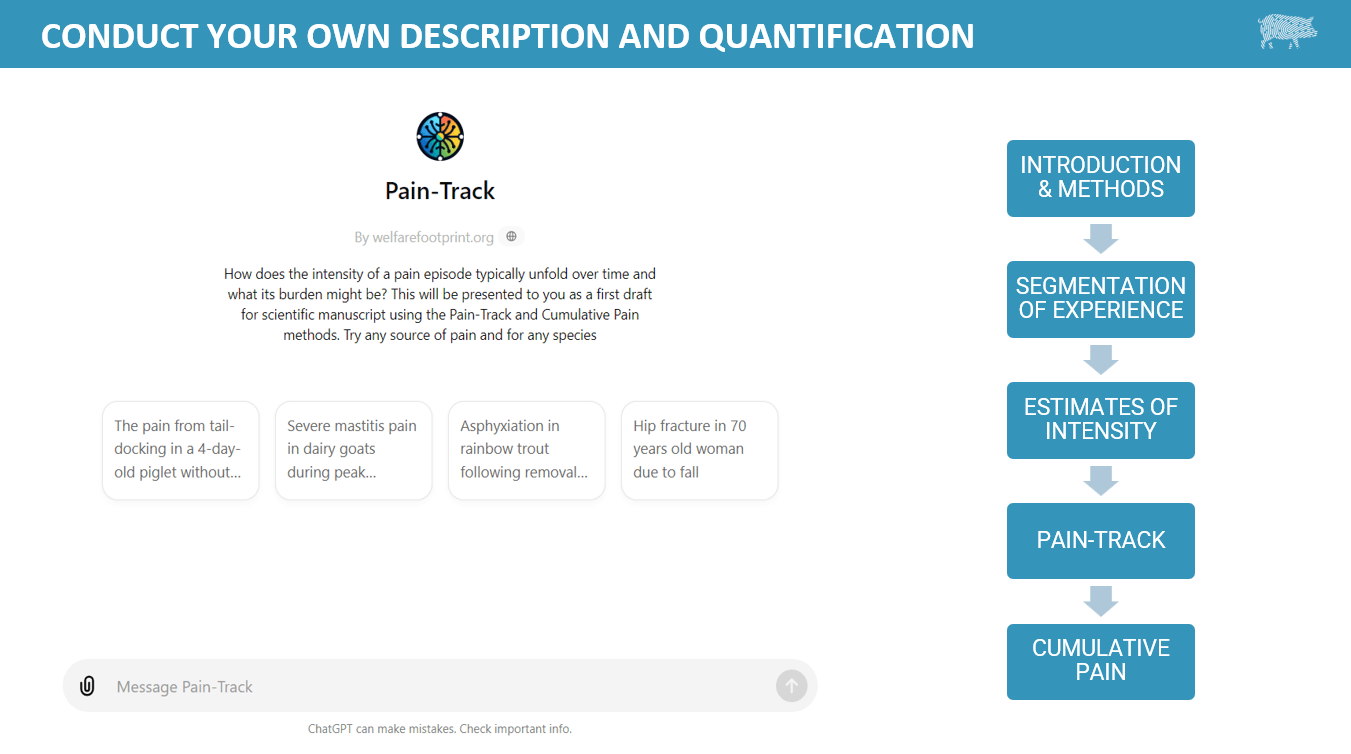
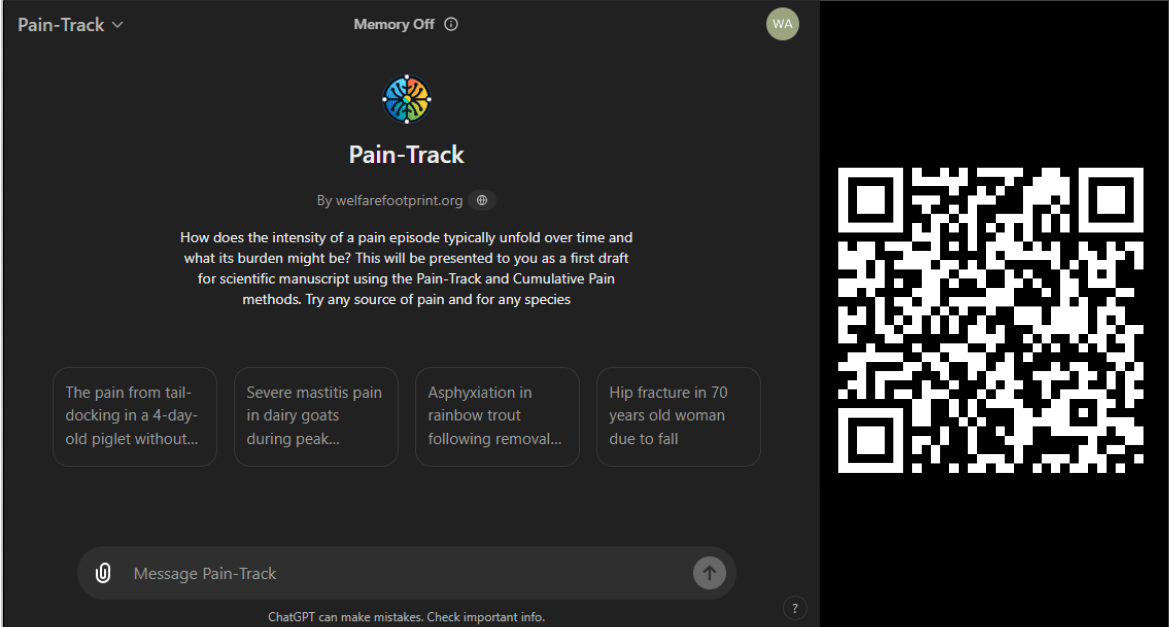
One of the tools we created is called Pain-Track GPT. The user provides the input data— which is any welfare experience such as the castration of a piglet—this tool generates a step-by-step draft of a scientific paper that quantifies and justifies the Cumulative Pain that this experience produces. The draft follows the structure of a scientific manuscript, including sections like the introduction, methodology, results, and discussion. Throughout this process, the tool asks for user approval at each stage.
The most detailed and critical part of the tool's work is justifying the division of temporal segments and estimating the probabilities of pain intensities. This phase takes the longest, but we’ve built the tool to ensure that it leverages the AI model’s capacity to gather as much evidence and reasoning as possible to generate the Pain-Track values more accurately.
If you scan the code on this slide or follow the link https://chatgpt.com/g/g-uzm30LW4j-pain-track , the Pain-Track GPT will guide you through the entire process. After providing your initial input (you can choose from the examples on the GPT’s opening page), you can simply keep entering “yes” to progress through each step, until you have a fully drafted manuscript. At any point, you can also engage in discussions with the tool, upload materials such as a PDF of an article or book, and even ask the tool to adjust its estimates based on new evidence or information you provide.
Although we haven’t yet used these AI-generated analyses for official Welfare Footprint publications, the quality of the outputs—even considering the technology’s current limitations and the need for human supervision—has been astonishing.
Currently, our primary use for the Pain-Track GPT is educational. Its simple interface makes it accessible even for people who are new to AI. We often use it in workshops to demonstrate how a full analysis for calculating Cumulative Pain is performed in real-time, allowing participants to interact with the tool and refine the analysis through AI-guided suggestions.
You can try out the tool yourself by opening this [link] and entering the name of any injury, illness, or condition that causes pain. More detailed inputs will lead to richer, more comprehensive analyses.
For example, here is a recording of an analysis examining the pain caused by asphyxiation in fish https://youtu.be/Bhf_ICByeNw?si=8Bsuh_c5nHoVvYUO .
As requested by one of you, we’ll also be running an analysis today on the psychological pain experienced by a mother cow due to the severance of the bond between a cow and her calf when male calves are separated from her.The results can be found here: https://chatgpt.com/share/670e3864-9378-8011-bc9a-ea487c68c1aa
Feel free to try out the tool and let us know if you have any questions, feedback, or suggestions for improvement!
Audience member: I just wanted to briefly know from either of you, if there was anything that was very surprising or shocking to you, in your research or in the simulation that you've run.
Cynthia: Even though we’ve been measuring welfare and examining different sources of suffering for about five years now, I still find myself shocked on a weekly basis by what we discover. When we quantify the prevalence, duration, and indirect impacts of various issues, I’m often most surprised by how common painful experiences are. For example, things like fractures, ulcers, tumors, or invasive procedures—I already know quite a bit, but I’m still taken aback by new statistics almost every week.
One thing that has truly shocked me is the extent of suffering among female breeders. Because they’re not as numerous as market animals, they don’t get as much attention. But in terms of concentrated suffering, this is a real hotspot in production chains. The burden they carry often exceeds what we typically assume in the advocacy world.
Speaking of concentration of suffering, we're incorporating a metric of inequality specifically designed to account for how welfare loss is distributed across individuals or sources. For example, imagine a total of 20 hours of pain at a disabling level. This could either be spread across four individuals, with each enduring 5 hours, or it could be concentrated entirely in one individual who suffers all 20 hours. While the total amount of this intensive pain is the same in both cases, the ethical concern differs: in the second scenario, the suffering is more concentrated, which makes it more troubling. We're working on an 'index' that would accompany existing estimates, helping us recognize that situations where suffering is concentrated in fewer individuals may be more severe, even if the total suffering is identical. A clear example of this is the case of female breeders, where suffering tends to be particularly concentrated and severe.



Executive summary: The Welfare Footprint Project provides a structured framework for quantifying animal suffering and evaluating welfare interventions, using a "Pain-Track" tool to estimate cumulative time in pain across different species and production systems.
Key points:
This comment was auto-generated by the EA Forum Team. Feel free to point out issues with this summary by replying to the comment, and contact us if you have feedback.