Hide table of contents

Last updated 2022-04-29.

Confidence: Highly likely.

Some people hold most or all of their wealth in a single asset. A few examples of common situations where people do this:

  • Alice works at Google. A large chunk of her compensation comes in the form of Google stock.
  • Bob bought bitcoin a few years ago and the price went up a lot. Now, bitcoin accounts for 50% of his net worth.
  • Carol used her retirement money to buy a second house, and she earns income by renting it out.

This is usually a bad idea, and you should go to great lengths to avoid it. It's bad even if you have high risk tolerance, because you can get a better expected return by building a diversified portfolio and then adding leverage.

Key points

  • On average, an individual stock provides the same expected return as the total stock market, but with 2-3 times as much risk. You could apply leverage to a total stock market index and get 2-3 times the expected return for the same level of risk as an individual stock. Or you could add leverage to the global market portfolio and get 3-4 times the expected return. [More]
  • The same principle applies to other types of individual assets, such as private company stock, rental properties, and cryptocurrency. [More]
  • If you hold a lot of money in a single asset and want to diversify, you may have to pay capital gains tax when you sell. The diversification benefits probably overcome the tax hit after about 3-10 years. [More]
  • You can reduce taxes by donating to charity, or by putting the money in a donor-advised fund or a foundation. [More]
  • If you're a major stakeholder in an asset, you might depress the price by selling. You can reduce your market impact by selling slowly, or by paying your broker to manage the sale for you. [More]
  • An exception: Altruistic investors don't just care about their own investments, but about the overall altruistic portfolio. If you hold an individual asset that other altruists can't hold, such as equity in a private company, it might make sense to keep it. [More]
  • If the effective altruism community holds on the order of $30 billion in overly concentrated investments, then diversifying these funds could be worth as much as $1 billion in additional donations per year. [More]

Note: In this essay, I make some illustrations using historical market data. Future market behavior will probably look different, so the exact numbers I use won't apply. But I expect the basic principles to remain true in the future.

Disclaimer: I am not an investment advisor and this should not be taken as investment advice.

A primer on risk

All else equal, investors prefer to reduce risk. We normally measure risk in terms of standard deviation: if asset A has twice the standard deviation of asset B, then A is twice as risky.[1]

An investor who wants to increase risk can apply leverage: borrowing money to invest. This amplifies the expected return and standard deviation of their portfolio. Specifically, both quantities increase in proportion to the amount of leverage used.[2] For example, using 3:1 leverage—borrowing money until you have 3x as much as you started with—would triple the expected return (minus the cost of leverage) and triple the standard deviation.

If we can freely use leverage,[3] we don't care about an asset's return or standard deviation. What we care about is the Sharpe ratio: the expected return minus the risk-free rate, divided by the standard deviation. If we want to take on greater risk, we can add leverage to increase both the return and the volatility. If we think our portfolio is too risky, we can mix in some T-bills. Either way, the Sharpe ratio stays the same.[4]

Therefore, when comparing investment choices, we should focus on the Sharpe ratios. In theory, we should invest in whatever portfolio has the highest Sharpe ratio, and then add leverage or mix in T-bills to hit the desired level of risk (although we can't always do this due to practical constraints). As we will see in the next two sections, we can expect a well-diversified global portfolio to provide a higher Sharpe ratio than almost any individual asset.

How risky are individual stocks?

I couldn't find any published research on the standard deviations of individual stocks. So I did my own analysis.

Using the Center for Research in Security Prices (CRSP) data set, I calculated the month-to-month standard deviation of every US stock from 1960 to 2015.

I divided stocks into categories by market capitalization, and calculated the average stock's standard deviation within each category. I defined the categories as follows:

  • Micro-caps: smallest 40% of stocks
  • Small-caps: 40th to 70th percentile
  • Mid-caps: 70th to 90th percentile
  • Large-caps: 90th to 99th percentile
  • Mega-caps: 99th percentile and above

This table gives the average volatility of stocks within each category, and the market cap of the smallest stock in the category as of 2015.

Standard Deviation Min Size
Micro 64% $0[5]
Small 48% $310M
Mid 42% $1.6B
Large 40% $8.3B
Mega 27% $75B

This graph shows the standard deviation by market cap of stocks from 1995 to 2015:[6]

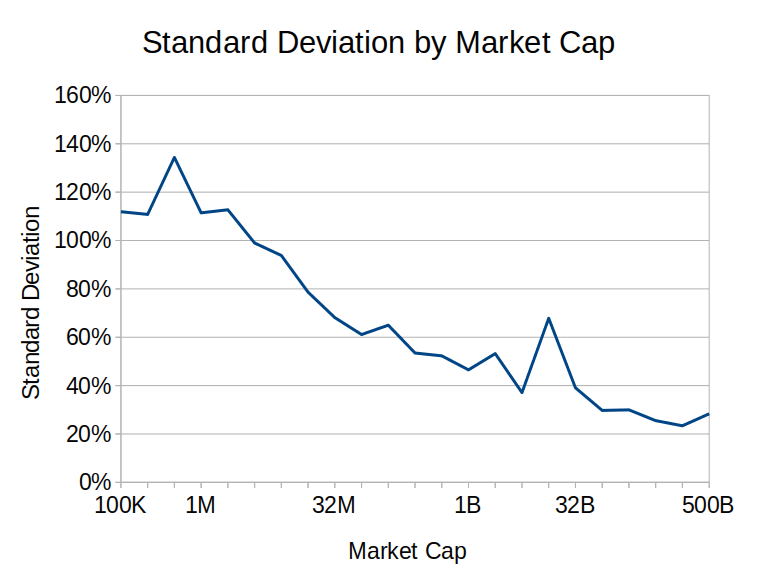
The US stock market has historically had a standard deviation of about 16%. By comparing to the data above, we can see that large-cap stocks experienced about double the volatility of the total market, and small-caps had triple the volatility. Mega-caps were more stable than other stocks, but still showed greater volatility than the total market.

We can corroborate this finding by looking at CBOE volatility indexes. These provide the market's best guess as to the future volatility of various assets. The VIX gives the projected volatility of the S&P 500; VXAZN, VXAPL, VXGS, VXGOG, and VXIBM project the volatilities of five select stocks (Amazon, Apple, Goldman Sachs, Google, and IBM, respectively). The exact relationships vary over time, but usually, the individual-stock volatility indexes are about twice as high as the VIX.

So far, we've seen that the US stock market as a whole is much less volatile than an individual stock. But it's usually not a good idea to invest only in US stocks. We can reduce volatility even lower by investing in the global market portfolio (GMP). How does individual-stock volatility compare to the GMP?

We can compare the US stock market to a fully diversified portfolio using data from Meb Faber's book, Global Asset Allocation. The book reports performance from 1973 to 2013:

T-Bills US Large-Cap GMP
Return 5.3% 10.2% 9.9%
Standard Deviation 1.0% 15.6% 8.5%
Sharpe Ratio 0 0.32 0.55

US large-cap stocks (think the S&P 500) had a Sharpe ratio of 0.32. The global market portfolio—which includes global stocks, bonds, and real assets—had a Sharpe ratio nearly twice as high, at 0.55.[7] Putting this together with the data on individual-stock volatility tells us that individual large-cap stocks were three to four times as risky as GMP, without a meaningfully higher return to compensate. Small-cap stocks were even riskier, although small-caps also tended to earn higher returns, so they had comparable Sharpe ratios to large-caps.

Individual large-cap stocks on average had only 1/3 the Sharpe ratio of the GMP. What does that mean in practical terms?

Suppose it's 1973, and you're comfortable with a lot of risk—your target is a 30% standard deviation. You could put all your money in a single stock (like Exxon or IBM) and earn a 10% average return over the next 40 years. Or you could buy the GMP, lever it up 3:1, and earn 19% after fees.[8] If you invest $100 in the single stock, you will have $4,500 by the end of 2013.[9] That same $100 in the global market portfolio will turn into $114,000.

Assets other than stocks

The same basic principle applies for single assets other than publicly-traded stock, such as houses, cryptocurrencies, or private equity. Individual assets are far more volatile than the global market portfolio.[10]

We don't really know how volatile individual house prices are, because most houses only get bought or sold once every few years. There's mixed evidence on how well the aggregate real estate market performs compared to the stock market, but my best guess is real estate performs as well or worse than equities after adjusting for risk. And buying a single property brings idiosyncratic risks, such as property damage or changes in demand in that particular city (or even neighborhood).

(This is not to say it's a bad idea to buy a house if you want to live in it. I'm specifically talking about buying real estate as an investment.)

We do know how volatile cryptocurrencies are: they're a lot more volatile than individual stocks.[11] So far, bitcoin has justified its volatility with high returns: from 2012 to the end of 2019, it had a Sharpe ratio of 4.1, far higher than that of the global market portfolio. If you expect it to continue returning an average of 300% per year, as it has since 2012, then it might be a good investment. But that's a pretty bold expectation, and I wouldn't count on it.[12]

On the subject of private equity, there's some evidence that venture capital firms outperform public markets.[13] But this outperformance comes with greater risk: three quarters of entrepreneurs end up with nothing. After adjusting for risk, startup founders on average earn less than they would at a salaried job.[14]

The impact of taxes

Suppose you have a lot of money in a single stock, and you want to diversify. But if you sell, you'll have to pay tax on the capital gains. How much does that matter?

As of 2020, most people in the United States have to pay 15% tax on capital gains. People in the top tax bracket have to pay 20%. Additionally, you may have to pay more if your state charges capital gains taxes. California residents in the top tax bracket have to pay 13.3% in state capital gains tax, for a total of 33.3%. (Apologies to readers outside the US; I don't know how your taxes work.)

Let's compare two hypothetical options:

  1. Keep holding the single stock, earning an expected 10% return without paying taxes.
  2. Sell the stock, pay capital gains tax, and invest in the global market portfolio with 3:1 leverage.

If you invest for long enough, option 2 will earn enough (in expectation) to overcome the cost of paying taxes. At a 15% tax rate, this only takes 1.9 years (in expectation). At a 33.3% rate, it takes 4.7 years. If you're a long-term investor, it looks appealing to take the tax hit in exchange for higher expected return.[15]

But most people probably don't want 3:1 leverage. What if you invest at, say, 1.6:1 leverage instead? With that amount of leverage, the global market portfolio historically had about the same volatility as the (unlevered) S&P 500.

Before we can answer which option is better, we have to resolve a problem. The GMP with 1.6:1 leverage has lower risk than a single stock, so just looking at the return doesn't fully capture why we prefer the GMP. How can we compare them?

The solution is to use certainty-equivalent interest rates. If you want 1.6:1 leverage on the global market portfolio, then your certainty-equivalent interest rate is 9.1% (calculated using historical data from 1973 to 2013).[16] That means you're indifferent between holding the GMP at 1.6:1 leverage and holding an asset that pays out a guaranteed 9.1% per year—which, at the 1973-2013 average risk-free rate of 5.3%, gives an excess return of 3.8% over the risk-free rate. (The risk-free rate today is much lower, so the forward-looking certainty-equivalent interest rate would be lower, too. The 9.1% figure only applies historically.)

Historically, an individual stock had a certainty-equivalent interest rate of 5.4% (0.1% plus the historical risk-free rate of 5.3%). Therefore, holding the GMP rather than the single stock was as good as a guaranteed 3.7% annual return (= 9.1% – 5.4%, or 3.8% – 0.1% if you exclude the risk-free rate). At a 3.7% interest rate, it takes 4.4 years to make up for a 15% capital gains tax, and 11.1 years to recover from a 33.3% tax. 11.1 years is a long time, but many investors have longer time horizons than that.

Reducing taxes by donating

If you ultimately plan to donate your savings, you can do three main things to reduce your tax burden:

  1. Donate your stock immediately instead of selling it.
  2. Put your stock in a donor-advised fund (DAF).
  3. Set up a foundation.

The first option makes sense if you want to donate now. If you want to donate later rather than now, then it doesn't work for you. But you might still be able to put your stock in a DAF. You can deduct donations to a DAF, and assets you hold inside a DAF don't incur capital gains tax. But DAFs have three important downsides:

  1. DAFs can only disburse funds to legally registered charities.
  2. DAFs charge fees, usually 0.6% per year.
  3. DAFs typically only let you invest in a few select mutual funds.

The annual fee means the longer you hold money in a DAF, the more money you lose to the fee. But if you keep your money in a taxable account, you have to pay taxes on dividends, which might cost you more than 0.6% anyway—in which case the DAF performs better by avoiding those taxes.

DAFs usually only allow you to invest in a dozen or so pre-selected mutual funds. You can use the available funds to construct a portfolio of global stocks and bonds, but you might not be able to buy alternative assets like gold. And if you want to do something more sophisticated like leverage or mission hedging, you're probably out of luck.

If you set up a foundation to hold your money, then the foundation is free to invest however you'd like. But foundations have relatively high fixed costs, so it probably only makes sense to create one if you want to donate a lot of money—perhaps somewhere around $10 million. (I don't know much about foundations, that's just my order-of-magnitude guess after reading a few articles about how they work.)

But be aware that US donors can only deduct 30% of their adjusted gross income (AGI) when donating appreciated securities. For example, if your income is $100,000, then you can't deduct more than $30,000 worth of stock. If you donate more than that (including by putting it in a DAF), then you only get to deduct the first $30,000. Foundations have stricter limits—donors can only deduct 20% of AGI when donating to a foundation. Under some circumstances, it might still make sense to make a non-deductible contribution to a DAF, because any assets inside the DAF will not incur taxes if they gain value.

Much more could be said about how DAFs and foundations work. This section is just meant to provide a starting point. I am by no means an expert on taxes; if you plan on incurring a large capital gain, you should first talk to a tax professional.

Major stakeholders care about market impact

If you're a major stakeholder in an asset, e.g., if you hold a significant fraction of the stock in a publicly-traded company, then you might not want to sell all your holdings at once. If you try to sell too quickly, that pushes down the price, and you end up selling at a substantial discount. That's not good.

You can still sell large holdings as long as you're careful. Most brokerage firms can assist large investors with making transactions (for example, Fidelity's active trader services). Interactive Brokers has an automated algorithm to do this (called accumulate/distribute); I don't know much about it personally, but an investment professional I trust told me that it works well.

Investors who want to make their own trades can use a simple approach to reduce their market impact (although this probably isn't sufficient for truly large transactions):

  1. Use limit orders, not market orders.
  2. When putting in a sell order, only slightly undercut the current best offer.
  3. Be patient. Be willing to wait several days to finish trading.[17]

Possible exceptions

In general, it's not a good idea to hold most of your net worth in a single asset. There is at least one exception: if you're an altruistic investor and you hold an asset that few other altruists own.

Self-interested people only care about how much money they have, but altruists care about how much money all other (value-aligned) altruists have. As an altruist, rather than focusing on your personal portfolio, you want to optimize the overall altruistic portfolio.

In some situations, it might make sense to hold most of your money in a single asset. For example, if you're a founder or employee at a small private company, you might be the only value-aligned altruist who can hold equity in that company. In that case, you might prefer to hold on to that equity instead of selling. Even though your personal portfolio is highly concentrated, you're actually diversifying the overall altruistic portfolio by investing in an asset when nobody else can (as long as your holding doesn't represent too large a percentage of the altruistic portfolio).

As far as I know, that's the only situation where concentrating your investments in one asset can actually reduce risk. But there are some other situations where you might be willing to accept concentration risk in exchange for some other benefit. For example:

  1. You put most of your wealth in a house because you want to own your own home.
  2. You're the founder of a company, and you want to control a majority of the voting shares.

Sometimes, considerations like these might matter enough to outweigh the extra risk. But people usually underestimate the risk involved in concentrating their wealth, and they should diversify more often than they do.

Expected value of diversifying

The effective altruism community probably has on the order of $30 billion in concentrated investments. If we collectively shifted all this money toward a globally diversified portfolio, historically that would have been worth a certainty-equivalent 3.7% return, or just over $1 billion per year. Of course, these numbers are rough estimates. And a lot of funds are probably concentrated in US equities, which isn't ideal but still isn't as bad as holding just a single stock. Ultimately, it seems likely that diversifying the collective effective altruist portfolio could be worth $500 million or more per year in extra donations.

Acknowledgements

Thanks to Peter Hurford, David Reinstein, and Gavin Taylor for reviewing drafts of this essay.

Changelog

2022-04-20:

  • Update expected value of diversifying based on how EA funding has grown.
  • Improve the standard deviation by market cap chart to be more readable.
  • Update footnote to reflect the changes to the aforementioned chart.

2022-04-29: Update "Key points" to reflect the changes from 2022-04-20.

Notes


  1. William Bernstein's short book Deep Risk explains how to think about risk beyond just standard deviation. He defines "deep risk" as the risk of permanent loss of capital.

    Individual assets carry much greater deep risk than diversified portfolios because they're much more likely to go to $0. But it's hard to quantify how much this matters. For the purposes of this essay, we will use standard deviation as the measure of risk because it's easy to reason about while still doing a decent job of capturing what we mean by "risk". ↩︎

  2. Technically, mean return doesn't increase in proportion to the amount of leverage. It increases in proportion to the amount of leverage minus the cost of leverage. If the cost of leverage equals the risk-free rate, then increasing leverage by a factor of N increases the return in excess of the risk-free rate by a factor of N.

    As of this writing, risk-free rates are close to zero, so it's reasonable to ignore the risk-free rate when making rough estimates. As we will see later in this essay, the risk-free rate used to be much higher, so we need to account for it when looking at historical market behavior. ↩︎

  3. Theoretical models assume investors can use however much leverage they want, and only have to pay the risk-free rate. That's not true in practice, but sophisticated investors can usually get leverage without having to pay too much. In Should Altruists Leverage Investments?, Brian Tomasik reviews a few methods for applying leverage. I personally get leverage via a margin loan from Interactive Brokers, although this might not be best for everyone. ↩︎

  4. Again, this isn't true in practice, because you probably have to pay more than the risk-free rate to get leverage. So adding leverage usually decreases the Sharpe ratio by a bit. ↩︎

  5. $0 is the lower bound on how small a micro-cap can be. In 2015, the smallest publicly-traded company was valued at a little under $100,000. ↩︎

  6. This graph includes 20 data points, where each point shows the average standard deviation for stocks in a given market cap range. All ranges are equally sized on a log scale (each range includes market caps between 2^n and 2^(n+1) for some value of n). For this graph, I included data from 1995-2015 instead of 1960-2015 to avoid concerns around market cap growth over time. A more rigorous analysis would still adjust for market cap growth, so this graph shouldn't be considered entirely accurate, but it's reasonably close. I didn't try to make this adjustment because it's not entirely obvious what the proper way to do it is.

    Technically, the x-axis labels are wrong because they label ranges starting with a power of 2, e.g., the point labeled "100K" includes all stocks with a market cap between $131,072 (2^17) and $262,144 (2^18). ↩︎

  7. Bonds performed unusually well from 1973 to 2013 (compared to their average performance over the past two centuries), which means we can probably expect a worse return from the global market portfolio going forward. But US stocks also performed unusually well over this period. We can't say how exactly the relationship between these two portfolios will change in the future, but we have good theoretical and empirical reasons to expect the global market portfolio to perform better on a risk-adjusted basis than the US stock market.

    (The good performance of bonds is somewhat accounted for by a high risk-free rate, which we subtract out of return when calculating the Sharpe ratio.) ↩︎

  8. This assumes you pay the risk-free rate as a cost of leverage. If you pay the risk-free rate plus 0.5% (which is what Interactive Brokers charges for large account holders), you'd make 18% instead of 19%. ↩︎

  9. That's how much you would have on average. In actuality, you probably would have done much better or much worse. Many public companies went bankrupt over the period. But you might have gotten lucky and picked one of the big winners. ↩︎

  10. Government bonds are an exception to this. Arguably, gold is an exception as well, depending on what "far more volatile" means. Gold is riskier than the global market portfolio, but probably less than twice as risky. Another possible exception is Berkshire Hathaway. But there aren't many exceptions. ↩︎

  11. The linked web page gives implied daily volatility instead of annual. Multiply it by the square root of 365 to get the implied annual standard deviation. ↩︎

  12. On the other hand, I thought bitcoin was a bad investment back in 2011, so what do I know. ↩︎

  13. Cambridge Associates (2018). US Venture Capital Index and Selected Benchmark Statistics. ↩︎

  14. Hall & Woodward (2010). The Burden of the Nondiversifiable Risk of Entrepreneurship. ↩︎

  15. Technically, you actually don't care about the expected number of years until you have more money with option 2. What you care about is the expected number of years until you have more utility of money. We can calculate this using certainty-equivalent interest rates, which I will do later in this section. ↩︎

  16. I derived this number as follows:

    1. Assume an isoelastic utility function with a relative risk aversion coefficient of 4.
    2. Using Merton's formula from Lifetime Portfolio Selectin Under Uncertainty: The Continuous-Time Case (1969), this gives optimal leverage of 1.6:1.
    3. Calculate expected utility of the GMP at 1.6:1 leverage.
    4. Invert the utility function to find the constant interest rate that provides that much utility.

    Calculations were performed using leverage.py.

    As a side note, it seems unlikely to me that altruistic investors would want to use a relative risk aversion coefficient of 4. Another way we might decide to use 1.6:1 leverage by making more pessimistic assumptions about future return. ↩︎

  17. The longer you wait, the greater volatility your holdings might experience. There's a theoretical model that defines how to trade off transaction costs vs. volatility risk: see Almgren & Chriss (2000), Optimal Execution of Portfolio Transactions. ↩︎

97

0
0

Reactions

0
0

More posts like this

Comments20
Sorted by Click to highlight new comments since: Today at 8:35 AM
Kit
3y11
0
0

I think this is the best intro to investing for altruists that I've seen published. The investment concepts it covers are the most important ones, and the application to altruists seems right.

(For context: I used to work as a trader, which is somewhat but not very relevant, and have thought about this kind of thing a bit.)

Thank you, I appreciate the positive feedback, especially from someone as knowledgeable as you!

Some tentative thoughts on real estate (I haven't thought about this much):

  • The real estate market is presumably less efficient than the stock market, so it's easier for careful individuals to make market-beating investments. (It also makes it easier to make investments that underperform the market, but I'd probably expect EAs to be better at this than the average home buyer, though I'm not entirely sure.)
  • My guess would be that the real estate market is overall less investable than global stock markets (REITs only cover a limited fraction of the overall real estate market), such that more altruists owning houses would lead to a better approximation of a global market portfolio.

If these points were true, that would mean that the introductory example of Carol renting out a home could actually be a good idea (if Carol is an altruist).

Even if you can beat the market by buying a basket of houses (which I'm not sure is true), buying a single house has probably 2-3x the risk of the broad real estate market and 3-4x the risk of the global market portfolio, assuming real estate works similarly to stocks (which is probably a reasonable assumption). So it still seems like a bad idea, for the reasons discussed in the essay.

It might make sense if a bunch of individual EAs buy real estate such that the overall portfolio is well-diversified. I don't expect this to happen in practice, because EAs are geographically concentrated in a small number of cities, so if people own investment properties in the cities where they live, the overall EA real estate portfolio will be too concentrated in those cities.

It might make sense if a bunch of individual EAs buy real estate such that the overall portfolio is well-diversified. 

Yeah, this is what I was trying to say. Perhaps I was unclear.

I don't expect this to happen in practice, because EAs are geographically concentrated in a small number of cities, so if people own investment properties in the cities where they live, the overall EA real estate portfolio will be too concentrated in those cities.

EAs can diversify the overall EA real estate portfolio by thinking about where other EAs are likely to buy houses. E.g., they should avoid buying a house if they moved to an EA hub city, but they should buy (or avoid selling) a house in their hometown, especially if they come from a place that doesn't have a lot of EAs.

In addition, buying houses in EA hub cities might be somewhat of a hedge against a change in living costs in those key locations, such that overweighting these could actually be more beneficial than harmful.

Anyway, all of this is a bit of a nitpick, I generally agree with the overall direction.

This is a really excellent piece of work on bringing these concepts to a broader audience. I'm quite interested in long-term investment modelling so I'd like to offer my thoughts. Of course, the below isn't advice, so please don't make investment decisions purely on my comments below.

It's great that you are thinking about how to adjust standard investing concepts based on the notion that it is the total altruistic portfolio that matters, which is formed in a decentralised way. I agree this adds to the rationale for being "overweight" the company that the investor founded, or investing in individual properties. This is not how a typical investor thinks, so there is likely scope to think further along these lines. Either to improve coordination between EA investors, or to better implement a decentralised solution by departing from standard investment concepts.

I think your idea extends to alternative investments. Common wisdom in institutional investment is that it requires greater governance capabilities to invest in the more diversifying assets, such as infrastructure, some hedge funds, unlisted (commercial or residential) property, and private equity. That is, they require greater expertise, more time spent on investment processes, necessitate more careful cashflow management due to illiquidity, and potentially other challenges. And that greater governance capabilities are rewarded - see https://link.springer.com/article/10.1057/jam.2008.1. If an EA investor cares only about the overall altruistic portfolio and is capable of making/managing such investments, then it might make sense to overweight them. Some of them might be accessible through pooled funds.

In the article you rely on the standard deviation of annual returns as a measure of risk. But long term risk isn't well captured by that. Taking a step back, risk should ultimately be defined based on altruists' utility function over spending at different points in time. For example, there might be "hinge" moments when altruistic spending is especially effective. Imagine there is going to be a massive opportunity in 100 years to influence the creation of AGI by altruistic spending. In that case, we don't really care if the annual standard deviation of returns is high. We care only about the probability distribution of the 100 year return.

There is a limit to the ability of leverage to magnify returns. This is partly because of the asymmetry of returns. For example, if you start with $100, then experience -50% return then +50% return, you end up with $75. Assuming you readjust your borrowing amount regularly alongside changes in the asset value,  this effect is magnified by leverage and detracts from the overall return. See https://holygrailtradingstrategies.com/images/Leveraged-ETFs.pdf for more. 

Leverage has a strong role in the Capital Asset Pricing Model theory you're using. The theory does however assume away various challenges to do with leverage, like the one above. In general, it is uncommon for institutional investors (pension funds, university endowments, charitable foundations, etc) to directly borrow to invest. However, they may outsource it to a money manager, e.g. a hedge fund, who can access a decent borrowing rate on their behalf and who has the expertise to manage it. I'm not saying that leverage should never be used by EA investors. Rather, I would be quite careful before deciding to use it.

When actuaries model (commercial) real estate, it's normally assumed that both its risk and expected return are somewhere in between those of shares and bonds. Arguably, real estate has characteristics of each, as it is an asset used for productive enterprise, and since leases typically provide regular fixed rental payments. Nevertheless, I would look to property indices' historical data for guidance. 

Certainty equivalence may not be the right concept for measuring the value of moving all EA investments to a global market portfolio. I would instead compare the sharpe ratios. If you want to put an expected dollar figure on it, one way would be to calculate the increase in expected return you could achieve while holding risk constant. This avoids needing to make an assumption about investor risk preferences, which the certainty equivalent concept relies on.

I haven't read all your footnotes so perhaps some of the above is mentioned there. Nevertheless, I hope my comments are helpful and I am glad people in EA is actively thinking about this. Happy to chat more if you are interested.

What's the closest we can get to the global market portfolio with leveraged ETFs?

I have no comment on whether it's a good idea to build the global market portfolio with leveraged ETFs, but since you asked:

You can use the etf.com screener to find ETFs matching your criteria. I just searched on there and based on the 10 minutes I spent looking, I think this is about the closest you can get:

20% SPXL: 3x leveraged S&P 500
30% EFO: 2x leveraged MSCI EAFE (developed markets, excluding US)
5% EDC: 3x leveraged emerging markets equity
40% TMF: 3x leveraged 20+ year US Treasury bonds
5% UGL: 2x leveraged gold

This is still not really the global market portfolio, but it's at least kind of close. Also a couple of these ETFs are really small, so they'll have high trading costs.

If you're aiming for only, say, 1.5x leverage, you can buy some of the above (starting with the ones with the lowest fees) and fill the gaps with correspondingly larger amounts of other asset classes.

What are your thoughts on using max drawdown instead of volatility, or the Sortino ratio instead of Sharpe? Personally I'm more partial to both of them, maybe in part because it makes planning for the future easier, but maybe it's also giving into the endowment effect?

Portfolio Visualizer allows you to minimize max (historical) drawdown for a given target return.

IMO the ulcer index is the best measure of volatility that matches what people intuitively care about. It essentially measures the frequency and severity of drawdowns (the linked page explains it in more detail).

I didn't discuss the ulcer index in this post because in theory, investors with isoelastic utility should care about standard deviation, not drawdowns, and I lean toward the belief that people's focus on drawdowns is somewhat irrational (although probably somewhat justified by the fact that most asset returns are left-skewed). But broadly speaking, if you use the ulcer index as your measure of risk, concentrating in a small number of assets looks even worse than if you use standard deviation, so the case for diversification is even stronger.

My thinking is that donating during drawdowns might be particularly bad, both personally and for your longer term donation strategy, since you're selling low and "locking in" large losses in your portfolio. So minimizing drawdown allows you to better plan your budget and donations, and allows you more flexibility in timing your donations. You might find a particularly good donation opportunity during a drawdown period that will only be available during that period, but it'll be extra costly (personally and to future donations) to donate then, so avoiding such drawdowns seems like an especially good thing to do.

Also, Sharpe penalizes extreme upside compared to Sortino, which seems weird to me.

Is it actually the Sharpe ratio that should be maximized with isoelastic utility (assuming log-normal returns, was it?)?

But broadly speaking, if you use the ulcer index as your measure of risk, concentrating in a small number of assets looks even worse than if you use standard deviation, so the case for diversification is even stronger.

Makes sense.

My thinking is that donating during drawdowns might be particularly bad

This is true, and the standard deviation fully captures the extent to which drawdowns are bad (assuming isoelastic utility and log-normal returns). Increasing the standard deviation is bad because doing so increases the probability of both very good and very bad outcomes, and bad outcomes are more bad than good outcomes are good.

Is it actually the Sharpe ratio that should be maximized with isoelastic utility (assuming log-normal returns, was it?)?

Yes, if you also assume that you can freely use leverage. The portfolio with the maximum Sharpe ratio allows for the highest expected return at a given standard deviation, or the lowest standard deviation at a given expected return.

Thanks for this! Super interesting.

A question I often have about the index-fund approach: if we were in a past historical moment, wouldn't VC-style investment on moonshots perform better than index investing?

e.g. if we were in 1910, wouldn't it be better to invest in a portfolio of moonshots that included Ford and Edison, rather than in a broad market index? (Most of the moonshots would fail but Ford and/or Edison would bring in massively outsized returns)

The answer sort of depends on what you mean by moonshot, but under one reasonable definition, it's actually the opposite: investing in potential moonshots would have resulted in worse performance than an index fund. Or to put it another way, boring companies tend to outperform exciting companies.

You can divide stocks into two types: growth stocks and value stocks. Value stocks are cheaply priced relative to their fundamentals (e.g., they have a low price to earnings or price to sales ratio) because the market expects these companies to be "boring" and not show good earnings growth. Growth stocks are priced expensively because the market expects them to grow. This sounds basically like what you're talking about with "moonshot" companies. If you wanted to systematically invest in moonshots, you could maybe buy the 10% most expensive stocks, because these are the ones the market believes have the most upside potential. But if you did that historically, you would've underperformed the market by a lot—something on the order of 5 percentage points per year. The seminal paper on this is Fama & French (1992), The Cross-Section of Expected Stock Returns.

In theory, savvy investors could identify the most promising publicly-traded growth companies and outperform the market by buying them. But studies on fund managers have found that pretty much nobody can do this.

I'm curious to hear Michael's response, but also interested to hear more about why you think this. I have the opposite intuition- presumably 1910 had its fair share of moonshots which seemed crazy at the time and which turned out, in fact, to be basically crazy, which is why we haven't heard about them.

A portfolio which included Ford and Edison would have performed extremely well, but I don't know how many possible 1910 moonshot portfolios would have included them or would have weighted them significantly enough to outperform the many failed other moonshots.

Right, so if you had good judgment and a reasonable network, I think you could find a lot of the promising opportunities.

Someone would be like "I have a device that produces bright light at a low cost, and I need funding to manufacture it on a massive scale."

So you'd be like "Really? Let me see this device."

You'd inspect the device, see that it does in fact do the thing the inventor says it does, and then after further diligence on the business plan & team you'd invest.

I think this is roughly how to go about separating the real opportunities from the snake oil.

Worth remembering that, especially today, there are hundreds of thousands to millions of other highly intelligent and resourceful people trying to do the exact same thing. So you need to have a reason to believe you can do a better job than they can.

Yes, I think the crux here is how good you think your judgment/taste is relative to that of all the others who are trying.

Historical anecdote:

Philippe LeBon was a French civil engineer working in the public engineering corps who became interested while at university in distillation as an industrial process for the manufacturing of materials such as tar and oil. He graduated from the engineering school in 1789, and was assigned to Angoulême. There, he investigated distillation, and became aware that the gas produced in the distillation of wood and coal could be useful for lighting, heating, and as an energy source in engines. He took out a patent for distillation processes in 1794, and continued his research, eventually designing a distillation oven known as the thermolamp. He applied for and received a patent for this invention in 1799, with an addition in 1801. He launched a marketing campaign in Paris in 1801 by printing a pamphlet and renting a house where he put on public demonstrations with his apparatus. His goal was to raise sufficient funds from investors to launch a company, but he failed to attract this sort of interest, either from the French state or from private sources. He was forced to abandon the project and return to the civil engineering corps. Although he was given a forest concession by the French government to experiment with the manufacture of tar from wood for naval use, he never succeed with the thermolamp, and died in uncertain circumstances in 1805.