This is a crosspost from the new Animal Welfare Alignment Newsletter by Anima International. You can subscribe on Substack if you are interested in following these efforts. Audio reading also available on Substack.
The goals of this post are to:
1. Raise a question I see as crucially important to the goal of aligning AI to animal welfare...
“How long have you been v*g*n?”
This is one of the most common icebreakers at animal protection events. It’s a baseline assumption, and it mostly holds true: if you’re out advocating for animals not to be tortured or abused, realistically these days you are v**n, or close. And it makes for good conversation. It seems fairly safe to assume when you meet strangers.
But this assumption is hurting the movement in a way which we don’t always notice: someone new comes into the sp...
AI Use Note: Main body text entirely human written. Claude (Opus 4.8) helped develop models of animal life histories in the appendix.
Cross-posted from Good Structures.
Executive Summary
* Animal advocates sometimes make claims like “there are X of this animal...
Due to complications, despite generous efforts from the audio team, the audio recording is almost completely inaccurate for several parts of this. listener's discretion is advised.
Also, it has come to my attention that this does not include the discrete case, and the probability distribution functions are a bit wonky, as the method currently provided is optimized purely for comparing abstract functions. At the moment, the function treats probability distributions* as though there is a uniformly randomly distributed input (x), and a non-uniform output (fi(x)), and the probability distribution* of fi(x) is as |f′i(f−1i(x))|* for the continuous function fi(x), (f−1i(x) being the inverse function of fi(x).). I am working to fix this. (I am currently undergoing more time-effective projects, and this article will likely be outdated until many months from now, if ever.)
Explanation
In summary, the function takes input functions and outputs the expected highest output given some randomly generated input for each input function.
This can be used to see how many jobs you should consider, how many charities to look into, and many other things. For the sake of the example, we'll use restaurants.
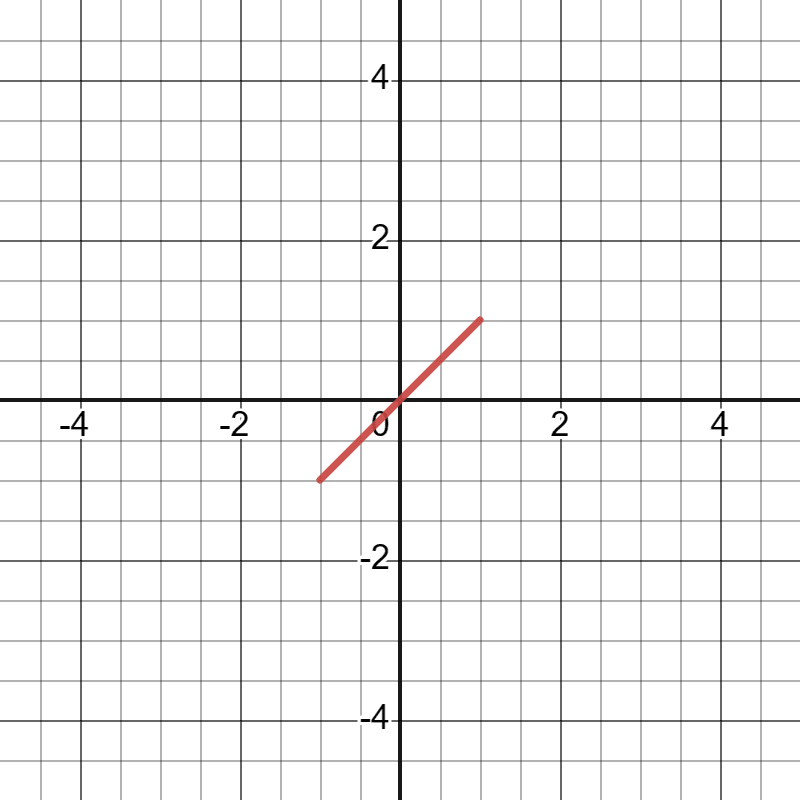
Let's say you want to know how many restaurants you should try before deciding where you should go to dinner. Each restaurant is assigned a "Tastiness value" between -1 and 1, with a uniform probability distribution[1][2]. This can be expressed with the function f1(x)=x,and−1<x<1.
For that, you would have input f1(x)=x,a1=−1,b1=1,c2=0,c3=0 into the function on desmos.
and c1 being however many restaurants you visit.
the value of fd then predicts the expected value of [the best restaurant you find]. input different values for c1 until the value of fd meets your needs.
Now, let's say that you now have the option of delivery.
The distribution of good delivery places to bad places is f2(x)=x,and−0.5<x<0.75[3][4]
Now, you would add the inputs f2(x)=x,a2=−0.5,b2=0.75,
and c2 being the number of delivery places you order from.
change c2 and c1 until you are satisfied with the result.
If you have any suggestions as to how I can make this clearer, or a better way of finding the expected value of the best option, or any wording that could be done differently, tell me. (ONLY if you want). No pressure.
The distribution could've been different. For example, if no restaurant is bad, and good restaurants have diminishing returns, the function could be log10(x), where 10<x<10,000. or if restaurants are more likely to be good, the function could be x(x+1)/2, where −1<x<1.
This would be because you could look at the rating of each place on most delivery apps, which eliminates terrible places, but the food is less fresh, causing slightly less food. (This doesn't perfectly reflect reality though)
The formula doesn't work if there's a correlation in-between values (For example, maybe you get delivery more from the good restaurants, making a correlation between restaurants and delivery.)

I didn't even know you could make a table and then embed youtube videos within the table on EA Forum posts! Very cool.
Thanks :)