Comments
Summary
- This analysis studies Open Philanthropy’s AI grants.
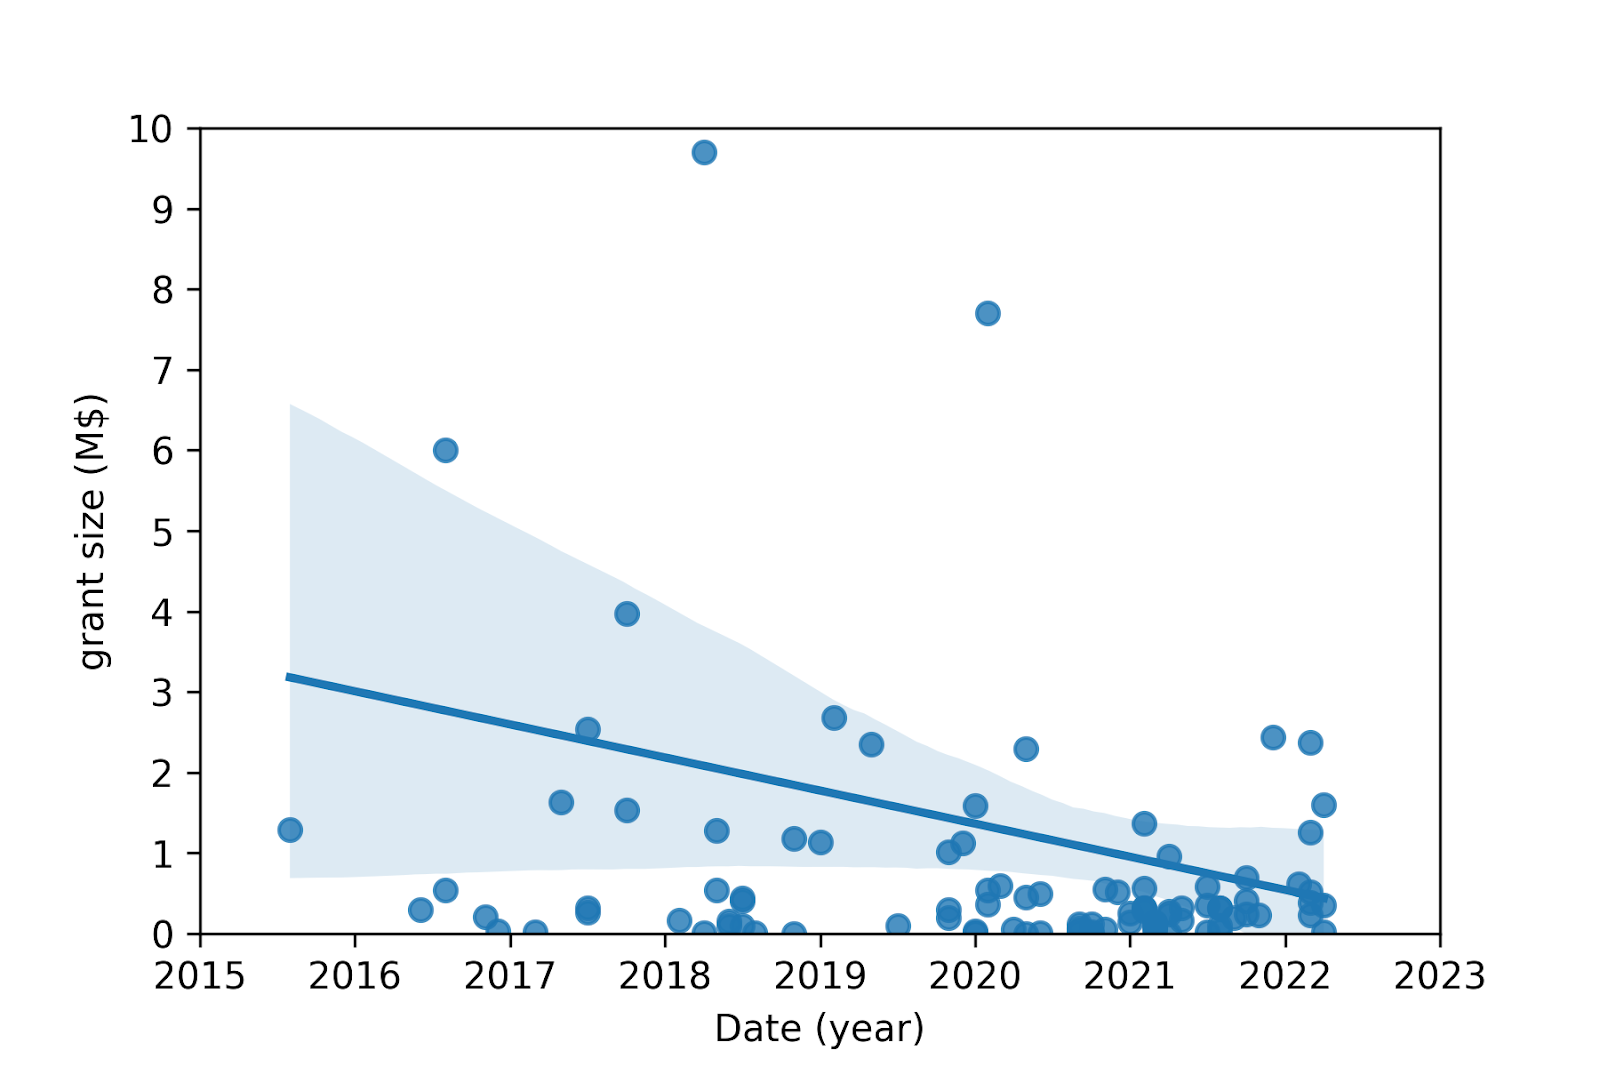
- The grant size has become smaller (confidence of 50 %), having decreased 0.3 M$/grant/year (coefficient of determination of R^2 = 0.4 %).
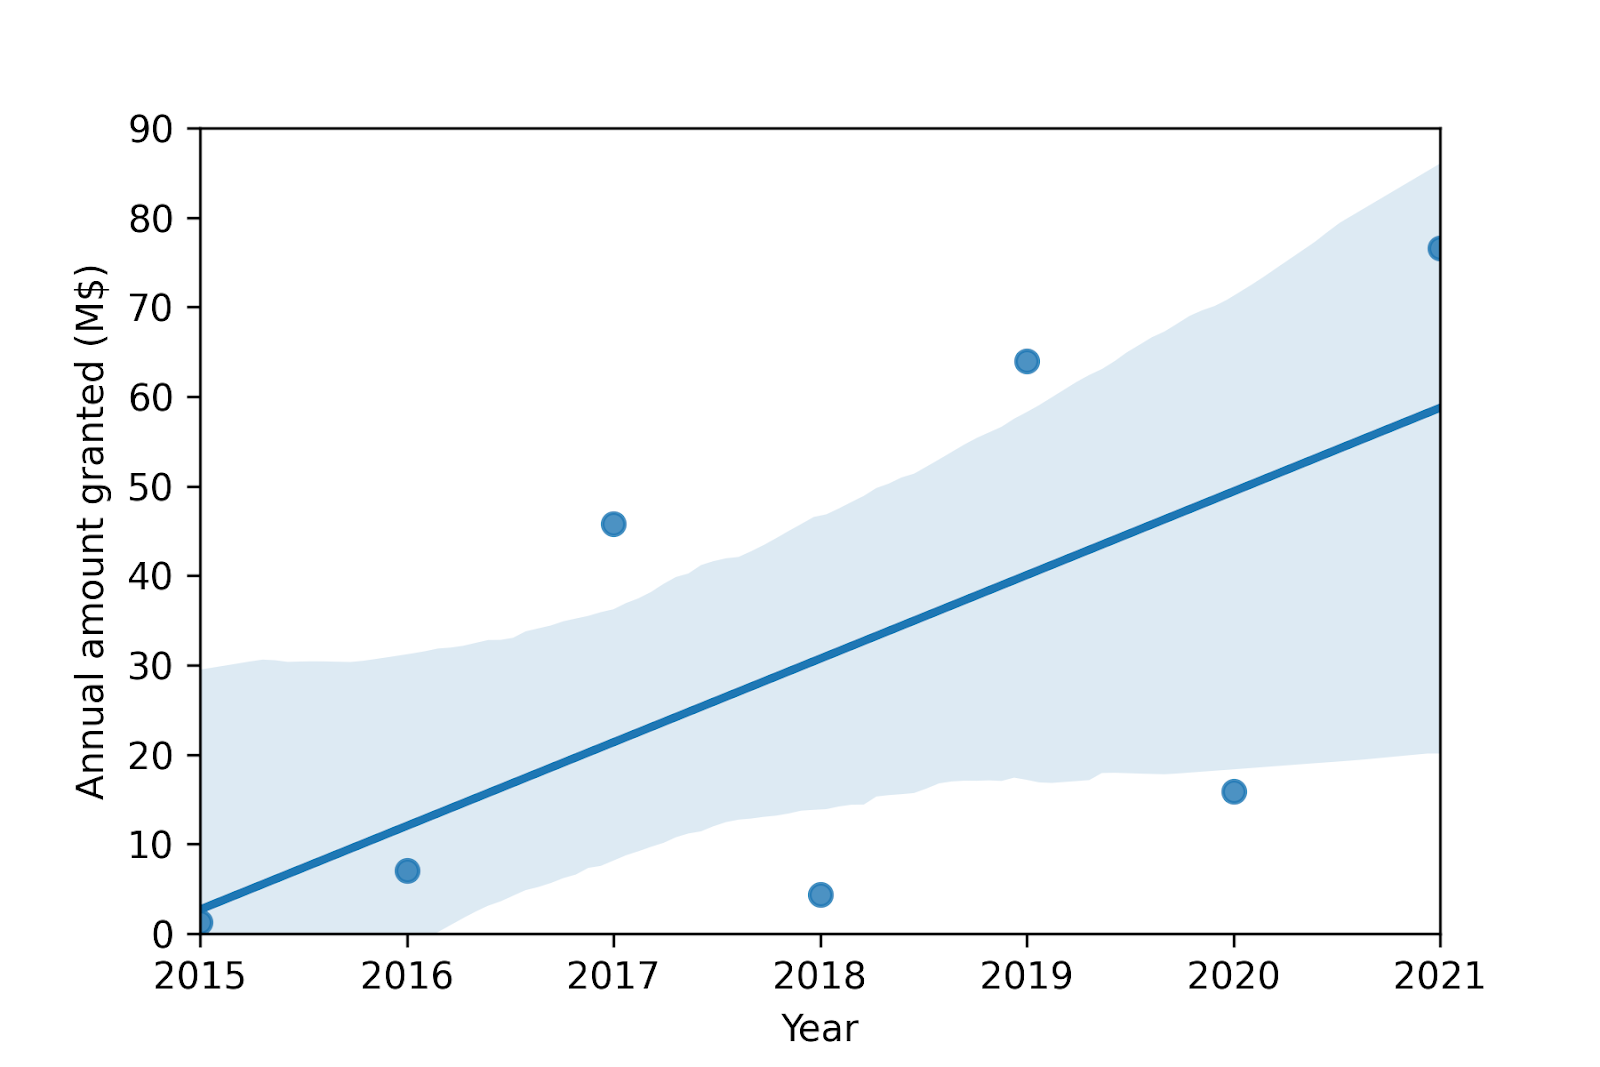
- The annual amount granted has become larger (confidence of 90 %), having increased 9 M$/year (R^2 = 40 %). Linearly extrapolating this tendency forward, the annual amount granted is predicted to be:
- 105 M$ in 2025.
- 170 M$ in 2030.
Acknowledgements
Introduction
Open Philanthropy (OP) is a major funder of work which aims to reduce AI risk. Consequently, studying OP’s past AI grants may be helpful to inform efforts to decrease AI risk.
Methods
OP’s AI grants were considered as those in OP’s grants database whose focus area is Potential Risks from Advanced AI[2]. The resulting 107 grants are in tab “Grants” of this Sheets. The grant amounts were adjusted for inflation based on data from in2013dollars (see tab “Inflation”), and are expressed in 2020-$.
The following linear regressions were studied for OP’s AI grants:
- Grant size on date.
- Annual amount granted on year.
Results
The results were determined with this Colab. The linear regression parameters, data points, linear trends and respective 90 % confidence intervals are presented in the tables and figures below.
Grant size
Linear regression of grant size on date | |
| Slope (M$/grant/year) | -0.257 |
| Intercept (M$) | 522 |
| Correlation coefficient | -0.0601 |
| Coefficient of determination | 0.00361 |
| P-value[3] | 0.539 |
| Standard error of the slope (M$/grant/year) | 0.417 |
Annual amount granted
Linear regression of annual amount granted on year (2015-2021) | |
| Slope (M$/year) | 9.34 |
| Intercept (M$) | -18.8 k |
| Correlation coefficient | 0.650 |
| Coefficient of determination | 0.423 |
| P-value[3] | 0.114 |
| Standard error of the slope (M$/year) | 4.88 |
Discussion
The above analysis of OP’s AI grants indicates that:
- The grant size has become smaller (confidence of 50 % = 1 - 0.539), having decreased 0.3 M$/grant/year (R^2 = 0.4 %).
- The annual amount granted has become larger (confidence of 90 % = 1 - 0.114), having increased 9 M$/year (R^2 = 40 %).
The trend of the grant size cannot be meaningfully extrapolated forward, given the low coefficient of determination of 0.4 %.
The trend of the annual amount granted can be projected forward more meaningfully, given the higher coefficient of determination of 40 %. Assuming an annual inflation rate of 1.75 %[4], the annual amount granted is predicted to be:
- 105 M$ in 2025, which is 50 % larger than the 70.4 M$ of Metaculus’ community prediction (as of 25 July 2022).
- 170 M$ in 2030, which is 40 % larger than the 125 M$ of Metaculus’ community prediction (as of 25 July 2022).
- ^
This analysis was performed as part of a paid work trial at Epoch.
- ^
The focus areas of the downloadable CSV file of the database are not in agreement with those of the website. The latter were considered correct, as there were only 3 grants in the CSV with focus area “Potential Risks from Advanced AI”.
- ^
Considering null slope as the null hypothesis.
- ^
Annual inflation rate between 2010 and 2020. Computed in cell B12 of tab “Inflation”.


It seems like normality is violated on the first graph, have you tried taking a log transform or something?
Thanks for commenting!
I had not tested it, but your are kind of right! Applying the Shapiro-Wilk normality test to:
So it looks like we can confidently reject the grant size following a normal distribution, but it could well follow a lognormal distribution. This aligns well with my expectations.