I’m glad CEA is sharing this data, but I wish the post focused more on the important question posed in the title: Is it still hard to get a job in EA? I think the data suggests quite strongly that the answer is “yes”, but the authors don’t seem to take an explicit stance on the issue and the Summary of the post arguably suggests the opposite conclusion.
Here’s why I think the data implies EA jobs are still hard to get:
Only a (very?) small percentage of applications led to a job. The report describes a 2.4% hiring rate for Core jobs (itself a low figure), but I think a more accurate number would be 1.85% = (7 hires/ (54 applications per role * 7 roles)). The 2.4% figure is “Weighted by the number of applicants in each stage” but I’m not actually sure what that means, and in any case the raw number of hires/applicants makes the most sense to me. I also think it’s important to include the EOI numbers; these roles received just as many applicants as Core jobs, but led to no hires. (For the same reason, I’d find it valuable to include data from Operations and other roles that were excluded from this analysis, as they all help inform the question of whether EA jobs are hard to get.) Including EOI applications, we get a hiring rate of 1.1% of total applications.
If “Ashby hires 4% of applicants, compared to 2% at CEA”, it seems like quite a stretch for the Summary to say “the probability of an applicant receiving an offer was similar to industry averages.” At the very least, I’d like to see the figures included in the Summary so readers could draw their own conclusion. Also, while Ashby hired 4% of applicants they gave job offers to 8% of applicants; the latter figure is more relevant to the question at hand. CEA’s analysis implies that their offer rate and hire rate were the same (please correct me if I’m misinterpreting), which itself is a suggestion that EA jobs are hard to get. If the offer rate in the Ashby survey is 4x CEA’s offer rate (8% vs 2%), that’s a very sizeable difference.
The Product Manager jobs included in the Ashby survey were all jobs at “high-growth tech companies”, which are probably more competitive than the same role at “all tech companies” or “all industries”. So I’d interpret the benchmarking data as saying that CEA’s Product Manager role was more competitive (much more competitive if CEA’s offer rate equals its hire rate) than an unusually competitive subset of private sector Product Manager jobs.
I agree with the comments from Vaidehi and Denkenberger about why this analysis may understate the availability of EA jobs.
There are a few different ways to look at the probability of being hired. As you suggest, one would be to take the total number of hires and divide it by the total number of applicants, across all recruitment. We chose not do to this here because the EOIs are substantially different from the Core roles (in having a higher bar for progression, etc.), which would make an overall figure less useful. (The CEA website does emphasise the difference between main roles and EOIs, so it is something prospective applicants are made aware of when applying.)
When we "weight by the numbers of applicants in each stage", this just means that we're taking the average across applicants, and not across roles. (Worked example: two Roles A and B each hired one person. Role A has 100 people in stage 1, with probability of success 1/100=1%; Role B has 10 people in stage 2, with probability of success 1/10=10%. The probability of success when weighting is (1%*100 + 10%*10)/110 = 2/110 = 1.8%; but when averaging across roles it is (1%+10%)/2 = 5.5%)
Regarding the industry comparison, as you mention there are ways in which CEA might be more selective than industry and other ways in which CEA might be less selective. As Ben mentions in an earlier comment, we probably don't have solid enough evidence to call it in one direction or another.
EOIs are substantially different from the Core roles (in having a higher bar for progression, etc.), which would make an overall figure less useful.
If EOIs are hard to get, that seems relevant to the question of whether EA jobs are hard to get since EOIs are quite sought after (as many applicants as core jobs despite less chance of getting hired). But since AFAIK CEA is the only EA org that has EOIs, I can certainly see the case for excluding them from the sample.
we're taking the average across applicants, and not across roles.
100% agree this is the right methodology. But I still think 1.85% is the relevant number (number of hires/number of applicants). From your answer to Khorton, it sounds like your 2.4% figure excludes the Core job you didn’t hire for (which seems to have gotten more applicants than the average core job). I don’t understand that decision, and think it makes it harder to answer the question of whether EA jobs are hard to get.
Regarding the industry comparison, as you mention there are ways in which CEA might be more selective than industry and other ways in which CEA might be less selective. As Ben mentions in an earlier comment, we probably don't have solid enough evidence to call it in one direction or another.
Can you provide CEA’s offer rate, for the PM role and for core jobs overall? Hire rate really isn’t the best measure for determining whether jobs are hard to get.
FWIW, I’m not sure why Ben thinks hires as a “percent of applicants who get to the people ops interview stage” (the only stage where CEA is more likely to hire, and not an apples-to-apples comparison since CEA has a work trial before it and Ashby doesn’t) is the right metric. He suggests he likes that metric as a way to exclude low-quality applicants, but the better way to do that is to look at hires (or ideally offers) as a percent of people who make it past the initial screen (which is more restrictive for Ashby than CEA). CEA hires 1 in 28 people who make it past the first screen; the Ashby sample hires 1 in 12 (and makes offers to 2 in 12).
Hey, apologies that it has taken us so long to get back to you on this.
From your answer to Khorton, it sounds like your 2.4% figure excludes the Core job you didn’t hire for (which seems to have gotten more applicants than the average core job). I don’t understand that decision, and think it makes it harder to answer the question of whether EA jobs are hard to get.
Thanks for pointing this out! You've shed light on an important point.The 2.4% figure can be thought of as "the probability of being hired, conditional on clearing a hiring bar" and the 1.85% figure is the "probability of being hired at all"; on reflection I agree that the latter would be more useful in this case. I've updated the post to reflect this.
Can you provide CEA’s offer rate, for the PM role and for core jobs overall?
For the PM role there was only one offer made (to the one hire), so a rate of 1/52=1.9%.
For core jobs overall, on average there was just one offer made for each[1]. The average number of applications was 53.7, so the average offer rate for core roles is 1/53.7=1.9%.
Thanks for updating the post and providing the offer rate data! As I mentioned in my response to Ben, I think CEA's much lower offer rates relative to those in the Ashby survey and CEA’s 100% offer acceptance rate are strong evidence that EA jobs are hard to get.
Sorry for my slow response here, I missed the notification about your comment.
If EOIs are hard to get, that seems relevant to the question of whether EA jobs are hard to get since EOIs are quite sought after
I think maybe we just didn't explain what EOIs are well. As an example: we had a product manager EOI; once we opened a full hiring round for PMs we contacted all the people who filled out the EOI and said "hey are you still looking for a PM position" and then moved the ones who said "yes" into the p.m. hiring round.[1]
I’m not sure why Ben thinks hires as a “percent of applicants who get to the people ops interview stage” (the only stage where CEA is more likely to hire, and not an apples-to-apples comparison since CEA has a work trial before it and Ashby doesn’t) is the right metric
My conclusion was: "in some ways CEA is more selective, and in other ways we are less; I think the methodology we used isn't precise enough to make a stronger statement than 'we are about the same.'"
I don't think one of these comparison points is the "right metric" – they all have varying degrees of usefulness, and you and I might disagree a bit about their relative value, but, given their contradictory conclusions, I don't think you can draw strong conclusions other than "we are about the same".
Sometimes exceptional candidates are hired straight from an EOI, the example I give is specific to that role. I think in retrospect we should have just left EOIs off, as the data was more confusing than helpful.
Thanks for clarifying how the EOIs work, I had a different impression from the OP.
I still strongly disagree with the following statement:
in some ways CEA is more selective, and in other ways we are less; I think the methodology we used isn't precise enough to make a stronger statement than 'we are about the same.'"
Which are the ways in which CEA is less selective? You mentioned in a previous comment that “ we hire a substantially greater percent of applicants who get to the people ops interview stage” and I cited that interpretation in my own comment, but on closer look I don’t think that’s right (or perhaps I’m confused by what you mean by this?) As the OP states “At CEA 1 in 7 of those reaching a people ops interview get hired, compared to 1 in 5 at Ashby” which would have CEA as more selective. And if you look at offer rate (more relevant to the question of selectivity than hire rate) the difference is quite big (1 in 7 at CEA vs. 2 in 5 at Ashby, or 14% vs. 40%, a difference of 2.8x).
The difference is even bigger if you compare offer rate as a percentage of all applicants (2% for CEA vs. 9% at Ashby, or 4.5x) or as a percentage of applicants that passed an initial screen to weed out obviously unqualified applicants (4% for CEA vs. 17% for Ashby, or 4.7x). I also think it is quite notable that CEA’s offer acceptance rate across all roles was 100% vs. 50% for PM roles in the Ashby survey.
This data shows clear, consistent, and large differences all suggesting that CEA is much more selective than the industry benchmark (which itself is likely highly selective since it looks at high tech growth companies). Unless I’m missing some counter-evidence, I think that should be the conclusion. And I think the OP’s summary of the industry benchmark exercise is extremely misleading: “We compared our Product Manager hiring round to industry benchmark data. We found that the probability of an applicant receiving an offer was similar to industry averages.” If CEA made an offer to 1 of 52 applicants, and the benchmark survey had an offer to ~1 in 12, how is that similar?
Thanks yeah sorry, there is a greater change in the percentage of drop off for Ashby on-site -> hired, but because we start with a smaller pool we are still more selective. 1 in 7 versus 1 in 5 is the correct comparison.
This data shows clear, consistent, and large differences all suggesting that CEA is much more selective than the industry benchmark
I guess I'm flattered that you trust the research we did here so much, but I think it's very much not clear:
The number of applicants we get is very heavily influenced by how widely we promote the position, if the job happens to get posted to a job aggregator site, etc. To take a concrete example: six months ago we hired for a PM and got 52 applicants; last month we opened another PM position which got on to some non-EA job boards and got 113 applicants. If we hire one person from each round, I think you will say that we have gotten more than twice as selective, which is I guess kind of true, but our hiring bar hasn't really changed (the person who we hired last time would be a top candidate this time).
I don't really know what Ashby's candidate pool is like, but I would guess their average applicant has more experience than ours – for example: none of our final candidates last round ever even had the job title "product manager" before, though they had had related roles, and in the current round neither of the two people at the furthest round in the process have ever had a PM role. I would be pretty surprised if Ashby's final rounds were consistently made up of people who had never been PMs before.[1]
The conclusion of this post was "Overall, CEA might be slightly more selective than Ashby’s customers, but it does not seem like the difference is large" and that still seems basically right to me: 1/7 vs. 1/5 is more selective, but well within the margin of error given how much uncertainty I have.
I think the OP’s summary of the industry benchmark exercise is extremely misleading
Thanks – I just cut that sentence since my inability to communicate my view even with our substantial back-and-forth makes me pessimistic about making a summary.
In general, I would guess that CEA's applicants have substantially less experience than their for-profit counterparts, as EA is quite young, but our applicants are more impressive given their age. E.g. we get a lot of college student applicants, but those students are going to prestigious universities.
The conclusion of this post was "Overall, CEA might be slightly more selective than Ashby’s customers, but it does not seem like the difference is large" and that still seems basically right to me: 1/7 vs. 1/5 is more selective, but well within the margin of error given how much uncertainty I have.
The 1/7 vs. 1/5 comparison is based on hire rate, but offer rate is more relevant to selectivity (if you disagree, could you explain why?) The difference in offer rate is 14% for CEA vs. 40% for Ashby; I’d be quite surprised if this large difference is still within your margin of error given your uncertainty.
Stepping back, the key question is whether EA jobs are still hard to get. As you note, any single perspective from CEA’s recruiting data will be imperfect. But they’ll be imperfect in different ways. For example, looking at offer rate as a percentage of applicant could be distorted by large numbers of clearly unqualified applicants, but this can be avoided by looking at offers as a percentage of people who made it past an initial screen or people who made it to a people ops interview. And problems with Ashby as a benchmark don’t apply if you’re assessing CEA’s selectivity in an absolute sense (or relative to benchmarks other than Ashby). If you look across a variety of perspectives and they all tell the same story, that’s probably the right story.
When I look at the different perspectives on the CEA’s recruitment data, they all tell the story that jobs at CEA are (very) hard to get. I don’t see any metrics that suggest the opposite is true, or even that it’s a close call or ambiguous in any way. The perspectives I find compelling (individually, but more so collectively) are:
In an absolute sense, CEA’s offer rates are extremely low, whether one looks at offer rate as a percentage of applicants (1.9%), as a percentage of people who passed a first screen (4.7%) or those who passed a second screen (9.5%). If all you knew about a job was that less than 1 in 50 applicants got an offer, and that less than 1 in 20 people who passed an initial screen got an offer, wouldn’t you consider that job highly selective? I sure would.
CEA’s offer rates are in the same ballpark as the notoriously hyper-selective McKinsey. McKinsey hires ~1% of applicants (vs. ~2% for CEA). If you pass an initial resume screen at McKinsey, you have a ~12.5% chance of getting an offer, which is actually higher than the offer rate for CEA applicants who make it past an initial (~5%) or even a secondary (~10%) screen.
As another way of contextualizing CEA’s selectivity without relying on the Ashby data, even if you pass CEA’s initial screen your expected success rate of ~5% is the same as someone applying to Harvard.
CEA is much more selective than the Ashby benchmark (which itself likely captures selective jobs). That’s true whether you look at offer rates for all candidates (4.7x higher offer rate for Ashby) or offer rates after unqualified people had been screened out (4.5x higher offer rate for Ashby after an initial screen, and 2.8x higher at the people ops/onsite stage). Side note: Given the magnitude and consistency of the finding that CEA is much more selective than Ashby, I do think it belongs in the OP’s Summary section (though it could certainly include a note or footnote regarding how Ashby is an imperfect reference group).
Across all of CEA’s core jobs there was an offer acceptance rate of 100%. This strongly suggests that these candidates, who were presumably very strong applicants, were not choosing between many attractive EA jobs offers.
There's very strong evidence that in the relatively recent past, EA jobs were quite hard to get. So I think there's a high burden of proof for anyone making the argument that this situation has changed. I don't think data presented in this post or the comments meets that burden of proof, and in fact I think that data all strongly supports the notion that EA jobs are still hard to find.
offer rate is more relevant to selectivity (if you disagree, could you explain why?)
I think it's pretty uncontroversial that our applicants are more dedicated (i.e. more likely to accept an offer). My understanding of Ashby is that it's used by a bunch of random tech recruiting agencies, and I would guess that their applicants have ~0 pre-existing excitement about the companies they get sent to.
I don’t see any metrics that suggest the opposite is true, or even that it’s a close call or ambiguous in any way.
The statement in the post is "CEA might be slightly more selective than Ashby’s customers, but it does not seem like the difference is large". This seems consistent with the view that CEA is selective? (It also just implies that Ashby is selective, which is a reasonable thing to believe.[1])
--
As a meta point: I kind of get the sense that you feel that this post is intended to be polemical, like we are trying to convince people that CEA isn't selective or something. But as you originally said: "the authors don’t seem to take an explicit stance on the issue" – we just wanted to share some statistics about our hiring and, at least as evidenced by that first comment of yours, we were somewhat successful in conveying that we didn't have particularly strong opinions about whether EA jobs are still hard to get.
This post was intended to provide some statistics about our hiring, because we were collecting them for internal purposes anyway so I figured we might as well publish. We threw in the Ashby thing at the end because it was an easily accessible data point, but to be honest I kind of regret doing that – I'm not sure the comparison was useful for many people, and it caused confusion.
Re: offer rate vs hire rate, CEA’s applicants are likely applying to other EA jobs they’d also be dedicated to. CEA may well be more attractive than other EA employers, but I don’t think that’s a given and I’m not sure of the magnitude of any difference there might be. Bigger picture, as I mentioned earlier I think any individual metric is problematic and that we should look at a variety of metrics and see what story they collectively tell.
Re: your meta point, the thing I find confusing is that you “didn't have particularly strong opinions about whether EA jobs are still hard to get.” There’s a bunch of data, and every data point (CEA’s absolute offer rates at each stage, CEA vs. Ashby at each stage, and CEA vs. other benchmarks like McKinsey and Harvard) supports the idea that EA jobs are hard to get. So I don’t really understand why you present a lot of data that all points the same way, yet remain unconvinced by the conclusion they lead to.
Similarly, I find it confusing that you still seem to endorse the claim that "CEA might be slightly more selective than Ashby’s customers, but it does not seem like the difference is large.” CEA has lower offer rates and lower hire rates at each stage of the process. And in almost every case, the difference is quite large (at least 2x). Even in the one comparison where the difference isn’t huge (hire rates at the person ops/onsite stage), it is still a moderate magnitude (Ashby’s rate is 40% higher than CEA’s) despite the fact that CEA required passing 3 screens to get to that stage vs. 2 for Ashby. I think a more reasonable interpretation of that data would be “It's very likely that CEA is much more selective than Ashby’s customers, though it’s possible the magnitude of this difference is only moderate (and Ashby is not a perfect reference point.)”
the thing I find confusing is that you “didn't have particularly strong opinions about whether EA jobs are still hard to get.”... So I don’t really understand why you present a lot of data that all points the same way, yet remain unconvinced by the conclusion they lead to.
I think I'm largely like "bruh, literally zero of our product manager finalist candidates had everhad the title "product manager" before, how could we possibly be more selective than Ashby?"[1]
Some other data points:
When I reach out to people who seem like good fits, they often decline to apply, meaning that they don't even get into the data set evaluated here
When I asked some people who are well-connected to PMs to pass on the job to others they know, they declined to do so because they thought the PMs they knew would be so unlikely to want it it wasn't worth even asking
I acknowledge that, if you rely 100% on the data set presented here, maybe you will come to a different conclusion, but I really just don't think the data set presented here is that compelling.
As mentioned, our candidates are impressive in other ways, and maybe they are more impressive than the average Ashby candidate overall, but I just don't think we have the evidence to confidently say that.
Hmm, if we are still talking about comparing CEA versus Ashby, I'm not sure this carves reality at the joints: it's certainly true that people with zero experience have an uphill battle getting hired, but I don't think CEA is unusual in this regard. (If anything, I would guess that we are more open to people with limited experience.)
Sorry, I'm not sure I understand what your point is. Are you saying that my point 1 is misleading because having even any relevant experience can be a big boost for an applicant's chances to getting hired by CEA, and any relevant experience isn't a high bar?
Yeah, job experience seems like a major difference between CEA and Ashby. I’d guess that salary could be quite different too (which might be why the CEA role doesn’t seem interesting to experienced PMs).
It sounds like one of the reasons why EA jobs are hard to get (at least for EA candidates) is because EA candidates (typically young people with great academic credentials and strong understanding of EA but relatively little job experience) lack the job experience some roles require. To me this suggests that advising (explicitly or implicitly) young EAs that the most impactful thing they can do is direct work could be counterproductive, and that it might be better to emphasize building career capital.
This is helpful, but there is a key difference between the EA job market and the general one: there are a limited number of positions in EA. I think a valuable metric that perhaps could be explored on the next EA survey is the level of EA “unemployment.” This could mean the number of EAs who would prefer to have a job at an EA aligned organization, but have not gotten one. I suspect this will be far higher than the general level of unemployment. As an example, say there are 50 EAs with a particular skill, and five EA jobs requiring that skill. Then if they all apply to those five jobs, 2% of the applicants will get a job in each case, but that is only 10% of the EAs getting a job, so there would be 90% “unemployment.” Whereas outside of EA, they could all apply to 50 jobs and all get jobs. This could be analogous to underemployment, such as PhDs who want a job such as academia that requires a PhD, but have not gotten one.
At least in theory we could track EA job Openings, Hires, Quits and Layoffs, similar to the JOLTS data. This has the advantage of not needing to estimate the denominator of 'total EA labour force'. In practice this is probably not worth the effort of collecting though.
Thanks for writing this up and making it public. Couple comments:
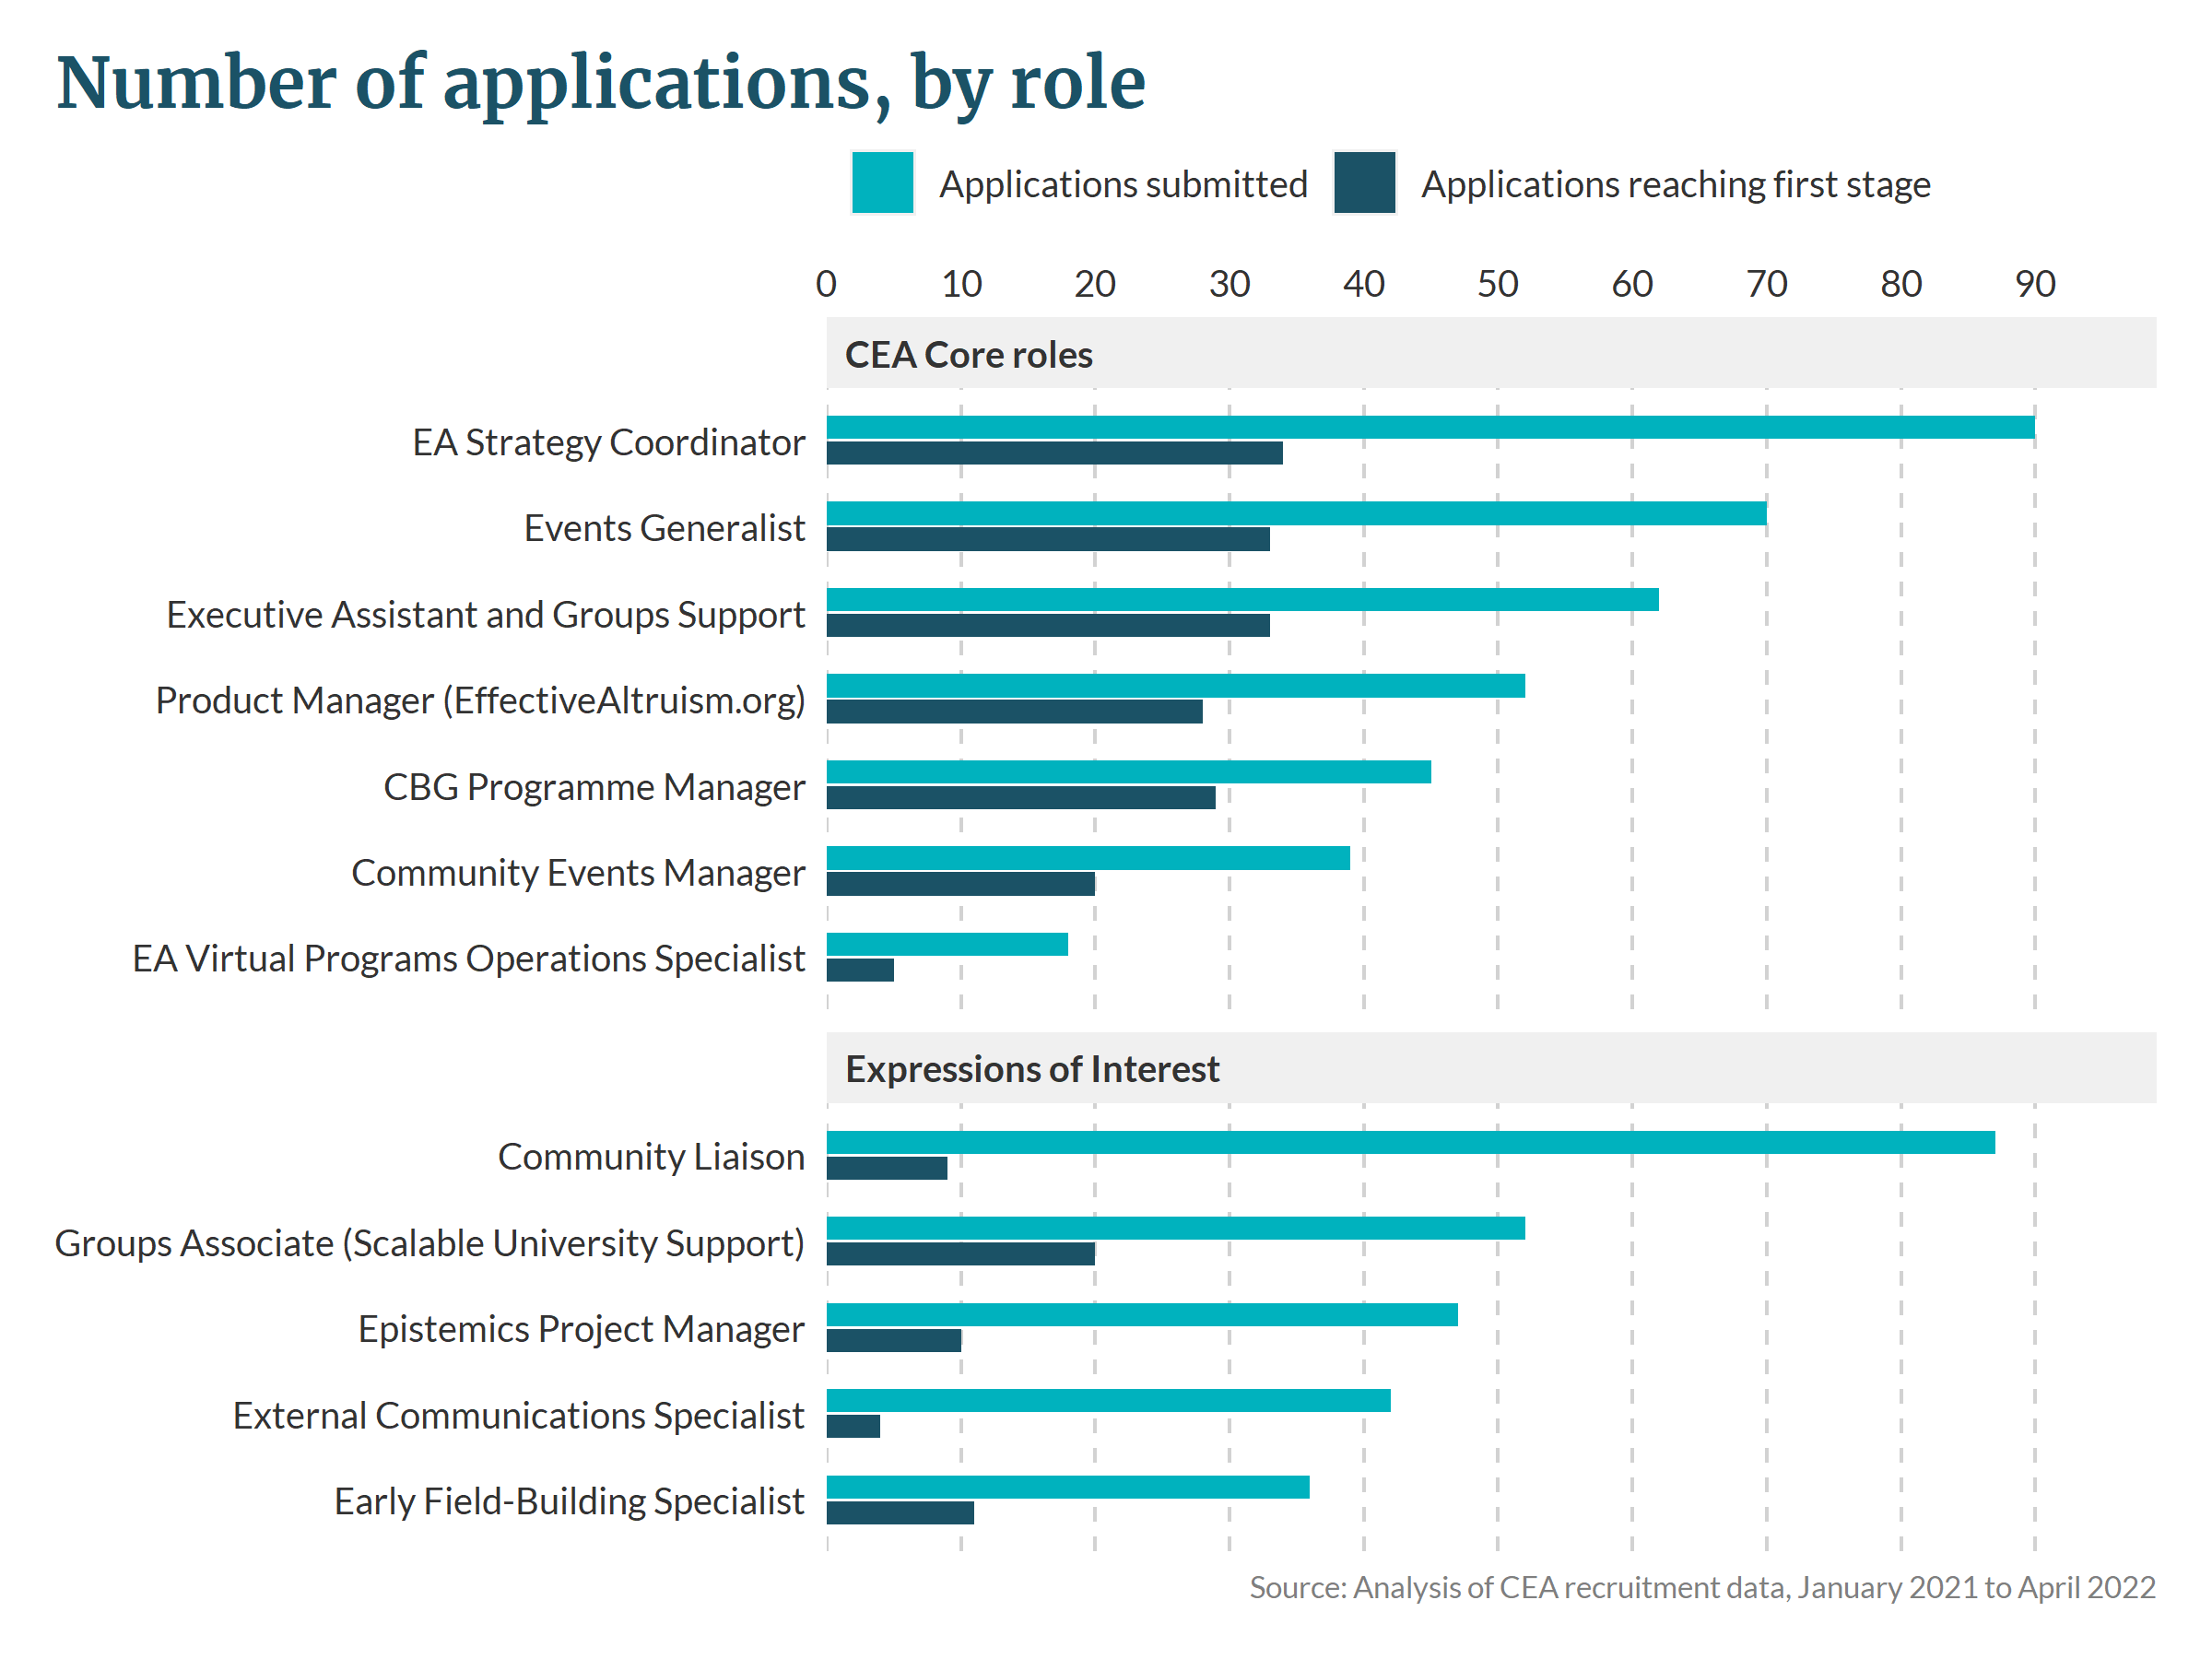
On average 45 applications were submitted to each position.
CEA Core roles received an average of 54 applications each; EOIs received an average of 53 applications each.
Is the first number a typo? Shouldn't it be ~54
Ashby hires 4% of applicants, compared to 2% at CEA
...
Overall, CEA might be slightly more selective than Ashby’s customers, but it does not seem like the difference is large
Whether this is "large" is obviously subjective. When I read this, I see 'CEA is twice as selective as industry over the last couple years'. Therefore my conclusion is something like: Yes, it is still hard to get a job in EA, as evident from CEA being around twice as selective as industry for some roles; there are about 54 applicants per role at CEA. I think the summary of this post should be updated to say something like "CEA is more competitive but in the same ballpark as industry"
I think the summary of this post should be updated to say something like "CEA is more competitive but in the same ballpark as industry"
I agree we hire a smaller percent of total applicants, but we hire a substantially greater percent of applicants who get to the people ops interview stage.
I think the latter number is probably the more interesting one because the former is affected a bunch by e.g. if your job posting gets put onto a random job board which gives you a ton of low-quality applicants.
But in any case: in some ways CEA is more selective, and in other ways we are less; I think the methodology we used isn't precise enough to make a stronger statement than "we are about the same".
Thanks for posting this! This was actually a slight update for me (lower average # of applications than I expected), although I do expect at least some of this is the fact that many of these roles were open simaltaneously. I would expect, had they been released in 2 or 3 batches, the average number of applications could be between 60-100.
Hey guys! First off, thanks for posting, there's some flak in the comments but at the end of the day you took the time to post this stuff when I haven't seen it from anyone else, and I really appreciate that. I did want to note two things though:
In the final estimate you give the average hours spent on applications without considering the initial application, but how would that number change if you did? I personally would prefer an estimate (even if it is just that) that includes all time spent on application materials, because rarely am I concerned with "how much time will this application take me once I get past the first step" but rather "how much time will this application take". You may not give guidance on how long people should take, but even then it has to be likely you have a rough understanding of roughly what the bounds are, which would be helpful to know even if it's just anecdotally compiled.
After reading through the comments, I found resonance with the anon argument for the 1.85%, but even if you stick with your 2.4%, I find it strange you haven't included this number in the summary. This is the single most important number in this post, so to have a multitude of others highlighted over it doesn't seem to make much sense to me, perhaps I'm missing something though.
Thank you so much for this really informative analysis! I really appreciate it.
The data seem to be consistent with anecdotes that there are many more people looking for EA jobs than there are positions currently.
If this pattern is true, then one way to match more effective altruists with currently scarce EA jobs could be to establish new organizations and projects in undersaturated EA hubs (underrepresented U.S. states and countries), as opposed to just in oversaturated EA hubs (e.g., San Francisco Bay Area).
Is it still hard to get a job in EA? Insights from CEA’s recruitment data
This is a crosspost from the new Animal Welfare Alignment Newsletter by Anima International. You can subscribe on Substack if you are interested in following these efforts. Audio reading also available on Substack.
The goals of this post are to:
1. Raise a question I see as crucially important to the goal of aligning AI to animal welfare...
Hello! I'm Justin Portela. I got hired by GWWC to make YouTube videos after AI in Context did such a kickass job.
My channel is using that same cinematic, high-production value beauty to talk about everything in the EA universe that isn't AI.
...
This is a linkpost for Request for Proposals: Research and Applied Work on Digital Minds.
I'm glad to announce a request for proposals for research and applied work on digital minds at Longview Ph...
How hard is it to get a job in an EA-aligned organisation? CEA can contribute to this conversation by sharing some insights from our recruitment data.
In this post we look at the recruitment process for 12 vacancies, which were recruited for between January 2021 and April 2022.
Summary
The 12 roles were recruited for in two categories: CEA Core roles, which represent the main rounds, and Expressions of Interest (EOIs), which we were open to hiring but not actively focused on.
Total number of applications: CEA Core roles received an average of 54 applications each; EOIs received an average of 53 applications each.
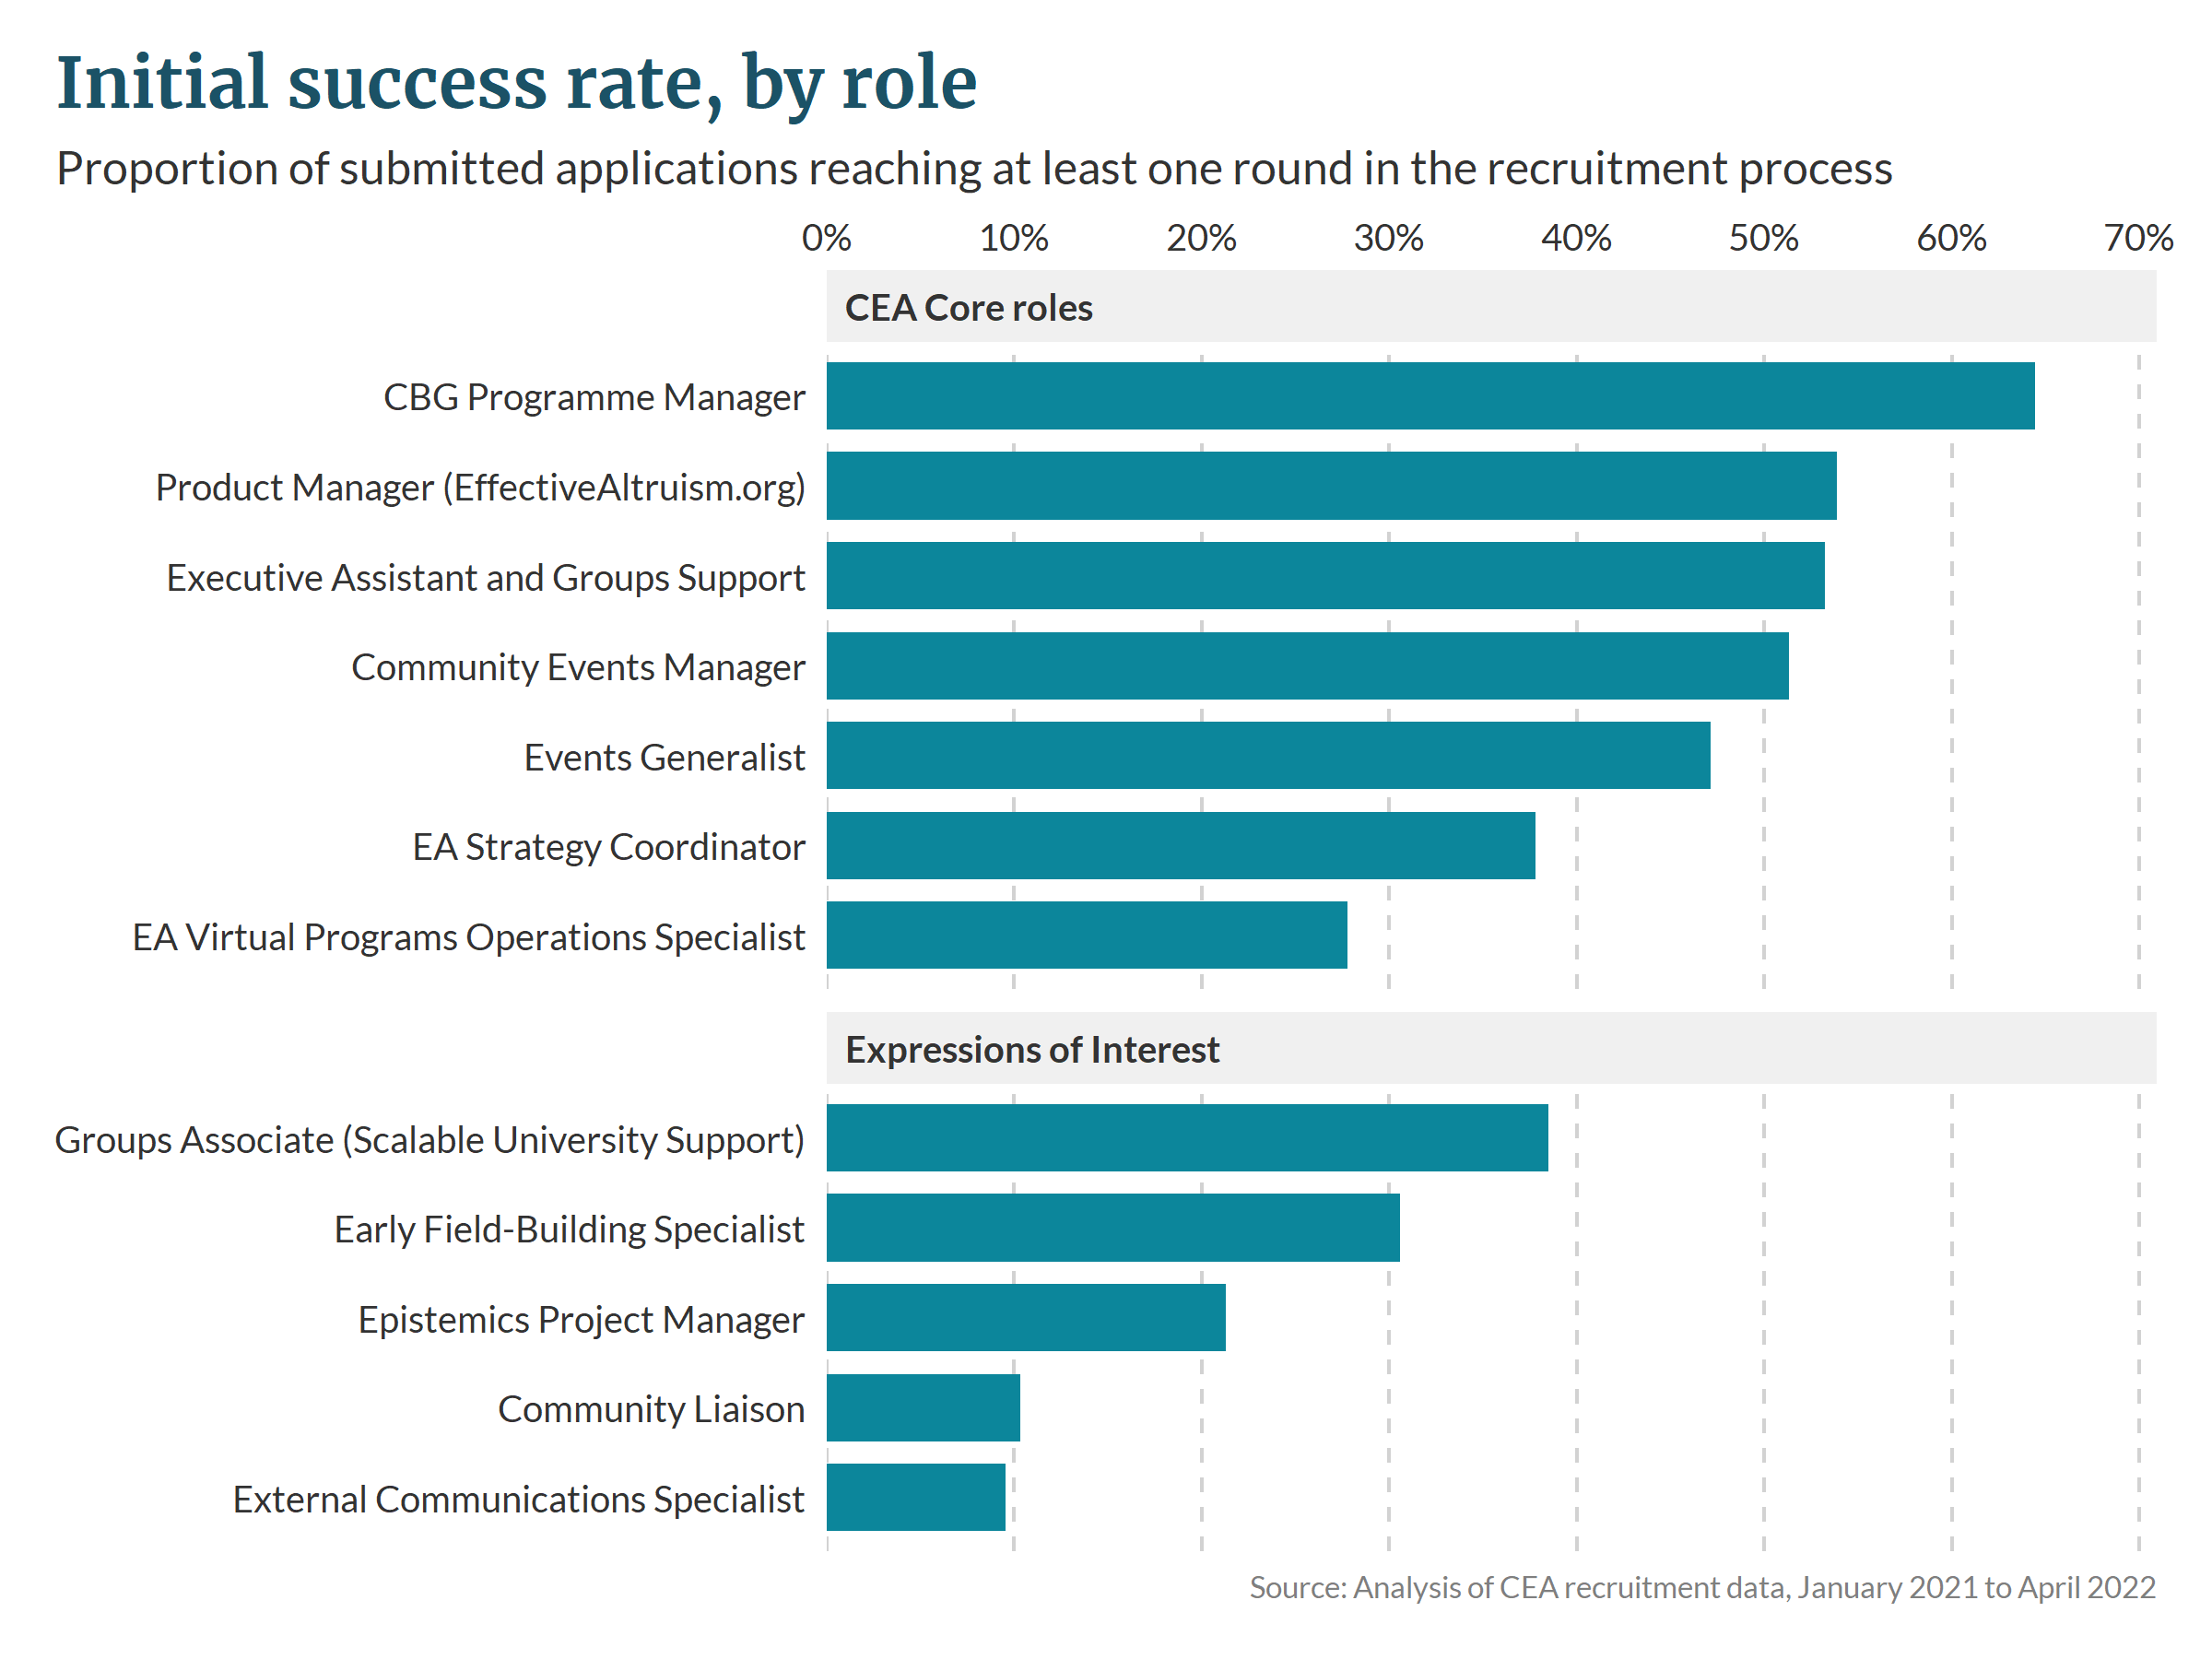
Proportion of applicants invited to the first stage: On average 48% of applicants to CEA Core roles moved forward to the first stage of the evaluation process. 21% of EOIs were advanced to the first stage.
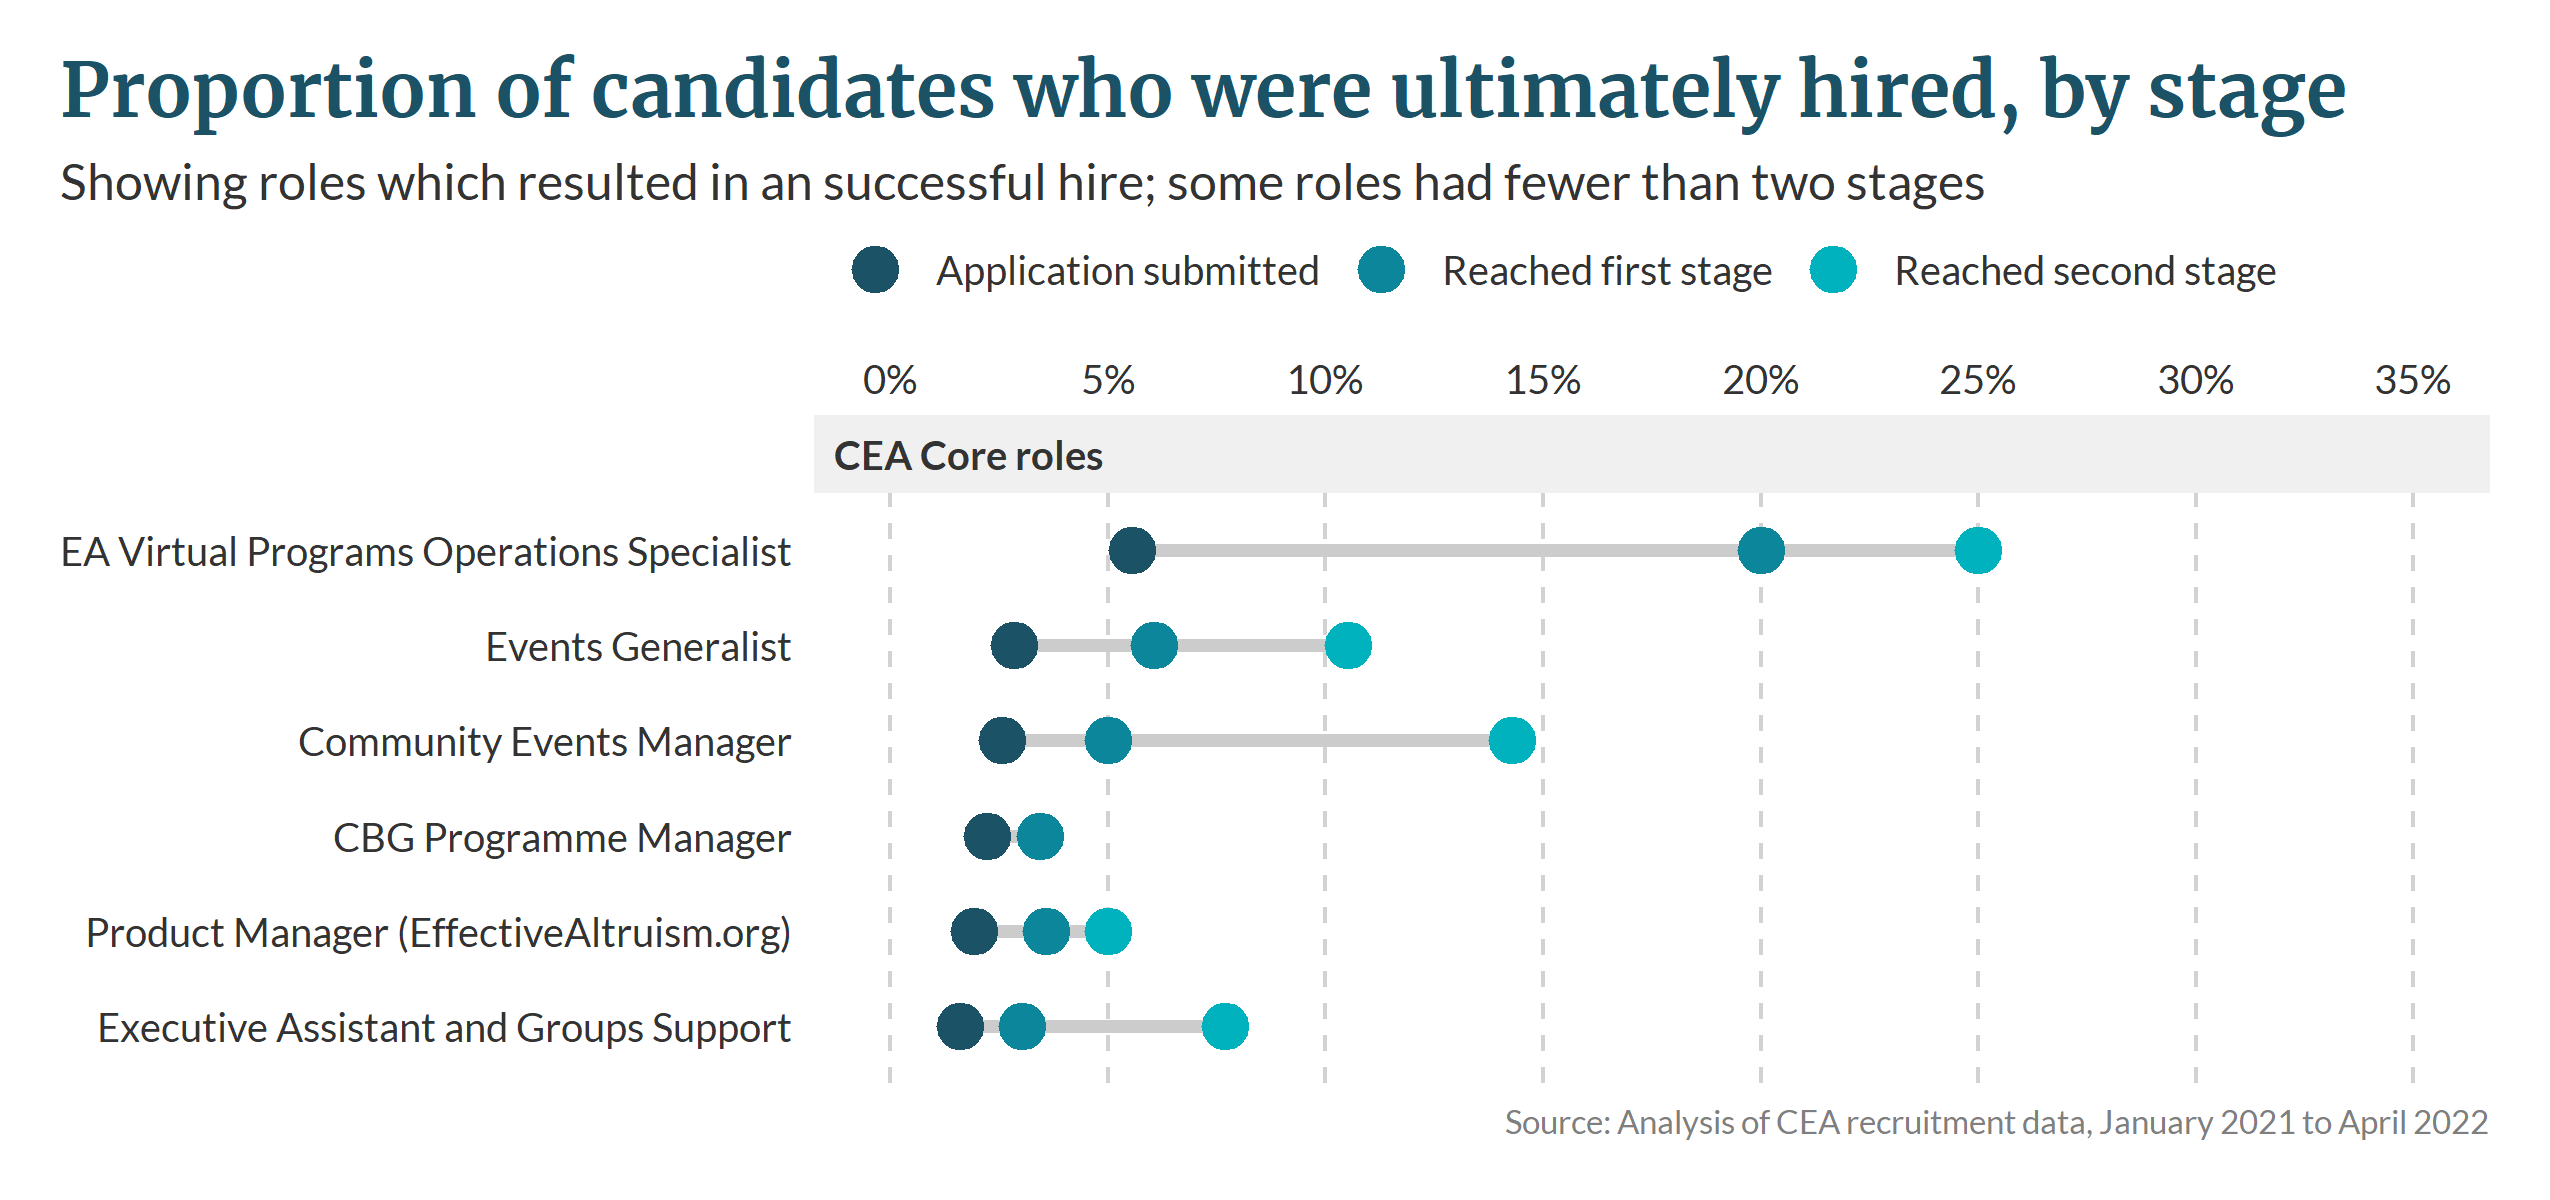
Proportion of candidates who were ultimately hired: For CEA Core roles, we ultimately hired 4.7% of candidates who reached the first stage, and 9.5% of candidates who reached the second stage. There were no successful hires for the EOIs.
Most roles have a multi-stage recruitment process. First, applications undergo an initial screening. Subsequently there may be trial tasks, interviews, and work trials, finally culminating in an offer of employment. The CEA website gives more information about the hiring process.
Since January 2021, CEA has maintained an internal system to manage recruitment. The analysis in this post concerns data extracted from the system in April 2022, which records information for 34 roles.
From this analysis we have excluded about two-thirds of the roles for which information is recorded:
5 roles within the Operations team, which spun out from CEA Core in 2021[1]
8 roles where teams separately tracked the hiring process
3 roles where recruitment was merged into other roles
1 role where, due to the nature of the role, applicants were each recruited in different ways
10 roles where applications are still open or recruitment is ongoing
The remaining 12 positions are listed in this footnote[2] and broadly fit into one of two categories:
CEA Core roles represent the main full recruitment rounds. CEA usually conducts lots of outreach for these roles, and proactively encourages people to apply.
Expressions of Interest (EOIs) represent roles which we are interested in eventually hiring for, but are not actively focused on at present. The website signposts that these roles have a higher bar for progression, and that CEA carries out much less outreach for them, but aims to make applying as easy as possible.
In the analysis below, it is worth noting the following:
Candidates exited the application process for a variety of reasons, and no distinction is made between those reasons; e.g. some were rejected while others chose to withdraw voluntarily (although the number of voluntary withdrawals is relatively small).
Some applicants were fast-tracked through the process and skipped some stages; in these cases the analysis still counts them as if they were virtually present for those stages.
Some applicants applied to multiple roles, and are counted in each role they applied for.
We only show whether applicants are hired to the role they originally applied for, but there are other outcomes where they may still be hired (e.g. some applicants may be hired to a different team, have a new role created for them, or be referred to another org).
Total number of applications
On average 54 applications were submitted to each position.
CEA Core roles received an average of 54 applications each; EOIs received an average of 53 applications each.
Figure 1
Proportion of applicants invited to the first stage
The proportion of applications reaching the first stage is the ratio between bars in the Figure 1 above and is shown on its own in Figure 2 below. On average 48% of applicants to CEA Core roles reached at least the first stage, representing an average of 26 people.
Expressions of interest had a lower proportion of applicants reaching the first stage, at 21%, representing an average of 11 people. This is expected, due to the nature of these vacancies and the higher bar needed to progress.
Figure 2
Proportion of candidates who were hired
We can make a naive estimate about how the “probability of success” changes for candidates as they move through stages. In these figures we divide the number of applicants in each stage by the number of candidates who were ultimately hired at the end of the process.
Most roles culminated with one successful hire. In one role, ultimately two candidates were hired (Events Generalist). In a further six roles there were no successful hires at all (including all five EOIs), and these are not shown in this section. Some roles had fewer than two stages in the process, so data for them is only shown up to the first stage.
Figure 3
Weighted by the number of applicants in each stage, for CEA Core roles, we ultimately hired:
2.4% of candidates who applied*
4.7% of candidates who were invited to the first stage
9.5% of candidates who were invited to the second stage
*We encourage caution when interpreting these results. This is especially so for numbers concering candidates who initially applied, as it includes both realistic applications and ones which were obviously below a reasonable bar for consideration (e.g. because they were incomplete; had gratuitous errors in spelling and grammar; or indicated a lack of familiarity with EA).
Predictably, the rate of success for each applicant is higher when there are fewer people applying.
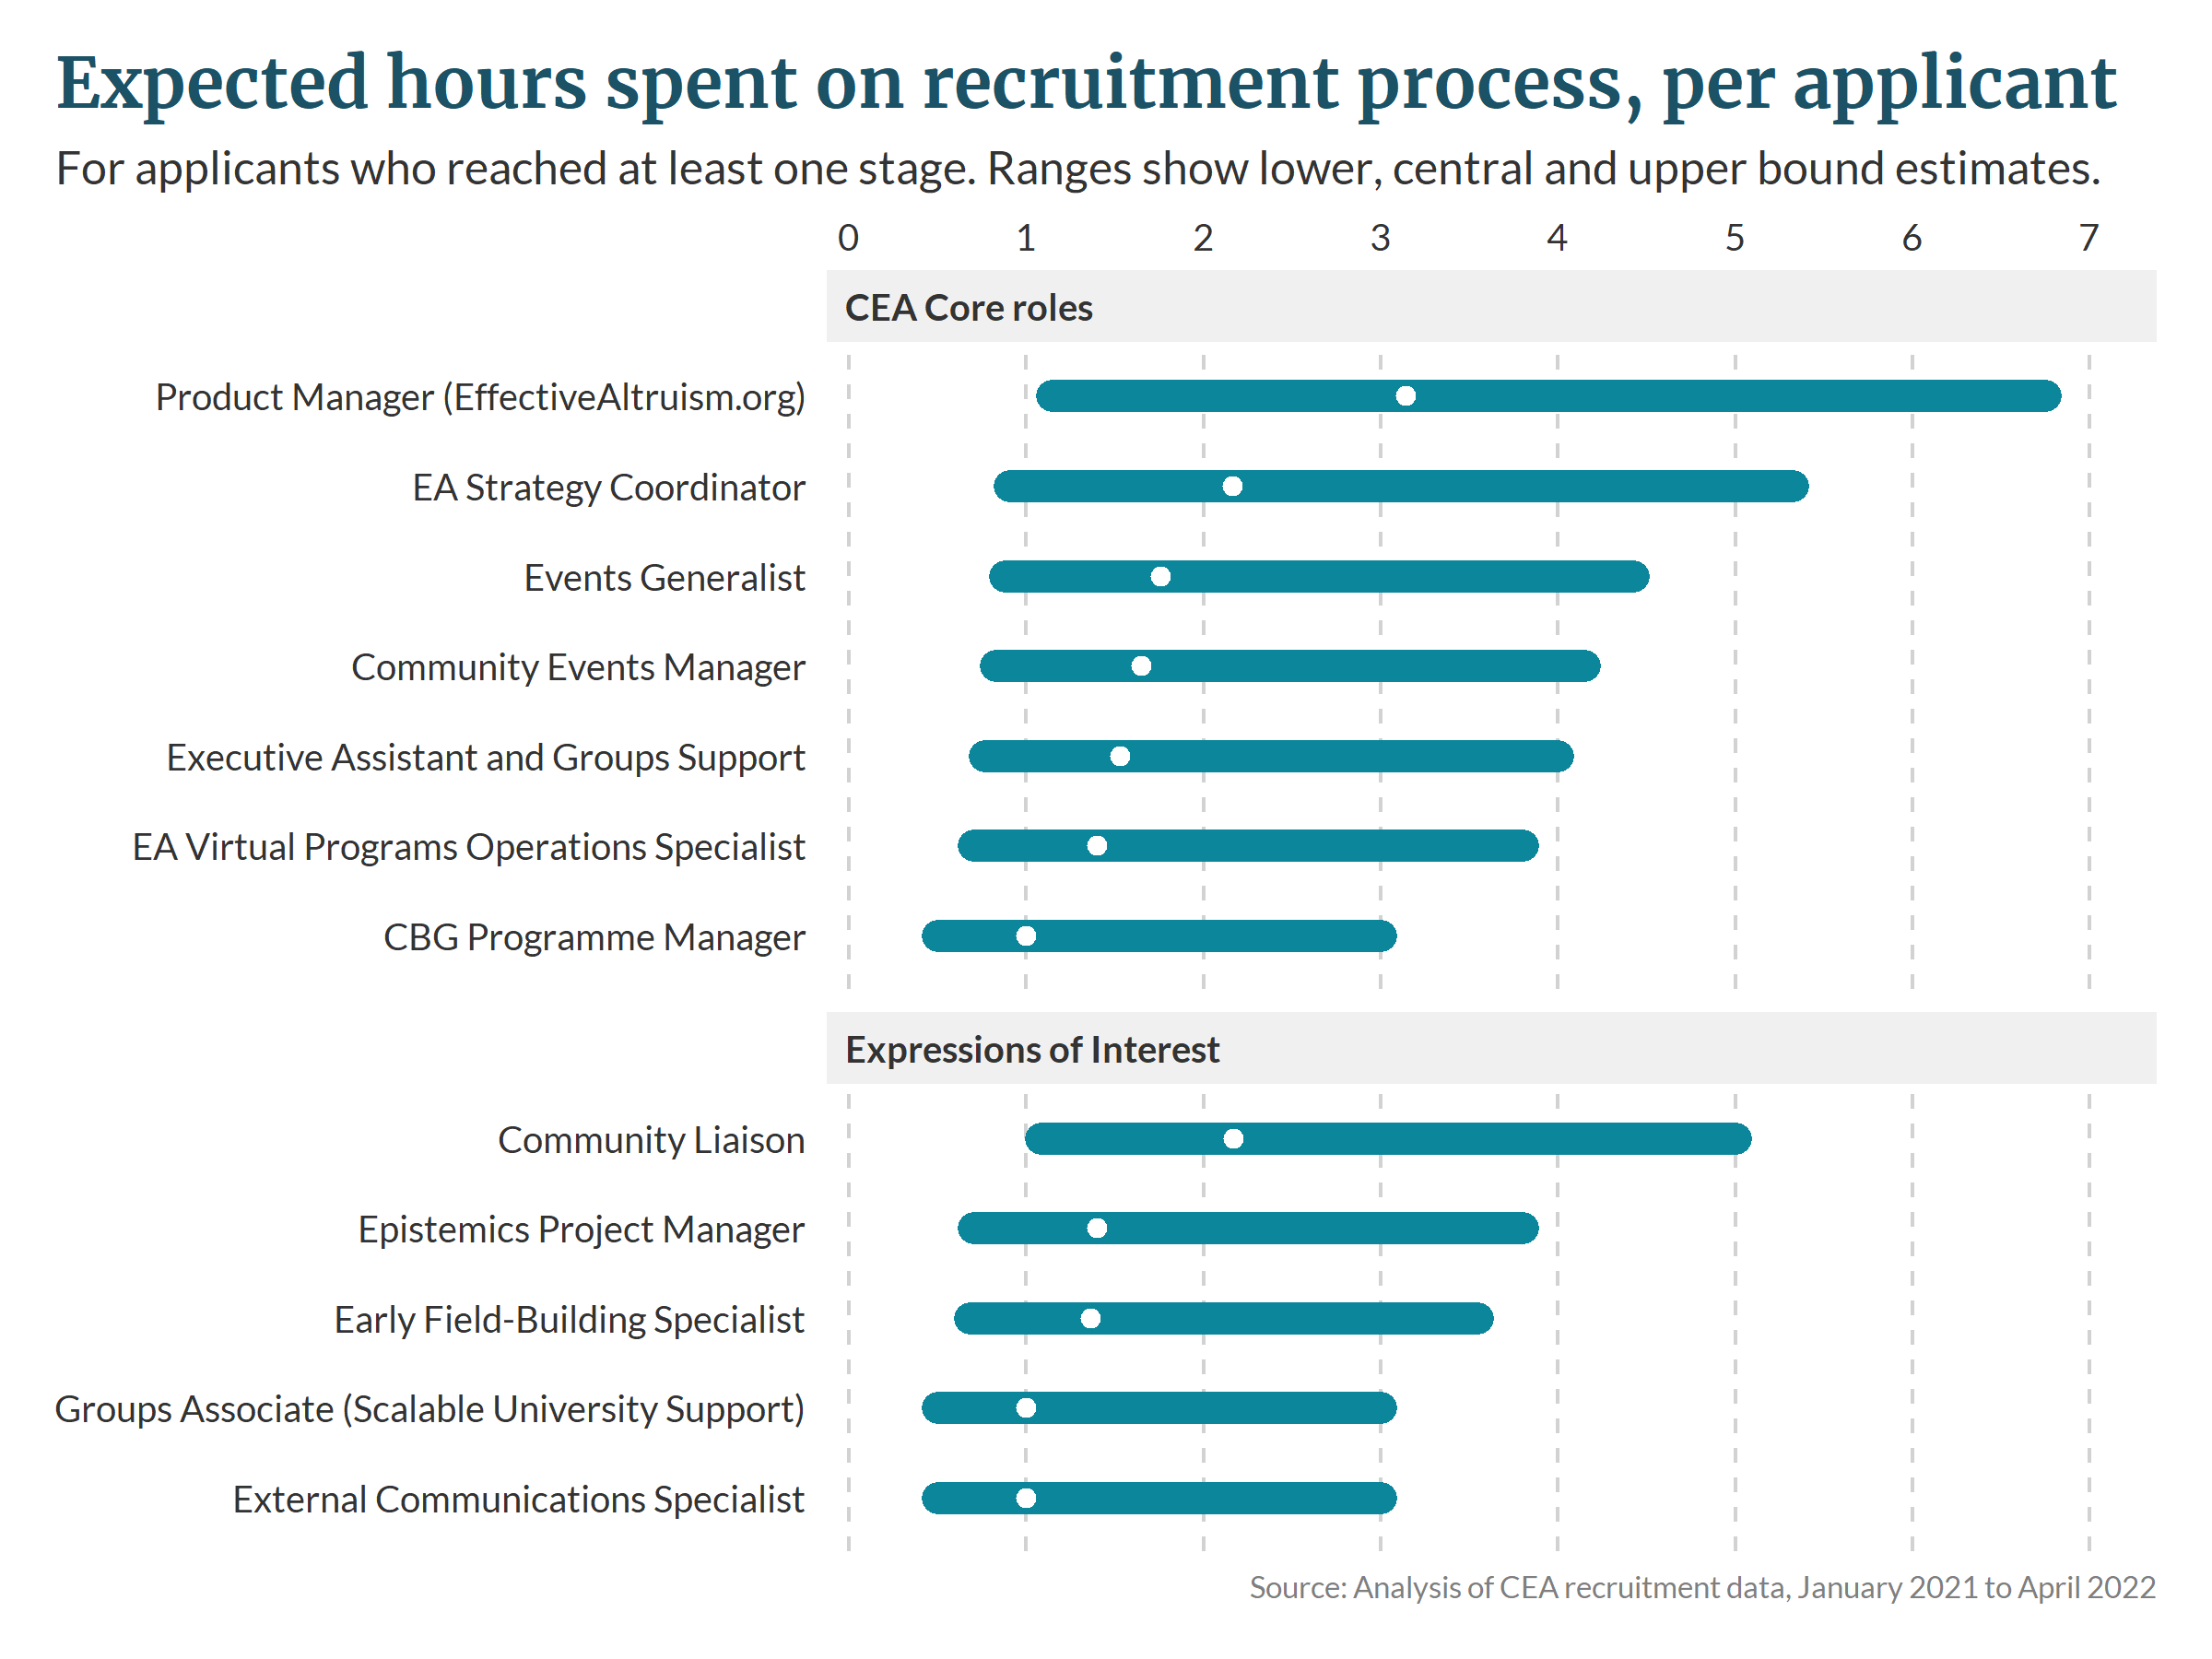
Expected time spent on the recruitment process
In this section we estimate the expected length of time spent by each applicant on the recruitment process, for those who were invited to at least the first stage. We think this provides a useful reference class for the readers of this post, i.e. people with some familiarity with EA.
We include everything from the first stage onwards. This excludes time spent on submitting an application at the start, since we expect this varies significantly between applicants[3].
We use the following estimates about how long each applicant spends on each stage; the bounds are not precisely defined and intended to be illustrative.
Stage
Estimated time spent by each applicant (hours)
Lower bound
Central estimate
Upper bound
Trial task
0.5
1
3
Screening interview
0.25
0.5
1
Other assessments (skills, culture interviews etc.)
0.5
1
2
People ops interviews
1
2
3
Work trial
4
20
40
To get the expected time spent by each applicant, we then multiply these time ranges by the proportions of candidates in each stage. The findings are shown in Figure 4 below.
Figure 4
Weighted by the number of applicants, the average expected time spent by each applicant on the recruitment process is:
for CEA Core roles: 1.9 hours (estimated range: 0.8 to 4.6)
for EOIs: 1.3 hours (estimated range: 0.7 to 3.6)
It is worth noting that the median time skews towards the shorter end of the range. The application processes are designed to have quick activities at the start for larger numbers of applicants, and reserve the longer tasks for later in the process when there are fewer candidates remaining.
A comparison with non-EA organisations
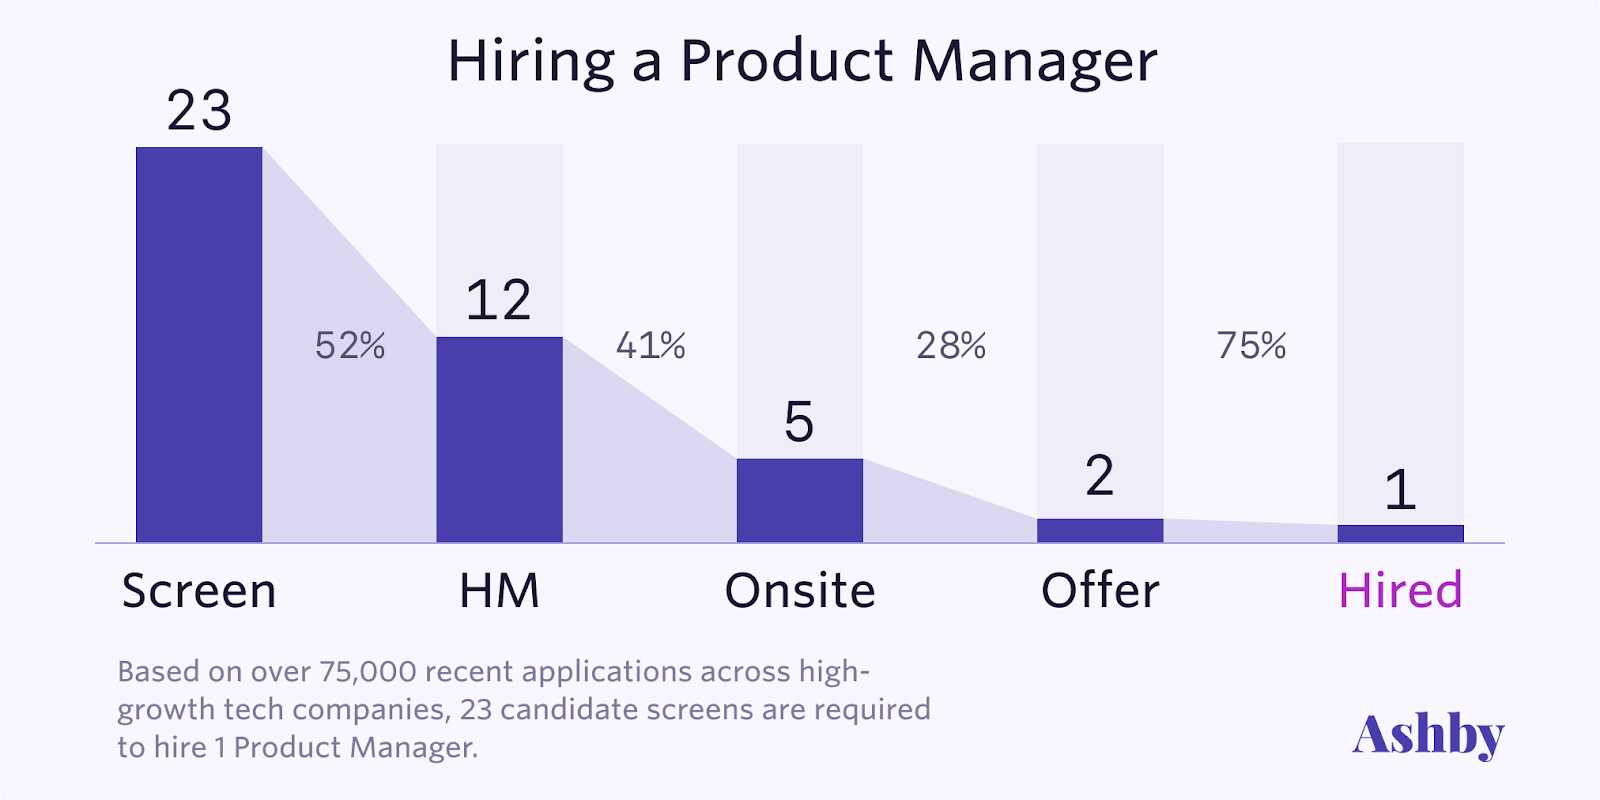
Some roles at CEA are specialised, but others do have direct comparisons in non-EA organisations. One such role is the Product Manager for EffectiveAltruism.org, which CEA hired for in Q1 of 2021.
The graphic below shows the typical hiring process for a Product Manager in a non-EA tech organisation, based on data from Ashby, a recruiting platform.
The drop-off rates are fairly similar between CEA and the non-EA tech companies:
Ashby hires 4% of applicants, compared to 2% at CEA
At CEA 1 in 7 of those reaching a people ops interview get hired, compared to 1 in 5 at Ashby. This is perhaps a more meaningful reference point as CEA and Ashby might get different numbers of “obviously unqualified” applicants, but the people who get to a people ops interviews/on-site are pretty plausibly qualified.
Overall, CEA might be slightly more selective than Ashby’s customers, but it does not seem like the difference is large[5].
We use the term “CEA Core” to differentiate from the “CEA Operations” team. Although the Operations team spun out from CEA Core, it remains a part of the CEA legal entity.
We do try to make submitting an application as simple as possible. For most roles we only ask two free text questions, and encourage applicants to not spend a lengthy amount of time on them.
It is of course possible that the applicant pools differ (perhaps everyone who applied to CEA would have received an offer from Ashby, or vice versa). These figures just tell us the average applicant's likelihood of success.


I’m glad CEA is sharing this data, but I wish the post focused more on the important question posed in the title: Is it still hard to get a job in EA? I think the data suggests quite strongly that the answer is “yes”, but the authors don’t seem to take an explicit stance on the issue and the Summary of the post arguably suggests the opposite conclusion.
Here’s why I think the data implies EA jobs are still hard to get:
Hey, thanks for your comment.
If EOIs are hard to get, that seems relevant to the question of whether EA jobs are hard to get since EOIs are quite sought after (as many applicants as core jobs despite less chance of getting hired). But since AFAIK CEA is the only EA org that has EOIs, I can certainly see the case for excluding them from the sample.
100% agree this is the right methodology. But I still think 1.85% is the relevant number (number of hires/number of applicants). From your answer to Khorton, it sounds like your 2.4% figure excludes the Core job you didn’t hire for (which seems to have gotten more applicants than the average core job). I don’t understand that decision, and think it makes it harder to answer the question of whether EA jobs are hard to get.
Can you provide CEA’s offer rate, for the PM role and for core jobs overall? Hire rate really isn’t the best measure for determining whether jobs are hard to get.
FWIW, I’m not sure why Ben thinks hires as a “percent of applicants who get to the people ops interview stage” (the only stage where CEA is more likely to hire, and not an apples-to-apples comparison since CEA has a work trial before it and Ashby doesn’t) is the right metric. He suggests he likes that metric as a way to exclude low-quality applicants, but the better way to do that is to look at hires (or ideally offers) as a percent of people who make it past the initial screen (which is more restrictive for Ashby than CEA). CEA hires 1 in 28 people who make it past the first screen; the Ashby sample hires 1 in 12 (and makes offers to 2 in 12).
Hey, apologies that it has taken us so long to get back to you on this.
Thanks for pointing this out! You've shed light on an important point.The 2.4% figure can be thought of as "the probability of being hired, conditional on clearing a hiring bar" and the 1.85% figure is the "probability of being hired at all"; on reflection I agree that the latter would be more useful in this case. I've updated the post to reflect this.
For the PM role there was only one offer made (to the one hire), so a rate of 1/52=1.9%.
For core jobs overall, on average there was just one offer made for each[1]. The average number of applications was 53.7, so the average offer rate for core roles is 1/53.7=1.9%.
Of the 7 Core roles, one role made two offers, and one other role made zero offers, so this averages out at one offer per role.
Thanks for updating the post and providing the offer rate data! As I mentioned in my response to Ben, I think CEA's much lower offer rates relative to those in the Ashby survey and CEA’s 100% offer acceptance rate are strong evidence that EA jobs are hard to get.
Sorry for my slow response here, I missed the notification about your comment.
I think maybe we just didn't explain what EOIs are well. As an example: we had a product manager EOI; once we opened a full hiring round for PMs we contacted all the people who filled out the EOI and said "hey are you still looking for a PM position" and then moved the ones who said "yes" into the p.m. hiring round.[1]
My conclusion was: "in some ways CEA is more selective, and in other ways we are less; I think the methodology we used isn't precise enough to make a stronger statement than 'we are about the same.'"
I don't think one of these comparison points is the "right metric" – they all have varying degrees of usefulness, and you and I might disagree a bit about their relative value, but, given their contradictory conclusions, I don't think you can draw strong conclusions other than "we are about the same".
Sometimes exceptional candidates are hired straight from an EOI, the example I give is specific to that role. I think in retrospect we should have just left EOIs off, as the data was more confusing than helpful.
Thanks for clarifying how the EOIs work, I had a different impression from the OP.
I still strongly disagree with the following statement:
Which are the ways in which CEA is less selective? You mentioned in a previous comment that “ we hire a substantially greater percent of applicants who get to the people ops interview stage” and I cited that interpretation in my own comment, but on closer look I don’t think that’s right (or perhaps I’m confused by what you mean by this?) As the OP states “At CEA 1 in 7 of those reaching a people ops interview get hired, compared to 1 in 5 at Ashby” which would have CEA as more selective. And if you look at offer rate (more relevant to the question of selectivity than hire rate) the difference is quite big (1 in 7 at CEA vs. 2 in 5 at Ashby, or 14% vs. 40%, a difference of 2.8x).
The difference is even bigger if you compare offer rate as a percentage of all applicants (2% for CEA vs. 9% at Ashby, or 4.5x) or as a percentage of applicants that passed an initial screen to weed out obviously unqualified applicants (4% for CEA vs. 17% for Ashby, or 4.7x). I also think it is quite notable that CEA’s offer acceptance rate across all roles was 100% vs. 50% for PM roles in the Ashby survey.
This data shows clear, consistent, and large differences all suggesting that CEA is much more selective than the industry benchmark (which itself is likely highly selective since it looks at high tech growth companies). Unless I’m missing some counter-evidence, I think that should be the conclusion. And I think the OP’s summary of the industry benchmark exercise is extremely misleading: “We compared our Product Manager hiring round to industry benchmark data. We found that the probability of an applicant receiving an offer was similar to industry averages.” If CEA made an offer to 1 of 52 applicants, and the benchmark survey had an offer to ~1 in 12, how is that similar?
Thanks yeah sorry, there is a greater change in the percentage of drop off for Ashby on-site -> hired, but because we start with a smaller pool we are still more selective. 1 in 7 versus 1 in 5 is the correct comparison.
I guess I'm flattered that you trust the research we did here so much, but I think it's very much not clear:
The conclusion of this post was "Overall, CEA might be slightly more selective than Ashby’s customers, but it does not seem like the difference is large" and that still seems basically right to me: 1/7 vs. 1/5 is more selective, but well within the margin of error given how much uncertainty I have.
Thanks – I just cut that sentence since my inability to communicate my view even with our substantial back-and-forth makes me pessimistic about making a summary.
In general, I would guess that CEA's applicants have substantially less experience than their for-profit counterparts, as EA is quite young, but our applicants are more impressive given their age. E.g. we get a lot of college student applicants, but those students are going to prestigious universities.
The 1/7 vs. 1/5 comparison is based on hire rate, but offer rate is more relevant to selectivity (if you disagree, could you explain why?) The difference in offer rate is 14% for CEA vs. 40% for Ashby; I’d be quite surprised if this large difference is still within your margin of error given your uncertainty.
Stepping back, the key question is whether EA jobs are still hard to get. As you note, any single perspective from CEA’s recruiting data will be imperfect. But they’ll be imperfect in different ways. For example, looking at offer rate as a percentage of applicant could be distorted by large numbers of clearly unqualified applicants, but this can be avoided by looking at offers as a percentage of people who made it past an initial screen or people who made it to a people ops interview. And problems with Ashby as a benchmark don’t apply if you’re assessing CEA’s selectivity in an absolute sense (or relative to benchmarks other than Ashby). If you look across a variety of perspectives and they all tell the same story, that’s probably the right story.
When I look at the different perspectives on the CEA’s recruitment data, they all tell the story that jobs at CEA are (very) hard to get. I don’t see any metrics that suggest the opposite is true, or even that it’s a close call or ambiguous in any way. The perspectives I find compelling (individually, but more so collectively) are:
I think it's pretty uncontroversial that our applicants are more dedicated (i.e. more likely to accept an offer). My understanding of Ashby is that it's used by a bunch of random tech recruiting agencies, and I would guess that their applicants have ~0 pre-existing excitement about the companies they get sent to.
The statement in the post is "CEA might be slightly more selective than Ashby’s customers, but it does not seem like the difference is large". This seems consistent with the view that CEA is selective? (It also just implies that Ashby is selective, which is a reasonable thing to believe.[1])
--
As a meta point: I kind of get the sense that you feel that this post is intended to be polemical, like we are trying to convince people that CEA isn't selective or something. But as you originally said: "the authors don’t seem to take an explicit stance on the issue" – we just wanted to share some statistics about our hiring and, at least as evidenced by that first comment of yours, we were somewhat successful in conveying that we didn't have particularly strong opinions about whether EA jobs are still hard to get.
This post was intended to provide some statistics about our hiring, because we were collecting them for internal purposes anyway so I figured we might as well publish. We threw in the Ashby thing at the end because it was an easily accessible data point, but to be honest I kind of regret doing that – I'm not sure the comparison was useful for many people, and it caused confusion.
It sounds to me like you think Ashby is selective: "the Ashby benchmark (which itself likely captures selective jobs)."
Re: offer rate vs hire rate, CEA’s applicants are likely applying to other EA jobs they’d also be dedicated to. CEA may well be more attractive than other EA employers, but I don’t think that’s a given and I’m not sure of the magnitude of any difference there might be. Bigger picture, as I mentioned earlier I think any individual metric is problematic and that we should look at a variety of metrics and see what story they collectively tell.
Re: your meta point, the thing I find confusing is that you “didn't have particularly strong opinions about whether EA jobs are still hard to get.” There’s a bunch of data, and every data point (CEA’s absolute offer rates at each stage, CEA vs. Ashby at each stage, and CEA vs. other benchmarks like McKinsey and Harvard) supports the idea that EA jobs are hard to get. So I don’t really understand why you present a lot of data that all points the same way, yet remain unconvinced by the conclusion they lead to.
Similarly, I find it confusing that you still seem to endorse the claim that "CEA might be slightly more selective than Ashby’s customers, but it does not seem like the difference is large.” CEA has lower offer rates and lower hire rates at each stage of the process. And in almost every case, the difference is quite large (at least 2x). Even in the one comparison where the difference isn’t huge (hire rates at the person ops/onsite stage), it is still a moderate magnitude (Ashby’s rate is 40% higher than CEA’s) despite the fact that CEA required passing 3 screens to get to that stage vs. 2 for Ashby. I think a more reasonable interpretation of that data would be “It's very likely that CEA is much more selective than Ashby’s customers, though it’s possible the magnitude of this difference is only moderate (and Ashby is not a perfect reference point.)”
I think I'm largely like "bruh, literally zero of our product manager finalist candidates had ever had the title "product manager" before, how could we possibly be more selective than Ashby?"[1]
Some other data points:
I acknowledge that, if you rely 100% on the data set presented here, maybe you will come to a different conclusion, but I really just don't think the data set presented here is that compelling.
As mentioned, our candidates are impressive in other ways, and maybe they are more impressive than the average Ashby candidate overall, but I just don't think we have the evidence to confidently say that.
It sounds like there are two, separate things going on:
Hmm, if we are still talking about comparing CEA versus Ashby, I'm not sure this carves reality at the joints: it's certainly true that people with zero experience have an uphill battle getting hired, but I don't think CEA is unusual in this regard. (If anything, I would guess that we are more open to people with limited experience.)
Sorry, I'm not sure I understand what your point is. Are you saying that my point 1 is misleading because having even any relevant experience can be a big boost for an applicant's chances to getting hired by CEA, and any relevant experience isn't a high bar?
Yeah, job experience seems like a major difference between CEA and Ashby. I’d guess that salary could be quite different too (which might be why the CEA role doesn’t seem interesting to experienced PMs).
It sounds like one of the reasons why EA jobs are hard to get (at least for EA candidates) is because EA candidates (typically young people with great academic credentials and strong understanding of EA but relatively little job experience) lack the job experience some roles require. To me this suggests that advising (explicitly or implicitly) young EAs that the most impactful thing they can do is direct work could be counterproductive, and that it might be better to emphasize building career capital.