
Link to the tool:
https://portfolio.rethinkpriorities.org
2-min Introductory Video:
5-min Tool Features Walkthrough Video:
Executive Summary
- This post introduces Rethink Priorities’ Portfolio Builder Tool. This interactive tool is designed to help individuals and organizations optimize their philanthropic giving portfolios by evaluating the cost-effectiveness of different cause areas. It leverages empirical estimates, simplified cost curves, and tailored decision-theoretic assumptions to help users explore optimal portfolio compositions.
- The Portfolio Builder Tool has two primary functions: (1) finding the optimal portfolio based on user-defined parameters, and (2) assessing the value of a specified portfolio under different decision procedures.
- The tool integrates cost-effectiveness analysis with decision-making models like Expected Value (EV), Difference-Making Risk Averse Expected Utility (DMREU), Weighted-Linear Utility Theory (WLU), and Tails-Excluded EV, enabling philanthropists to explore the impact of various combinations of empirical assumptions and risk attitudes.
- If the user is uncertain about decision procedures, the tool offers a way to build portfolios given a distribution of credences across decision procedures.
- The tool's insights reveal patterns that could significantly influence funding strategies. For example, while EV maximization can favor prioritizing existential risk mitigation, even slight risk aversion tends to shift allocations toward Global Health and Animal Welfare. By calibrating different inputs, users can refine their understanding of portfolio optimization, uncovering trends that should inform resource allocation.
- The nuances of risk, utility, and decision theories are crucial when trying to maximize impact across Global Health and Development, Animal Welfare, and Existential Risk Mitigation. The Portfolio Builder Tool facilitates our understanding of these nuances. As a result, it can help philanthropists better align their portfolios with their beliefs and risk preferences.
Intro
If we want to do as much good as we can, we need to evaluate the cost-effectiveness of particular cause areas. To establish our priorities, we need our best empirical cost-effectiveness estimates and, crucially, we must also make decision-theoretic assumptions. In the CURVE Sequence, RP’s Worldview Investigation Team investigated the cost-effectiveness of a wide array of philanthropic actions, including how well they fare under various kinds and levels of risk aversion. However, evaluating cause areas one at a time leaves out something important: namely, how various interventions fare in combination with one another. Most philanthropic actors, whether they be individuals or large charitable organizations, support a variety of charities and cause areas. How should you construct a giving portfolio in light of your beliefs and decision-theoretic commitments?
There are two key factors that matter when moving from an assessment of individual options to a portfolio.[1] The first is familiar: namely, the cost curves of the investments that comprise it. If a charity has diminishing marginal returns, then, at some point, it becomes possible that giving an additional dollar to the top-ranking charity would do less good than giving it to a different charity. Therefore, even someone who is risk-neutral and seeks to maximize expected value might have reasons to diversify.
Second, someone who is risk-averse may have additional reasons for diversifying. A risk-averse agent cares about the distribution of possible outcomes, preferring a surer-thing investment over one with the same expected value but higher variance in outcomes. Combinations of bets can have distributions of outcomes with less variance than their components. For example, an agent who is difference-making risk averse (DMRA) — in practice, regardless of what she thinks in principle[2] — wants her actions to make some positive difference and seeks to avoid situations where her actions have no effect. If every charity has some chance of failing, then giving to a single charity is risky. By distributing her money across different charities that are (at least partially) independent of one another, she can increase the chances that her portfolio will have some positive effect. An investment that is deemed too risky on its own might nevertheless be acceptable when packaged with other investments.
Rethink Priorities’ Portfolio Builder Tool allows users to evaluate giving portfolios in light of various cost curves and decision theories. It has two main functions:
- To find an optimal portfolio given a range of more or less optimistic cost curves and decision procedures (e.g., Expected Value or Risk-Weighted Expected Value).
- To calculate the value (or ‘score’) of any specified portfolio given a particular decision procedure.
A real-world assessment of a giving portfolio would require a lot of information: we would need the cost curves for the projects that it might include, the relationships between those projects (i.e., the (in)dependencies among their outcomes), and knowledge of how other actors in the space are going to allocate their resources.
By design, our tool is more modest than that: we compare three broad cause areas (Global Health and Development, Animal Welfare, and Existential Risk Mitigation), we use simplified models for cost curves within each cause area, we assume that risk probabilities are independent across cause areas, and we assume that actors are operating in a vacuum.[3] Our goal is to allow users to explore the implications of particular assumptions and parameter values for giving portfolios across major EA cause areas, not to settle questions about the correct overall allocation.
New users can calibrate the Portfolio Builder Tool to their own empirical and decision-theoretic judgments using an introductory quiz. Advanced users can directly manipulate cost curves and decision theories. And regardless of background, the tool provides a quick way for users to see portfolio construction through the lenses provided by different assumptions. It illustrates how different reasonable decision theories can combine with different risk profiles and cost-effectiveness curves to produce strikingly different portfolio recommendations.
Key Components
In our tool, the key considerations that influence portfolio composition are cost curves, probability distributions, and decision theories.
A. Cost-Effectiveness Curves
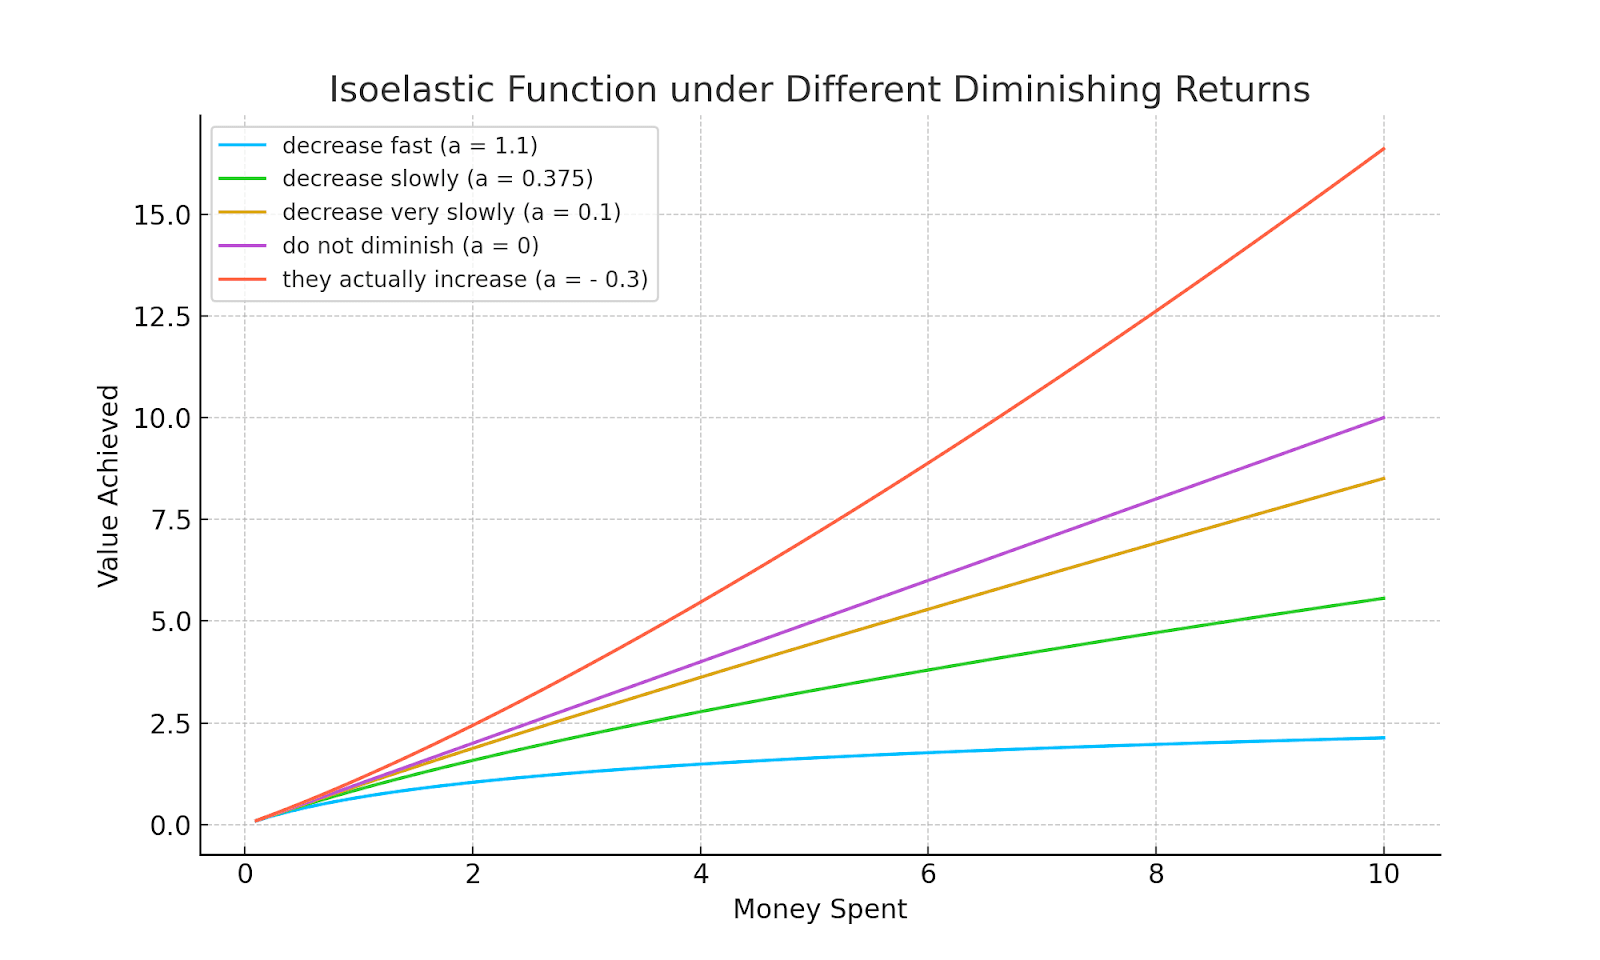
For each sector, users select a cost-effectiveness curve (or cost curve) that represents the value yielded by different funding levels. Two features of the cost curve matter: how high the payoffs are and how steeply the returns on investment decline. First, portfolios will be influenced by the magnitude of payoffs in different cause areas. For example, the expected value of existential risk mitigation strongly depends on assumptions about the value of the future. Second, many real world projects get less effective on the margin the more money is spent on them. This is also true, to varying extents, for large cause areas. The cost curve you assign to, say, animal welfare will reflect your judgment about how much every extra dollar given to animal welfare matters. If, for example, you think that there are few projects in that area that can absorb funding, then you should think that returns will diminish quite quickly. If you instead think that the cause area will become more effective the more money is invested, you should think that returns actually increase.
We represent cost curves by using an isoelastic function, where a parameter (or in some contexts) represents how quickly returns diminish (or increase if ). For each cause area, users can choose among three pre-configured cost curves: default, optimistic (where utility diminishes slowly), and pessimistic (where utility diminishes rapidly). They can also configure their own, choosing among different types of functions and parameter settings.
B. Probability Distributions
Even given a general cost curve, there may be uncertainty about the actual effects that a particular investment will have. For every project, there is some probability that it will backfire or do nothing, so an assessment of its value will need to take both its possible successes and failures into account. To capture the stochastic nature of funding projects, we put forward a model that takes into account a range of possible outcomes paired with their probabilities.
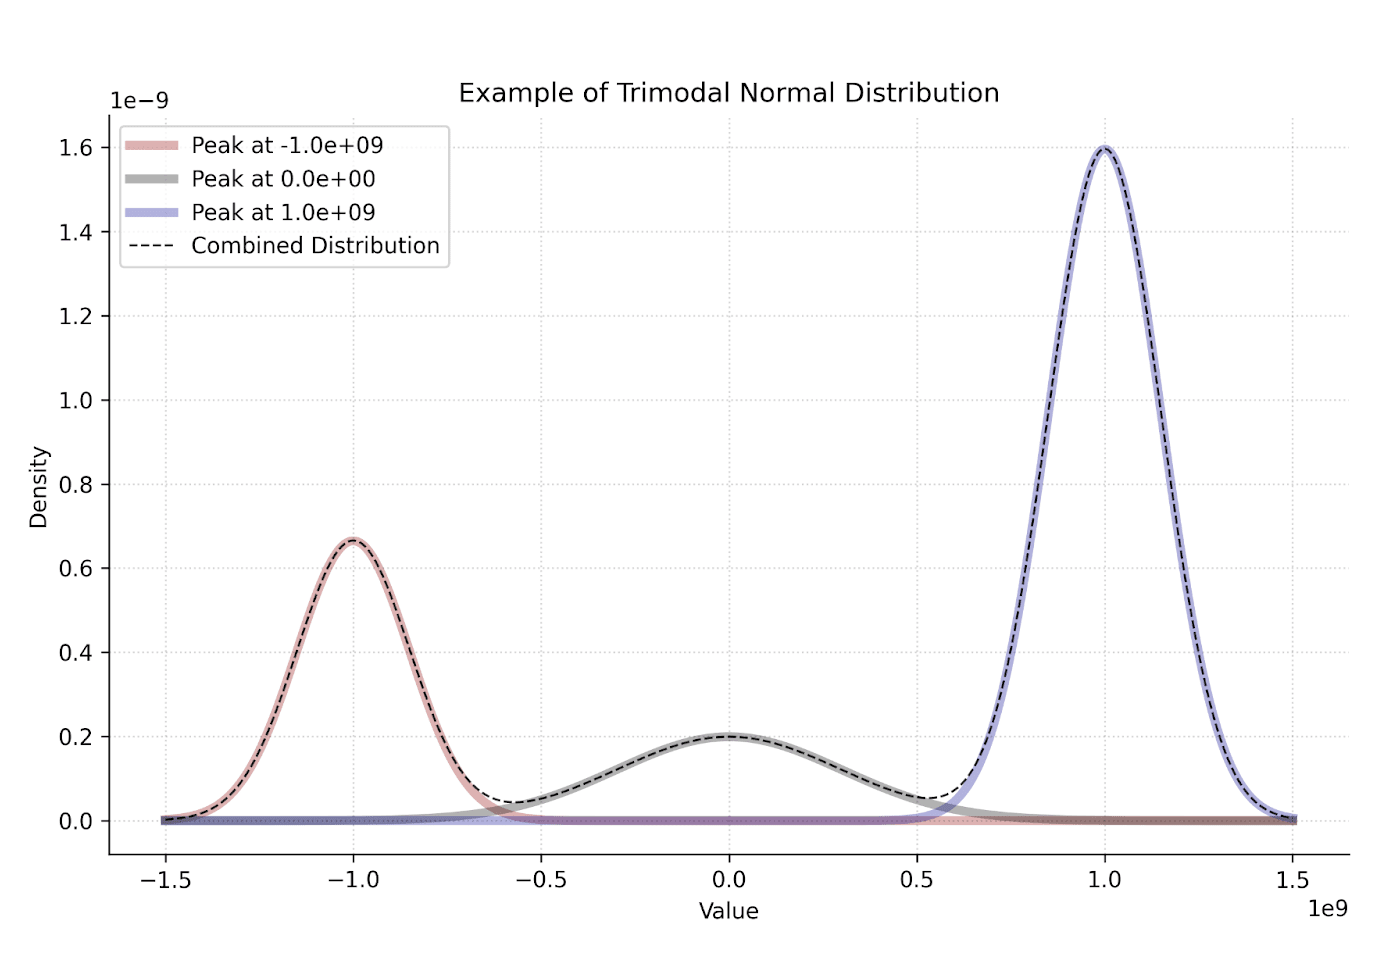
We achieve this by considering a distribution of possible outcomes, typically measured in DALYs averted, that could result from any given level of spending. There are many possible models and distributions we could use. To emphasize the qualitatively distinct outcomes, our default choice is a trimodal normal distribution. This approach adds some realism to a traditional normal distribution without introducing too many new variables or model components. It allows us to directly consider scenarios where the net effects of our spending might be futile or even negative.[4] For example, we might fund interventions for animals that turn out not to be sentient, or start an AI research institute that accidentally highlights dangerous capabilities in a harmful way. Below, you can see an instance of the trimodal model where we fixed the budget and assigned non-zero weight to the three peaks (that is, the probability of futile and negative outcomes is non-zero).
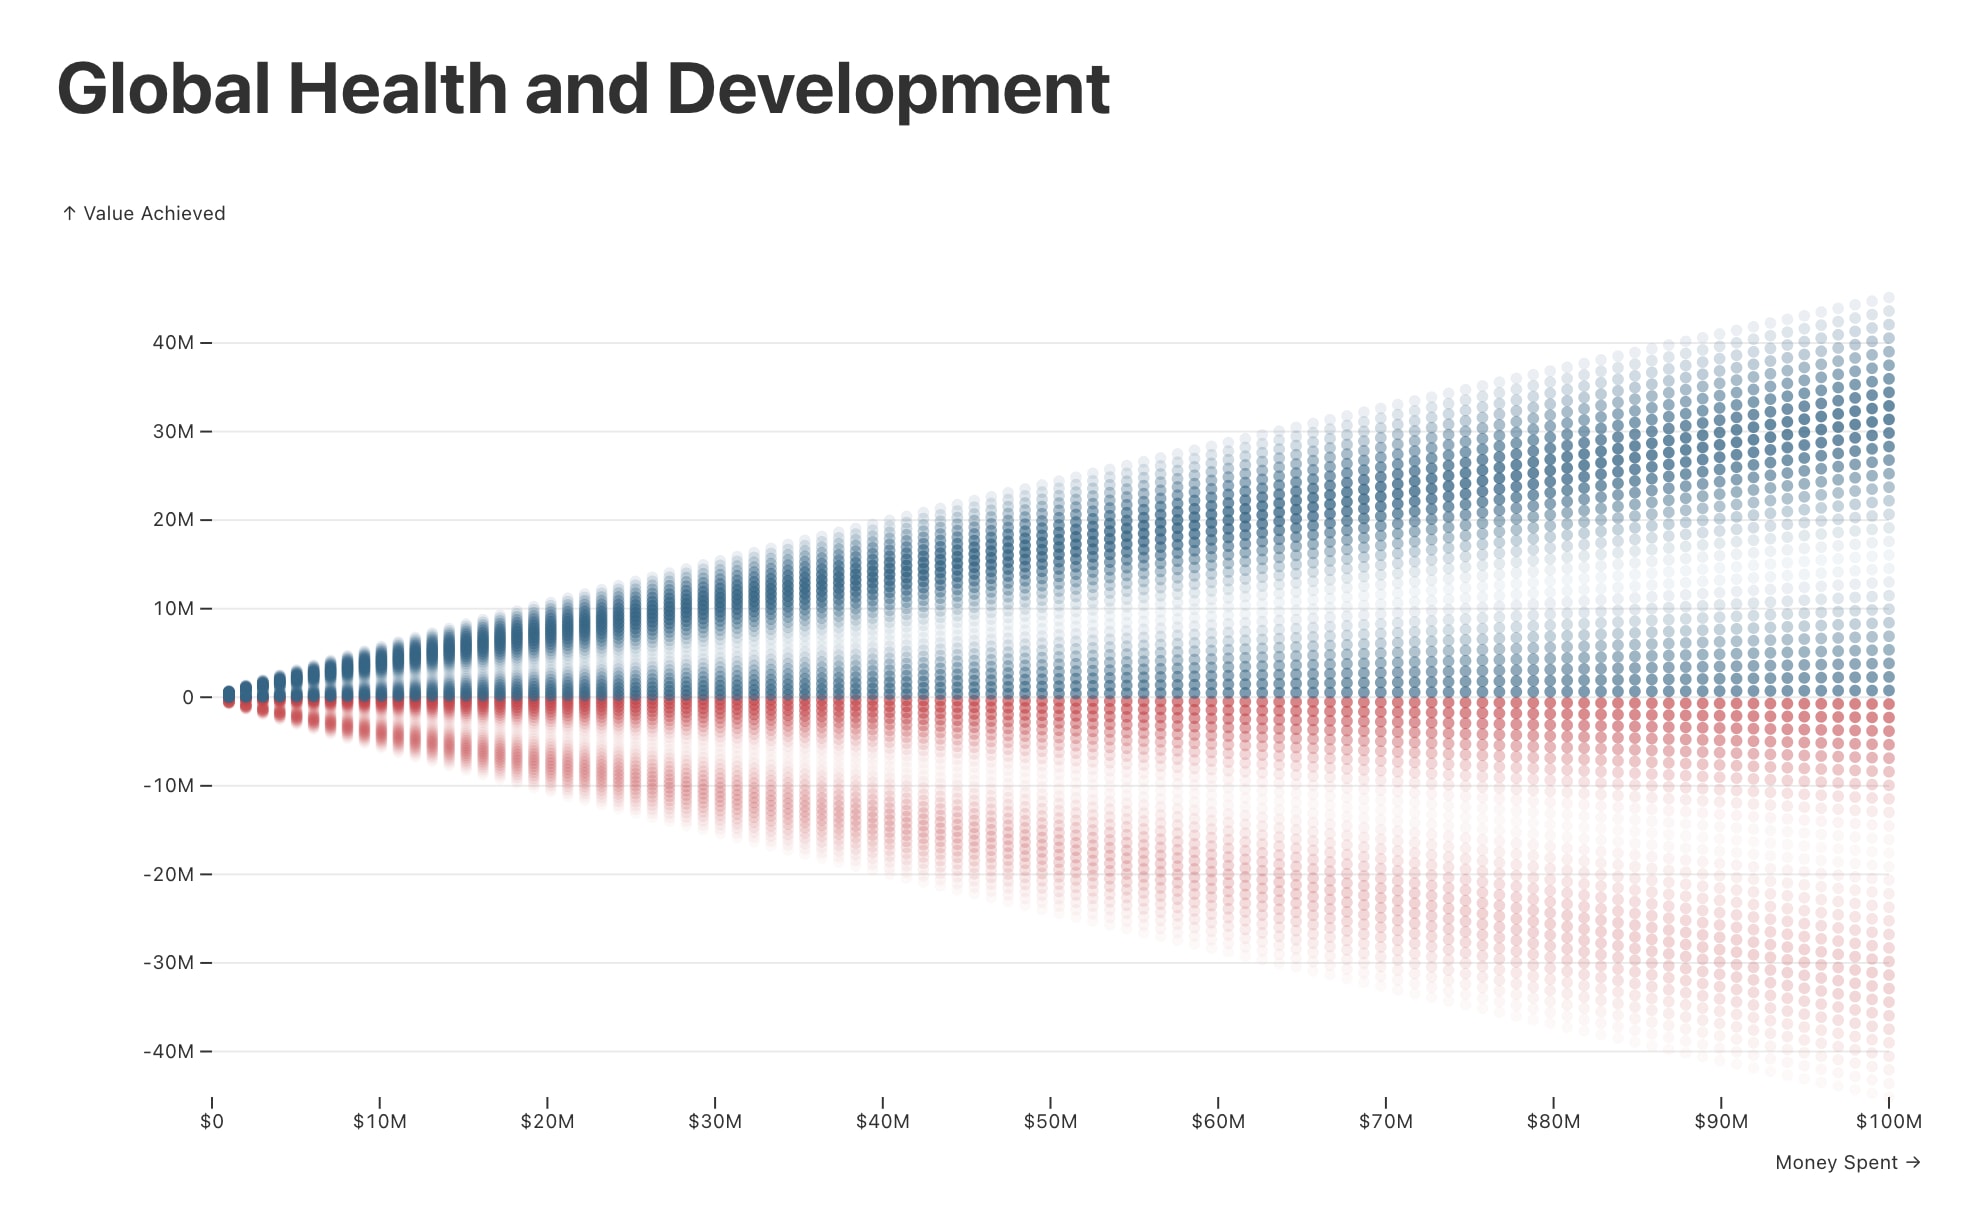
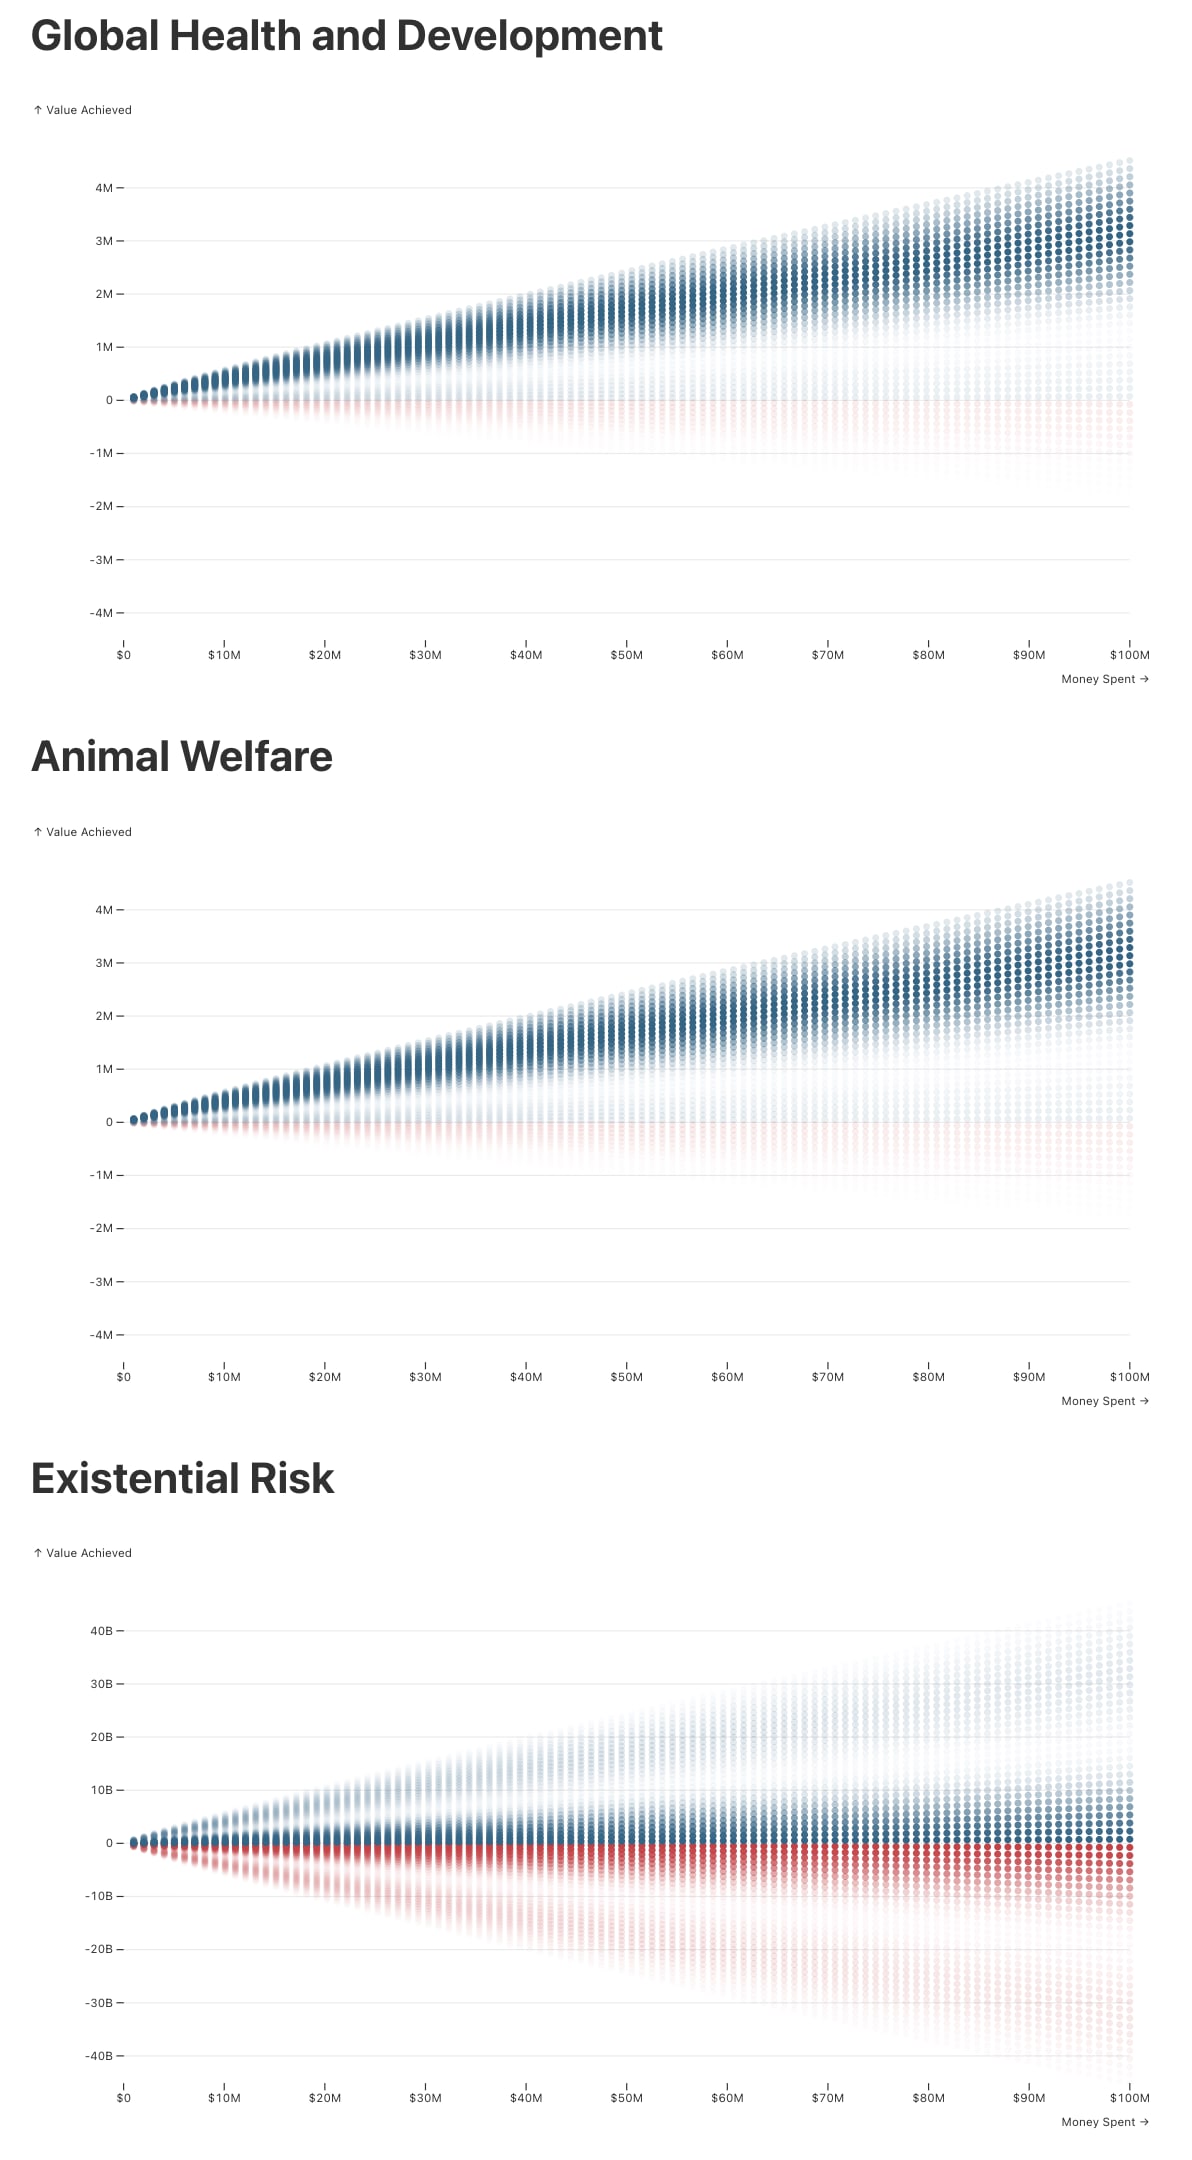
To make cost-effectiveness distributions easier to visualize, we provide shooting graphs for each cause area. These graphs plot the outcomes for any given amount of spending, with more likely outcomes shown with greater opacity. The tool’s graphs display all possible spending amounts, from $0 to your chosen budget. For ease of inspection, outcomes that achieve positive value are colored blue, while negative outcomes are colored red.
Of course, the proposed trimodal normal distribution is a simplification of reality. One might reasonably expect there to be more or fewer peaks, or for the distribution to behave more smoothly. To address this and provide a higher level of customization, we offer more advanced users six other models, including a more traditional single-peaked normal model (these are explained in the FAQ). Unimodal and bimodal normal distributions are easily accommodated within this trimodal framework too, by assigning zero weight (probability) to futile or negative outcomes. A unimodal normal distribution can also be selected directly. To do this, click ‘Other (custom setting)’ in any of the questions, navigate to ‘Cost-Effectiveness Model’, and select ‘isoelastic normal’ from the list. There you can set the desired scale and diminishing returns parameters (which determine the mean outcome), and then select your preferred standard deviation.
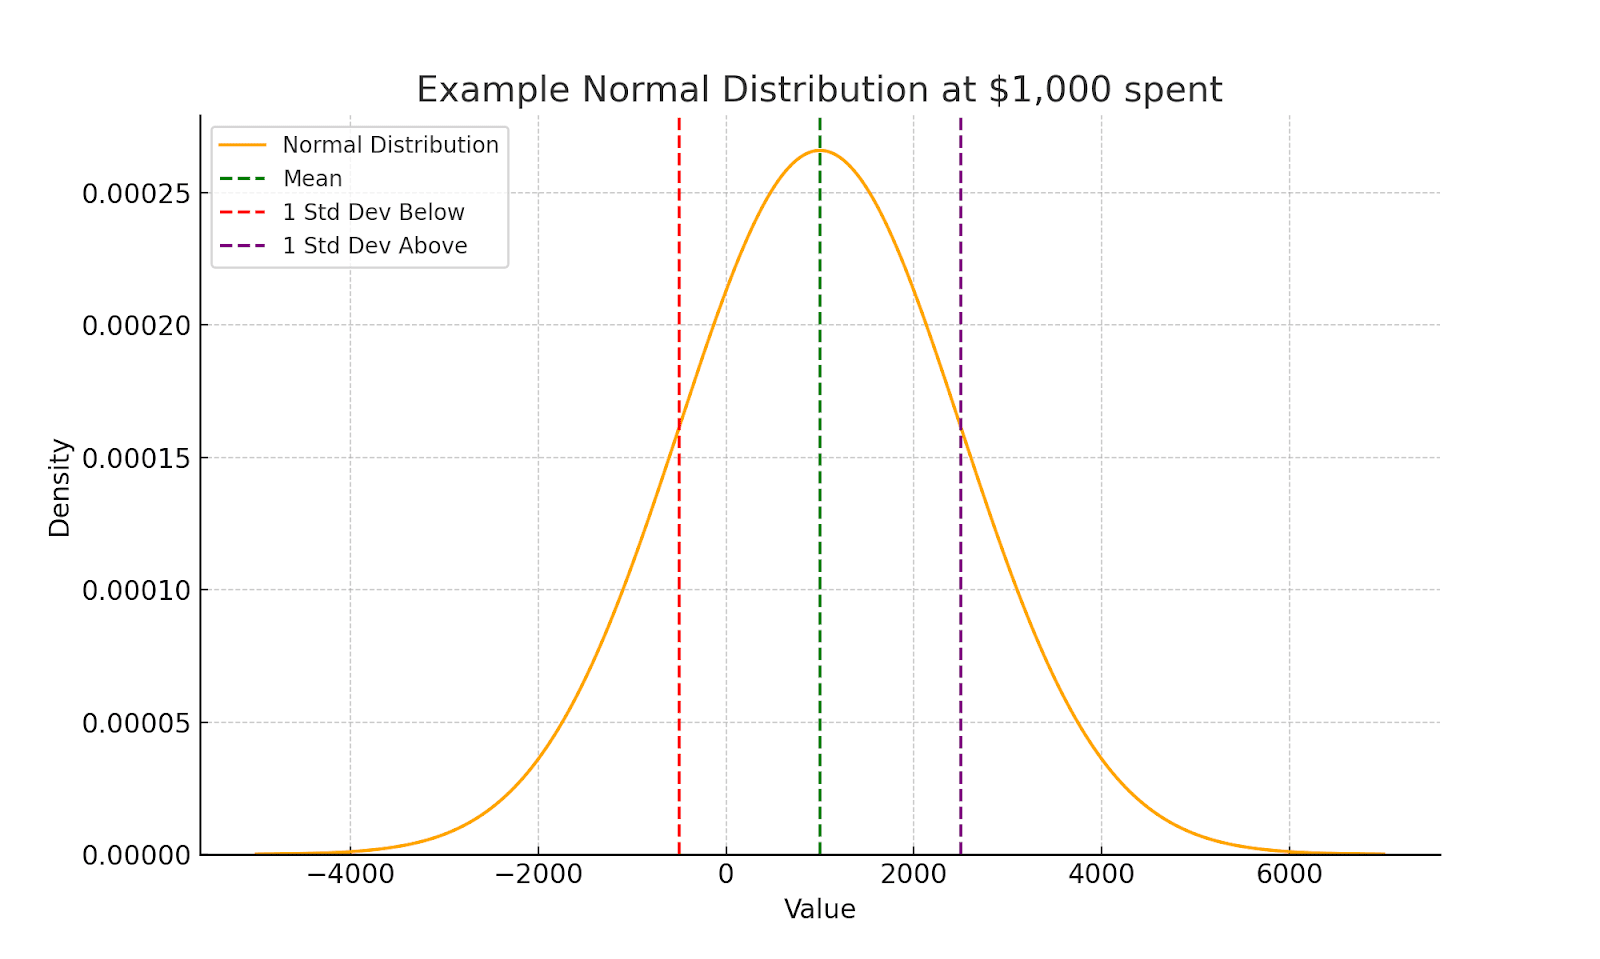
To briefly illustrate the isoelastic normal model, suppose you chose zero diminishing returns, a scale of 1, a budget of $1,000, and a standard deviation 1.5 times the size of the mean. Once $1,000 were spent, the mean outcome would be 1000 units of value. This can all be observed in the shooting graph and the plot of the distribution at that level.[5]
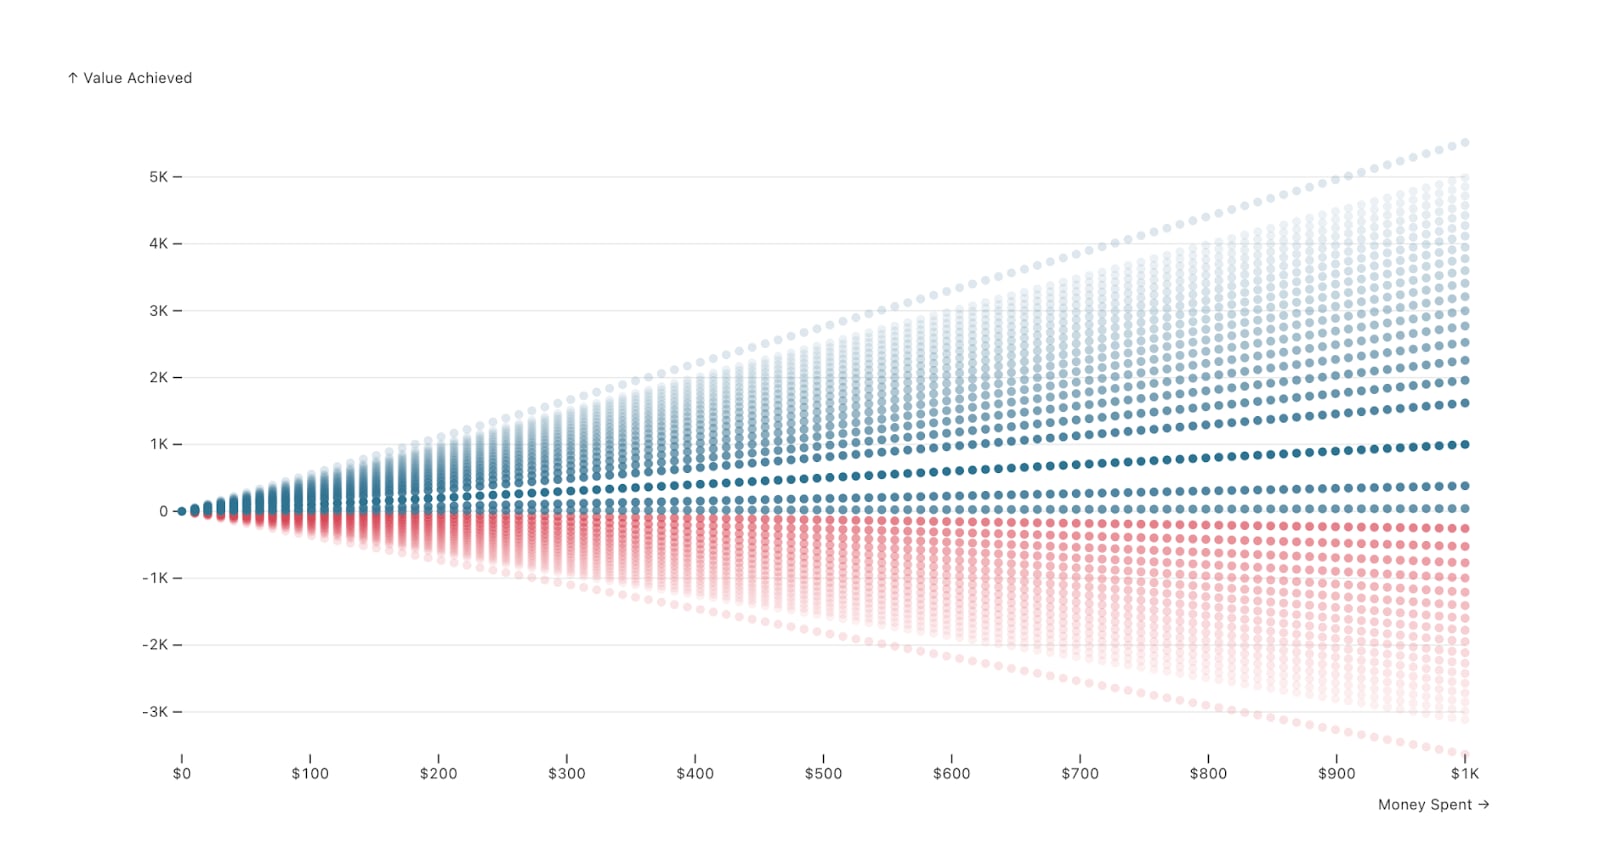
Fixing the amount spent at $1,000, we could also draw a familiar normal distribution to visualize the model’s behavior in more detail. We do this below.
C. Decision Theories
A decision theory evaluates an action via some function of its probability distribution over possible outcomes. One key distinction is between risk-sensitive decision theories, on which the spread of a distribution matters, and risk-neutral decision theories, on which it doesn’t. The tool allows users to compare the judgments of the following decision theories:
- Expected Value: A project’s EV is the weighted average of the value of each outcome, where each outcome is weighted according to the probability that the act will lead to that outcome. EV maximization is completely risk-neutral.
- DMREU and WLU: A difference-making risk averse (DMRA) agent desires that her actions make a difference and is averse to outcomes that do no tangible good or cause harm. DMRA puts more weight on the worse outcomes of an action and less weight on the better ones. We consider two DMRA theories.
- DMREU: adapts Buchak’s (2013) Risk-weighted Expected Utility Theory (REU) to capture difference-making. DMREU discounts better outcomes as a function of their probability. Larger powers (>1) of DMREU entail larger discounts to better outcomes. Powers less than 1 represent risk-loving preferences.
- WLU: incorporates risk sensitivity as a function of outcomes’ utilities rather than their probabilities. We adapt WLU from Bottomley and Williamson (2023) for difference-making purposes by taking the utility of a state to be the value added by the action. Smaller powers of WLU embody more risk aversion.
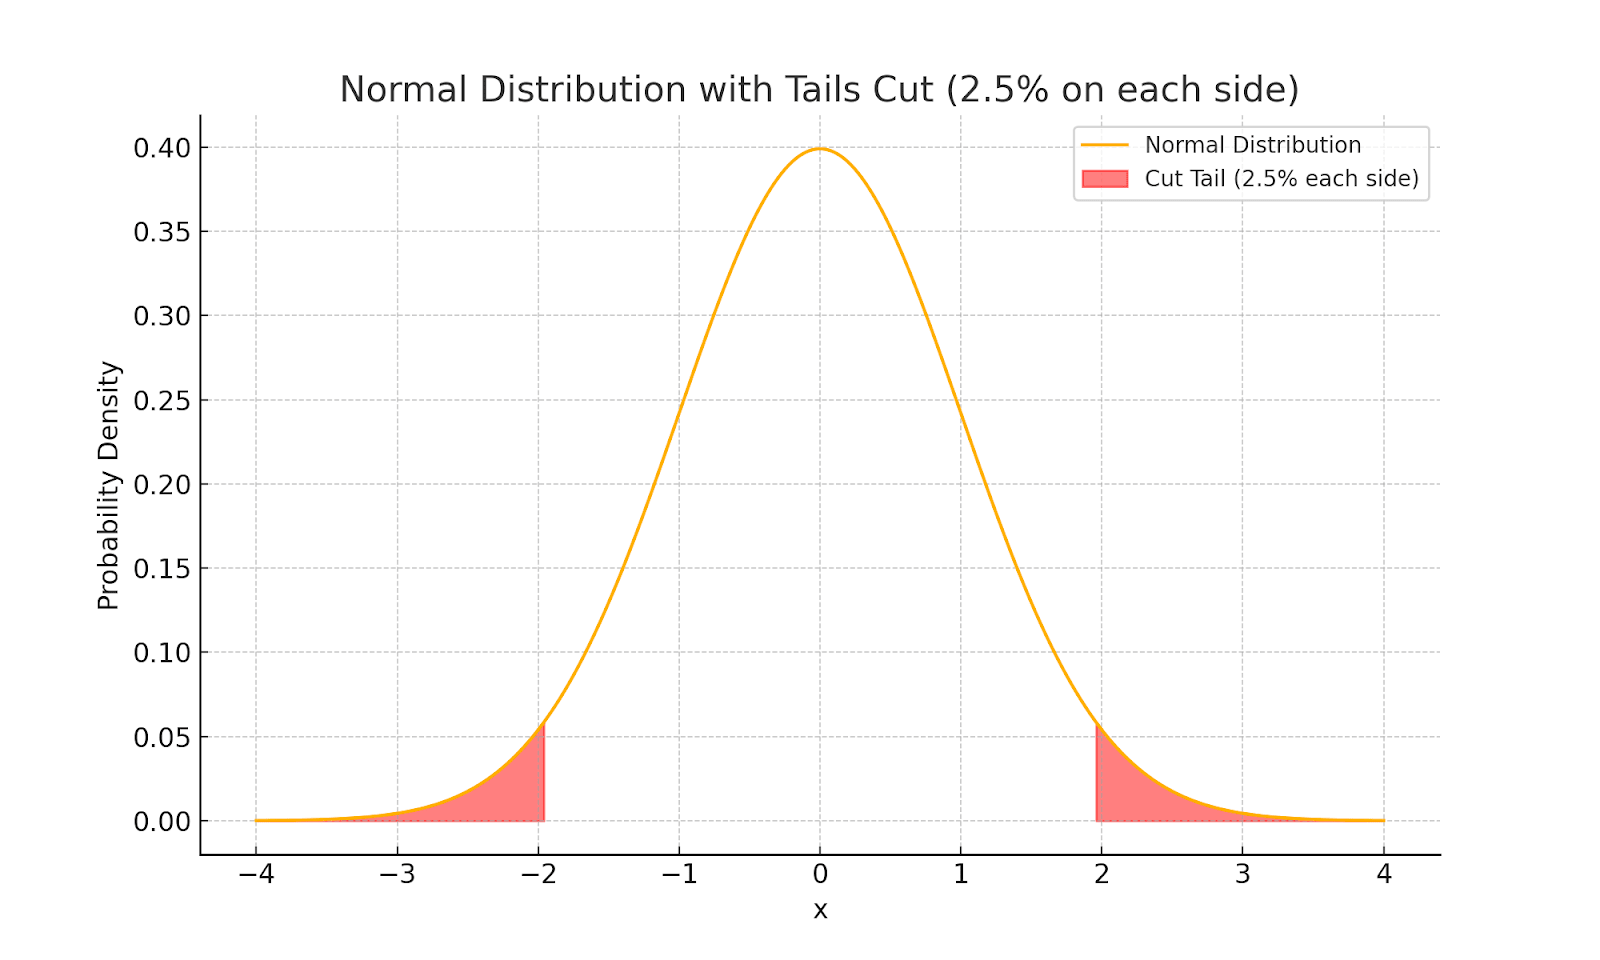
- Tails-Excluded EV: An alternative method for incorporating risk aversion excludes very improbable outcomes. Outcomes are ranked by value to form a distribution, and the extreme tails, which represent the worst and best outcomes in the distribution, under some probability threshold, e.g., 0.5%, are cut out. It then rescales the remaining probabilities. In a normal distribution, this corresponds to ignoring the left and right tails.
Outputs
Optimal Proposed Portfolio
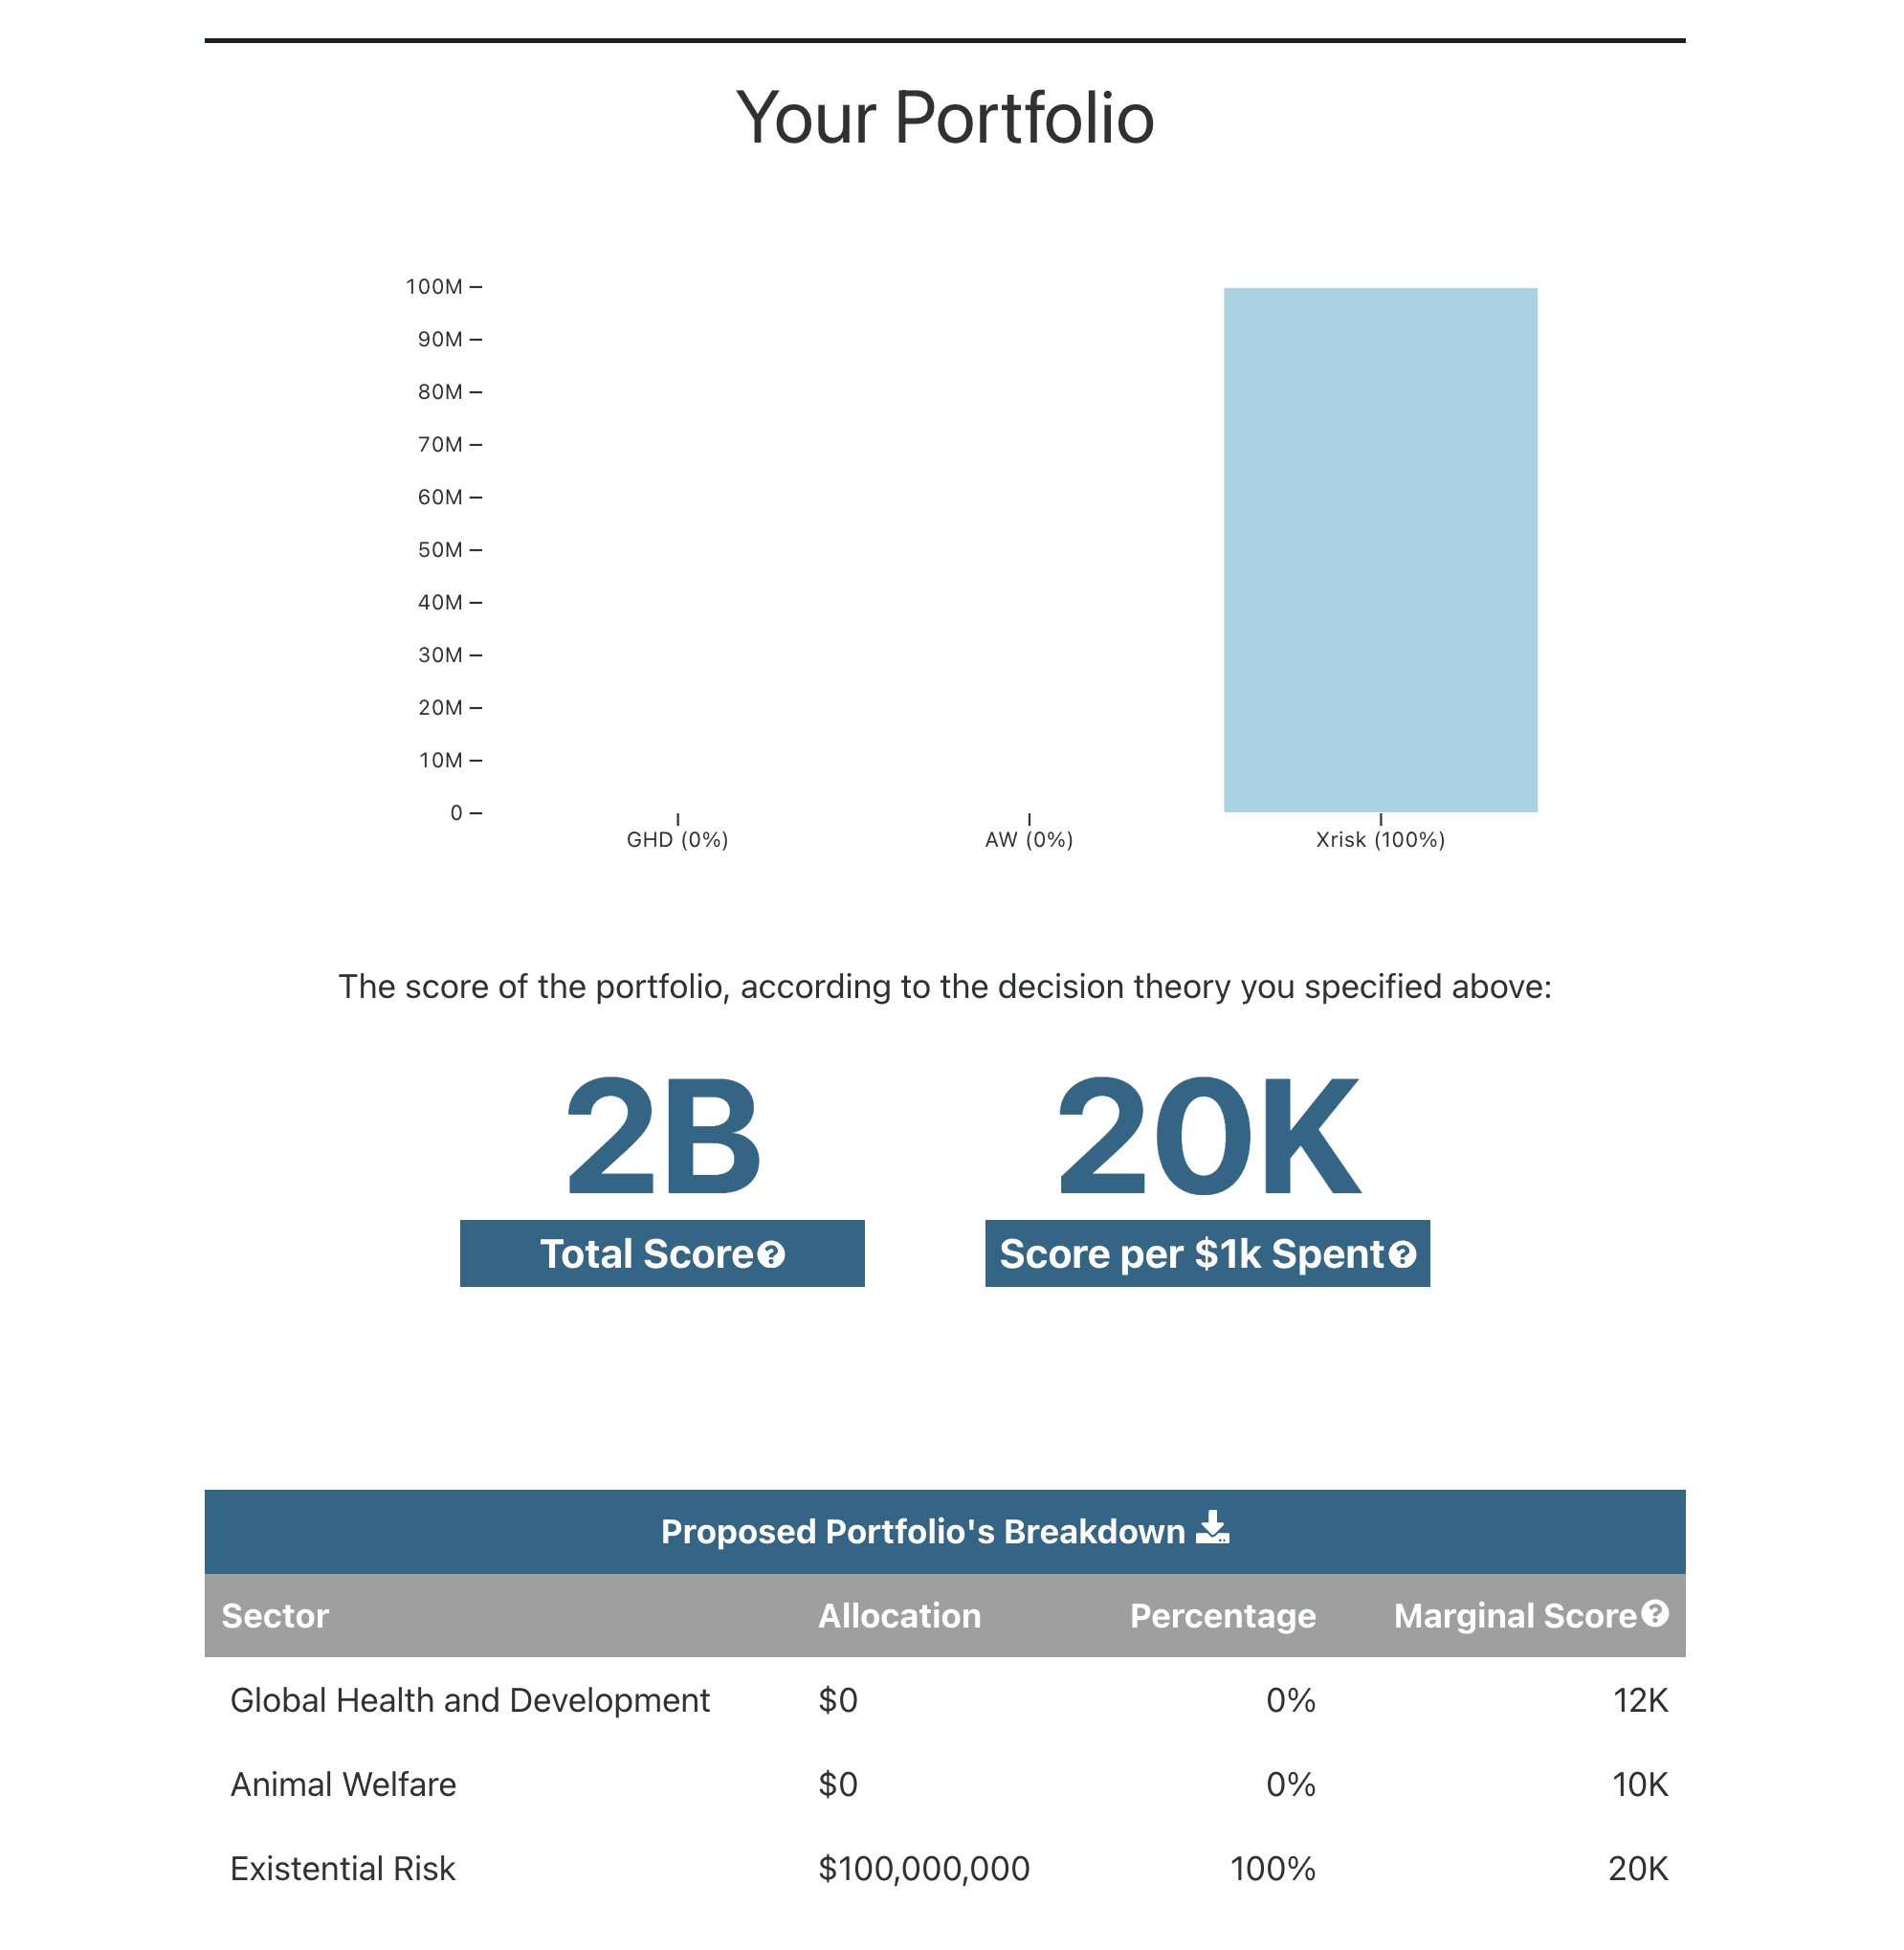
The Optimize Allocation function will find the optimal allocation of funds given the selected cost curves, decision theory, and amount of money to be spent. The proportion of funds allocated to each cause area is provided, as is the total score and score per $1,000 spent (by the lights of the chosen decision theory). Even when different parameter settings give rise to the same optimal allocation, the total score allows users to evaluate how the cost-effectiveness of those allocations vary under different assumptions.
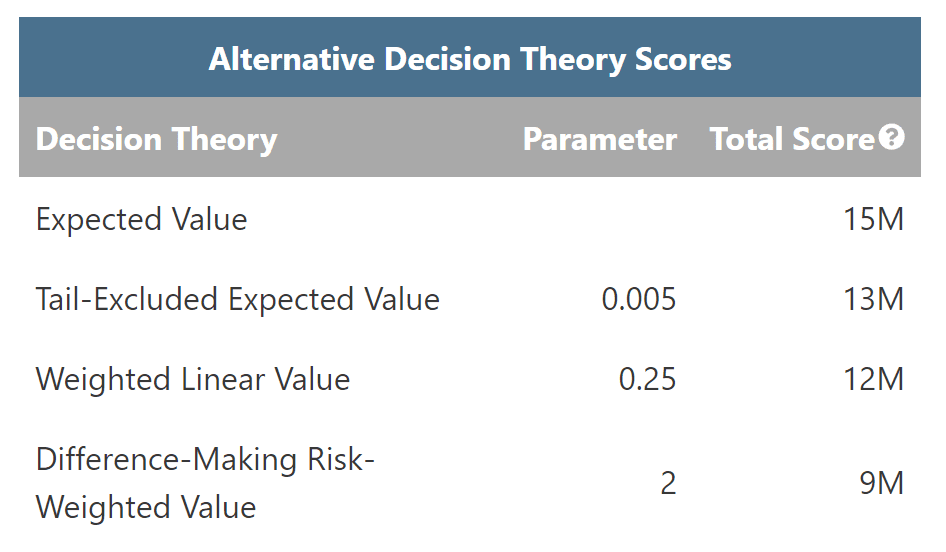
Alternative Decision Theory Scores
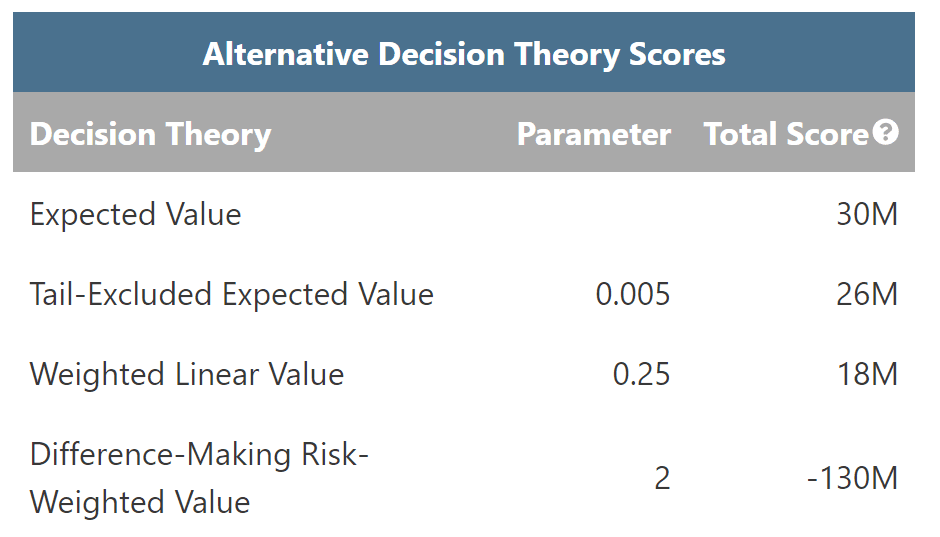
The evaluator function offers the scores that various decision theories assign to a portfolio. Caution should be taken when interpreting these scores since they are not measured on a common scale. Each theory’s score should only be compared to other scores of that theory. These numbers can be used to track how scores relative to particular decision theories change with changing inputs.
Consider the following examples. For Portfolio A on the left, Expected Value assigns a score of 30M and WLU assigns a score of 18M. That does not mean that Portfolio A is 1.7 times better by the lights of EV than WLU. But, we can sensibly compare each decision theory’s scores across different portfolios. Portfolio B on the right was generated by tweaking a few of A’s parameters. By the lights of the first three decision theories, Portfolio B is worse than A. However, by the lights of DMREU, B is better than A.
Aggregating Across Decision-Theories
The tool constructs an optimal portfolio by the lights of a selected decision theory. However, what should you do if you are uncertain about which decision theory best captures your risk attitudes or is most appropriate for a particular application? The Aggregate Across Uncertainty function allows you to assign credences to different decision theories and select a method for aggregating across them. For a discussion of these methods, see Aggregating Across Risk Attitudes.
Example of a pattern we noticed
Given the large number of possible parameter settings in the model, there are many different portfolios that may be recommended. Here, we point out a few general trends.[6] We provide more detailed examinations of various scenarios of interest to the EA community in this accompanying post.
Existential Risk Mitigation fares well under EV maximization
If you are an EV maximizer, optimal portfolios tend to give most —and often, all— of the proposed budget to existential risk mitigation. Existential risk performs less well if you are worried about:
- The chance that such efforts will backfire
- How much money existential risk projects can absorb
- The value of the future that is secured by successful existential risk mitigation efforts
Nevertheless, existential risk dominance under EV maximization is fairly robust to many parameter settings.
For example, suppose that, like in Figure 8 below, you are quite optimistic about the Global Health and Animal Welfare sectors. You’re quite pessimistic about existential risk projects’ probability of success and chance of backfire, but think that the payoffs of success would be very high.
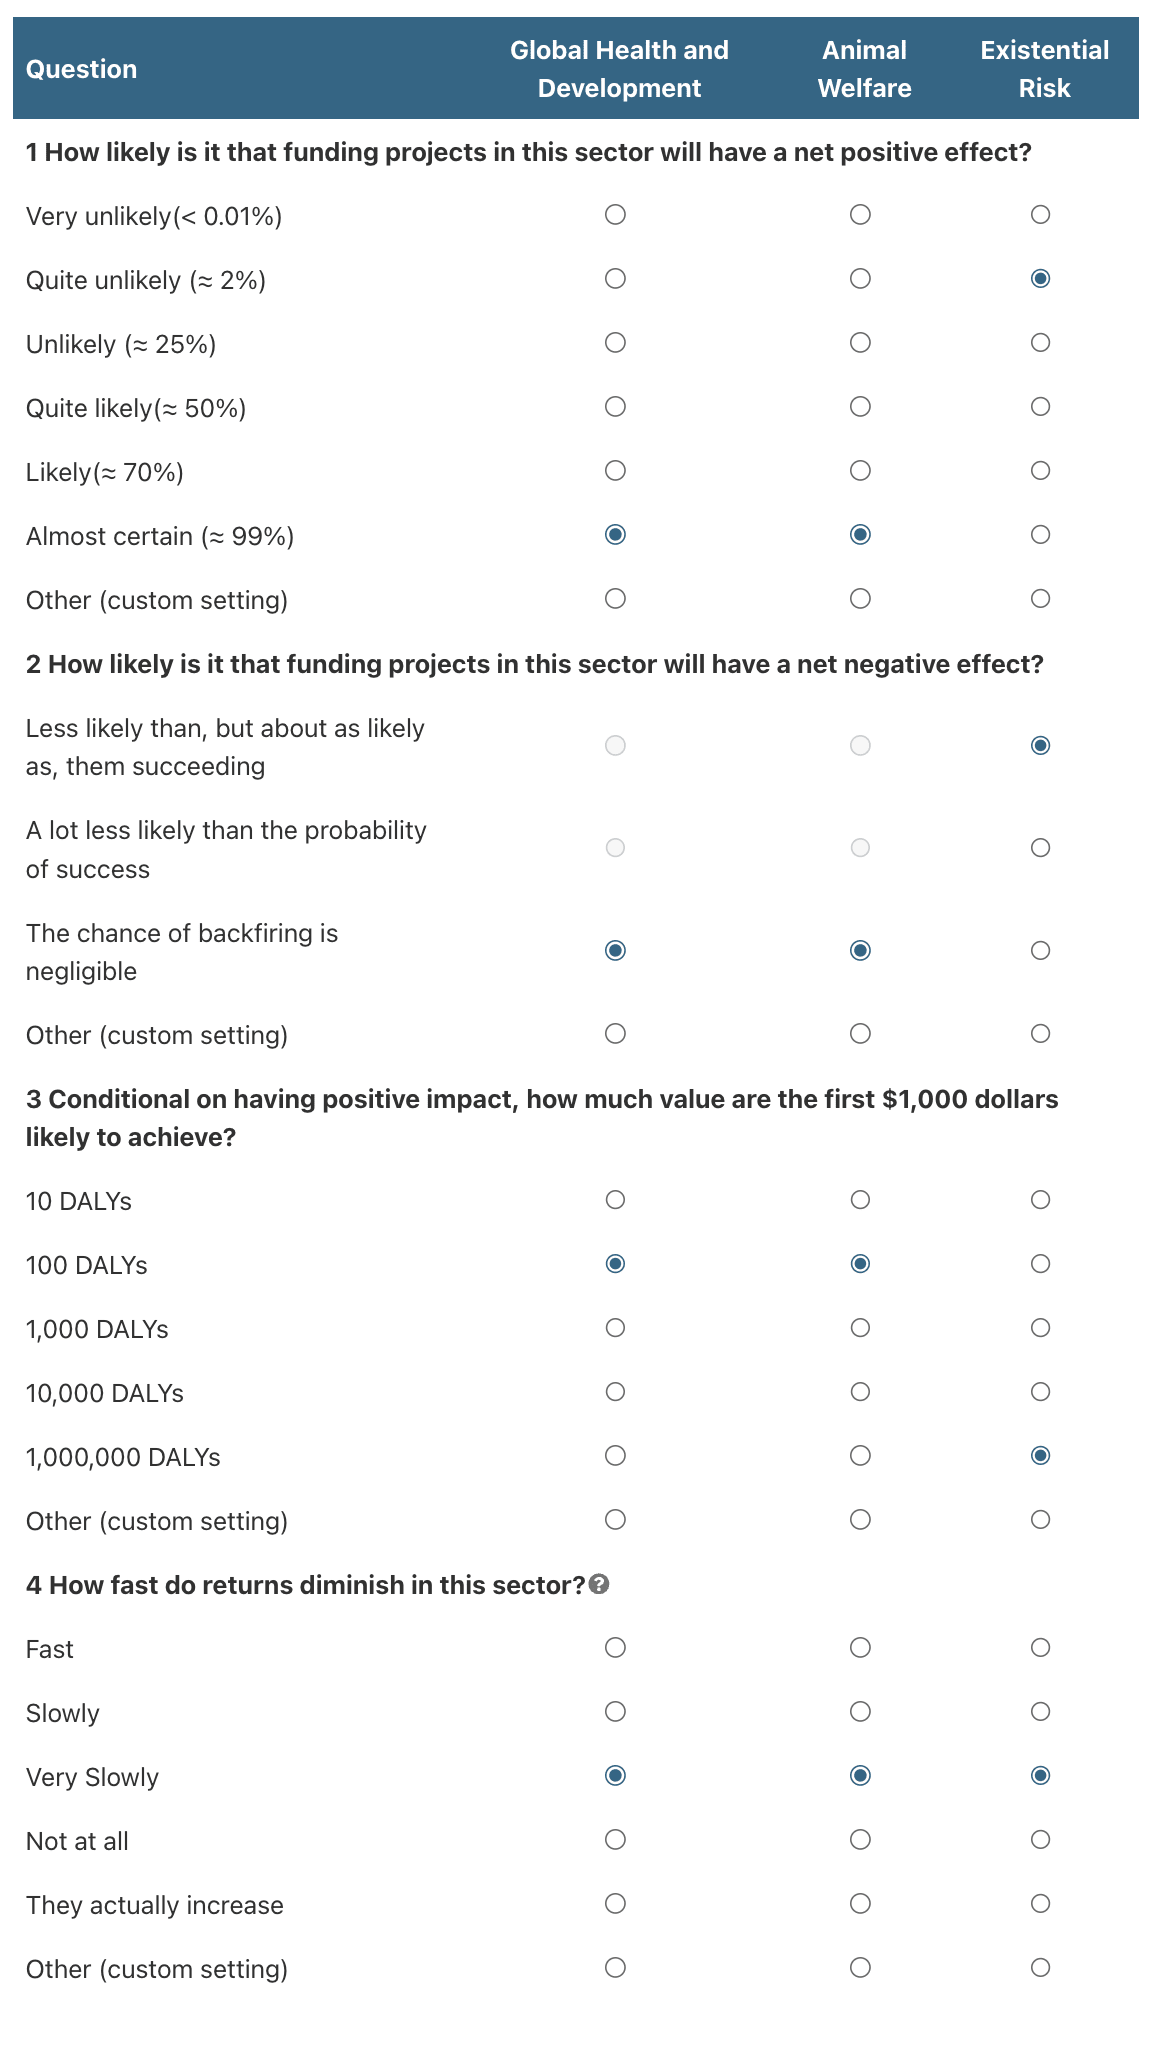
The cost-effectiveness curve distributions that arise from these settings can be visualized as the three shooting graphs in Figure 9.[7]
Then, given these empirical assumptions and EV maximization, the recommended portfolio devotes all funds to existential risk.
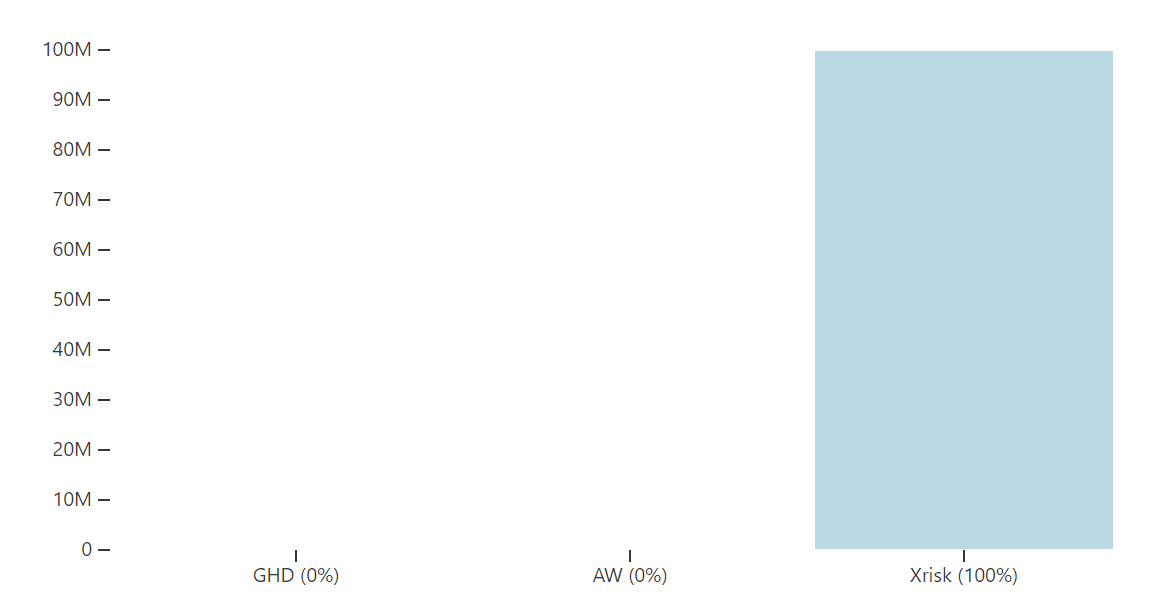
Link to table: Saved Configuration 2024-06-05 02:08:39
Risk aversion favors Global Health and Animal Welfare
While EV maximization often favors existential risk, even small amounts of risk aversion result in substantial amounts going to Global Health and Development (GHD) and Animal Welfare (AW).
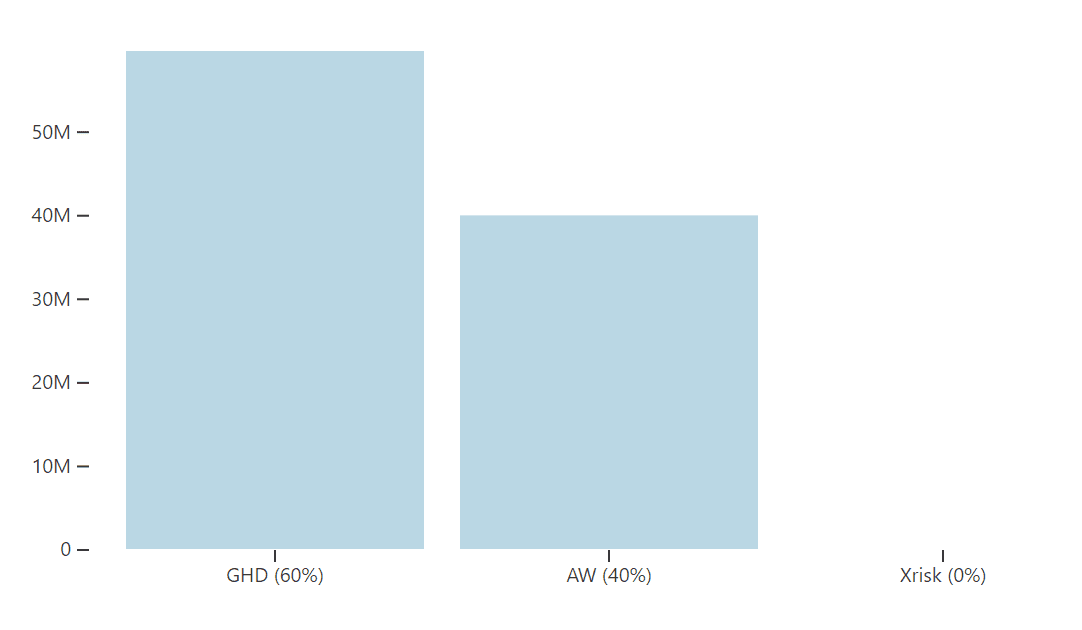
For example, suppose we used the same inputs as above but with a bit of risk aversion, e.g., DMREU with power 1.54 (see the FAQ for more details). The tool now recommends splitting the funds between GHD and AW.
Empirical uncertainty about cost-effectiveness matters
Of course, if we thought the value achieved per dollar spent on any cause was sufficiently high, that cause will trivially dominate the other two. For example, if, in the context above, we multiplied x-risk cost-effectiveness scale parameter by a factor of 10 or 100, some decision theories, including tail-excluding EV at the 0.2% threshold will yield an all-in existential risk recommendation.
Two strategies for improving individual funding decisions
One possible strategy users might follow to improve their funding decisions is to use the tool to help determine a potentially ideal allocation of resources across the community. Then, by examining the best evidence on the current distribution and comparing it to the ideal, users can identify areas where their contributions would be most impactful. This method allows individuals to support underfunded ventures, effectively nudging the community closer to what they perceive would be a better allocation of resources.
Alternatively, the tool offers a more direct way to examine decision-making by allowing users to input parameters for their three top charitable ventures and, assuming their outcomes are not correlated, evaluate what’s optimal among them. This might add to or replace existing systems playing this role, like BOTECs. In this capacity, the tool serves as a decision-support system, enabling users to identify which causes would yield the highest returns on investment based on their personal criteria.
Getting Started
To begin experimenting with RP’s Portfolio Builder Tool, answer the four questions at the top of the tool’s homepage, select a decision theory, and hit “Build Portfolio”. If you’re an advanced user, you can also customize the parameters in more detail. To get a sense of the tool's functionality, you can watch the walkthrough videos. If you come across any bugs, please share them here. We will update this document with some frequently asked questions.
Acknowledgments

The Portfolio Builder Tool is a project of the Worldview Investigation Team at Rethink Priorities. Arvo Muñoz Morán and Derek Shiller developed the tool; Hayley Clatterbuck, Bob Fischer, and Arvo Muñoz Morán wrote this post. We’d also like to thank David Moss, Adam Binksmith, Willem Sleegers, Zachary Mazlish, Gustav Alexandrie, John Firth, Ella McIntosh, Will McAuliffe, Jamie Elsey and Eric Chen for the helpful feedback provided on the tool. If you like our work, please consider subscribing to our newsletter. You can explore our completed public work here.
- ^
Arguably, there is a third type of uncertainty: meta-decision-theoretic uncertainty. To address it, the tool also offers a way to build portfolios given a distribution of credences across decision procedures.This type of uncertainty can also motivate diversification.
- ^
That is, we want to be very clear to separate a decision procedure, which is an in-practice method of balancing risk and value to achieve your objectives, from a criterion of rationality, which is an in-principle account of what makes decisions rational. You can be a pure expected value maximizer in principle, accepting EV maximization as a criterion of rationality, without thinking that ordinary agents in real-world decision-making contexts should use EV maximization to settle how to act. We only mean to discuss attitudes that can be represented using risk-averse decision procedures; we aren’t interested in defending any particular decision theory per se, understood as a criterion of rationality — nor do we think that it’s important to defend one to motivate relying on one as a decision procedure in real-world circumstances.
- ^
It is important to note that while this tool can be used to model individual charities within the same cause area, one should exercise caution in doing so. This is because the outcomes of these charities are likely not independent, and the algorithms to calculate decision-theoretic scores assume independence.
- ^
Users’ answers to the quiz questions determine the shapes and sizes of these three peaks of the distribution.
- ^
There appears to be a slight gap between the mean lines and the one around it. The gap does not reflect anything about the distribution and exists for computational reasons only: accuracy is given less importance around the mean. It's a limitation of the framework we chose to illustrate functional behavior but it does not affect any calculations.
- ^
These conclusions are generally contingent on the default parameter values that we have assigned, which we think are plausible but are by no means certain. For example, someone might assign significantly higher or lower value to the future, which would have significant effects on portfolio choice, especially under expected utility maximization.
- ^
Note that the scale of the y-axis for existential risk (ranging from -250 billion to 250 billion) is enormous compared to that of GHD and AW (-20 million to 20 million). The disparity in scale observed in this example, can arise in many other cases, and is by no means exclusive to existential risk.
Executive summary: Rethink Priorities has developed a Portfolio Builder Tool to help users evaluate and optimize philanthropic giving portfolios across cause areas, taking into account cost-effectiveness curves, probability distributions, and decision theories.
Key points:
This comment was auto-generated by the EA Forum Team. Feel free to point out issues with this summary by replying to the comment, and contact us if you have feedback.