Comments
Systemic work in the Effective Altruism space – Do EA organisations pay attention to systemic issues?


13 min readSep 1
15
This is the third post in a sequence on Effective Altruism and systemic change. In the first two posts, we outlined the origins of this project, our main motivation, and our understanding of “systemic change”. In this post, we present an empirical investigation in the form of a survey we undertook.
Our goal for this empirical project was to give a solid assessment of the extent to which EA-adjacent organisations are already pursuing a systems-oriented approach in their interventions and strategies. Below, we describe our methodology for producing the empirical assessment, together with a clear outline of the limitations we encountered and the resulting shortcomings in our findings. We then present these findings descriptively, offering tentative suggestions for how to interpret them. If you didn’t read the first two posts, you can find them here (post 1, post 2), or read the following summary:
Acknowledgements: To produce this empirical overview, we benefited from the help of volunteers for external assessments and representatives from organisations for internal assessments. Both groups responded to questionnaires we prepared. We are grateful for everyone who took the time to respond to our survey. We understand that most organisations were not able to take the time out of their work for an unknown project group.
While discussing whether there should be more work inspired by systemic thinking in effective altruism, we realised that our sense of systemic change’s neglectedness was largely anecdotal and vague-observation-based. That led us to plan an empirical investigation to map out existing systems-oriented work and thinking in the EA space. Our guiding questions for the investigation were: To what extent do organisations in or adjacent to the EA ecosystem already apply a systems lens to their work? What aspects of systemic thinking are applied more or less frequently?
Based on the understanding of “systemic change” outlined in post 2 and based on a quick consultation of literature relevant to the topic,[1] we designed a list of questions. These can be answered by looking at an organisation’s official website, though we recognize that this approach has clear limitations. We put together a first draft of that list by brainstorming questions that seemed relevant to the three characteristics of systemic change in our expanded definition:
For each dimension, we came up with 4-6 multiple-choice questions, plus one open-field question asking the respondent to give an overall assessment of the organisation’s profile with regard to the dimension in question. In addition, we had one single-choice and one open-field question on the overall systemic-change-orientation of each organisation.
Our questionnaire was developed in several iterations. It took 3 iterations to arrive at fair weightings and questions that were easy to interpret for the user. During this process, we asked 2 people external to our project for input and included their feedback in the revision process. The questionnaire we ended up using for our ratings can be found here.
We chose organisations to arrive at meaningful insights into the broader EA ecosystem. On top of effective altruist or effective altruism-aligned organisations, we also selected ones that are generally well-known in the cause areas we focus on. Hence, we relied on the selection of high-impact organisations that Effektiv Spenden included in their donation funds.[2] We focused on organisations working on (1) Global Health & Development; (2) Animal Welfare; and (3) Global Catastrophic Risk (16 organisations in total).
In addition to rating these organisations ourselves, we shared the questionnaire, together with a brief Explanation for Volunteer Raters in a few Slack channels and on the subreddit r\EffectiveAltruism. We asked volunteers to submit their own ratings. This was intended to increase the validity and reliability of our results. Averaging the ratings an organisation receives from different people helps counter individual biases any one person might bring to the questionnaire. We ended up with 74 ratings overall, and each organisation included in our final analysis had a total of 3-6 ratings.
Besides analysing organisations based on their website content, we sent out a separate questionnaire asking representatives from each organisation. We asked them to self-describe their systemic-change-orientation along the dimensions in our definition. This questionnaire only had some minor changes to the original one, to allow a comparison between responses to both. Seven organisations responded by filling in the questionnaire. Data from these self-reports will be analysed separately from the ratings we gave based on website content (see below).
Survey questions were categorised into three conceptual dimensions: Power Dynamics (PD), Systems Thinking & Risk Awareness (STRA), and Root Causes (RC). Question 17 was treated separately since it asked raters for an open-ended assessment of the organisation’s overall systemic-change-orientation. Since multiple raters evaluated each organisation, a mean score per question was calculated to reduce individual bias and stabilise the aggregated ratings. Organisations that received two or fewer ratings were excluded to improve reliability. This reduced the dataset from 21 to 16 organisations.
All quantitative responses were recorded on a 0-3 scale. Items originally on different ranges were standardised for comparability. In cases where respondents selected multiple answer options for a question, the recorded values (e.g., 2 and 3) were recoded to reflect endorsement of the highest applicable category (e.g., from 2 and 3 to 3). Missing data were left blank rather than replaced with zeros, so they were excluded from mean calculations and did not artificially inflate reliability estimates.
The two questionnaires, (externally rated and self-reported), used different response ranges: External raters worked on a 0-3 scale, while the self-report form used 0-2 plus an opt-out. To allow comparison, self-report responses were linearly rescaled to 0-3. This assumes respondents anchor to the endpoints of the scale presented to them, so that the top option represents the same underlying position on both forms. But this assumption is contestable. The verbal anchors for 0, 1 and 2 are broadly similar across the two questionnaires. If they are read as equivalent, the rescaling inflates self-report scores relative to external ratings. Under the rescaling we applied, self-reported scores exceed external ratings on all three dimensions. We report the rescaled version as our primary analysis while flagging that readers should treat the dimension-level self-report comparison as indicative only.
The data were analysed descriptively. We made no attempt at causal inference or statistical generalisations, since the main goal was to give an overview of the organisations included in the result, not to go beyond this. Section-level scores for PD, STRA, and RC were calculated as the average of items within each dimension (all on a 0-3 scale). An overall systemic score was then computed by summing all standardised item scores and dividing by 51, which served as the theoretical maximum. Because the RC dimension contained fewer items than PD and STRA, it contributed proportionally less to the total systemic score. Power BI was used to construct visualisations of total organisational scores, dimension-level averages, and comparisons across cause areas. This enabled clear and interpretable presentation of the results.
Reliability Analysis
The reliability of the survey was assessed using two approaches: inter-rater reliability and internal reliability.
Inter-rater reliability refers to how much different raters agree when evaluating the same responses. This was assessed using Krippendorff’s alpha, which is appropriate for multiple raters, ordinal response scales, and incomplete data. Twelve raters independently evaluated organisations on a 0–3 scale across 17 survey items. The ordinal specification was chosen to reflect the ordered nature of the response options without assuming equal distances between scale points. Reliability was calculated in JASP with 95% bootstrap confidence intervals (1,000 samples).
Internal reliability assesses how consistently items within a scale measure the same concept. This was assessed using Cronbach’s alpha, calculated for each dimension and overall, following standard interpretive benchmarks.
Both reliability analyses cover the external ratings only, as each organisation returned a single self-report and agreement cannot be computed from one rating. The self-report scores therefore carry no reliability evidence, which the comparison should be read against.
Results of Reliability Analysis
Inter-rater reliability was low. This suggests that raters often interpreted responses differently, possibly due to ambiguity in the coding criteria or uneven rater coverage. The results (where values closer to 1 indicate stronger agreement) were 0.27 for Power Dynamics, 0.27 for Systems Thinking and Risk Awareness, and 0.19 for Root Causes. The overall alpha was 0.30, indicating substantial disagreement between raters.
In contrast, internal reliability was strong. Scores (where values above around 0.7 are generally considered acceptable) ranged from 0.74 to 0.81 across the dimensions and reached 0.90 for the full survey. This suggests that although raters did not consistently agree with each other, the survey items themselves were reliably measuring the intended constructs.
Together, these findings suggest that while the survey is internally coherent, raters apply the criteria inconsistently. This might highlight the need for clearer guidance, improved calibration, or refined scoring rubrics. As part of the empirical investigation, we attempted to address these issues by providing clearer guidance and refining the scoring rubrics. Unfortunately, our adaptations of the questionnaire did not significantly improve inter-rater reliability between test runs. We return to this observation in the last post of the sequence, highlighting the need for critical and informed discussions about how systemic change is defined and operationalised.
Relative to our goal of producing an empirical overview of systemic change work conducted across the EA ecosystem, our findings have some severe limitations:
Due to the limitations of our data collection (see above), our results will only be interpreted in a descriptive fashion. With the current data, a full quantitative analysis would not be reliable and will not be pursued in this section: We do not derive generalisations beyond our sample of organisations, nor do we offer causal explanations for differences between organisations. The internal reliability of the survey is strong, implying that the survey itself is well constructed. But the reliability between raters is very low, indicating significant disagreement between raters (see more details in subsection Data preparation and analysis). You can find a full overview of the responses to our questionnaires in this document.
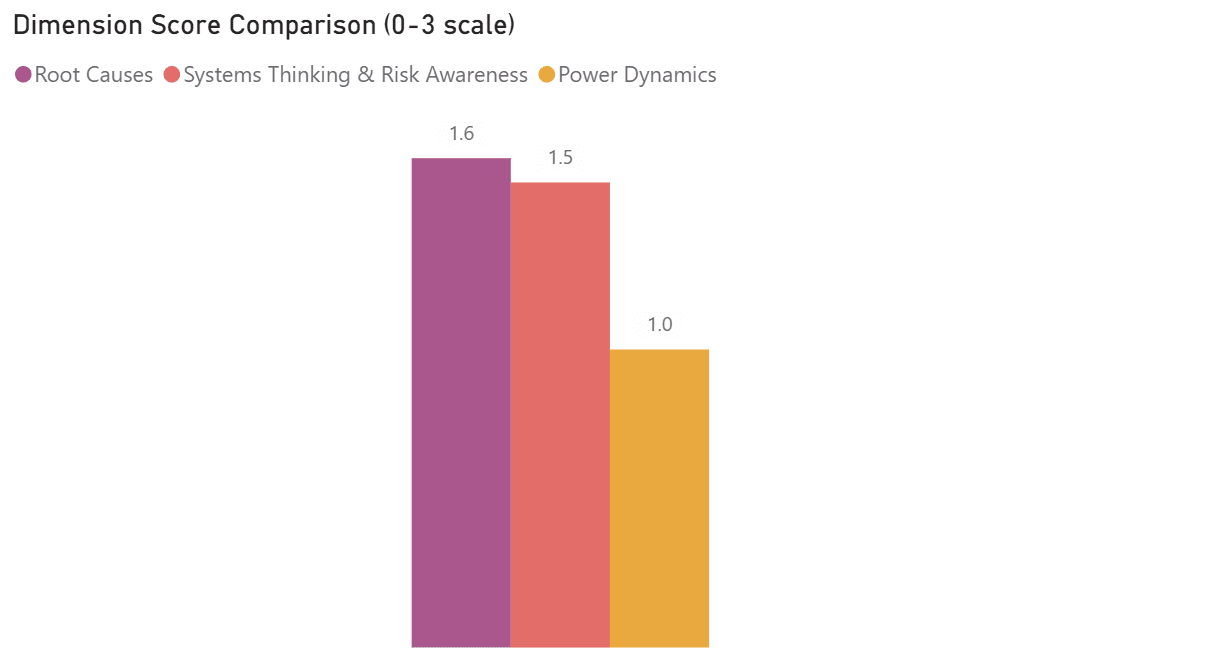
Overall the average rating for organisations for each question was 1.4[5] out of three. The survey was split into three dimensions: power dynamics (PD, average 0.97), systems thinking & risk awareness (STRA, average 1.51), and root causes (RC, average 1.59). Out of the three categories, root causes and systems thinking and risk awareness achieved similar average ratings. Ratings for power dynamics, however, are lower on average (see figure A).
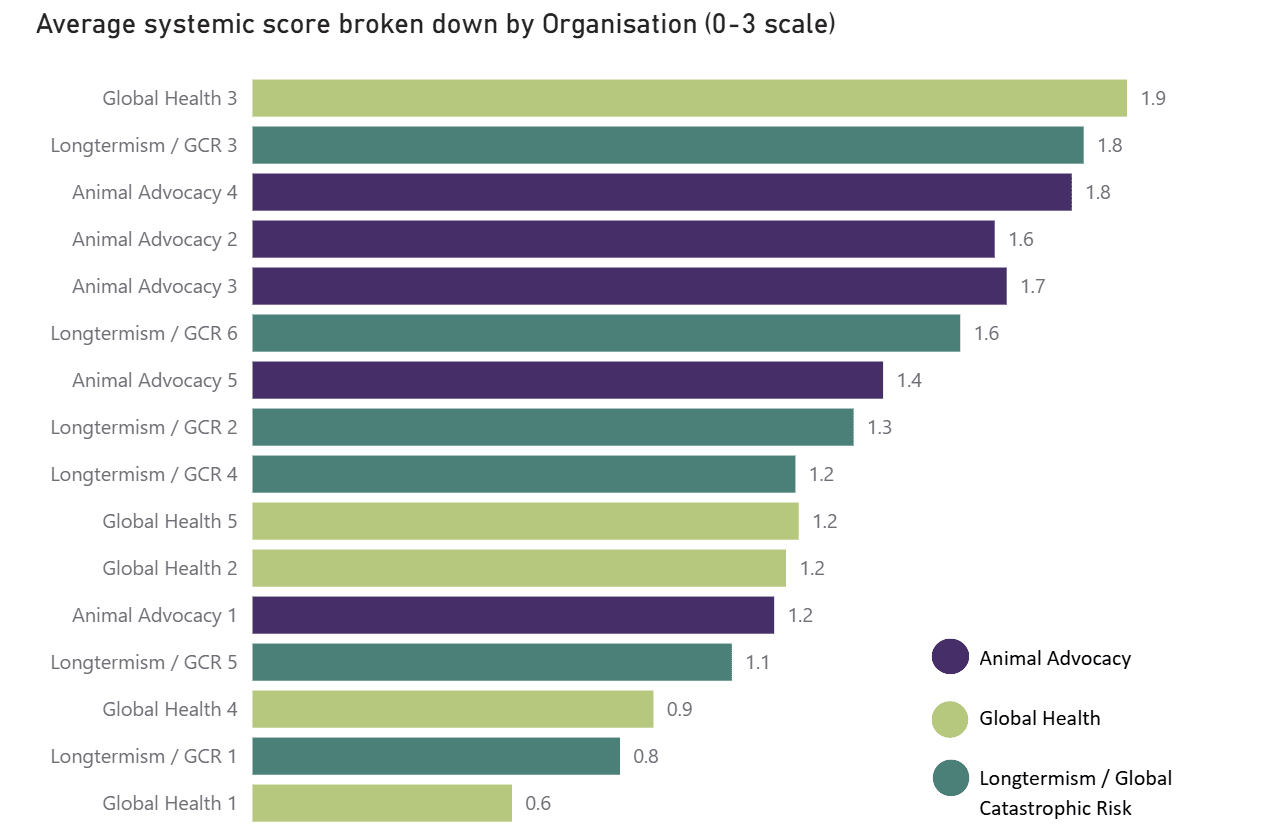
Of the 16 organisations evaluated by at least three raters, none scored higher than 1.93 out of maximum 3 (averaged across all questions). The organisations with the highest (1.93) and lowest (0.57) systemic scores both come from the Global Health & Development cause area, as seen in figure C. On average, Global Health & Development received the lowest average systemic score (mean 1.1), below Longtermism / Global Catastrophic Risk (1.3) and Animal Advocacy (1.5). That said, the ratings are spread widely within each cause area, making general claims of differences between them tricky. Some tendencies can be observed when looking at the different dimensions in isolation.
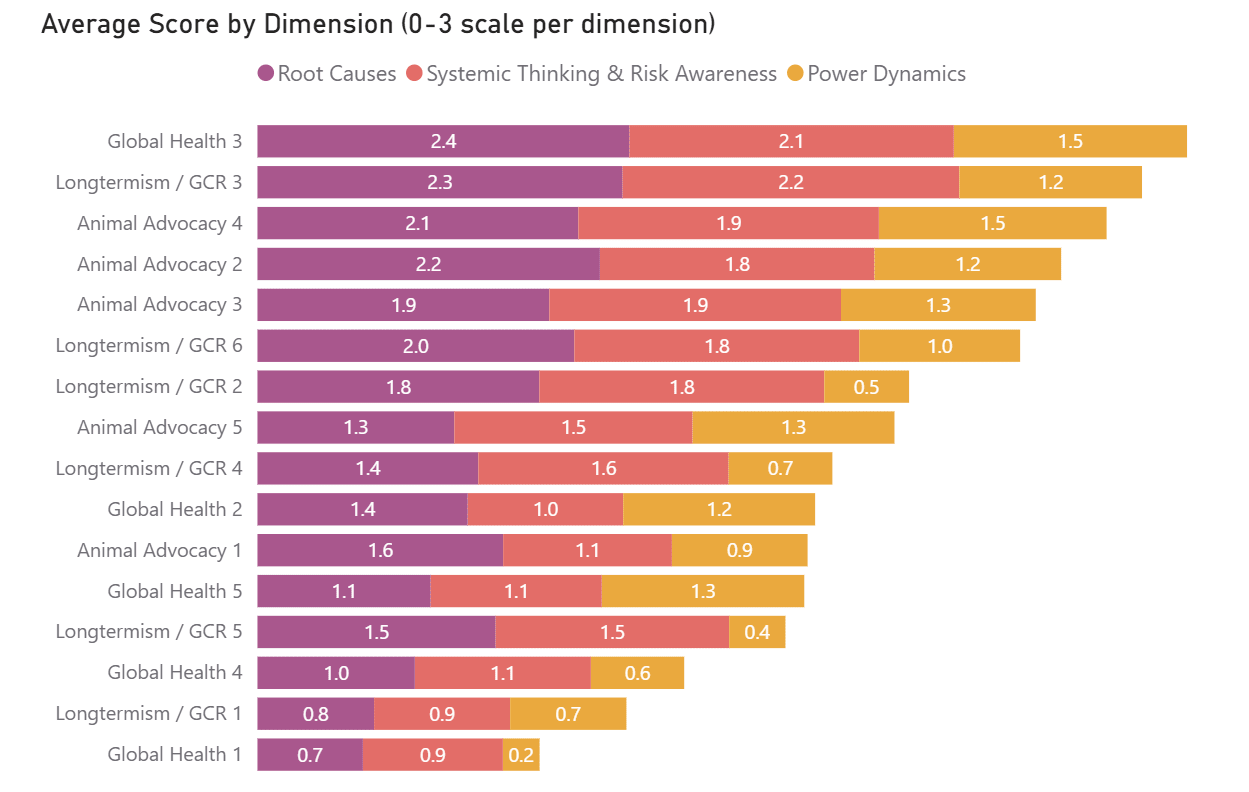
The different dimensions of our survey might hint at differences within and across cause areas. On some dimensions, there seem to be consistent tendencies within a cause area: Animal Advocacy organisations scored highly for power dynamics on average, while GCR organisations performed comparatively lower on this dimension. With one exception, all GHD organisations scored very low on the root causes dimension. At the same time, we also observe substantial heterogeneity within each cause area. One GHD organisation has the highest score out of all organisations on the power dynamics dimension. In contrast, another GHD organisation has the lowest score on that same dimension. The rest are somewhere in the middle. Heterogeneity within Animal Advocacy and GCR organisations is not quite that stark. But it is noticeable that organisations from these cause areas can be found near the top and near the bottom of the ranking for each dimension.
In short, animal welfare organisations appear to be somewhat more systemic on average, while GHD organisations appear to be somewhat less systemic. However, these patterns are not consistent enough for us to confidently interpret the analysis that way, given the high heterogeneity and small sample size.
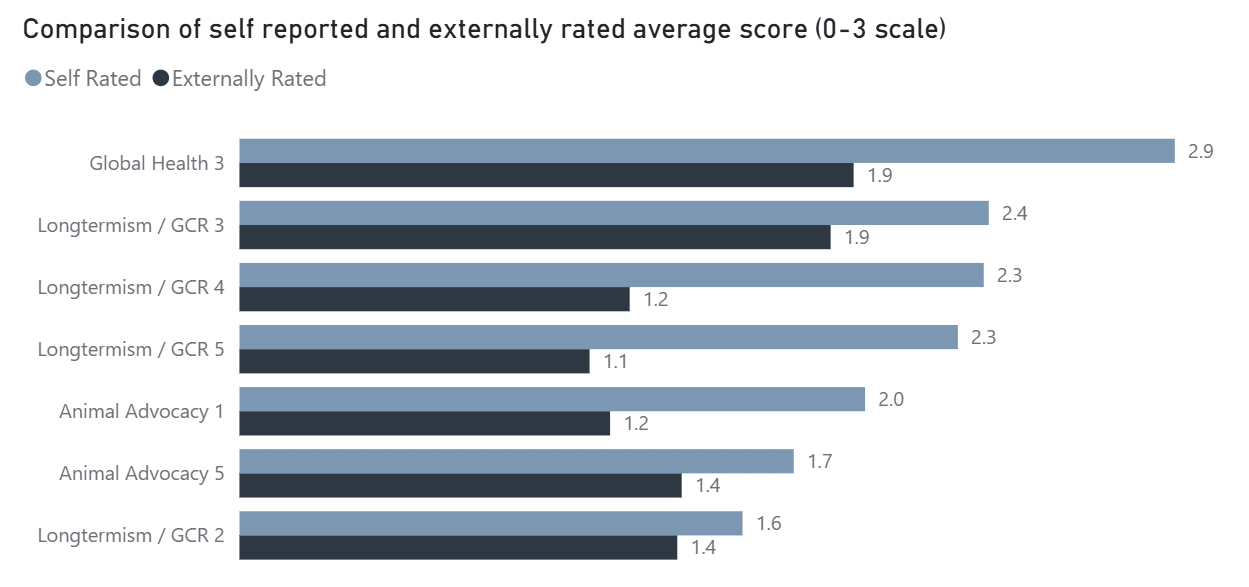
Overall, representatives of the organisations reported higher ratings than our independent evaluators, who relied on information available on websites. An average of 1.9 against 0.9 for Power Dynamics, 2.1 against 1.7 for Systems Thinking and Risk Awareness, and 2.6 against 1.8 for Root Causes, all on a 0-3 scale.[6] All seven organisations scored higher on self-report than on external rating across the dimensions overall. The large difference in most ratings might be caused by bias of employees towards their own organisation and work, or their access to non-public information. The independent evaluators were strongly limited in their research. As we previously elaborated, we assume that more in-depth analysis of the organisations might lead to different ratings. We only got responses from very few organisations, which needs to be taken into account when considering the reliability of the self-reporting data we collected.
In the next and last post of this sequence, we will pick up on the findings and limitations of our experimental investigation. We will outline open questions, remaining uncertainties and potential points of contention that we would love to see discussed across the EA community. To spur such discussion, we close the post with a defence of our vision of an effective altruism that is more oriented towards systemic change along the lines presented in post 2.
Micha Narberhaus, 2016, “What is Systemic Change?”, medium, https://medium.com/virtual-teams-for-systemic-change/what-is-systemic-change-f1ae8cdf2f2a; What is systems change?, Forum For the Future, https://www.forumforthefuture.org/faqs/what-is-system-change; Badgett, A. (2022). Systems Change: Making the Aspirational Actionable. Stanford Social Innovation Review. https://doi.org/10.48558/84HA-E065; Kreger, M., Brindis, C.D., Manuel, D.M. and Sassoubre, L. (2007), Lessons learned in systems change initiatives: benchmarks and indicators. American Journal of Community Psychology, 39: 301-320. https://doi.org/10.1007/s10464-007-9108-1; Hirsch, G.B., Levine, R. & Miller, R.L. Using system dynamics modeling to understand the impact of social change initiatives. Am J Community Psychol 39, 239–253 (2007). https://doi.org/10.1007/s10464-007-9114-3; Rachel Jetel, 2022, What Is Systems Change? 6 Questions, Answered, World Resources Institute, https://www.wri.org/insights/systems-change-how-to-top-6-questions-answered
Our selection is based on Effektiv Spenden’s donation page as of December 2024: https://effektiv-spenden.org/spenden-deutschland/ (scroll down and open the toggle “Select individual organisations”). We supplemented Effektiv Spenden’s list, which did not include many GCR-focused organisations at the time we checked in Dec 2024, with four additional orgs which we knew to be well known in the EA ecosystem.
We did not conduct a more in-depth analysis on how consistency differed between question/answer-sets. Looking at the data, it is not clear that only a few of the questions were controversial; instead, raters show disagreements across the board.
Our very limited data did show quite a high score for several animal advocacy organisations. As internet meme culture often refers to EA’s animal advocacy branch as “people advocating for shrimp welfare” due to the insistence on also avoiding non-mammalian animal suffering, we thought the joking headline was light-heartedly appropriate, even though it is overly simplistic.
We realise that the rating scale being ordinal, equal steps between points can’t be assumed and reporting means isn’t strictly appropriate. We decided to use means for readability and cross-organisation comparison, but want to note the scores should be read as a rough ordering only.
Self-report responses were linearly rescaled from 0-2 to 0-3 for comparability; see the data preparation and analysis section for details on assumptions made.