Figure 3 is somewhat concerning - if I squint I can sort of see some vague agreement between the different sources, but it's pretty all over the place. Do you have a sense of whether this is an area where funding additional field research would be a good idea, or do you think this is lower-priority than other potential research questions related to shrimp welfare?
I personally would not make mortality the focus of the marginal research project, but I do think you would get it 'for free' in the sort of project I would prioritize. In my view, the main considerations are:
1. A lot of uncertainty is an artifact of inconsistent reporting practices. An article arguing for a standardized methodology in an aquaculture magazine signed by a bunch of prestigious researchers (or a presentation at an aquaculture industry event) might do more to reduce uncertainty than more data per se.
2. A lot of the basic trends are robust to the uncertainty. Cumulative mortality is probably around ~50% even in ideal circumstances, more intensive farms have less mortality, larval mortality is steeper than juvenile mortality, and wild shrimp have higher mortality rates than farmed shrimp.
3. Hannah's upcoming report, a Monte Carlo model of which welfare issues cause the most harm in aggregate while shrimp are still alive, contains enormous uncertainty due to limitations in the surveys of farms that have been conducted. As a result, the rank-order of the badness of many issues is not robust, an issue that new, higher-quality data could address. Improved surveys would presumably also measure survival, so we would gain clarity on premature mortality even though it was not the main focus.
4. It would probably be at least as valuable to get larval mortality estimates for the farmed fish species to which we compared farmed shrimp in Figure 4.
Executive summary: Pre-slaughter mortality rates of farmed shrimp are high, with around 53% dying before slaughter age, but it is unclear if reducing this mortality should be a key focus for improving shrimp welfare.
Key points:
Survival curve modeling and literature review suggest over 50% of farmed shrimp die before slaughter, with most deaths in the larval stage.
Mortality rates are higher for Macrobrachium rosenbergii and Penaeus monodon compared to Penaeus vannamei.
Shrimp mortality rates are high compared to broiler chickens but in the middle of the range for other farmed aquatic animals.
Causes of mortality likely include sensitivity to environmental conditions in early life stages, transportation, disease, and possibly artificial selection for growth over survival.
Reducing mortality may not improve aggregate welfare if surviving shrimp still suffer, and could lead to industry growth. More research on shrimp sentience development is needed.
Advocates should focus on improving ongrowing stage conditions rather than explicitly aiming to reduce mortality, especially in the larval stage.
This comment was auto-generated by the EA Forum Team. Feel free to point out issues with this summary by replying to the comment, andcontact us if you have feedback.
Pre-slaughter mortality of farmed shrimp — EA Forum
Mortality rates are high in shrimp aquaculture, implying welfare threats are common.
It is typical for ~50% of shrimp to die before reaching slaughter age.
This equates to around 1.2 billion premature deaths a day on average.
Mortality varies among species; prioritizing interventions should take this into account.
Because of high pre-slaughter mortality (~81%), Macrobrachium shrimp represent a larger share of farmed shrimp than slaughtered shrimp.
Most individual deaths are P. vannamei, despite having the lowest mortality rate.
More larvae die than any other life stage, but this does not necessarily mean efforts should focus on them.
Uncertainty remains about whether larval shrimp are sentient—they are planktonic, so do not make autonomous decisions.
Minimizing larval deaths could cause compensatory deaths in later life stages (e.g., ensuring weaker larvae survive, who then die from later harsh conditions).
Interventions should likely concentrate on the ongrowing stage (postlarval and juvenile–subadult shrimp), where there are still tens of billions of deaths.
There are several causes of mortality and differences between farm types.
Most causes are likely a combination of intrinsic shrimp traits (e.g., young shrimp are sensitive to environmental fluctuations), farming practices, and diseases.
Disease is a main cause throughout life, but it is often a downstream effect of issues that farmers have some control over (e.g., poor water quality).
Variation among reported figures, especially that more intensive farms have fewer deaths, suggests many factors are at play and that some are controllable.
The effects of reducing early mortality on industry trajectory are uncertain.
The number of shrimp born may decrease if farmers must produce fixed output. But shrimp would live longer, increasing the chances for negative experiences.
However, consumer demand has historically outstripped supply, so the industry may grow if it had better control of conditions causing mortality.
If reduced deaths come from intensification of practices, more shrimp may be reared in conditions that can harm welfare (e.g., high stocking densities).
Pre-slaughter mortality cannot depict total welfare because it misses nonfatal effects.
Mortality is only a lower-bound proxy of how many shrimp suffer negative welfare.
Premature mortality is more appropriate as one indicator among many that a welfare reform was successful, rather than an end in itself.
Pre-slaughter mortality data is limited and non-uniform.
Reports should clarify whether mass die-off events were excluded from mortality estimates and if rates are based on intuition from experience or empirical studies.
Box 1: Shrimp aquaculture terminology
The terms ‘shrimp’ and ‘prawn’ are often used interchangeably. The two terms do not reliably track any phylogenetic differences between species. Here, we use only the term “shrimp”, covering both shrimp and prawns. Note that members of the family Artemiidae are commonly referred to as "brine shrimp" but are not decapods and so are beyond the present scope.
We opt for the use of Penaues vannamei over Litopenaeus vannamei (to which this species is often referred), due to recognition of the former but not the latter nomenclature by ITIS, WorMS, and the Food and Agriculture Organization of the United Nations (FAO) ASFIS List of Species for Fishery Statistics Purposes.
The shrimp farming industry uses many terms usually associated with agriculture—for example, ‘crops’ for a group of shrimp reared together, ‘seed’ for the first shrimp stocked into a pond, and ‘harvest’ for collecting and slaughtering shrimp. For clarity, we broadly conform to this terminology. Although we acknowledge animal welfare advocates may prefer terminology that does not euphemize or sanitize the experience of farmed shrimp, here we favor ensuring readability for a wide audience.
Introduction
This is the third report in Rethink Priorities’ Shrimp Welfare Sequence, a series that addresses whether and how to best protect the welfare of shrimp. After outlining the welfare threats farmed shrimp may face in the second report, we now investigate the effect of these welfare threats on pre-slaughter mortality.
In the first report in the Shrimp Welfare Sequence, Waldhorn and Autric (2023) found that the number of shrimp alive at any time is much greater than one would expect based on the number of shrimp slaughtered per year and the length of the production cycle alone. While it was not a focus of the report, they mention that pre-slaughter mortality accounts for the discrepancy. Additionally, during the research for the second report in the sequence, we learned that welfare threats, like diseases or poor water quality, could lead to high mortality (e.g., Dayalan et al., 2022; McGraw et al., 2001; Stentiford et al., 2012). Testimony from a founder of a super-intensive[1] shrimp farm suggests that high mortality rates are characteristic of shrimp farming:
“In fish farming if you have mortality rates above 10 percent you are a bad farmer, but in shrimp if you have mortality rates below 50 percent you are doing well.”
The percentage of shrimp that die before slaughter may be a helpful indicator of the prevalence of significant welfare problems, although it represents a lower-bound estimate that does not account for sublethal issues. Pre-slaughter mortality rates may also offer insights into which species and life stages advocacy efforts should focus on. Furthermore, since dead shrimp no longer experience negative conditions, estimates of the prevalence of negative experiences must consider how long shrimp live on farms.
In this report, we aim to quantitatively examine how high shrimp pre-slaughter mortality is, whether it is particularly high for some life stages or species, how high it is relative to other farmed taxa, and explore possible causes. We consult and consolidate information from multiple sources, including academic and gray literature and industry sources. We focus on the three most farmed species: Penaeus vannamei, Penaeus monodon, and Macrobrachium rosenbergii (see Box 2 for an overview of these species).
Box 2: Background on shrimp farming
P. vannamei and P. monodon are marine shrimp from the taxonomic family Penaeidae (suborder Dendrobranchiata). M. rosenbergii is a freshwater species from the family Palaemonidae (infraorder Caridea, suborder Pleocyemata).
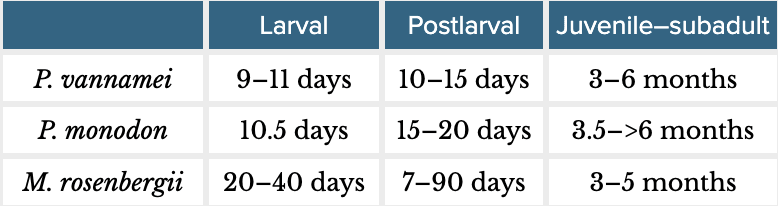
Farmed shrimp have three broad life stages: larval, postlarval, and juvenile–subadult. Farmers harvest shrimp before they are reproductively mature. The table below shows rough life stage lengths (based on FAO, 2009; FAO, 2023, and Wickins & Lee, 2002, pp. 85–86):
Farmed shrimp are stocked typically as postlarvae into ‘ongrowing’ ponds, where they spend most of their farmed life. Ongrowing farms are often characterized as extensive, semi-intensive, intensive, and super-intensive. These differ in a few main ways (for a more comprehensive overview, see Table 1 in our previous report):
Ponds: Extensive and semi-intensive ponds are usually outdoors, earthen ponds with water taken from a local natural source, sometimes they treat water. Intensive and super-intensive farms have ponds, tanks, or raceways lined with plastic or concrete, possibly indoors, and use separate water treatment ponds.
Water quality: More intensive farms have more tools to monitor and control water quality. Super-intensive and intensive farms aerate water frequently or continuously. Semi-intensive farms may use paddlewheel aerators when pond oxygen is low. Extensive farms do not control their water quality.
Stocking density: The more intensive a farm is, the higher the stocking density. This ranges from around <5–20 postlarvae/m2 in extensive farms to 130–>300 postlarvae/m2 in super-intensive farms.
Feed: Super-intensive and intensive farms rely on artificial shrimp feed, while extensive farms do not use feed, but they may fertilize the ponds to increase naturally produced food. Semi-intensive farms use a mixture of these strategies.
Yields: Super-intensive farms produce many more shrimp per meter squared than extensive farms and output two to three crops per year, while extensive farms produce only one.
Estimating farmed shrimp pre-slaughter mortality
Survival curves model
As an initial attempt to assess pre-slaughter mortality in farmed shrimp, we looked at data estimated in the Guesstimate model—a Monte Carlo model—presented in the first report of the Shrimp Welfare Sequence (Waldhorn & Autric, 2023). According to this model, approximately 930 billion shrimp (95% credible intervals: 630 billion–1.4 trillion) perish on farms annually, with roughly 440 billion shrimp (300–620 billion) slaughtered annually. These figures indicate that approximately 53% of shrimp die before reaching slaughter age. Is this mortality evenly distributed across the shrimp life cycle or among different farmed shrimp species?
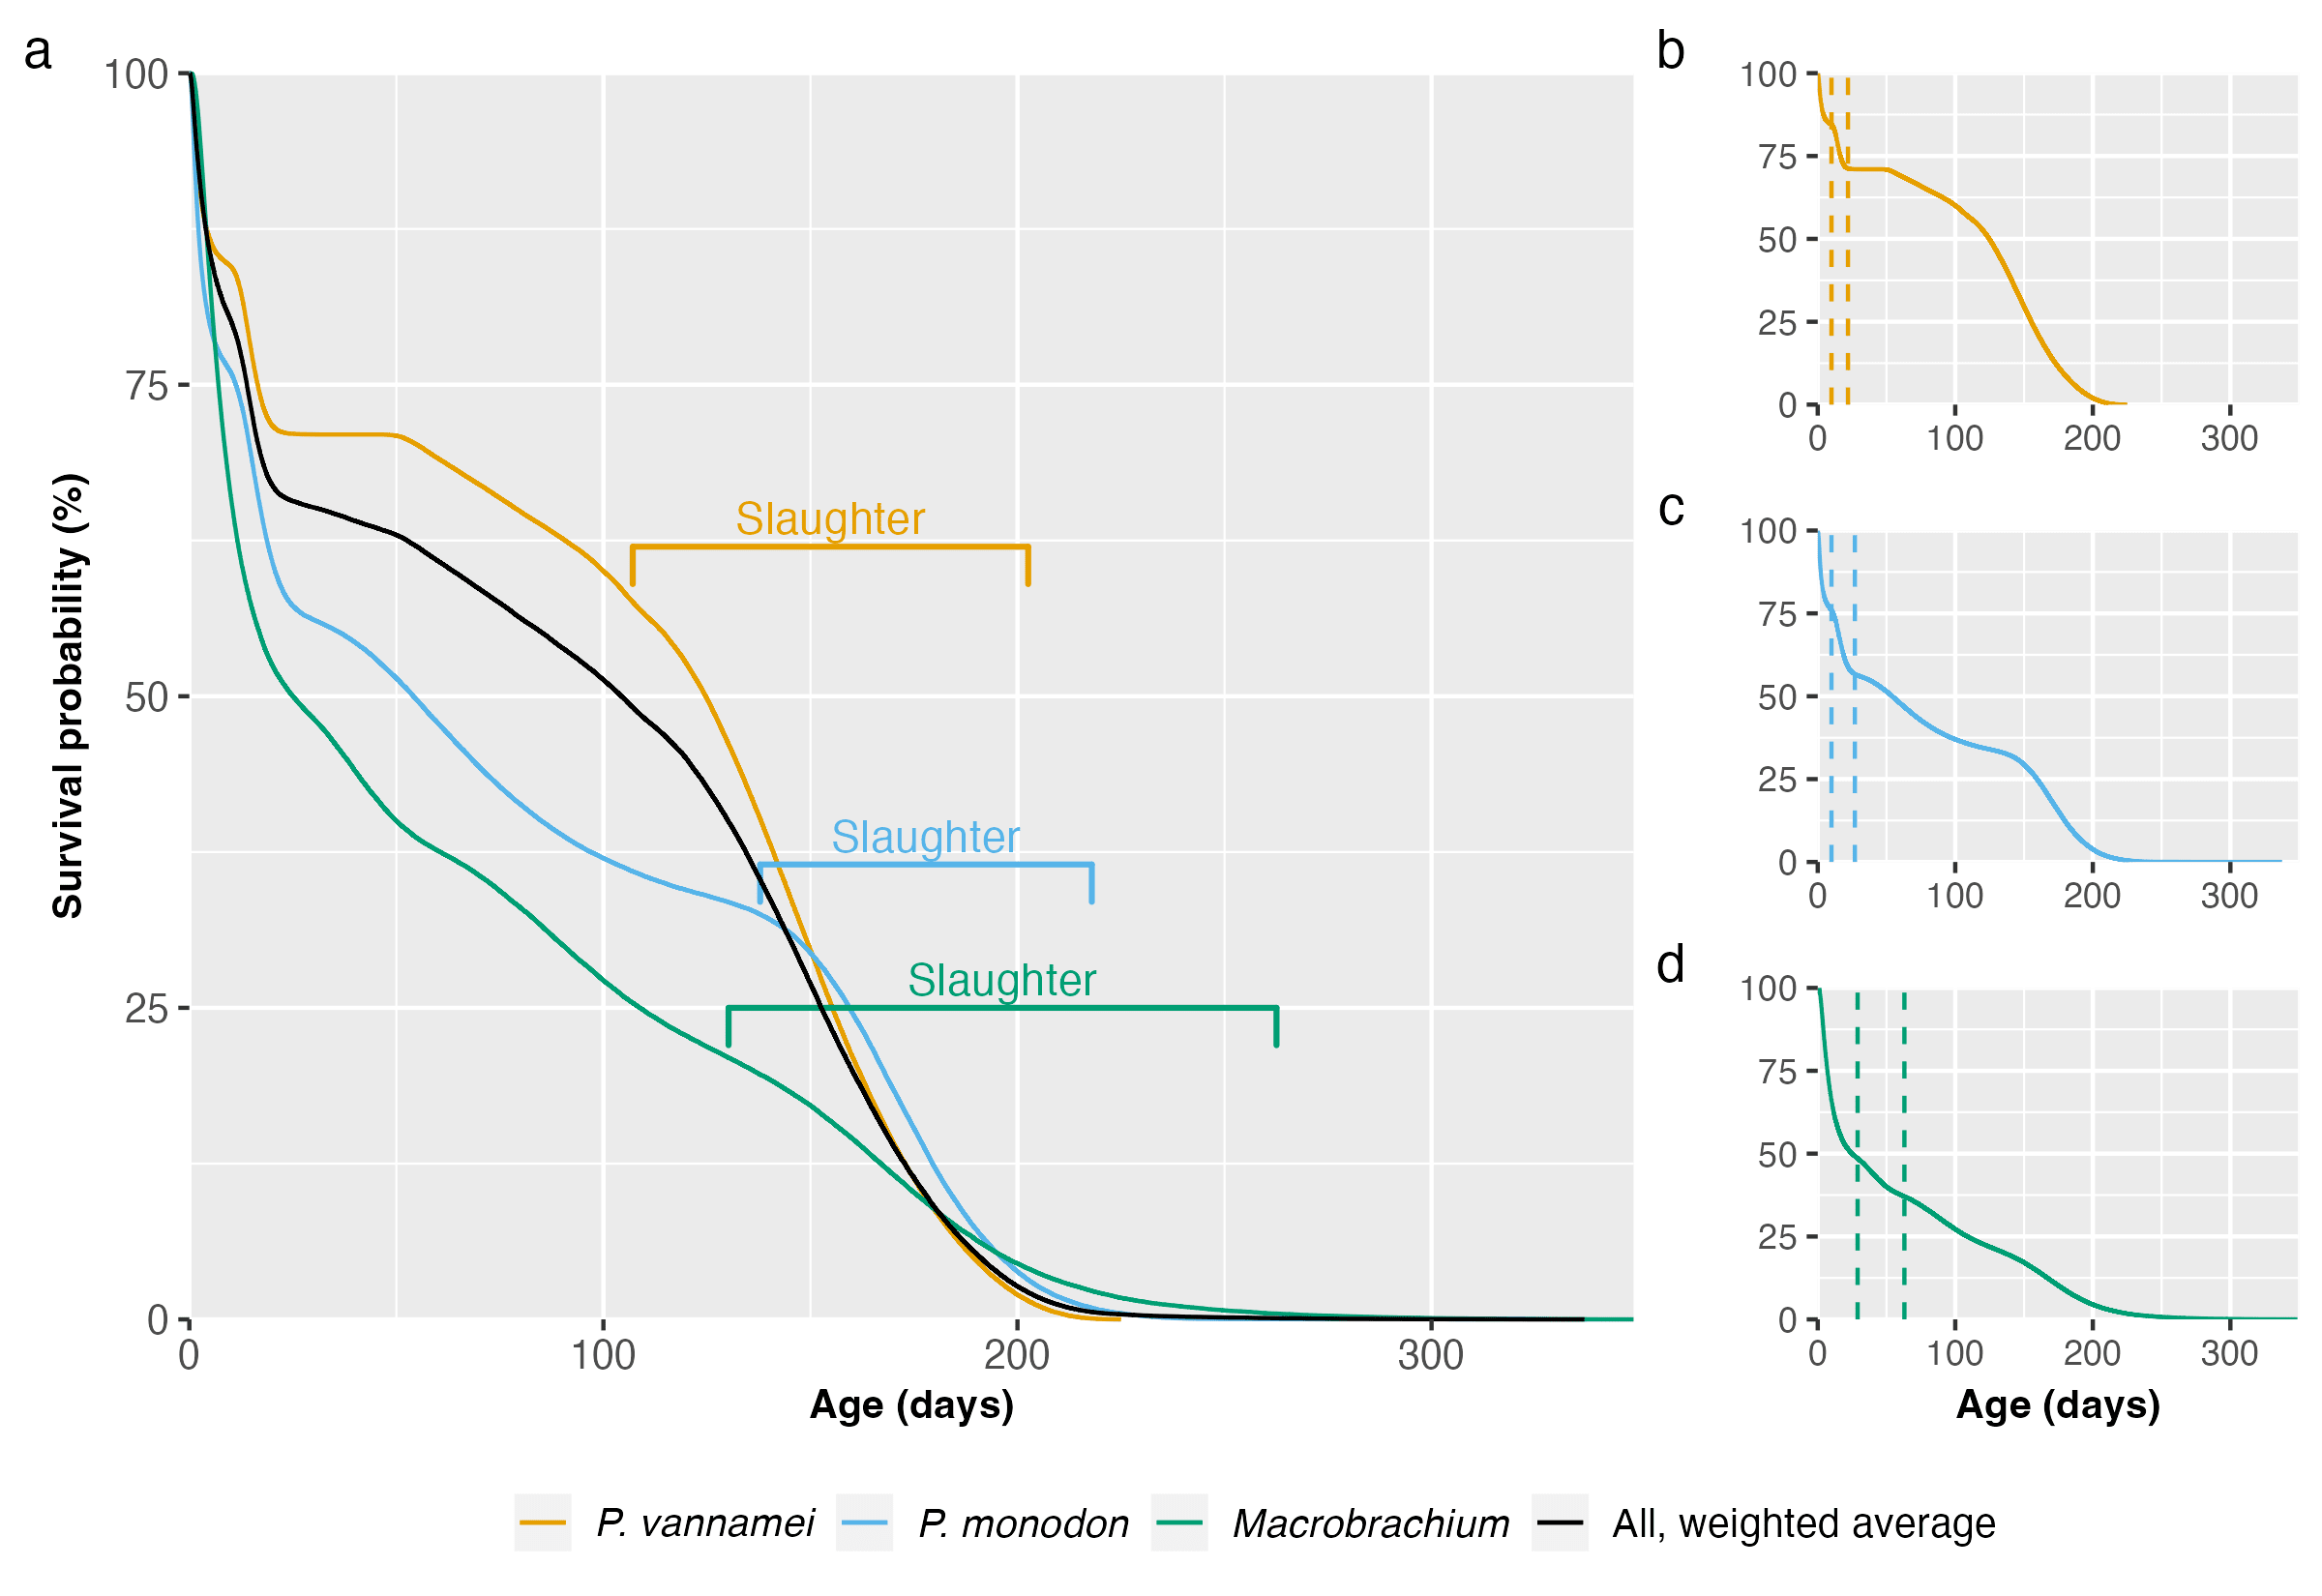
To answer this question, we built survival curves using the data from the Guesstimate model. Note that M. rosenbergii and Macrobrachium nipponense were grouped together in the original model, so we keep them modeled together here, labeled under their genus. We modeled the mortality of each taxon and the weighted average (Figure 1). For more information on the method used, see our Methods document.
Figure 1: Survival curves using Kaplan–Meier estimation and based on data from Waldhorn & Autric (2023) for (a) P. vannamei, P. monodon, and Macrobrachium, with weighted average, (b-d) each taxon individually, with dotted lines representing the end of the larval and postlarval stages. Slaughter ranges equate to our 95% credible intervals for total farmed days for each species. For more information, see the Methods document.
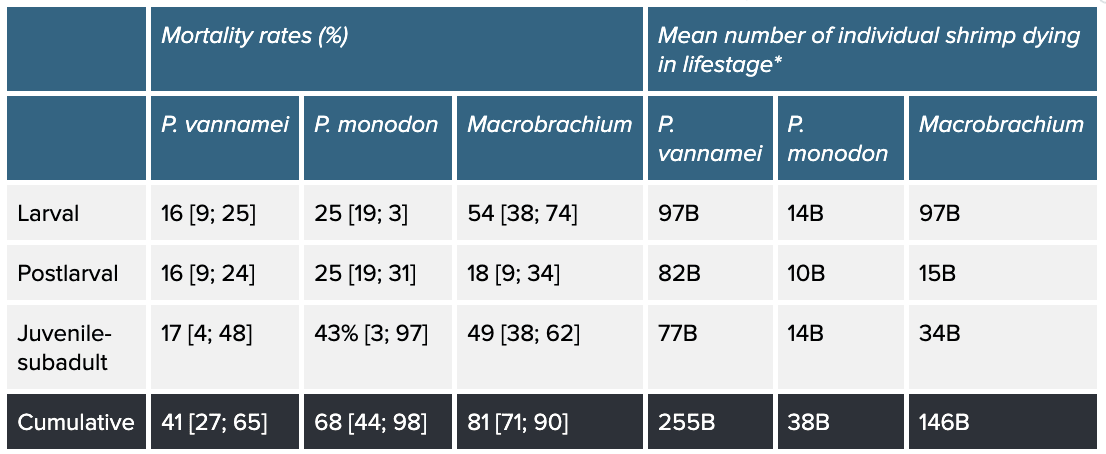
Different farmers harvest their shrimp at different times, so we present rough slaughter ranges in Figure 1 for each species, representing our 95% credible slaughter age intervals calculated in our data analysis. The larval and postlarval stages show the sharpest decline in survival probability. Across taxa, most deaths are in the larval stages (Table 1). In total, according to the survival curves model, around 439 billion shrimp die prematurely each year. Averaging over the year, that means 1.2 billion shrimp die from factors other than slaughter every day. Including slaughter (440 billion per year), 2.4 billion shrimp die each day on average.
Table 1: Stage-specific and cumulative mean mortality rates of P. vannamei, P. monodon, and Macrobrachium and number of individuals that die. Stage-specific mortality rates and individuals consider how many shrimp begin a life stage and die within it. Cumulative mortality refers to the rate and individuals across the whole production cycle. Percentages in square brackets are our 95% credible intervals. Based on our survival curves model, see the method here.
* B = billion
Mortality rates do not appear to be uniform across species: our model suggests the mean probability of surviving to slaughter age is 0.59 for P. vannamei [95% credible intervals: 0.35; 0.73], 0.32 [0.02; 0.56] for P. monodon, and 0.19 [0.10; 0.29] for Macrobrachium, which may provide insight into why P. vannamei is the most farmed shrimp species. However, the huge scale of P. vannamei farming means that it is responsible for more premature deaths than aquaculture of the other two taxa, despite having the lowest cumulative mortality rate.
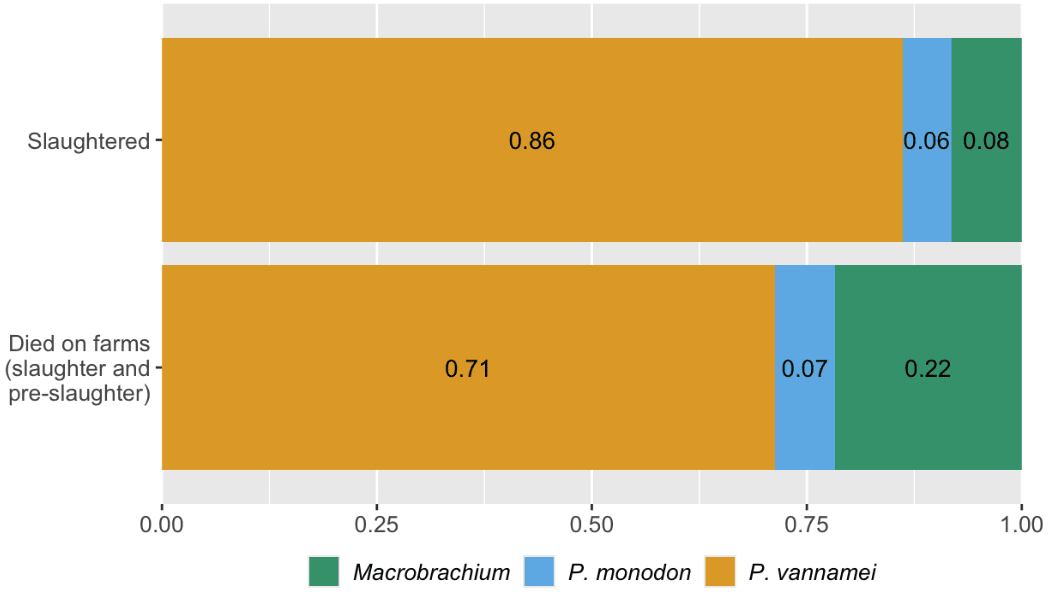
Macrobrachium shrimp represent a larger proportion of the total number of farmed shrimp than if you only consider proportions of slaughtered individuals from each species (Figure 2): Macrobrachium are around 22% of shrimp that die on farms but are only 8% of those killed for food. Macrobrachium are freshwater, Caridean shrimp (suborder Pleocyemata, see Box 2), while P. vannamei and P. monodon are penaeid shrimp (suborder Dendrobranchiata), so phylogeny and farming practices differ (see Causes section). Therefore, improving the welfare of farmed Macrobrachium shrimp may deserve more attention than would be apparent if focusing only on slaughter numbers—not only are there more individuals than it initially appears, but they may also experience worse conditions, as indicated by high mortality.
Figure 2: Proportion of shrimp by species that were slaughtered in 2020 and that died on farms in 2020. Based on estimations from our survival curves model (using data from Waldhorn & Autric, 2023). Note that Macrobrachium covers both M. rosenbergii and M. nipponese. See the Methods document here.
Quantitative literature analysis
The survival curves model primarily relies on the research of Wickins and Lee (2002, Chapter 4) and some FAO sources. Recognizing the potential bias of relying on older sources that may be based on specific farm types or regions, we sought to validate these findings through a more thorough review of both industry and academic literature. This validation process, summarized here, proved challenging because authors often did not clarify what reported survival ranges represented.
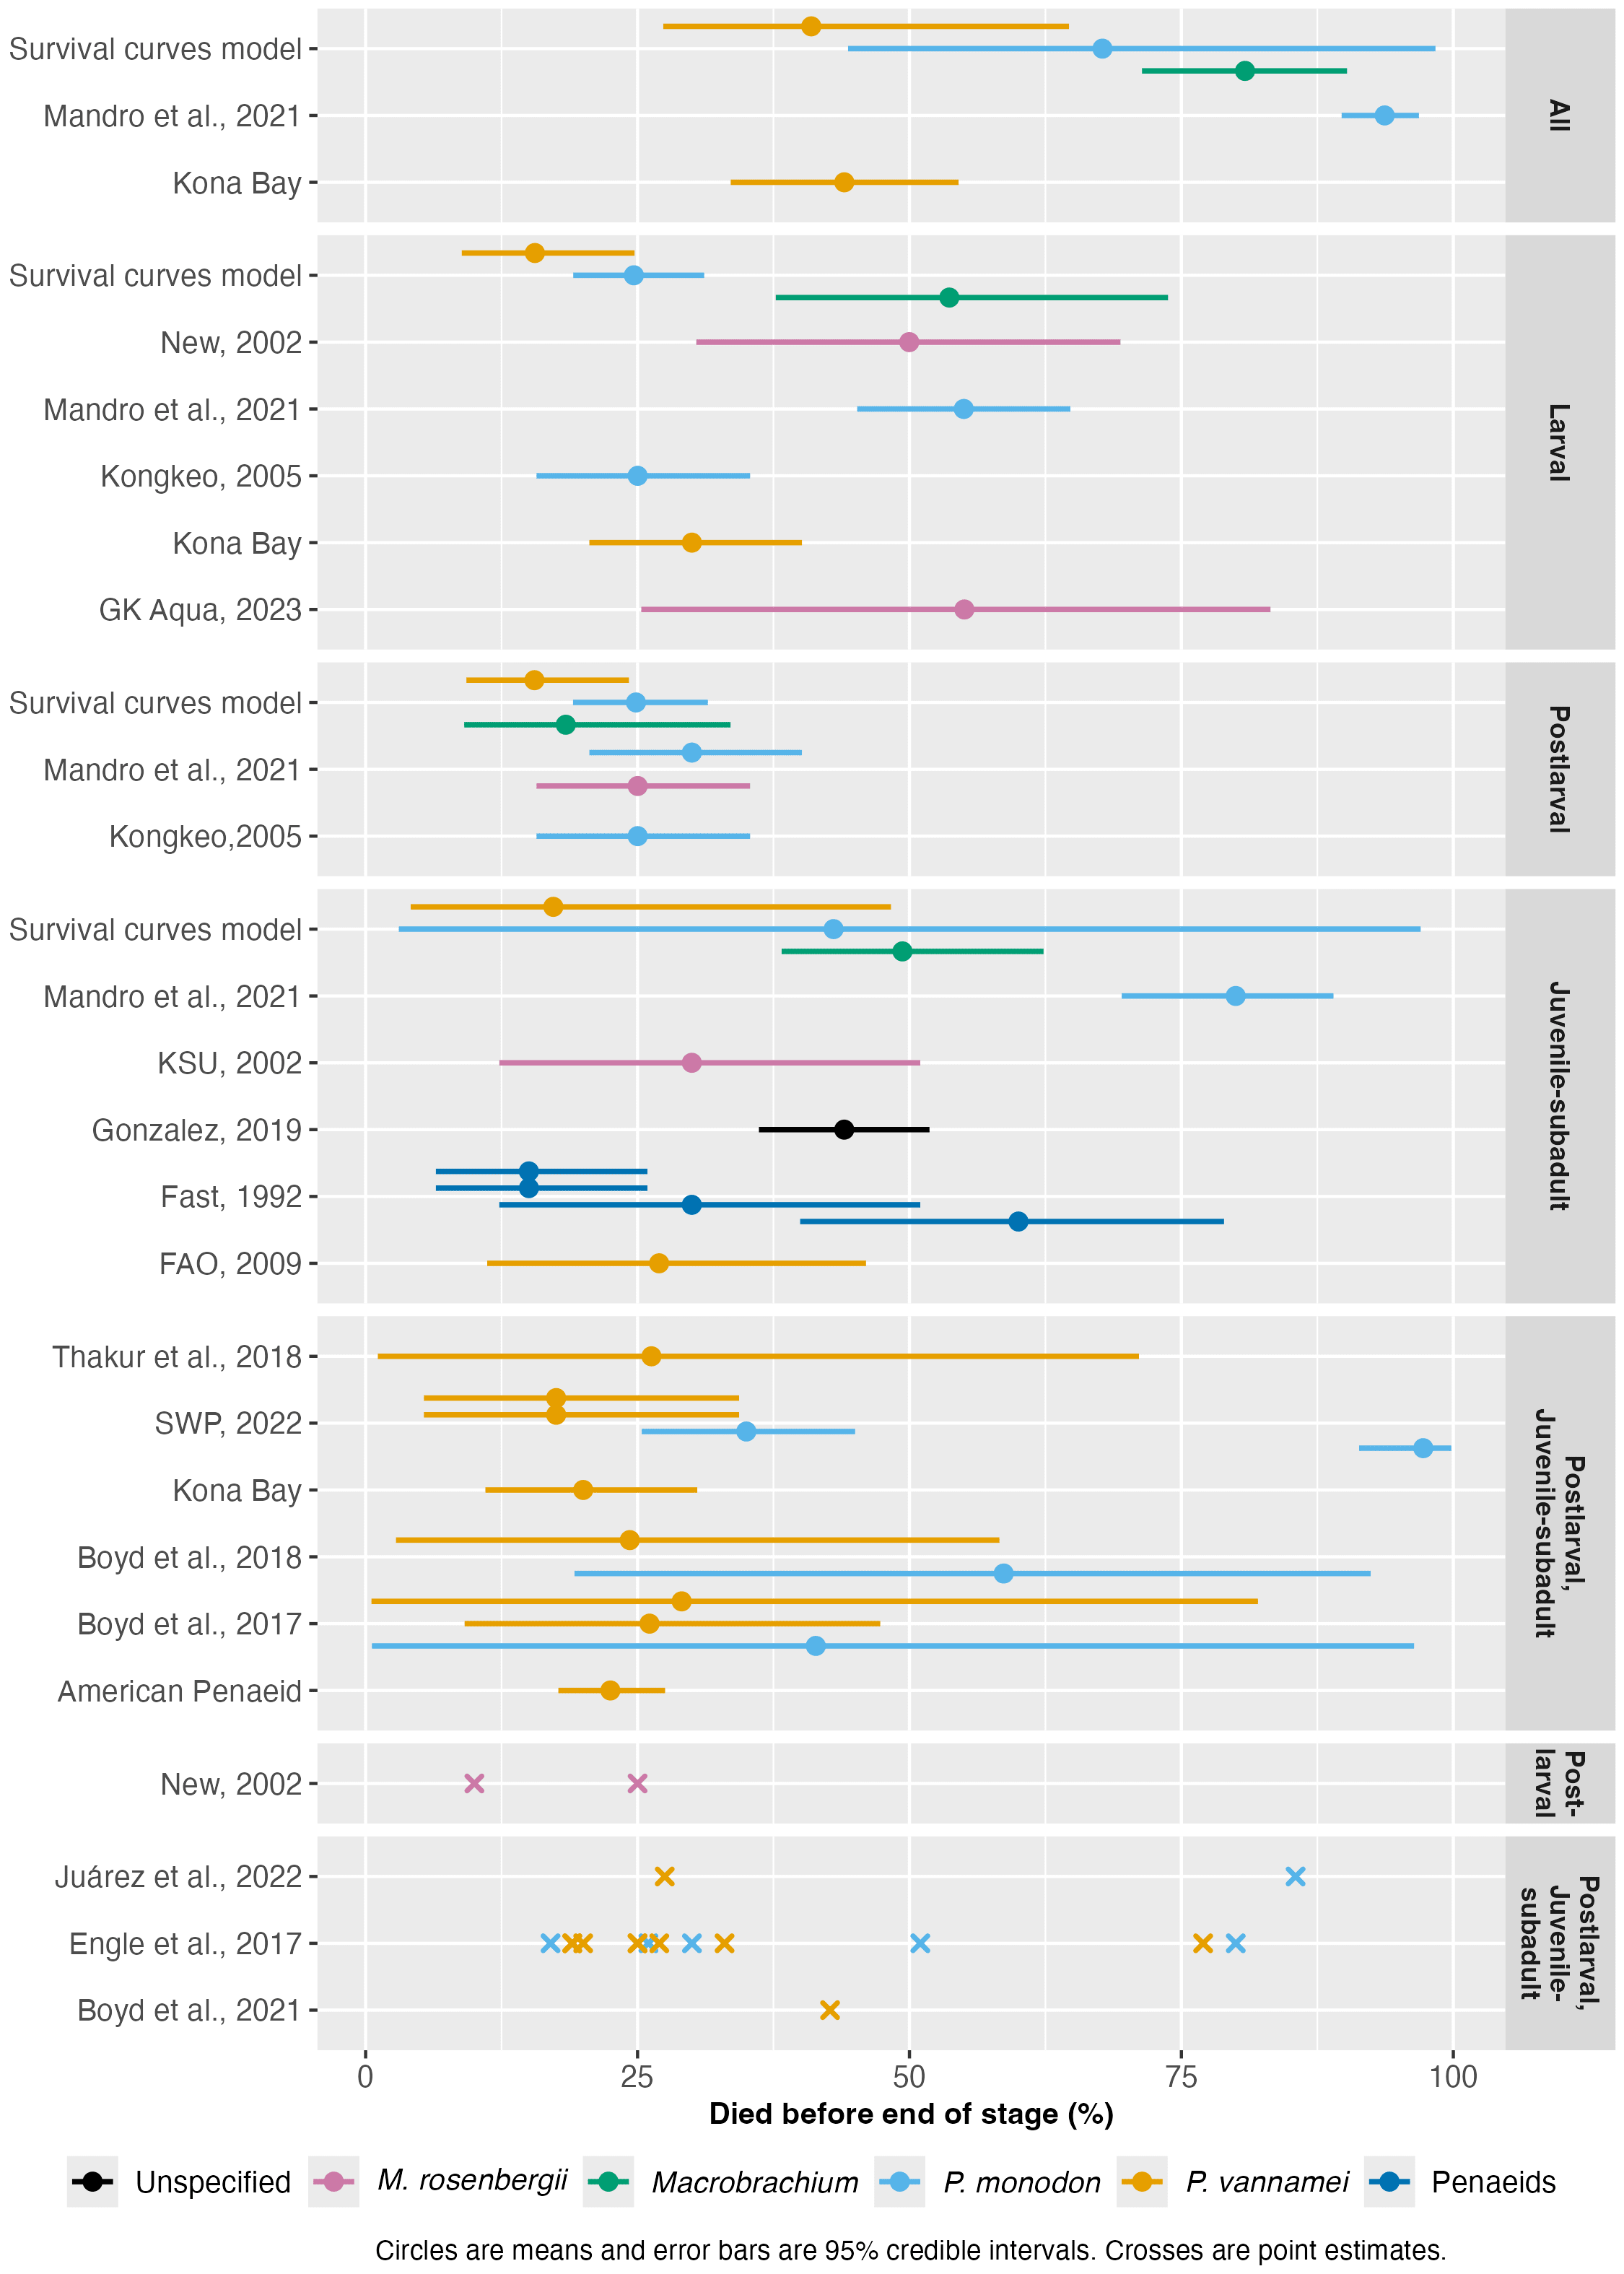
Consequently, the mortality rates depicted in Figure 3 are not derived directly from raw data but instead show our 95% credible intervals based on our interpretation of the reported ranges.
Figure 3: Shrimp pre-slaughter mortality rates reported by the literature. See the full method here. Stages labeled 'All' are cumulative rates across the entire life cycle. Others not labeled 'All' report stage-specific mortality rates. 'Penaeids' refers to data reported for penaeids generally.
Average mortality rates appear broadly consistent with the survival curves model, showing that half of individuals can die prior to slaughter. M. rosenbergii and P. monodon exhibit notably higher mortality compared to other species.
Including data from broodstock suppliers, which likely represent the forefront of shrimp aquaculture, provides a lower-bound estimate for mortality rates the industry can currently achieve. For example, Kona Bay claims that just over half of broodstocks' offspring survive.
No one estimate is representative of all farms, as there is considerable variability between estimates and wide ranges within each. If mortality rates differ substantially among farms or regions, several potentially adjustable factors may influence them. Some discrepancies among sources also likely stem from differences in data reporting methods, species examined, farm intensity, and when data were collected.
Cross-species comparison
Pre-slaughter mortality seems high in shrimp, but is this unusual or unexpected? Perhaps this is not unique to shrimp farming and is typical of aquaculture? Understanding the causes of premature mortality is essential to alleviating the suffering associated with dying. However, this is a difficult feat—farmers and researchers usually report mortality rates as an indicator of production efficiency and costs, rarely directly linking shrimp deaths to specific conditions. An alternative approach is comparing shrimp with other farmed species, especially other invertebrates or aquatic animals. If mortality rates on shrimp farms are high relative to other farmed taxa, it might indicate that some characteristic of shrimp or shrimp farming practices is the root of the issue.
We compared farmed shrimp mortality (taken from the survival curves model) with that of broiler chickens, aquatic vertebrates (carnivorous fish)[3], and other invertebrate groups, including insects and non-shrimp crustaceans[4]. We examined mortality patterns in relation to farmed lifespan (average slaughter age) and body size to see if the production cycle speed or end weight is related to premature mortality.
We collected insect data from Rowe (2020) and information for chickens and non-shrimp crustaceans from various sources (see Methods document). Farmed carnivorous fish mortality data came from Welfare Footprint’s Welfare of Farmed Fish analysis. We used their reporting approach, giving our 90% credible intervals and the midpoint thereof (Figure 4). See the Methods document for a complete description.
Cross-species comparisons are challenging because of variations in measurement methods and life stage coverage among studies. Additionally, our analysis was completed in a short timeframe (around 30 hours), so we may not have found all reports or the highest quality sources. Crucially, the carnivorous fish data did not cover larval mortality (Welfare Footprint), so fish mortality is likely higher than we reported.
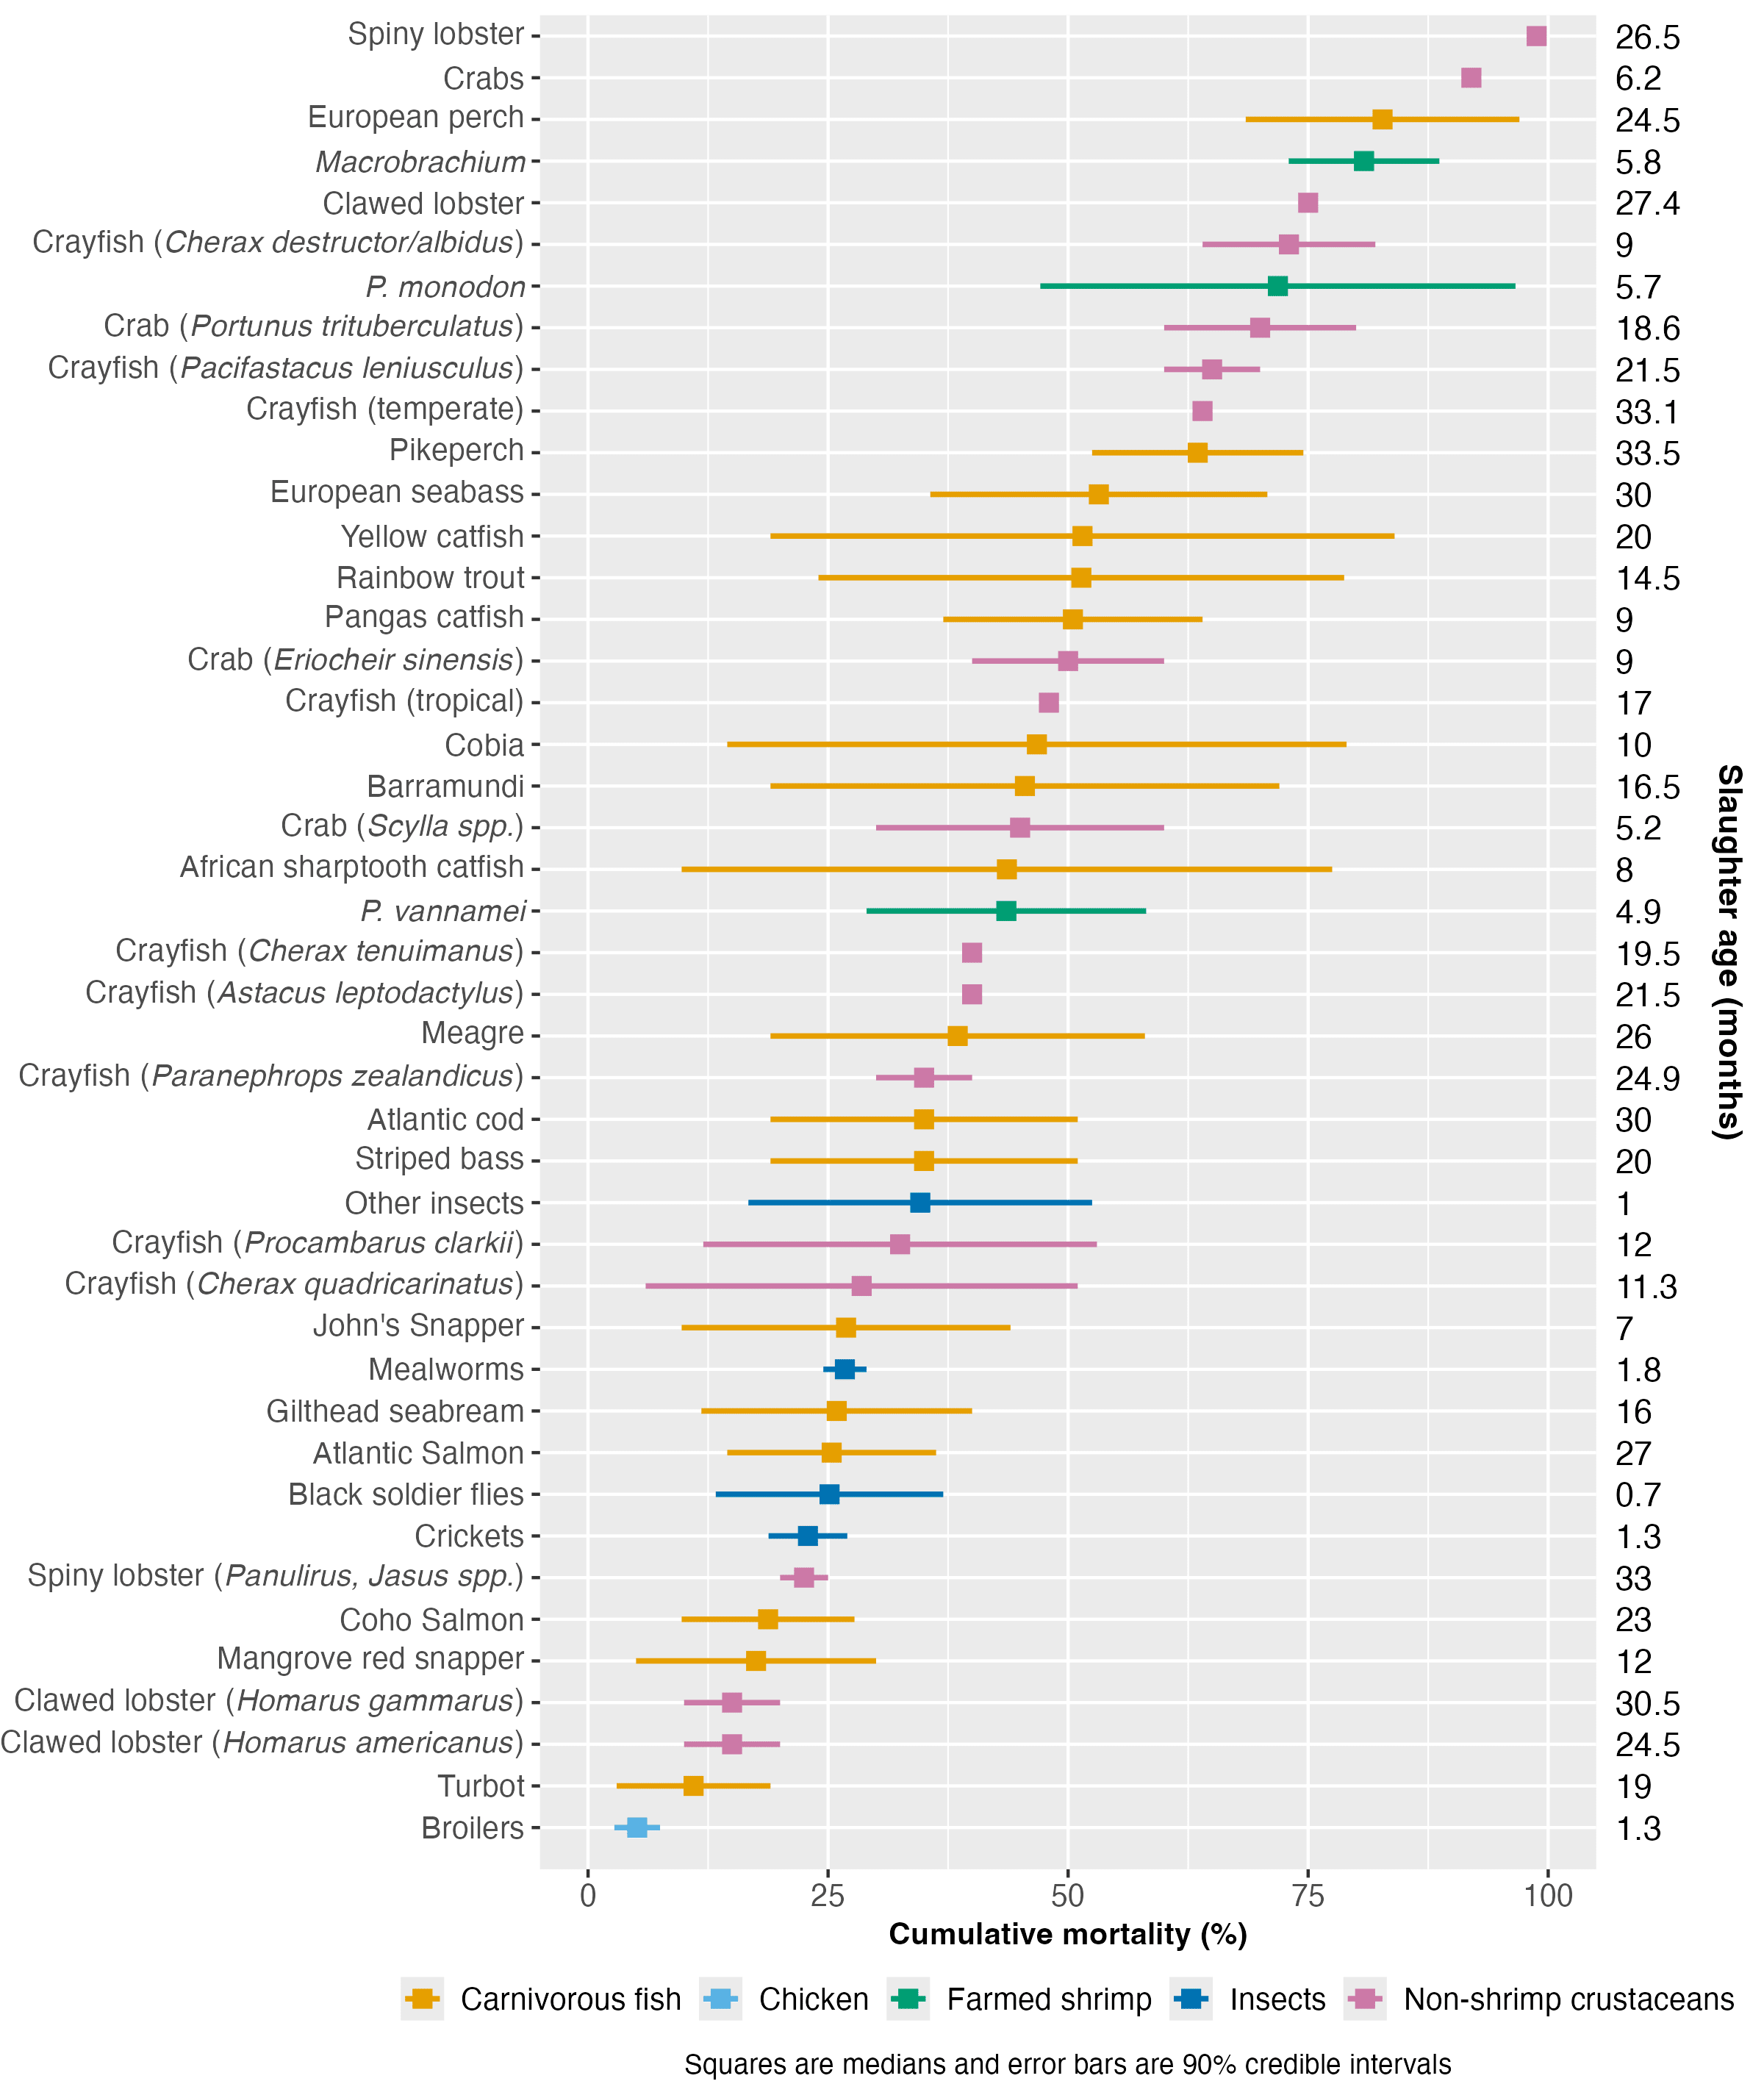
Figure 4: Cumulative mortality rate estimates for farmed shrimp compared to farmed carnivorous fish, broilers, insects, and non-shrimp crustaceans. Estimated median slaughter ages are provided for each taxon on the right. For a full list of sources, see the Methods document.
Figure 4 ranks species by median mortality. Broilers have the lowest mortality rate of all taxa analyzed here. Mortality of P. vannamei falls around the middle of the distribution of these farmed groups. While our analysis inevitably does not cover all possible farmed aquatic species, the results suggest that P. monodon and Macrobrachium have slightly high cumulative mortality rates for aquaculture. The extent of mortality in these species might be slightly unusual, but data limitations prevent us from making definitive claims; if the fish data included the entire life cycle, our results may look very different.
Differences in mortality between species showed no correlation with body size (⍴ (rho) = -0.13, p-value = 0.41) or production cycle length, as measured by slaughter age (⍴ = 0.09, p-value = 0.55; see Methods document for details)[5]. We did not have the data available to examine the association between mortality and weight at hatching or growth rate, so these characteristics may explain some early deaths (see Causes section).
Data and method limitations
There are a few reasons to doubt the veracity of sources included in all of the above analyses. For detailed explanations, refer to the limitations sections in the respective chapters of the Methods document. First, the data did not cover all farmed populations, omitting broodstock (shrimp used as breeders) and those that die during transportation.
Second, many estimates are based on farmer surveys rather than direct measurements, which introduces issues such as recall bias and non-random sampling. We suspect mass mortalities from forced depopulation are omitted from pre-slaughter mortality estimates, especially if shrimp are still sold for human consumption. Such events happen when a serious disease is detected before mass mortality occurs (see this news report from Scotland and this one from Australia)[6]. We were unable to find much information about the prevalence of the practice, though it is likely to increase as incidences of disease increase.
Third, there was often no standardized measurement of mortality across sources—for example, there were no standard procedures for whether ranges were standard errors, standard deviations, confidence intervals, or something else.
Finally, we frequently had to rely on industry sources, as opposed to academic ones, which may be biased and may be based more on ‘gut feeling’ estimations rather than empirical insights.
Causes
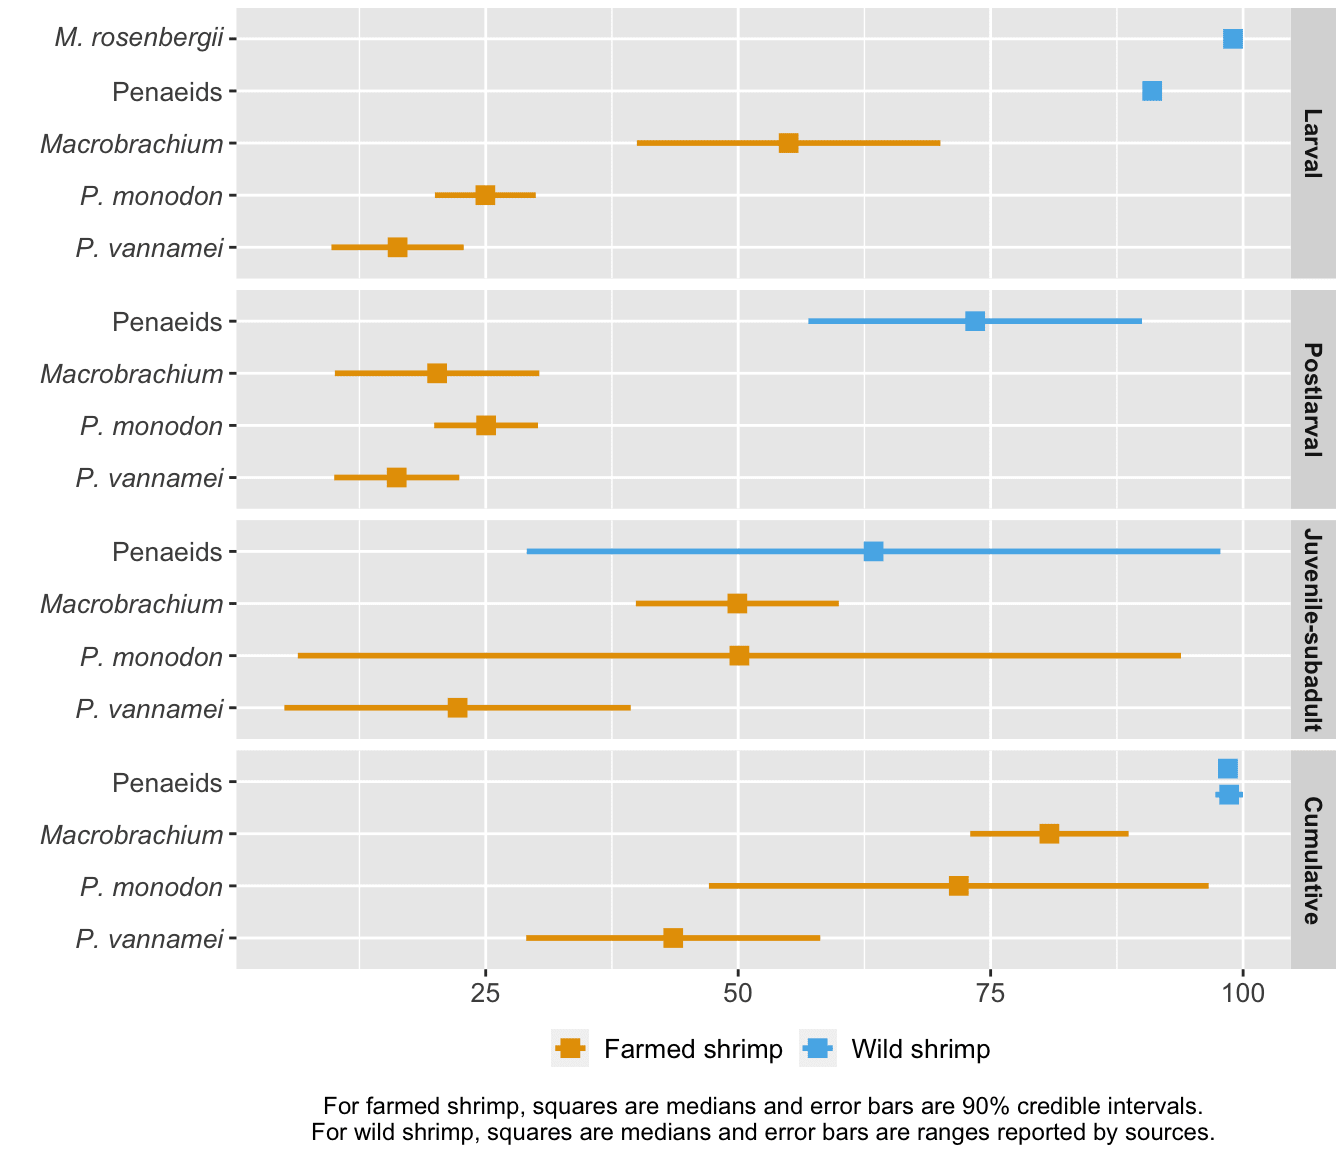
To generate hypotheses about why death rates are at the level they are, we compared farmed and wild shrimp mortality at each life stage (given that they have made it to that life stage) and cumulatively (Figure 5). Wild shrimp have higher median mortality than farmed shrimp at all life stages, though most markedly in the larval and postlarval stages.
Shrimp exhibit high early mortality in the wild because they are on the 'r-selected' side of the r-K selection spectrum (Bauer, 2023, p. 500; p. 595). They grow rapidly, achieve sexual maturity in a matter of months, and spawn several hundred thousand eggs at a time. Most of the eggs that hatch will not make it to adulthood. Additionally, penaeid shrimp larvae are planktonic, meaning they cannot swim against ocean currents but are carried along by them (Prangnell et al., 2019, p. 19). As a result, whether they make it to the correct postlarval environment (brackish water for penaeids) or avoid predation by plankton feeders is beyond their control. We would expect farmed shrimp to die less than their wild counterparts because farms offer (at least some) protection from threats like predation or harsh environments.
Larval mortality
Despite being protected from many threats they would experience in the wild, our data suggest all three species experience larval and postlarval mortality upwards of 15% on farms (Table 1). Wild shrimp are often not resilient to unfavorable environmental conditions that are common during the larval stage because they receive little parental investment. Because wild shrimp evolved to make tradeoffs between resilience and other traits, there may be a practically unavoidable level of mortality in farmed shrimp.[7]
Because of this lower resilience to environmental conditions, in their assessment protocols for shrimp welfare, Pedrazzani et al. (2023) give narrower optimal ranges for water quality parameters for larvae and postlarvae than they do for juvenile and adult shrimp. Bauer (2023, p. 636) notes that high levels of organic matter in ponds “entangles swimming and feeding appendages of larvae with subsequent high mortality.” Therefore, adverse environmental effects may be more prevalent for larvae and postlarvae because farmers may find it harder to maintain environmental conditions within restricted limits. Larval shrimp are frequently soft-shelled as they molt (shed their exoskeleton) around eleven times to reach the postlarval stage (Kentucky State University, 2002, p. 4). This may leave them more vulnerable to any environmental fluctuations or to aggression from conspecifics.
Postlarval mortality
In addition to sensitivity to environmental fluctuations, which persist through the postlarval stage, there are three threats that could explain high mortality. First, postlarval shrimp are often transported between hatcheries and farms to be stocked into ongrowing ponds (see the Handling and transportation section in the previous report for an overview). Many shrimp can die if they are not carefully acclimated to the pond conditions before stocking. Some farms use a nursery stage before moving them to ongrowing ponds so that shrimp are older and less sensitive to water quality by the time they are stocked into ongrowing ponds (Persyn & Aungst, 2006, p. 42). Others conduct stress tests, exposing postlarvae to extreme environmental conditions to ‘weed out’ weaker shrimp.
Cannibalism could also explain some postlarval mortality, though the case here is likely stronger for P. monodon than other species (Abdussamad & Thampy, 1994; da Costa et al., 2016; Jiang et al., 2021). While we found no data on cannibalism amongst larval shrimp, it is reasonable to think it could also occur during this life stage due to high molt frequency, though possibly they are too small to eat other shrimp. Cannibalism appears to be more common in postlarvae than juvenile–subadults, potentially because shrimp molt less frequently as they get older (Abdussamad & Thampy, 1994, p.74).
Some deaths in this life stage may result from acute hepatopancreatic necrosis disease (AHPND). This bacterial disease, sometimes known as early mortality syndrome, affects P. vannamei and P. monodon, causes sudden mass mortality of up to 100% of infected shrimp, and usually emerges within 10 to 35 days of stocking ponds with shrimp (World Organisation for Animal Health, 2023, Ch. 2.2.1, p. 2).
Juvenile–subadult mortality
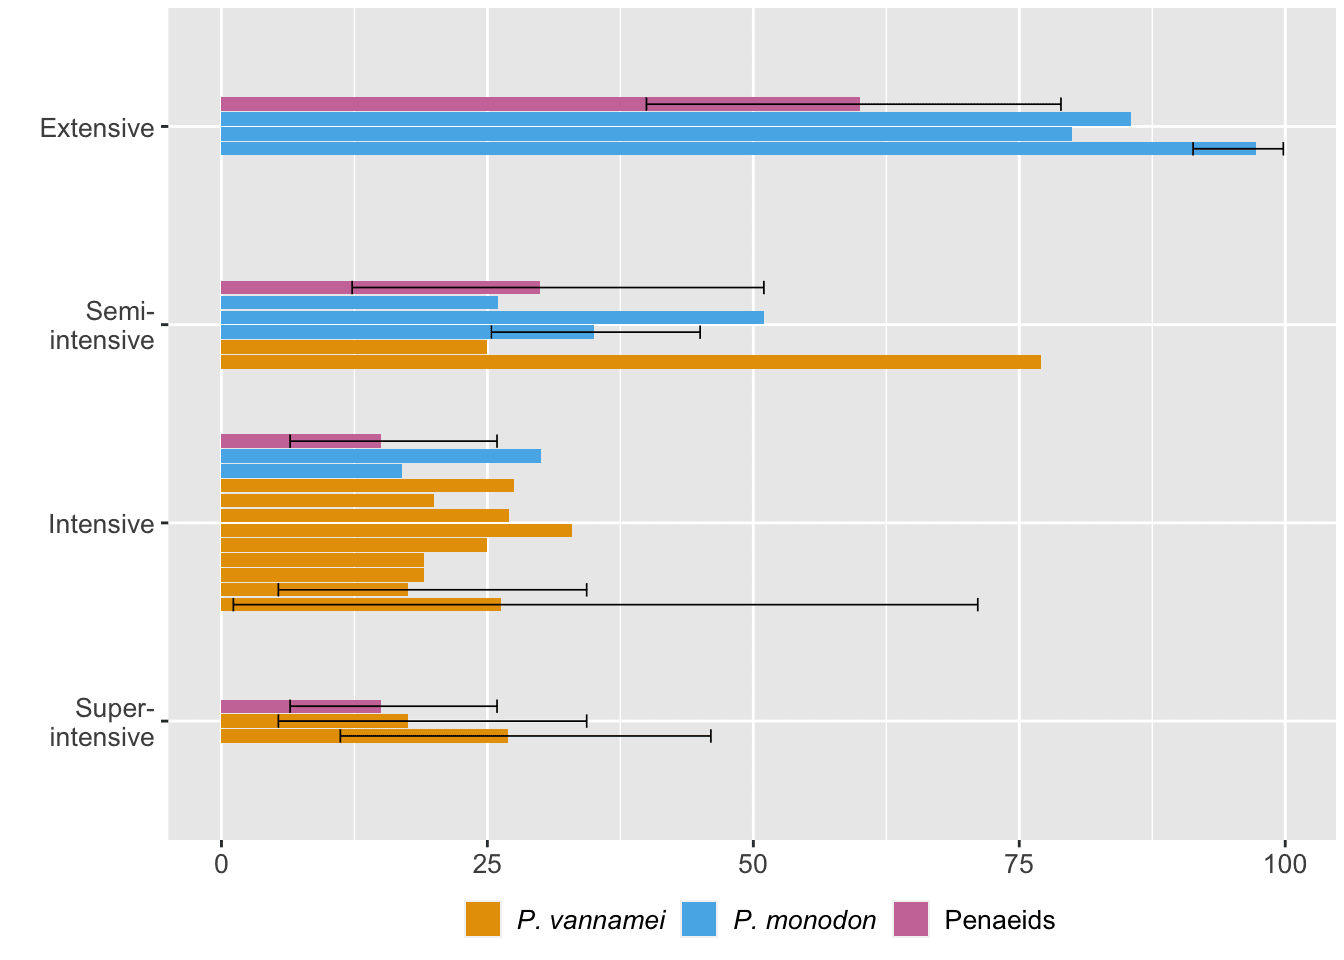
Shrimp ongrowing farms are often characterized as extensive, semi-intensive, intensive, and super-intensive (see Box 2). One way to understand if farming conditions cause deaths is to compare mortality rates across different farm types. We did so by taking sources from our quantitative literature analysis that reported mortality for specific farm types (Figure 6, note that this figure likely includes both postlarvae and juvenile–subadult mortality).
Figure 6: Mortality rates at different types of ongrowing farms reported by the literature. Error bars reflect our 95% credible intervals. 'Penaeids' refers to data reported for penaeids generally. See the ‘Quantitative literature analysis’ chapter of the Methods document.
Our data suggest that mortality generally decreases as farm intensity increases. This may intuitively make sense as extensive farms most closely match a shrimp’s natural habitat, and wild shrimp mortality is high (Figure 5). We assume that excess mortality in extensive ponds is generally due to predation and weather fluctuations.[8]
All types of shrimp farms face significant mortality due to diseases, some of which lead to mass mortality events, impacting global shrimp populations and production statistics (Shinn et al., 2018). According to two experts interviewed for our previous report, diseases are the primary cause of pre-slaughter mortalities in shrimp aquaculture. Benchmark Insights (2019, p. 17) states that disease results in an average loss of 40% of shrimp production. While farmers are likely motivated to prevent infections, shrimp lack an adaptive immune system, so immunization is not often possible. Thus, farmers rely on preventive measures such as robust biosecurity protocols and water quality monitoring, which can be challenging and expensive.
Although all farms contend with disease, the distal cause might systematically differ across production types. Less intensive farms typically have looser monitoring and control of water quality parameters. While extreme fluctuations may directly cause deaths, subtle changes can also have sublethal impacts (see the Water quality section of our previous report). These lower-level effects stress shrimp physiologically so that they divert metabolic energy to homeostasis, which can make them less able to fend off diseases when pathogens are present (Clayton et al., 2022, p. 296). Some pathogens also only become virulent when environmental conditions change and favor them, which may be more probable when water quality is not regularly audited (for example, Enterocytozoon hepatopenaei, a fungus, is more infectious at higher salinity; Aranguren et al., 2021). Diseases may, therefore, contribute to a steady, low level of mortality during the ongrowing stage.
One might anticipate worse water quality issues on intensive farms because higher stocking densities cause greater dissolved oxygen demand and more feces and feed. Closer contact with conspecifics and stress from crowding may also increase infection risk. However, closer water quality monitoring on these farms likely explains their lower mortality rates.
Other causes
Artificial genetic selection could also contribute to mortality, particularly if shrimp are bred for growth at the expense of survival. Kona Bay, a broodstock supplier, reports that their broodstock selected for survival produces offspring with higher survival in ongrowing to harvest than those selected for fast growth (85–90% vs 70–80%). It is also possible for other traits that cause weaknesses to be accidentally co-selected in breeding programs.
Eyestalk ablation of broodstock could weaken offspring immunity (Zacarias et al., 2021). As the industry increasingly relies on domesticated broodstock and a female can produce several thousand offspring, these weaknesses are likely widespread.
Implications and conclusions
Death is a useful proxy for whether a shrimp has endured highly negative experiences. Not only is the process of dying likely agonizing, but the conditions that increase vulnerability to death may make daily life unpleasant. Exploring pre-slaughter mortality rates gives us a lower-bound estimate for these negative experiences and generates hypotheses about aquaculture practices and characteristics of shrimp themselves that cause them.
The sheer magnitude of pre-slaughter mortality, though, raises the question of whether reducing pre-slaughter mortality should be a goal of stakeholders who aim to improve shrimp welfare. Potential ways to reduce premature deaths include closely monitoring water quality, minimizing cannibalism (e.g., via lowering stocking densities), or increasing biosecurity measures. Broodstock and larvae suppliers may be able to artificially genetically select shrimp with higher survival odds.
While aiming to reduce premature deaths aligns with preventing harm to animals, it may not improve aggregate affective welfare.[9] If this is the metric of interest, there are reasons to be uncertain that lowering premature deaths should be an explicit aim in improving the welfare of shrimp. Because pre-slaughter mortality rates do not account for nonfatal impacts, fewer deaths do not necessarily indicate improved welfare for surviving shrimp, who may still suffer from prolonged, adverse (but sublethal) conditions. In fact, because dead shrimp do not have to endure negative experiences any longer, it is possible that premature mortality is actually preferable in the aggregate view of welfare. It depends upon the extent to which mitigating mortality improves the day-to-day experiences of shrimp who would have otherwise died.
Reducing pre-slaughter deaths may also change the wider industry’s trajectory. Improving control of pond environments would mean fewer shrimp experience lethal and sublethal conditions. If early deaths were reduced, the number of shrimp that are born would also decline, if farmers were producing a fixed biomass. However, consumer demand outstrips supply when disease rates are high (Asche et al., 2021, p. 4), so it appears that farmers do not continue rearing shrimp until a certain threshold is met. Reducing deaths by intensifying farm practices may also mean the industry is better equipped to meet demand, causing more intensive farms to open over time, particularly because there are fewer land constraints on intensive farms (Boyd et al., 2022, Table 13) and it costs less to produce a kilogram of shrimp when mortality is low (Asche et al., 2021, Figure 3). Moreover, the number of individual shrimp per kilogram would likely increase because intensive farms rear shrimp to a lower weight (da Silveira et al., 2020, Table 2; Krummenauer et al., 2011, Table 1; Liu et al., 2017, Table 2).[10] The overall number of farmed shrimp should, therefore, increase due to intensification. As such, we remain uncertain if reducing pre-slaughter mortality is a priority to improve farmed shrimp welfare. It again depends on whether the average shrimp experiences better or worse welfare on intensive farms.
If shrimp welfare interventions were to focus on reducing pre-slaughter mortality, it would make intuitive sense to concentrate on the life stages with the highest mortality rates, the larval stage. However, this intuition may be misguided. Reducing larval mortality only has welfare implications for larvae insofar as the cognitive complexity required for sentience develops over ontogeny (Mellor, 2019, section 2.5). If larvae are sentient, then this might indicate that we should focus our efforts on them. However, larvae are planktonic, so they do not make autonomous decisions around interacting with their environment until they become benthic in the postlarval stage. Some argue that without the ability to make free choices, there is no need for a feedback mechanism of pain (Farnsworth & Elwood, 2023). So, if larvae cannot suffer but older shrimp can, it would be better to focus on reducing mortality after around 20 days. Although questions of sentience will always be tricky, some basic science on shrimp development could greatly reduce our uncertainty.
Although most mortality is seen in the larval and postlarval stages, these stages are short relative to the juvenile–subadult stage. Hence, early-life experiences may not actually significantly impact the aggregate welfare of farmed shrimp. We are also uncertain what impact reducing early-life mortality would have on cumulative mortality because the extent to which mortality risk at later life stages depends on events in earlier stages is unknown. For example, if shrimp hatcheries achieved 100% larval shrimp survival, would more shrimp die when stocked into ongrowing ponds because weaker individuals survived? Or would the hatchery improvements increase the resilience of even the most vulnerable shrimp, leading to lower cumulative mortality?
Given all of these uncertainties, reducing pre-slaughter deaths should not be the focus of shrimp welfare efforts. Instead, pre-slaughter mortality rates should be considered alongside other indicators when seeking to improve conditions for farmed shrimp. With uncertainty surrounding the consequences of reducing larval deaths specifically, it may be more prudent for advocates to concentrate on improving conditions that could cause deaths in the ongrowing stage (postlarval and juvenile–subadult life stages). Our data indicate that over 100 billion P. vannamei shrimp die in this period, which is the longest part of the farming cycle, presenting a significant opportunity for impact. In this case, pre-slaughter mortality rates can still serve as one metric of progress toward other objectives.
Acknowledgments
This report is a project of Rethink Priorities—a think tank dedicated to informing decisions made by high-impact organizations and funders across various cause areas. The authors are Hannah McKay and William McAuliffe. Thanks to Ben Stevenson and Sagar Shah for helpful feedback on drafts of the report and to reviewers on the previous report in the Shrimp Welfare Sequence, who saw some of the material included here.
This is just one producer’s opinion. We do not know if the figures in the quotation are accurate. We include it here to demonstrate that the reputation of shrimp farming is generally that higher mortality rates are expected.
Shrimp are omnivorous, so using carnivorous (as opposed to herbivorous) fish controlled better for differences in diet and provided the most similar comparisons.
To the best of our knowledge, the data for these species related to populations that are reared and slaughtered on farms (rather than hatching on farms to stock into wild fisheries).
The Australian government recommends using standard harvesting procedures (placing shrimp in ice slurry) or using lethal doses of insecticides. Both procedures likely present welfare threats—see the Slaughter and Water pollutants section of the previous report.
Other genetic factors may also be at play—in larval sardines, for example, mortality seems related to size at hatching, even in protected laboratory environments (Garrido et al., 2015).
Semi-intensive and some intensive farms are outdoors but usually have things like bird scarers or tarpaulins for shade, so shrimp are often more protected.
However, intensive farms have shorter production cycles, so while more individual shrimp are needed to produce a given biomass, each spends less time in the farming environment, so has less opportunity to experience negative welfare.
I used AI to fix transcription errors, rerrarange the ideas, and suggest tweaks to the title and some sentences.
Three of the most exciting projects to come out of EA in recent years are, in a vague sense, CEA spinouts:
* Kairos is directly a spinout of CEA and now handles most support for university AI safety groups. Basically everyone I've found who knows them is really excited about what they do
* NEST is an opinionated ideas-fi...
Hello! I'm Justin Portela. I got hired by GWWC to make YouTube videos after AI in Context did such a kickass job.
My channel is using that same cinematic, high-production value beauty to talk about everything in the EA universe that isn't AI.
...


Fantastic and important work (as always)!
Figure 3 is somewhat concerning - if I squint I can sort of see some vague agreement between the different sources, but it's pretty all over the place. Do you have a sense of whether this is an area where funding additional field research would be a good idea, or do you think this is lower-priority than other potential research questions related to shrimp welfare?
I personally would not make mortality the focus of the marginal research project, but I do think you would get it 'for free' in the sort of project I would prioritize. In my view, the main considerations are:
1. A lot of uncertainty is an artifact of inconsistent reporting practices. An article arguing for a standardized methodology in an aquaculture magazine signed by a bunch of prestigious researchers (or a presentation at an aquaculture industry event) might do more to reduce uncertainty than more data per se.
2. A lot of the basic trends are robust to the uncertainty. Cumulative mortality is probably around ~50% even in ideal circumstances, more intensive farms have less mortality, larval mortality is steeper than juvenile mortality, and wild shrimp have higher mortality rates than farmed shrimp.
3. Hannah's upcoming report, a Monte Carlo model of which welfare issues cause the most harm in aggregate while shrimp are still alive, contains enormous uncertainty due to limitations in the surveys of farms that have been conducted. As a result, the rank-order of the badness of many issues is not robust, an issue that new, higher-quality data could address. Improved surveys would presumably also measure survival, so we would gain clarity on premature mortality even though it was not the main focus.
4. It would probably be at least as valuable to get larval mortality estimates for the farmed fish species to which we compared farmed shrimp in Figure 4.
Thanks!