I would like to thank Lant Pritchett, David Roodman and Matt Lerner for their invaluable comments.
You can follow these links to comments from Lant Pritchett and David Roodman.
This post argues that if we look at a broad enough evidence base for the long term outcomes of education interventions we can conclude that the best ones are as cost effective as top GiveWell grants. I briefly present one such charity.
A number of EA forum posts (1, 2) have pointed out that effective altruism has not been interested in education interventions, whether that is measured by funding from GiveWell or Open Philanthropy, or writing by 80,000 hours. Based on brief conversations with people who have explored education at EA organizations and reading GiveWell’s report on the topic, I believe most of the reason for this comes down to two concerns about the existing evidence that drive very steep discounts to expected income effects of most interventions. The first of these is skepticism about the potential for years of schooling to drive income gains because the quasi-experimental evidence for these effects is not very robust. The second is the lack of RCT evidence linking specific interventions in low and middle income countries (LMICs) to income gains.
I believe the first concern can be addressed by focusing on the evidence for the income gains from interventions that boost student achievement rather than the weaker evidence around interventions that increase years of schooling. The second concern can be addressed in the same way that GiveWell has addressed less-than-ideal evidence for income effects for their other interventions: looking broadly for evidence across the academic literature, and then applying a discount to the expected result based on the strength of the evidence. In this case that means including relevant studies outside of the LMIC context and those that examine country-level effects. I identify five separate lines of evidence that all find similar long-term income impacts of education interventions that boost test scores. None of these lines of evidence is strong on its own, with some suffering from weak evidence for causality, others from contexts different from those where the most cost-effective charities operate, and yet others from small sample sizes or the possibility of negative effects on non-program participants. However, by converging on similar estimates from a broader range of evidence than EA organizations have considered, the evidence becomes compelling. I will argue that the combined evidence for the income impacts of interventions that boost test scores is much stronger than the evidence GiveWell has used to value the income effects of fighting malaria, deworming, or making vaccines, vitamin A, and iodine more available. Even after applying very conservative discounts to expected effect sizes to account for the applicability of the evidence to potential funding opportunities, we find the best education interventions to be in the same range of cost-effectiveness as GiveWell’s top charities.
The argument proceeds as follows:
Executive Summary:
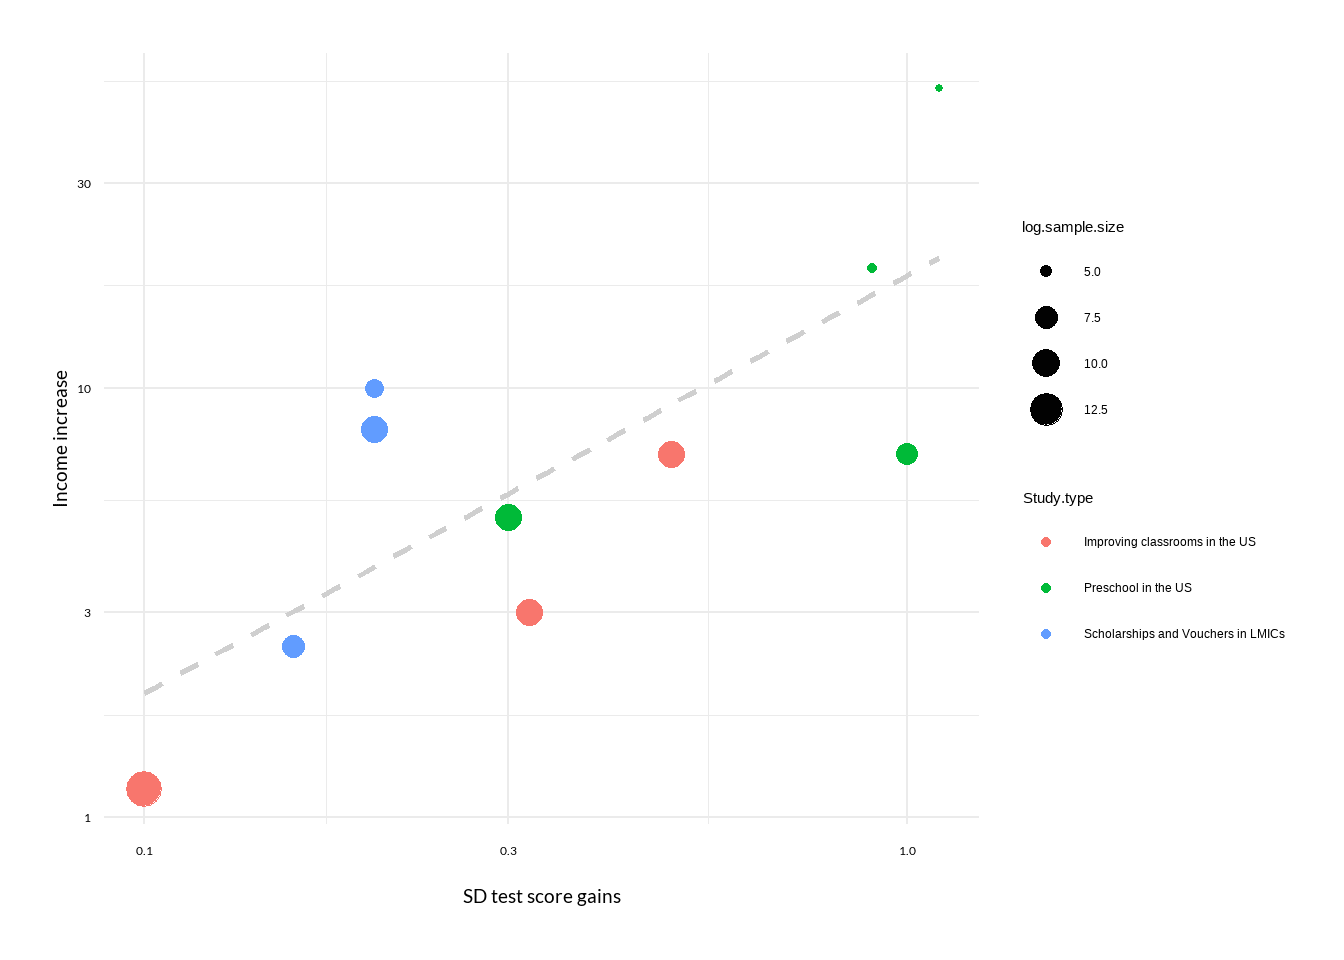
I. There are five separate lines of academic literature all pointing to income gains that are surprisingly clustered around the average value of 19% per standard deviation (SD) increase in test scores. They come to these estimates using widely varying levels of analysis and techniques, and between them address all of the major alternative explanations.
A. The most direct evidence for the likely impact of charities that boost learning comes from experimental and quasi-experimental studies of improving classroom quality in the US. These studies address concerns about causality with large sample sizes and robust methodology. (12% per SD)
B. The most relevant evidence comes from studies that examine programs that provided vouchers or scholarships in LMICs. These studies provide the strongest evidence for learning gains boosting incomes in contexts like those where top education charities operate. (19% per SD)
C. Most of the RCT evidence for the impacts of learning gains comes from studies that examine the impacts of preschool programs in the US. These studies have the longest follow-up times, and provide the best evidence for charities that operate in early childhood. (16% per SD)
D. The broadest international evidence comes from cross sectional regressions that look at the impact of test scores on adult incomes after controlling for confounding variables. These studies find very statistically significant results across a broad range of test types and contexts. (22% per SD)
E. The best evidence that income gains are truly additive, rather than coming at the expense of others, comes from cross-country regressions estimating the impact of changes in national test scores on GDP growth. (28% per SD)
II. We average across two different approaches of evaluating the strength of the existing evidence to come to a conservative replicability adjustment of 0.17. We multiply the expected impact in section I by this adjustment to account for the fact that we are not sure that the evidence will generalize to our target interventions.
A. The first approach applies GiveWell’s model for discounting income gains from health interventions. We conservatively base our analysis on a comparison to the deworming adjustment, even though we believe that a comparison to other interventions would double the replicability adjustment.
B. The second approach designs a new weighted factor model to directly compare the evidence for education to the evidence for deworming.
III. We argue that we should apply further charity-level adjustments based on the quality of the evidence that the charity increases test scores. These include adjustments for the sample size of the studies supporting a particular program, and what kinds of achievement tests were used to measure outcomes.
IV. We discuss additional considerations in our analysis, including the evidence for the persistence of income gains across adulthood and how to deal with the fade-out of test-score gains over time.
V. We consider the possible causal mechanisms that may drive the impact of education interventions on adult incomes. We conclude that increases in cognitive ability are the most likely mechanism, and that even if this is the only mechanism that is likely to generalize to our recommended education charities it would still imply a replicability adjustment that is higher than our recommendation in section II. Other potential mechanisms include impacts on executive function, behavioral issues and social and emotional skills.
VI. We estimate that applying these recommendations to an intervention such as Imagine Worldwide adaptive digital exercises in Malawi, which boosts test scores by roughly 0.2 standard deviations for $15 per year, would produce an estimate of 11x as cost effective as GiveDirectly at improving wellbeing through higher income.
VII. We discuss the combined evidence and how it addresses common objections to expecting income benefits from education interventions.
I. Impact of boosting test scores on earnings in adulthood
We will examine five lines of research suggesting that interventions that increase test scores also increase income. All of the individual papers we identified found impacts between 5% and 50% of gains in income in adulthood per SD of learning gains. Each of the five lines of research come to an average effect size of 12%-28%. Overall, we find the average effect across the five lines of research to be 19%, and find it fairly insensitive to excluding the least reliable studies and lines of research from the average, or weighting the lines of evidence by a subjective judgment of relevance. Additionally, we do not believe publication bias is likely to be a large problem for most of these studies because long-term income data is difficult to collect, and a researcher is unlikely to invest the time and money to do so and then be unable to or choose not to publish the results. However, there are many other reasons to not be confident that these estimates will apply to our education interventions, creating the need for the replicability adjustment discussed in section II.
We are not attempting to establish the long-term impact of test scores themselves, but rather the impact of interventions that boost scores. Therefore we will never be confident that a new intervention that boosts scores will also boost income. This accounts for most of the need for the replicability adjustment discussed below. However, every intervention that we have identified that boosts test scores and has income data, also appears to boost income. Conversely, every intervention that boosts income and has test score data, also boosts test scores. We believe the consistent effect sizes across a broad range of studies and approaches provide good evidence that test score impacts of interventions can be used to predict income gains. Another way to say this is that we establish not a simple correlation between scores and income, but rather a consistent correlation between score increases caused by education interventions and income increases caused by those same interventions decades later. We don’t know what it is about education that raises income and test scores — it could be improving cognition, improving executive function, or doing something even less well understood like altering problematic behaviors or social and emotional skills. But we have a good reason to suspect that when we see test scores go up after an education intervention, income will also be going up.
A related concern is that some of the interventions we examine boost years of schooling in addition to test scores. However, we believe that the evidence for years of schooling predicting income effects is not nearly as strong as that for test scores. There are a number of quasi-experimental studies that do not find increases in income following increases in years in schooling. Additionally, some of the best evidence we have, such as the classroom studies in section A below, does not provide any information on years of schooling. While other evidence, such as the GDP regressions in section E, does not seem to hold up for years of schooling. Therefore we focus on using test scores as our predictor of income effects rather than years of schooling. Additionally, the most cost-effective interventions we have come across focus on increasing learning gains, making the evidence around years of schooling less relevant.
The three more convincing lines of research we examine below consist of experimental and quasi-experimental studies. The most relevant of these are a set of studies examining the impact of improving classrooms in the United States; a second set considers programs that made it easier for children to go to good schools in LMICs; and the third follows children after they participate in preschool programs in the United States. Another two lines of research offer supporting evidence based on cross-sectional regressions. The first of these performs regressions of individual income against cognitive abilities while trying to adjust for confounding variables. The second regresses changes in country-level GDP growth on changes in children’s test scores.
A. Experimental and quasi-experimental studies on improving classrooms in the US
Most of the education interventions Founders Pledge evaluates seek to increase the amount of learning going on in a classroom through methods such as more targeted instruction (Teach at the Right Level), or better lesson planning (structured pedagogy). The most direct evidence for the impact of such programs on adult income comes from US studies that examine the impacts of marginally better quality classrooms and more school spending. While the US context is not as relevant to LMICs as the setting of most of the studies discussed below, it does have the benefit of reassuring us that education interventions that boost test scores will continue to have similar sized income effects even as LMICs have dramatically expanded education over recent decades. The average increase in income across this line of evidence is 12% per SD increase in test scores. The first two studies were both published by Raj Chetty and coauthors in 2011. They were made possible by access to millions of tax records, allowing the tracking of children involved in natural experiments.
The first of these used an event study design, measuring the impact of a new teacher starting to teach a class in a new grade or school on the test scores and eventual income of students. The study followed 2.5 million children in a large urban school district in grades 3-8. Chetty et al. measure the value added (VA) of these teachers before they start teaching a new grade, estimating which teachers boosted student standardized test scores the most. They then use that VA measure to estimate the impact of better instruction on all students in the grade that the teacher has started teaching. Previous VA studies were subject to the criticism that “high VA” teachers selected the most promising students every year to join their class. That could potentially explain consistent large increases in student test scores without reflecting the teacher’s ability. By looking at impacts on a whole grade of students Chetty et al. eliminate the possibility of selection effects, and generate convincing evidence that better teachers are able to consistently boost student learning. Since teachers can only select who enters their class, not a whole school grade, there is little room for selection effects to bias the results. Chetty et al. estimate that a teacher that is one standard deviation (SD) higher in VA is able to boost student scores at the end of the year by 0.1 SD, and eventual income by 1.2%. This suggests that interventions that boost student learning may increase income by 12% per one SD increase in test scores.
The second Chetty et al. paper analyzes Project STAR, where kindergarten students in Tennessee were randomly assigned to classrooms. Since the assignment is random, Chetty et al. are able to estimate the impact of being assigned to a higher quality class on a student’s test scores and income. They estimate class quality by looking at the test scores of all the other students in a class at the end of kindergarten. A class that is one SD higher in quality improves a student’s test scores by .32SD and income at age 27 by 3%. These class quality effects may include having peers that are better matched in ability (like Teach at the Right Level), better instruction (like structured pedagogy), or any of a number of other unobserved factors. Chetty et al. confirm these results on a smaller sample of older children, and by running the same analysis using an instrumental variable approach with class quality impacting scores as the first stage. This implies an impact of 9% of income per one SD increase in test scores.
Jackson et al 2015. examines the impact of court-mandated spending reforms in the US in the 1970s and 1980s. They use event study and instrumental variable designs to estimate that the impact of 10% higher school spending for all twelve years of a student’s education is 7% higher income. Since the reforms affected younger children who were just starting to go to school much more than older children, Jackson et al. were able to get an unbiased estimate by comparing those two groups in each district. Unfortunately, the authors were not able to link these results to individual student test scores as in the two papers above. Therefore, to get impacts of school spending reforms on student scores we turn to a review of the literature on instrumental variable studies addressing the question. Jackson et al 2018 find effects around 0.49 SD increase in test scores per 10% higher spending for 12 years. Much like in the two Chetty papers above, increased spending could lead to better test scores by improving instruction or otherwise boosting class quality. If we combine the findings, we get an estimated impact of 14% higher income per SD increase in test scores. However, this estimate is less reliable than the preceding two because it combines results from separate studies using different designs and looking at different time periods.
B. Experimental and quasi-experimental studies on access to good schools in LMICs
The second most compelling line of evidence examines the impacts of voucher programs and scholarships that gave students in LMICs access to good schools. These programs often allowed students who would not otherwise have gone to school to attend, making them less similar than the preceding set of studies to the charities we generally examine. Additionally, two of these studies appear underpowered to detect expected effect sizes, and therefore we rely on central estimates even though they are not significant at the 5% level. However, this line of evidence is more relevant in that it is carried out in LMICs. The average increase in income across this line of evidence is 19% per SD increase in test scores.
The best evidence comes from a lottery carried out in Colombia which provided vouchers to disadvantaged children to go to private schools. Bettinger et al. find that those who won the lottery earned 8% more at age 30, but only statistically significant at a 7% level. A separate study estimated that three years after winning the lottery, students had 0.2 SD higher test scores. A direct calculation would imply a 40% increase in income per SD higher test scores. However, as we will discuss in section IV.B, score increases fade out over time. Therefore, we estimate that the original impact on test scores was 0.3 SD, but it declined to 0.2 SD over the years before results were collected. This implies an impact of 30%.
A second set of studies uses instrumental variable techniques to examine a nationwide school reform in Chile that made vouchers for private school available to all students. Patrinos et al find that children in primary schools gained 10% in earnings, while older children did not benefit. We conservatively average the 10% and 0% effects, rather than using the pooled result. David Roodman of Open Philanthropy points out that Patrinos et al. include a literacy control in their estimate of earnings impact in order to try to isolate the impact of only school quantity rather than quality. However, this control is likely affected by quantity and quality, and therefore what we likely get from this study is a conservative estimate of the combined effect of quantity and quality. Roodman also notes that since this study was based on a national representative survey it provides evidence that these income gains are not created by taking income away from people that didn’t benefit from the reform. Estimates from a separate study suggest that this reform boosted student scores by 0.2 SD. When we account for fade-out, we find an impact of 19% per SD higher test scores.
The last study had the most rigorous design, but was underpowered to precisely estimate earnings impacts. Duflo et al. perform an RCT, providing scholarships for secondary school in Ghana. Initial results estimated 24% higher income for those receiving the scholarship. However, a recent follow up, 11 years after receiving the scholarship, finds a statistically insignificant 2.5% effect. The result is imprecisely estimated enough to include results like those in our other studies in its confidence interval. Other problems with relying on this result include the authors’ concerns that the income gain may have been driven by students winning limited public sector jobs at the expense of other candidates, and the fact that only girls showed impacts across any metrics. Duflo et al. estimate that test scores increased by 0.15 SD the year after graduation. After accounting for fade out, this suggests a 8% increase per SD increase in test scores.
C. Experimental and quasi-experimental studies on preschool in the US
The longest term and most rigorous evidence we have for income effects of education comes from studies that followed children provided with pre-school education in the US. However, this line of evidence combines the weaknesses of both of the preceding sections, being implemented in a less-relevant developed world setting, and providing additional education rather than marginally improving quality of education. The average increase in income across this line of evidence is 16% per SD increase in test scores.
The Perry Preschool Project randomized 128 low-income African-American children to two years of a high quality preschool program in Michigan, including weekly home visits and a low student to teacher ratio. Heckman et al. follow these children into adulthood, with the earlier cohorts reaching retirement age. Their estimate of income effects, as well as those of later reviews of the program, range from 29%-42%. However, we conservatively take the average across all results in Heckman et al. to estimate an income increase of 19%. Perry Preschool boosted kindergarten entry test scores by 0.9 SD, implying an impact of 19% higher income per SD increase in test scores after accounting for fade-out.
A similar program called the Abecedarian study randomized 104 low-income children in North Carolina to high quality preschool from birth until age 4. The income effects measured by Campbell et al. were very large at 50%, but statistically insignificant due to the small sample size. This corresponded to a test score increase of 1.1 SD, implying an effect of 22.7% per SD after accounting for fade-out.
The third set of RCT results follow children who participated in Head Start, a national preschool program for low income children. Thompson describes how initial evidence collected from a randomized trial suggested initial 0.3 SD impacts on test scores. However, Head Start was widely criticized after these test score gains faded out. Thomson exploits different roll-out dates for Head Start in different locations, and combines the result with longitudinal data about individuals living in those locations to estimate a 5% increase in income. This implies a 17% increase in income per SD increase in test scores. These income results come from a natural experiment, and are less reliable than preceding studies we discuss. However, we believe that the larger sample size warrants their inclusion as an additional marginal source of evidence.
The final evidence for the effect of preschools comes from a matched cohort study of children who participated in Chicago Child-Parent Centers. This design tries to match children selected into the program to demographically similar children who were not selected, however it is less reliable than the preceding studies as there are often unobserved characteristics among parents who choose to enroll their children in experimental supplementary programs. Reynolds et al. estimate a 7% boost in income for a one standard deviation increase in scores.
D. International cross-sectional regressions of income on individual test scores
The preceding sections all tried to provide robust evidence for the causal impact of higher test scores by employing experimental and quasi-experimental techniques. However, the settings in which such techniques are possible are limited, leaving most of these studies with fairly small sample sizes and each focusing on only one country. Cross sectional regressions allow us to estimate the correlation between income and test scores simultaneously across individuals in many countries and with larger datasets. This gives us greater statistical certainty than the experimental studies above, although with less confidence about what caused the higher test scores or the higher income. We can have some comfort that the correlation from these regressions is not simply a case of parental wealth or some other third factor driving both test scores and income higher because reviews of studies that use both instrumental variable and simple regression techniques to estimate causal impact surprisingly find the simple regression coefficients to be smaller. Similarly, when these reviews compare simple regression results to results from twin studies that implicitly control for most confounds, they find the twin study results to be only slightly smaller. The average increase in income across this line of evidence is 22% per SD increase in test scores.
The most generalizable estimates we have for the implications of higher test scores come from Hanushek et al. 2016, analyzing scores on an OECD survey of adult skills called PIACC. The sample includes 32 countries with over 5,000 people from each. Hanushek et al. rerun traditional “Mincer” regressions of income on schooling, while controlling for experience and gender. The improvement on the traditional Mincer results is that Hanushek et al. are able to use a score that evaluates adults on the same metric, rather than using years of schooling which varies widely in its quality from country to country. They choose to focus on numeracy scores for working age adults, as the most comparable and relevant metric for assessing impacts of test scores on income. They find an overall coefficient of 20% higher income per SD increase in test scores. However, we follow Open Philanthropy and GiveWell in using the Indonesia result of 25% within our analysis, since that is the only non-OECD country in the sample, making it more comparable to the countries where our priority education programs operate.
A more geographically relevant, but far less applicable, result comes from a meta-analysis of four small studies in LMICs that included some measure of cognitive ability and wages. These studies control for years of schooling, and sometimes occupational industry. Since many interventions that boost test scores also increase years of schooling, controlling for schooling likely generates an underestimate of effect size. Additionally, cognitive ability scores are likely a less accurate measure of learned abilities than other kinds of test and literacy scores explored in this section. The authors find a 5% increase in income per SD higher cognitive scores.
Evans et al. 2017 is another study that examines impacts in LMICs. The authors regress wages of 8,000 adults against literacy scores in Bolivia, Colombia, Ghana, Kenya and Vietnam, while controlling for age and gender. Literacy scores increase more slowly with additional schooling than do achievement test scores in LMICs, and therefore likely make this result as much of an overestimate as the result from the previous study was likely an underestimate. This paper is cited in GiveWells investigation of education in developing countries. Evans et al. find a 37% increase in income per SD higher literacy scores.
As a sanity check, we also compare our final result for this section to GiveWell’s review of the evidence for the income impacts of boosting IQ, which is highly correlated to test scores. They come to a result surprisingly close to our 22% estimate.
E. Regressions of changes in GDP growth on changes in test scores
The first four sections all focus on the impacts of education on individuals. However, this approach leaves open the possibility that our estimates either grossly overestimate or underestimate the impact on society once we factor in impacts on others. Improving the education of one person could either help others by increasing innovation or making coworkers more productive, or hurt others if the better-educated person takes their job. One way to resolve this question is to attempt to estimate the impact of improving national test scores on the GDP of entire countries. The weaknesses of this approach are that it leaves us with fairly small sample sizes, makes quasi-experimental methods difficult, and RCTs impossible. The average expected increase in income across this line of evidence is 28% per SD increase in test scores.
Hanushek et al. 2012 is the most widely cited and exhaustive version of this approach, although based on a small sample size. They regress annual GDP growth for each country on average international test scores among 15 year olds (PISA). This direct approach leaves open the possibility that the correlations we find do not indicate causal impact. Hanushek et al. go on to employ a series of quasi-experimental techniques to confirm the result and address alternative explanations. First they try a series of instrumental variables, ranging from share of Catholic Schools in 1900 to relative teacher salary. They go on to examine the impacts of the PISA scores of their home country on immigrant salaries after moving. Lastly, they look at the impact of changes in PISA scores on GDP growth for a small subset of countries where longitudinal data is available. Each of these approaches is consistent with the original regression estimate of 2% additional annual GDP growth per SD increase in national test scores. To translate this estimate into the expected impact of increasing everyone’s test scores on their eventual income we need to make an assumption around how long we expect the GDP growth to persist. We choose 25 years to be consistent with how long PISA score increases were tracked for the longitudinal analysis, and with how long an adult at peak earning capacity can expect to continue contributing to the growth of the economy. This approach conservatively assumes that improving the education in a country drives additional GDP growth for 25 years, but then entirely stops having an effect even as we continue providing higher quality education. We estimate roughly 50% higher income per SD increase in national test scores.
Goczek et al. update Hanushek’s analysis with a much expanded dataset in 2021. They address the two largest problems with Hanushek et al. 2012, that it relies on data from only 23 OECD countries, and that there is no robust longitudinal analysis because it relies on an even smaller sample of 12 countries. They construct a longitudinal dataset of 111 countries by estimating historical PISA scores based on correlations between PISA and other international tests. Goczek et al. employ panel data statistical techniques and try different time lags to get a more robust version of Hanushek’s longitudinal analysis. They find a smaller effect of 0.8 SD increase in GDP growth per SD increase in lagged test scores. This is likely a result of the fact that growth in more recent years appears to have become less correlated to PISA scores. This generates an estimate of roughly 20% higher income per SD increase in national test scores.
Komatsu and Rappleye is the strongest criticism of Hanushek’s analysis that we have identified. They argue that Hanushek et al should be introducing larger time lags between when they collect PISA scores and when they measure GDP growth. Since there is a lag of around 20 years between when children get most of their education and when they reach peak earnings, Komatsu and Raplleye argue that we should explore the impact of introducing this time lag into the analysis. They find that by introducing progressively longer time lags they can get Hanushek’s results to become statistically insignificant. However, despite no longer being significant at the 5% level, their results are still sizable. We conservatively accept the smallest of these results, implying 12.5% higher income per SD increase in national test scores.
II. How much should we discount our final expected effect size?
The strongest evidence we could imagine for a given education intervention would be a meta-analysis of large RCTs tracking very long term income impacts for the exact program we were evaluating. Such a result could be used with little discount. However, our priority programs have not been examined for sufficiently long periods to have these kinds of results, and funding constraints will likely always limit how closely we can approach the ideal evidence. Therefore we rely on the assumption that if we can provide sufficient evidence for a program boosting test scores, then we can say that with some probability we can expect to generate as much income as implied by the evidence surveyed in section II. We can’t say that the probability is 100% because the test score increases generated by our programs may not be as meaningful for income as those surveyed in section II. Additionally, even though the evidence in section II converges on very similar estimates from five separate lines of research, they still do not present perfect evidence that increasing test scores increases incomes. There is the possibility that all of them are biased in similar ways, or all coincidentally biased upwards in different ways. We use two methodologies based on the approach GiveWell has used in the past to recommend multiplying our effect size from section II by a conservative replicability adjustment of 17%.
A. Using GiveWell’s income effects methodology
Our first approach of generating a general discount for our education impact estimate adopts GiveWell’s methodology for estimating income effects for their traditional mortality-reducing interventions. GiveWell bases their estimates on an analysis of the likely impacts of reducing mortality through malaria prevention. In their Malaria Consortium cost-effectiveness analysis (CEA), GiveWell starts with an estimate based on the income effects estimated in two quasi-experimental studies considering historical malaria eradication campaigns. They multiply the results by an adjustment of 70% because the studies are quasi-experimental, and because the eradication campaigns were done in different contexts, with higher malaria burdens and different eradication methods. They apply a further 75% adjustment because the studies focused only on male incomes. GiveWell then extrapolates income effects for vitamin A supplementation and vaccination by comparing the evidence for income effects in those interventions versus those for malaria. Their model generates a weighted average of seven factors that provide evidence for income impacts. The biggest three of these are the strength of the direct evidence of: income impacts, impacts on cognitive development, and impacts on children’s growth.
We combine GiveWell’s models for their three mortality reducing interventions (treating malaria, vitamin A supplementation, and vaccination) into one spreadsheet, and apply the same methodology for estimating income effects to deworming and education. GiveWell’s evidence for the income effects of deworming largely relies on a set of follow up studies from one matched-cohort deworming program in Kenya, with Walker et al. being the most recent. This study is close to a randomized experimental design and has stood up to replication by David Roodman. It also implemented the same deworming approach employed by GiveWell’s recommended charities in a similar context, although amid much higher worm prevalence. Therefore, the direct evidence for income impacts of deworming is higher than the two quasi-experimental malaria estimates, and much higher than the direct evidence for vitamin A supplementation, since there do not appear to be any such studies. Similarly, the direct evidence for the income effects of education interventions cited in section I is far stronger than what exists for the three mortality-reducing interventions. On the other hand, there is no good evidence that deworming or education meaningfully improve children’s growth, health, or anemia levels. Since all of these are indirect evidence for income effects, they lower the overall strength of the evidence for education and deworming in our application of GiveWell’s model. The initial results suggest that we should apply a replicability adjustment of 27% for deworming income effects, and 37% for education income effects.
However, the actual adjustment that GiveWell uses for deworming is half of that implied by this model, or 13%. We consider this very conservative, but adopt it as our baseline in order to make all income-generating interventions comparable to each other. Additionally, GiveWell appears to have spent much more time thinking about the discount for deworming in a bayesian framework than it has for its mortality-reducing charities, where income effects make up a minority of the impact. Therefore, we generate a conservative initial education replicability adjustment by starting with the deworming adjustment of 13%, and scaling it up by the relative outputs of the discount model for education and deworming. This generates a final adjustment of 18%.
B. Creating a custom methodology to compare deworming and education
We then generate an alternate model for comparing the evidence for the income effects of education and deworming directly. GiveWell’s health-focused model is less useful for this purpose because the case for the income effects of education and deworming largely relies on the direct evidence, with little evidence from health-related proxies. The most important factor we consider is the overall quality, or internal validity of the evidence on a 0-4 scale. We consider the evidence for deworming to be a 3, since it directly examines long term income impacts with an experimental design. We consider each of the separate lines of evidence for education we consider in section II to be a 1 on this metric, but in combination to be a 2. The second factor we compare is the relevance of the evidence, or external validity. Deworming is again a 3 on this metric because it implements the same intervention we are interested in, and in a very similar context. However, we consider the education evidence to be a 1 because the studies we consider do not examine exactly the types of interventions we are interested in funding. However, enough of them are in LMIC contexts or boost classroom quality, that we do consider there to be some relevance. On the other hand, the education evidence wins on four less important factors: consisting of a broader base, being consistent across the majority of studies, considering whether there might be negative spillovers (where income might be gained at the expense of others), and the plausibility of the mechanism by which large income gains are generated. This model generates a final adjustment of 17%. We then average the model in the preceding section with this one to get replicability adjustment of 17.5%.
III. Additional charity-level discounts
The effect size in section I and the discount in section II are based on the premise that we are applying them to an intervention that we have good evidence will boost test scores by a given amount. However, very few of our interventions will have large-scale studies reviewing the impact of identical interventions on test scores. Therefore, we will need to apply additional discounts to each charity, likely leaving the total adjustment below the 13% for deworming.
A. Discount for small scale studies and implausibly large effect sizes
Evans and Yuan review 234 education studies in LMICs and find that effect sizes decrease drastically as the sample size of studies increases. They find the mean effect size of studies in the third and fourth quartile of sample sizes (over 2,000 and over 5,000 children) to both be approximately 0.1 SD. In contrast, studies in the first quartile (under 700 children) had a mean effect size of 0.27 SD. The most likely explanation for this effect is publication bias, where many smaller studies are done with very inexact estimates of impact, and only the ones that happen by chance to estimate large effects are published. Another potential explanation could be p-hacking, where small-scale studies lend themselves more to selection of statistical techniques and metrics to find large effects. A more charitable explanation would be that smaller studies really are that much more effective, but the initial rigor and excitement of a small new project cannot be maintained in larger-scale implementations. All of these explanations point in the same direction. If we are expecting to scale up a program with estimated effects based on small initial samples, we should expect those effects to decline drastically.
We recommend treating 0.1 SD as a Bayesian prior on all LMIC education interventions. To perform an informal update on this prior we would treat large studies as providing more information (because they have smaller variance), and updating us more towards their estimate. If the combined sample size of evidence estimating an intervention effect size is over 2,000, we recommend performing a weighted average of that effect size with a 75% weight, with 0.1 at a 25% weight. If the combined sample size is 700-2000 people we would recommend weighing the effect size at 50% and 0.1 at 50%. If the sample size is below 700, we would recommend using weights of 25% and 75%. The final effect would be to penalize studies with implausibly large effect sizes, and especially those with small sample sizes. The justification of using these rough weightings rather than doing a more precise bayesian update is that this method uses more of the information contained in the distribution of effect sizes in Evans and Yuan, and that it is intractable to objectively compare exactly how much less relevant our general 0.1 SD prior is to a given intervention compared to the specific evidence we have.
Another relevant result from this paper is that RCTs have very similar effect sizes to quasi-experimental papers, suggesting that an additional discount for quasi-experimental evidence is not warranted at this time.
Angrist and Meager provide additional justification for discounting the results of small-scale studies by trying to reconcile the varying study results on the effectiveness of targeted instruction. They find that the number of classrooms that actually adopt the program, and the fidelity of program implementation have a strong impact on program effectiveness. If good information on either of these factors is available for a recommended program, we suggest incorporating individual discounts. However, in most cases the best we will be able to do is to assume that uptake and fidelity will decline as a program scales up, providing support for the standard discount methodology based on study size described above.
B. Discount for experimenter-designed measures
Cheung and Slavin perform a meta-analysis of education papers, and compare those that evaluated outcomes using experimenter-designed measures to those that used independent measures. They find that experimenter-designed measures found effects that were twice as large on average. This suggests that experimenters using their own measures are either skewing results in their favor or that these measures are picking up very specific improvements that would not be captured by a more standardized measure. In either case, this would warrant a discount for studies with experimenter-designed measures. This is especially true because most of the literature we reviewed in section II relies on independent measures. Therefore, we recommend applying a subjective adjustment between 30% and 70% depending on how far the researcher deviates from using standard metrics.
IV. Additional considerations for all education interventions
A. Duration of income effects in adulthood
Cost-effectiveness analysis of education interventions relies on assumptions about whether we should expect the income gains from education to persist through adulthood, or whether they might decline with time. Two of the papers we include in the analysis in section II follow children late into adulthood. The Perry Preschool Project finds that beneficiaries were experiencing the same income gains at age 41-65 as they were in the first half of their working life. Similarly, the research on Chile’s voucher program finds the same effect sizes at age 45-65 as age 22-45. Additionally, the cross-sectional evidence suggests that the income effects of education either increase or remain consistent throughout adulthood. Tamborini et al. perform a synthetic cohort analysis of social security administration data in the US to find consistent returns across all ages. Similarly, Card and Watts find consistent earnings gains in their cross-sectional regressions with controls in 1999 and 2020 respectively. In contrast Lin et al. analyzed the National Longitudinal Survey of Youth in the US to find that higher IQ had an increasing association with earnings throughout a career. Overall, we find sufficient evidence to conclude that the impacts of higher test scores are unlikely to decline with age. We recommend valuing all income gains for 40 years of a career discounted back to the present. This allows us to be consistent with calculations of the income effects from deworming and other health interventions in GiveWell CEAs.
B. Fade-out of test score gains over time
All of the preschool studies described in section I.C and the first classroom study in section I.A measured test scores at the end of the program and then administered new tests years later. In most of these studies the impact on the test scores declined over time. In some of them experimenters initially interpreted this to imply that this “fade-out” meant that the programs had little long-term effect. However, as later follow-ups consistently found large income effects of these programs, the interpretation has moved to one of some improvement in skills persisting into adulthood and driving higher income. On the other hand, cross-sectional regressions from sections I.D and 1.E offer some evidence that differences in test scores do not fade-out, and imply comparable income increases per standard deviation to the studies in sections 1.A-1.C.
Bailey et al. review the literature on fade-out effects, and cite a number of earlier reviews of learning interventions finding that impacts of preschool math, reading, and general learning interventions tend to fade out over 18 months to 4 years. However, they point out that some effects usually persist, and that fade-out might be explainable as a methodological artifact. The most recent and largest of the reviews they cite is Prozco et al., which performs a meta-analysis of 39 IQ-boosting RCTs that measured initial increases averaging 0.4 SD. They find that these effects tend to fade by 0.1 SD per year, which suggests that the entire effect might fade out over time. However, these follow-ups are generally fairly short-term and are not as immune to publication bias as studies that track income into adulthood. Prozco et al. suggest that publication bias could explain these results (offering support for our recommendation of discounting effect sizes of short-term intervention studies as we recommend in section III.A.) Additionally, their estimate is fairly noisy and much of it based on one-year follow-up data, and therefore only moderate fadeout appears to be as consistent with their data as full fade-out.
Overall, we believe that we should expect some fade-out for all studies, with some chance of complete fade-out. This implies that in our analysis of test score impacts on income from section I it would be inappropriate to directly compare studies that measured test scores at the end of a program with those that measured impacts years later. For example, if we used the 0.1 SD test score gains from Head Start after four years to estimate the impact of a 1 SD test score gain, we would get 50% higher income. However, if we use the test score gains of 0.3 SD immediately after the program, we would get the more realistic estimate of 17% higher income per SD. Therefore, within the analysis we use the earliest available test score impacts, and when they are not available we extrapolate expected impacts at the end of the program by assuming 25% of the effects fade-out for each of the first two years after a program based on Prozco et al.
C. Other impacts investigated, but found to not warrant inclusion in our CEA at this point
- The Ghana scholarship program found large impacts on the mortality of recipients’ children. Similar effects were found in a study by Kaffenberger and Pritchett mostly relying on correlational evidence. The amount of evidence for these effects is far weaker than the evidence described above for income effects. Additionally, even if these effects are real, their absolute impact is likely to decline steeply as under-5 mortality rates are likely to undergo a large decline by the time students start having children if we extrapolate current trends.
- The literature around years of schooling finds moderate evidence for declines in recipient mortality. However, since most of our interventions focus on boosting test scores we do not include this effect.
- There is weak evidence that schooling may increase life satisfaction above what we would expect from income gains. However, this evidence is for years of schooling, and most studies show no effect, while a few show negative effects.
V. Potential Mechanisms
The most straightforward mechanism through which education interventions that boost test scores could increase income is by increasing cognitive ability, which would then improve job performance. However, the potential fade-out of test scores described in section IV.B. casts some doubt on this mechanism. The evidence is strong enough that we still assign a 50% probability to this mechanism, assuming that while some measured effects fade out, some cognitive skills remain. We assign the other 50% of the probability to the impacts of education interventions on executive function, behavioral issues, social and emotional skills, or other mechanisms. These three causal mechanisms are not entirely distinct from each other, however we find the existing evidence for potential mechanisms to be grouped into these categories.
For each mechanism we need to establish whether education interventions cause the intermediate outcome, and whether the intermediate outcome leads to higher income. The state of the research for most of these mechanisms appears fairly sparse, with significant evidence available for only a few of the links.
Even if we assume that only the cognitive mechanisms are likely to generalize to new test-score boosting interventions, and take a lower end estimate of 10% for the impact of cognitive ability on income (described in section A below), we still get a replicability adjustment of 26%, which is higher than the 17% recommended in section II.
A. Cognitive ability
The economics of education literature generally assumes that cognitive ability is the main mechanism driving improvements in income (as discussed in Heckman et al. 2013). This is likely a result of evidence like the studies discussed in section I, where test score increases are linked to income increases. Many of these tests, especially those administered in the preschool studies and employed in some of the cross-sectional regressions, are more like cognitive tests than tests of knowledge. While this evidence provides some support for the idea that education interventions boost cognitive abilities, it only provides suggestive evidence for a causal link between cognitive abilities and income. Additional evidence for the impact of cognitive ability on income comes from three sources:
- Polygenic score studies try to consider siblings as a natural experiment where two people are randomly assigned genes that are linked to cognitive ability, while the environment and the expected effect of other genes is kept constant. Buser et al. estimate a genetically-caused standard deviation increase in cognitive ability will lead to 3-5 percentile higher income. In the United States this corresponds to 10% of earnings.
- Personality psychology studies find large correlations between intelligence and job performance (0.55), much smaller correlations between conscientiousness and job performance (0.2), and even smaller correlations between the other big five personality traits (~0.1) and job performance (Figure 16 in Almlund et al.). The higher correlation implies that the intelligence to job performance link is less likely to be driven by some third variable that is associated with both of them. This suggests that the cognitive ability mechanism is more plausible than the non-cognitive mechanisms proposed below.
- Lindqvist and Vestman examine the impact of personality traits and intelligence on the earnings of a full cohort of Swedish men using regressions with controls. They find a standard deviation of cognitive skill to increase income by 10%, and a standard deviation of non-cognitive skills (those discussed in sections B, C and D below) by 11%.
B. Executive Function
Executive function includes the ability to plan ahead, follow directions and pay attention. These skills are the second most likely causal mechanism for education interventions. The strongest evidence for this mechanism comes from the Project Star kindergarten study mentioned in section I.A. Chetty et al. find that even though test score gains seem to fade out by middle school, increases in measures of effort and initiative seem to persist. They estimate that these effects could account for roughly 30% of the increases in income they observe. Additional evidence that education interventions may boost executive function comes from evaluations of the impacts of the Building Blocks math curriculum. Meanwhile, weak additional evidence for the link between executive function and income comes from the personality psychology studies (mentioned in A above) linking conscientiousness to job performance and from a review of the positive impacts of soft-skill training programs on income. These effects are generally much smaller, and the evidence much weaker than it is for cognitive ability.
C. Behavioral Issues
The strongest evidence for behavioral issues serving as the causal mechanism comes from the Perry preschool study discussed in I.C. Heckman et al. 2013 attempt to decompose the causal mechanism between cognition, behavioral problems, and academic motivation. They find that 20% of the income effect can be explained by fewer behavioral issues, and none by the other factors. Additionally, a review of the literature finds that childhood aggression and in-school misbehavior are negatively correlated with adult income, while the Abecedarian study mentioned in II.C. found decreases in aggression among participants. However, this fairly weak evidence is undermined by the fact that a study performing regressions across five separate datasets finds that once controls are added, bad behavior seems to actually correlate with higher income.
D. Social and Emotional Skills
Social and emotional learning (SEL) involves developing awareness and control of emotions as well as interpersonal skills. The polygenic score paper discussed in section A above provides the strongest evidence for SEL as a causal mechanism. Buser et al. find that a one standard deviation increase in emotional stability leads to the same income increase as a one standard deviation increase in cognitive scores (around 10%). Additionally, the Chicago Preschool Study discussed in section I.C., as well as reviews of more recent preschool studies find these programs can boost SEL (although the evidence is somewhat mixed). The impacts of these programs on SEL tend to be small, and the evidence is weak overall, leaving SEL as the fourth most likely causal mechanism.
E. Other
Other proposed mechanisms include the impact of network effects from being around smarter classmates, as well as the screening hypothesis discussed in footnote 5. However, we find these mechanisms less likely than the above four in the context of interventions that generally focus on improving literacy and numeracy. The network effects argument seems to be undermined by the fact that many of the studies discussed above are randomized. The screening hypothesis appears more applicable to higher education, and is partly undermined by evidence from the GDP regressions in section I.E.
VI. Applying these recommendations to Imagine Worldwide
When we apply the above recommendations to our median recommended education charity, Imagine Worldwide, we estimate that it is 11x as cost effective as GiveDirectly at boosting well-being through higher income. Our top recommended education charity, Teaching at the Right Level Africa, is slightly more cost-effective due to its lower cost.
Imagine Worldwide (IW) provides adaptive software to teach numeracy and literacy in Malawi, along with the training, tablets and solar panels required to run it. They plan to fund a six-year scale-up of their currently existing program to cover all 3.5 million children in grades 1-4 by 2028. The Malawi government will provide government employees to help with implementation for the first six years, and will take over the program after 2028. Children from over 250 schools have received instruction through the OneBillion app in Malawi over the past 8 years. Five randomized controlled trials of the program have found learning gains of an average of 0.33 standard deviations. The OneBillion app has also undergone over five additional RCTs in a broad range of contexts with comparable or better results.
We discount the effect size according to the methodology proposed in III.A., expecting the effect at implementation to be somewhat smaller than the measured effect even though we have a fair amount of evidence for the precise intervention and context. We then evaluate the leverage to cost effectiveness that results from the government potentially taking over the program. Even though the government of Malawi has already announced their intention to take over the program at the UN we assign a 50% chance to the take-over happening fully as described in the CEA. Additionally, we assume that the effects of the program will decline over time to be no more cost effective than the average education dollar spent in Malawi. Lastly, we discount for the possibility that the program would have found sufficient funding without receiving Founders Pledge directed donations.
VII. Discussion
We believe the evidence and methodology discussed above address the major concerns around assigning income benefits to education interventions. The evidence is not strong enough to fully convince us on any individual point, or to be sure that the test score gains of a new intervention will predict income increases in the same way that they appear to for past interventions. However, the evidence for income effects is not fully convincing for any of the interventions investigated by GiveWell. We assign a conservative replicability adjustment of 17% to account for the limitations of the evidence in a consistent manner with these other interventions. This adjustment can be interpreted to mean that we believe we have sufficiently addressed all major concerns to conclude that it has at least a one-in-six chance of generating a 19% income increase.
The first concern about the strength of the evidence is that the long-term evidence from LMICs tends to address interventions different from those of our recommended charities and to use less-robust quasi-experimental techniques. However, we believe that the classroom studies from the US get closer to the interventions we are interested in, and in combination with the preschool studies provide more robust RCT evidence. The second concern is that the income effects we measure might come at the expense of those who did not benefit from the intervention. We believe that the cross-country studies of the impacts of test scores on GDP, in combination with studies of school reform in Chile, provide good evidence that effect sizes do not shrink when you consider the entire population of a country. A third concern is that many of these studies rely on small sample sizes, and are unlikely to replicate in a large program. We think that the large-scale programs in Chile and Columbia, as well as Raj Chetty’s work on a large school district in the US, alleviate these concerns. A fourth concern is that these studies might not be relevant to the specific context of a new intervention. We believe that the consistency of effect sizes across a broad range of countries in regressions of individual income on test scores, as well as the breadth of contexts in the other studies we examine, address this issue. Lastly, it may seem problematic that test scores are just one predictor of income effects, and that years of schooling or some difficult-to-measure underlying trait might be a better predictor. However, we believe that the evidence above shows test scores to be a reliable predictor, while this is far less clear for other candidates. Additionally, even if one day we find a better predictor, that does not undermine relying on test scores for now. Overall, the consistency of estimates of the income effects of interventions that boost test scores across a broad range of types of evidence provides the strongest support for comfort with our conclusion.
About Founders Pledge
Founders Pledge is a community of over 1,700 tech entrepreneurs finding and funding solutions to the world’s most pressing problems. Through cutting-edge research, world-class advice, and end-to-end giving infrastructure, we empower members to maximize their philanthropic impact by pledging a meaningful portion of their proceeds to charitable causes. Since 2015, our members have pledged over $9 billion and donated more than $900 million globally. As a nonprofit, we are grateful to be community-supported. Together, we are committed to doing immense good. founderspledge.com

This is really cool — I'm curating. I found the evidence compelling despite coming in with a kinda low prior. I like that I got to see the replies linked in the google docs at the top. I doubt many readers will do as thorough a review as the google doc replies, so I'm glad I got to see discussion in a different way.