Someone asked for an ELI5 explanation to help them grok "what the heck is this thing", so here is my attempt at a non-technical explainer.[1]
The high level idea is that this is supposed to be a flexible framework for evaluating head-to-head many different types of objects while not losing information where you don’t have to.
Here’s an example use case that Ozzie and I discussed IRL. [2]
Say that you want to create a framework to help evaluate how good various projects at CEA are compared to each other.
If you want to do head to head comparisons of objects (i.e. projects) that are quite similar (how much do we value this Forum post vs this other post? how valuable was EAGxBerlin vs. EAGxPrague?), it’s often somewhat easy to cache these out into the same ‘currency’ to do a reasonable approximation (e.g. karma / engagement, # connections).
But once you jump back to wanting to compare quite different objects (How many forum posts do we value relative to one EAGx?), you suddenly need to cache out into a whole other ‘currency’.
To solve this, people usually tend to try and convert everything into some sort of standard unit. e.g. 80,000 Hours might cache all of their programs out into ‘number of years of quality adjusted career speed ups bought per program’, or Giving What We Can into ‘USD moved to effective charities per program’. (These are made up for this example).
Some problems with the above approach include: (1) converting everything into the same hacky unit introduces much larger uncertainty ranges into your comparisons even when comparing similar-ish objects (forum posts or different EAGxs), and (2) is way less legible (what does an ‘adjusted speed up unit’ mean).
Suddenly, if you’re stuck with ‘# speed up years’ as your yardstick to do both the EAGxA vs. EAGxB comparison AND the ‘EAGxA vs. Forum post A’ comparison, you’re losing a ton of information in the first case.
So the core insight is, what if instead of converting everything into ONE currency and then using that currency to compare different objects…. what if actually you just treat every OBJECT as it’s own ‘currency’: i.e. relative value?
Imagine: a 4x4 matrix that contains as rows labelled as: EAGxA, EAGxB, Forum post A, Forum post B, and columns with the symmetric labels. The cells in the matrix indicate how much 1 [thing in column] is worth in terms of [thing in row]s, + the 80% CI. i.e. ‘how much do we value EAGxBerlin in terms of number of Forum post A’s’.
To populate this matrix, you can write a bunch of squiggle code to determine how much you value EAGxA vs. EAGxB (fairly small CI), Post A vs. Post B (small CI), and then one costly comparison between e.g. EAGxA v. Post A (large CI).
And now, notice you have all the information you need to fill out this matrix!
Notice especially you do not need to populate the EAGxB v. Post A, EAGxB v Post B, or EAGxA v Post B pairwise comparisons, you get those for free as long as your preferences are nicely transitive, comparable, etc.
This allows you to preserve the nice properties of being able to do a fairly robust EAGxA v EAGxB comparison, while letting you do more speculative comparisons too.
If you ever want to re-introduce ‘standard units’ like dollars or something (“we can’t just report how good all of CEA’s programs are in terms of # EAGxBerlin unit equivalents”), you can just add an ‘1 $’ object to the matrix above.
You might have other confusions like, “how do you create a set of these kinds of pairwise comparisons against each other in a robust way”, which I feel less equipped to answer.
(Ozzie pointed out privately that the above is a general challenge of value estimating using any units.)
As a disclaimer, this is not necessarily meant to represent what CEA as an organization does in our own internal evaluations — this is a toy example for learning!
Thought about this some more. This isn't a summary of your work, it's an attempt to understand it in my terms. Here's how I see it right now: we can use pairwise comparisons of outcomes to elicit preferences, and people often do, but they typically choose to insist that each outcome has a value representable as a single number and use the pairwise comparisons to decide which number to assign each outcome. Insisting that each outcome has a value is a constraint on preferences that can allow us to compute which outcome is preferred between two outcomes for which we do not have direct data.
I see this post as arguing that we should instead represent preferences as a table of value ratios. This is not about eliciting preferences, but representing them. Why would we want to represent them like this? At first glance:
If the important thing is we represent preferences as a table, then we can capture every important comparison with a table of binary preferences
If we want to impose additional constraints so that we can extrapolate preferences, preference ratios seems to push us back to assigning one or more values to every outcome
What makes value ratios different from other schemes with multiple valuation functions is that value ratios give us a value function for each outcome we investigate. That is, there is a one-to-one correspondence between outcomes and value functions.
Here is a theory of why that might be useful: When we talk about the value of outcomes (such as "$5"), we are actually talking about that outcome in some context (such as "$5 for me now" or "$5 for someone who is very poor, now"). Preference relations can and do treat these outcomes as different depending on the context - $5 for me is worth less than $5 for someone who is very poor. Because of this, a value scale based on "$5-equivalents" will be different depending on the context of the $5.
A key proposition to motivate value ratios, Proposition 1: every outcome which we consider comes with a unique implied mixture of contexts. That is, if I say "the value of $5", I mean ∑cP$5(c)V($5|c) where P$5 is the mixture of contexts implied by my having said "$5".
This means, if I want to compare "the value of $10m" to "the value of saving a child's life", I have two options: I can compare ∑cP$10m(c)V($10m|c) to ∑cP$10m(c)V(savelife|c) or I can compare ∑cPsavelife(c)V($10m|c) to ∑cPsavelife(c)V(savelife|c). These might give me different answers, and the correct comparison depends which applied context I am considering these options in.
A value ratio could therefore be considered a table where each column is a context and each row specifies the relative value of the given item in that context. Note that, under this interpretation, we should not expect xij=1xji, unless i=j. This is because items have different values in different contexts.
This can be extended to distributions over value ratios, in which case perhaps each sample comes with a context sampled from the distribution of contexts for that column of the table (I'm not entirely sure that works, but maybe it does). This can allow us to represent within-column correlations if we know that one outcome is x times better than another, regardless of context.
I don't think proposition 1 is plausible if we interpret it strictly. I'm pretty sure at different times people talk about the value of $5 with different implied contexts, and at other times I think people probably make some effort to consider the value of quite different outcomes in a common context. However, I think there still might be something to it. Whenever you're weighing up different outcomes, you definitely have an implicit context in mind. Furthermore, there probably is a substantial correlation between the context and the outcome - if two different people are considering the value of saving a child's life then there probably is substantial overlap between the contexts they're considering. Moreover, it's plausible that context sensitivity is an issue for the kinds of value comparisons that EAs want to make.
There's a lot here, and it will take me some time to think about. It seems like you're coming at this from the lens of the pairwise comparison literature. I was coming at this from the lens of (what I think is) simpler expected value maximization foundations.
I've spent some time trying to understand the pairwise comparison literature, but haven't gotten very fair. What I've seen has been focused very much on (what seems to me) like narrow elicitation procedures. As you stated, I'm more focused on representation.
"Table of value ratios" are meant to be a natural extension of "big lists of expected values".
You could definitely understand a "list of expected value estimates" to be a function that helps convey certain preferences, but it's a bit of an unusual bridge, outside the pairwise comparison literature.
On Contexts
You spend a while expressing the importance of clear contexts. I agree that precise contexts are important. It's possible that the $1 example I used was a bit misleading - the point I was trying to make is that many value ratios will be less sensitive to changes context, then absolute values (the typical alternative, in expected value theory) would be.
Valuing V($5)/V($1) should give fairly precise results, for people of many different income levels. This wouldn't be the case if you tried converting dollars to a common unit of QALYs or something first, before dividing.
Now, I could definitely see people from the discrete choice literature saying, "of course you shouldn't first convert to QALYs, instead you should use better mathematical abstractions to represent direct preferences". In that case I'd agree, there's just a somewhat pragmatic set of choices about which abstractions give a good fit of practicality and specificity. I would be very curious if people from this background would suggest other approaches to large-scale, collaborative, estimation, as I'm trying to achieve here.
I would expect that with Relative Value estimation, as with EV estimation, we'd generally want precise definitions of things, especially if they were meant as forecasting questions. But "precise definitions" could mean "a precise set of different contexts". Like, "What is the expected value of $1, as judged by 5 random EA Forum readers, for themselves?"
The only piece of literature I had in mind was von Neumann and Morgenstern’s representation theorem. It says: if you have a set of probability distributions over a set of outcomes and for each pair of distributions you have a preference (one is better than the other, or they are equal) and if this relation satisfies the additional requirements of transitivity, continuity and independence from alternatives, then you can represent the preferences with a utility function unique up to affine transformation.
Given that this is a foundational result for expected utility theory, I don’t think it is unusual to think of a utility function as a representation of a preference relation.
Do you envision your value ratio table to be underwritten by a unique utility function? That is, could we assign a single number V(x) to every outcome x such that the table cell corresponding to three outcomes pair (x,y) is always equal to V(x)/V(y)? These utilities could be treated as noisy estimates, which allows for correlations between V(x) and V(y) for some pairs.
My remarks concern what a value ratio table might be if it is more than just a “visualisation” of a utility function.
The value ratio table, as shown, is a presentation/visualization of the utility function (assuming you have joint distributions).
The key question is how to store the information within the utility function.
It's really messy to try to store meaningful joint distributions in regular ways, especially if you want to approximate said distributions using multiple pieces. It's especially to do this with multiple people, because then they would need to coordinate to ensure they are using the right scales.
The value ratio functions are basically one specific way to store/organize and think about this information. I think this is feasible to work with, in order to approximate large utility functions without too many trade-offs.
"Joint distributions on values where the scales are arbitrary" seem difficult to intuit/understand, so I think that typically representing them as ratios is a useful practice.
So constructing a value ratio table means estimating a joint distribution of values from a subset of pairwise comparisons, then sampling from the distribution to fill out the table?
In that case, I think estimating the distribution is the hard part. Your example is straightforward because it features independent estimates, or simple functional relationships.
Estimation is actually pretty easy (using linear regression), and is essentially a solved problem since 1952. Scheffé, H. (1952). An Analysis of Variance for Paired Comparisons. Journal of the American Statistical Association, 47(259), 381–400. https://doi.org/10.1080/01621459.1952.10501179
I wrote about the methodology (before finding Scheffé's paper) here.
I can see how this gets you E(valuei|comparisons) for each each item i, but not P((valuei)i∈items|comparisons). One of the advantages Ozzie raises is the possibility to keep track of correlations in value estimates, which requires more than the marginal expectations.
I'm not sure what you mean. I'm thinking about pairwise comparisons in the following way.
(a) Every pair of items i,j have a true ratio of expectations E(Xi)/E(Xj)=μij. I hope this is uncontroversial.
(b) We observe the variables Rij according to logRij∼logμij+ϵij for some some normally distributed ϵij. Error terms might be dependent, but that complicates the analysis. (And is most likely not worth it.) This step could be more controversial, as there are other possible models to use.
Note that you will get a distribution over every E(Xi) too with this approach, but that would be in the Bayesian sense, i.e., p(E(Xi)∣comparisons), when we have a prior over E(Xi).
I don't understand your notion of context here. I'm understanding pairwise comparisons as standard decision theory - you are comparing the expected values of two lotteries, nothing more. Is the context about psychology somehow? If so, that might be interesting, but adds a layer of complexity this sort of methodology cannot be expected to handle.
Players may have different utility functions, but that might be reasonable to ignore when modelling all of this. In any case, every intervention Ai will have its own, unique, expected utility from each player p, hence xpij=E[Up(Ai)]/E[Up(Aj)]=1/xpji. (This is ignoring noise in the estimates, but that is pretty easy to handle.)
FWIW I think the general kind of model underlying what I’ve written is a joint distribution that models value something like P(c|outcome)P(V|c,outcome)
If all we are doing is binary comparisons between a set of items, it seems to me that it would be sufficient to represent relative values as a binary - i.e., is item1 better, or item2? Or perhaps you want a ternary function - you could also say they're equal.
Using a ratio instead of a binary indicator for relative values suggests that you want to use the function to extrapolate. I'm not sure that this approach helps much with that, though. For example,
costOfp001DeathChance = ss(10 to 10k) // Cost of a 0.001% chance of death, in dollars chanceOfDeath001 = ss(-1 * costOfp001DeathChance * dollar1) // Cost of a 0.001% chance of death
does not tell me how many $ a 0.01% chance of death is worth; rather, it tells me how many times better it is than $1. Without a function f(outcome in $)->value, this doesn't enable a comparison to any other amount of dollars. We can, of course, add such a function to our estimation, but if we do then I think the function is doing much more than the value ratios to enable us to extrapolate our value judgements. Unless we have f(outcome2)=f(outcome1)*outcome2/outcome1, I don’t see how we can use ratios at all, but if we do have it then we’re back to single values.
The alternative approach seems to me to be to treat it as a machine learning problem - given binary value judgements, build a binary classifier that tells you whether item1 or item2 is better. I expect that if we had value ratios instead of binary comparisons we might do a bit better here, but they might also be harder to elicit.
If all we are doing is binary comparisons between a set of items, it seems to me that it would be sufficient to represent relative values as a binary - i.e., is item1 better, or item2?
Why do you think this is all we're doing? We often want to know how much better some items are than others - relative values estimate this information.
You can think of relative values a lot like "advanced and scalable expected value calculations". There are many reasons to actually know the expected value of something. If you want to do extrapolation ("The EV of one person going blind is ~0.3 QALYs/year, so the EV of 20 people going blind is probably..."), it's often not too hard to ballpark it.
Related, businesses often use dollar approximations of the costs of very different things. This is basically a set of estimates of the value of the cost.
I have little experience on quantifying value, so I don't feel that I have a relevant opinion about approaches to this topic. But improving our conceptual tools for this clearly seems valuable :)
I feel like a commonly occurring result would be that the comparison tables include contradictory properties.
If someone asked me about my relative preferences for apples, bananas and cherries, I think the chance would be significant that I give a 'contradictory' answer like
"5 cherries = 1 apple or 1 banana, but also 1 apple = 2 bananas". Using distributions might help, but I think a corresponding property of "tension between ratios" should still appear quite frequently.
It feels like a confusing property that one could get different results by converting to the final units, WELLBYs for example, in two steps instead of using a direct conversion. First translating everything to QALYs and then to WELLBYs would usually give different results than the direct path.[1]
Would the solution be to quantify all actions using their native units and then convert to the unit of interest without intermediate steps?
I can see a case for this. If we are highly uncertain, avoiding unnecessary mental steps is a good idea.
Possibly something like this is the best we can do as long as we cannot define an explicit utility function. Still, I would be interested whether relative value functions could be a tool that helps us resolve confusions in what we value?
I think that this is actually the additional information which having such a table adds compared to using a single central unit of comparison. If there were no path dependency, the table would be redundant and could be replaced by a single central unit (= any single line of the table). This makes me extra curious about the question of what this "extra information" really means? ↩︎
If people were doing it by hand, there could be contradictory properties, as you mention. But with programming, which we likely want anyway, it's often trivial or straightforward to make consistent tables.
> I think that this is actually the additional information which having such a table adds compared to using a single central unit of comparison. If there were no path dependency, the table would be redundant and could be replaced by a single central unit (= any single line of the table). This makes me extra curious about the question of what this "extra information" really means?
I think you might not quite yet grok the main benefits of relative values I'm trying to get at. I've had a hard time explaining them. It's possible that going through the web app, especially with the video demo, would help.
Single tables could work for very similar kinds of items, but have a lot of trouble with heterogeneous items. There's often no unit that's a good fit for everything. If you were to try to put things into one table, you'd get the problems I flag in the two thought experiments.
> Possibly something like this is the best we can do as long as we cannot define an explicit utility function To be clear, relative values, as I suggest, are basically more explicit than utility functions, not less. You still create explicit utility functions, but there's better support for appreciating some uncertain combinations, while storing other signal.
I think you might not quite yet grok the main benefits of relative values
Thanks for your reply, you are probably right.
Let my share my second attempt of understanding relative values after going through the web app.
'strict' relative values
If I did not overlook some part in the code, the tables created in the web app are fully compatible with having a single unit.
For every single table, one could use a single line of the table to generate the rest of the table. Knowing value(item)value(reference) for all item, we can use value(item1)value(item2)=value(item1)value(reference)/value(item2)value(reference) to construct arbitrary entries.
Between the different tables, one would need to add a single translation factor which one could then use to merge the tables to a big single table.
Without such a translation factor, the tables would remain disconnected (there could be a single unit for all tables, but it is not specified). Still, the tables could still be used to make meaningful decisions inside of the scope of each table.
If this is the intent of how relative values are meant to be used, my impression of their advantages is:
they are, in principle, compatible with a single value/utility function. One does not need to change one's philosophy at all when switching over from using a single unit for measuring value.
they allow for a more natural thought process when exploring the value of interventions
one can use crisply defined units at each step of one's research: "Person in city x of income y gets $1" can be distinguished from "Person in city x of income y gets $5" as necessary.
throughout the process, one will tend to work 'bottom-up' or 'top-down', that is for bottom-up, start out with very specific value-measures and expand their connections (via relative values / translation factors) to more and more abstract/general values (such as maybe WELLBYs)
If one feels that there is an unbridgeable gap between two currently non-connected groups of values, one can keep them as separate value tables and decide to add the connection some time in the future
thanks to using distributions, one can also decide to add a connection and use a very high uncertainty instead.
This version of relative values (let's call it "strictly coherent relative values according to Mart's understanding v2" or "strict relative values" for short) feels quite intuitive to me and also seems significantly similar to how givewell's current cost-effectiveness analyses are done (except that they do not create a value table with all-to-all translations and there being no/fewer distributions[1].)
Your link to the usage of relative values in Finance seems to me to be compatible with this definition of relative values.
Beyond 'strict' relative values
But, from reading your OP (and the recommended section of the video), my impression is that relative values are intended to be used to describe situations more general than my "strict relative values".
and also David Johnston's comments seem to refer to a much more general case.
For this more general version my 'strictness' equation
value(item1)value(item2)=value(item1)value(reference)/value(item2)value(reference)
would typically not be valid. Translated into David's notation, the 'strictness' equation would be
xij=x0j/x0i
where 0 is the reference value, and xij are the relative values comparing i and j.
David's
Note that, under this interpretation, we should not expect xij=1/xji,unlessi=j$. This is because items have different values in different contexts.
In such a generalized case, I think that the philosophical status of what entries mean is much more complicated.
I do not have a grasp on what the added degrees of freedom do and why it is good to have them. In my last comment, I kind of assumed that any deviation from strictness would be "irrational inconsistency" by definition. But maybe I am just missing the relevant background and this really does capture something important?
This impression is based on the 2023 spreadsheet. This might well be a mistaken impression ↩︎
Proof: Insert xij and xji into the 'strictness equation' and see that the results are the reciprocals of each other ↩︎
the tables created in the web app are fully compatible with having a single unit.
For every single table, one could use a single line of the table to generate the rest of the table. Knowing value(item)value(reference) for all item, we can use value(item1)value(item2)=value(item1)value(reference)/value(item2)value(reference) to construct arbitrary entries.
The problem here are the correlations. The function you describe would work, if you kept correlations, but this would be very difficult.
In practice, when lists are done with respect to a single unit, the correlations / joint densities are basically never captured.
If you don't capture the correlations, then the equation you provided would result in a value that is often much more uncertain than would actually be the case.
So my idea of 'strict relative values' turns out to be an illusory edge case if we use distributions and not numbers, and in practice we'll usually be in the 'generalized case' anyway.
I fear, my not-grokking the implications remains. But at least, I don't mistakenly think I fully understood the concept any more.
It is probably not worth the effort for you to teach me all about the approach, but I'll still summarize some of my remaining questions. Possibly my confusions will be shared by others who try to understand/apply relative value functions in the future
If someone hands me a table with distributions drawn on it, what exactly do I learn? What decisions do a make based in the table?
Is the meaning of each entry "How many times more value is there in item1 than in item2? (Provide a distribution)"?
Would one only use 'direct steps' in decision-making? How is "path dependency" interpreted?
usually, xij will just give a more precise distribution than a distribution one would get from xik∘xkj[1]. But it could also turn out that the indirect path creates a more narrow, or an interestingly different distribution[2].
what is the necessary knowledge for people who want to use relative value functions? Can I do worse compared to using a single unit by using relative values naively?
As you write, this is not really well-defined as one would need correlations to combine the distributions perfectly. But there should still be some bounds one could get on the outcome distribution. ↩︎
For example, it might totally happen that I feel comfortable with giving precise monetary values to some things I enjoy, but feel much less certain if I try to compare them directly ↩︎
Is the meaning of each entry "How many times more value is there in item1 than in item2? (Provide a distribution)"?
Yep, that's basically it.
Would one only use 'direct steps' in decision-making? How is "path dependency" interpreted?
I'm not sure what you are referring to here. I would flag that the relative value type specification is very narrow - it just states how valuable things are, not the "path of impact" or anything like that.
what is the necessary knowledge for people who want to use relative value functions? Can I do worse compared to using a single unit by using relative values naively?
You need some programming infrastructure to do them. The Squiggle example I provided is one way of going about this. I'd flag that it would take some fiddling to do this in other languages.
If you try doing relative values "naively" (without functions), then I'd expect you'd run into issues when dealing with a lot of heterogenous kinds of value estimates. (Assuming you'd be trying to compare them all to each other). Single unit evaluations are fine for small lists of similar things.
Would one only use 'direct steps' in decision-making? How is "path dependency" interpreted?
I'm not sure what you are referring to here. I would flag that the relative value type specification is very narrow - it just states how valuable things are, not the "path of impact" or anything like that.
After talking to GPT about this[1], I think that my concern is actually already covered by your
If people were doing it by hand, there could be contradictory properties, as you mention. But with programming, which we likely want anyway, it's often trivial or straightforward to make consistent tables.
and could be addressed to a large degree with a few automatized checks and a user interface (one could even auto-fill the table given the first line of entries by assuming ~maximum resulting uncertainty for the unknown correlations). I feel like this could be really helpful for reflecting on one's values if done right, or overwhelming if done wrong.
[GPTs answer includes a summary, so I'll leave out my prompt:] I see your point now. You're referring to a potential inconsistency in the triangle inequality context for relative values. Let's use a concrete example to explore this.
Suppose the relative value of 'chocolate' to 'vanilla' is given by a 90% credibility interval from 0.8 to 1.2, and 'banana' to 'vanilla' is from 1.0 to 1.5. This would imply that, based on your preferences for chocolate and banana ice cream relative to vanilla, 'banana' should have a relative value compared to 'chocolate' that lies within a certain range.
If, however, you then provide a wide 90% credibility interval for 'chocolate' to 'banana' (e.g., 0.2 to 5), it may seem inconsistent with the narrower ranges implied by the comparisons with 'vanilla'.
In this case, it may be that you need to revisit your estimates for 'chocolate' to 'vanilla' and 'banana' to 'vanilla'. If you feel a lot of uncertainty about 'chocolate' vs. 'banana', perhaps you also should feel more uncertainty about these options compared to 'vanilla' than you initially thought. You may have overestimated your confidence in these comparisons.
Alternatively, if you're confident in your estimates of 'chocolate' to 'vanilla' and 'banana' to 'vanilla', you may want to narrow down your 90% credibility interval for 'chocolate' vs. 'banana'.
In any case, it's a good point to keep in mind when building a relative value table. You want to be consistent in your uncertainty estimates across different comparisons. If there seems to be a contradiction, it's a sign that you may need to rethink some of your estimates. ↩︎
Okay, so maybe relative values are a more straightforward concept than I thought/feared :)
Yea, I really don't think they're complicated conceptually, it's just tricky to be explicit about. It's a fairly simple format all things considered.
I think that using them in practice takes a little time to feel very comfortable. I imagine most users won't need to think about a lot of the definitions that much.
This is a crosspost from the new Animal Welfare Alignment Newsletter by Anima International. You can subscribe on Substack if you are interested in following these efforts. Audio reading also available on Substack.
The goals of this post are to:
1. Raise a question I see as crucially important to the goal of aligning AI to animal welfare...
Hello! I'm Justin Portela. I got hired by GWWC to make YouTube videos after AI in Context did such a kickass job.
My channel is using that same cinematic, high-production value beauty to talk about everything in the EA universe that isn't AI.
...
“How long have you been v*g*n?”
This is one of the most common icebreakers at animal protection events. It’s a baseline assumption, and it mostly holds true: if you’re out advocating for animals not to be tortured or abused, realistically these days you are v**n, or close. And it makes for good conversation. It seems fairly safe to assume when you meet strangers.
But this assumption is hurting the movement in a way which we don’t always notice: someone new comes into the sp...
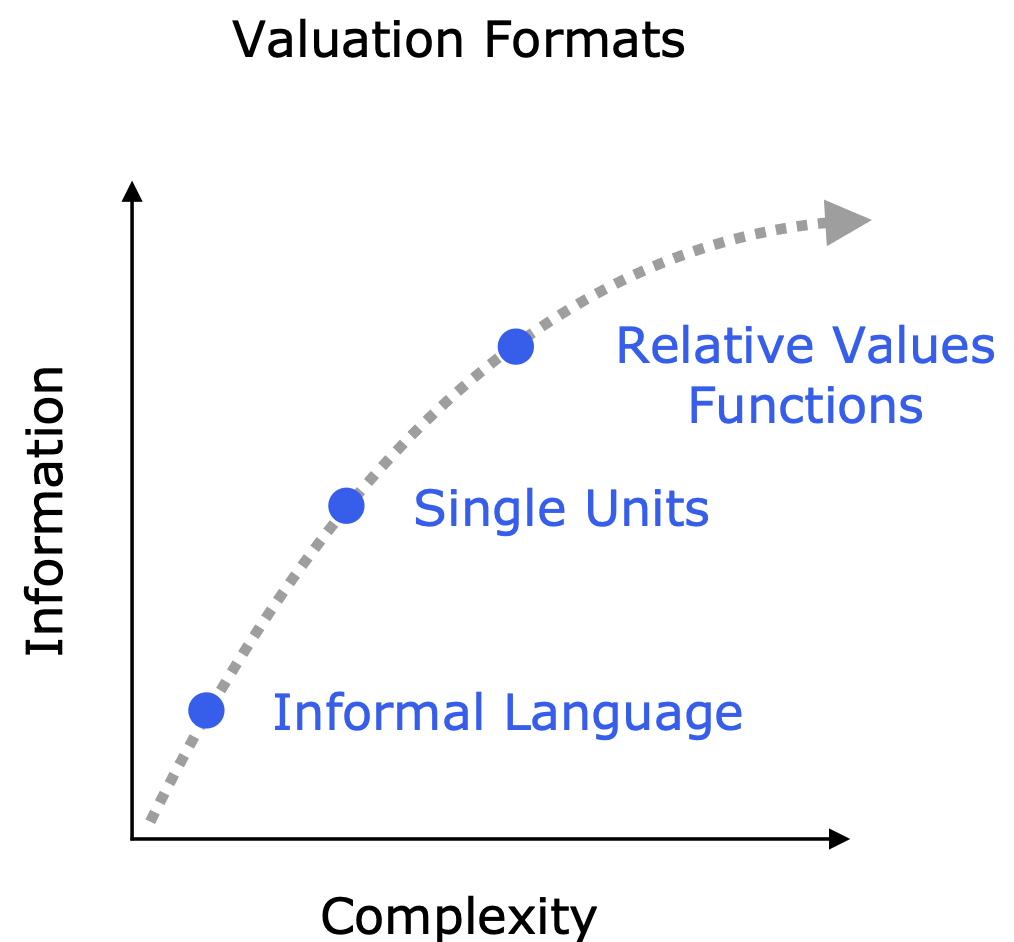
Quantifying value in a meaningful way is one of the most important yet challenging tasks for improving decision-making. Traditional approaches rely on standardized value units, but these falter when options differ widely or lack an obvious shared metric. We propose an alternative called relative value functions that uses programming functions to value relationships rather than absolute quantities. This method captures detailed information about correlations and uncertainties that standardized value units miss. More specifically, we put forward value ratio formats of univariate and multivariate forms.
Relative value functions ultimately shine where single value units struggle: valuing diverse items in situations with high uncertainty. Their flexibility and elegance suit them well to collective estimation and forecasting. This makes them particularly well-suited to ambitious, large-scale valuation, like estimating large utility functions.
While promising, relative value functions also pose challenges. They require specialized knowledge to develop and understand, and will require new forms of software infrastructure. Visualization techniques are needed to make their insights accessible, and training resources must be created to build modeling expertise.
Writing programmatic relative value functions can be much easier than one might expect, given the right tools. We show some examples using Squiggle, a programming language for estimation.
We at QURI are currently building software to make relative value estimation usable, and we expect to share some of this shortly. We of course also very much encourage others to try other setups as well.
Ultimately, if we aim to eventually generate estimates of things like:
The total value of all effective altruist projects;
The value of 100,000 potential personal and organizational interventions; or
The value of each political bill under consideration in the United States;
then the use of relative value assessments may be crucial.
Presentation & Demo
I gave a recent presentation on relative values, as part of a longer presentation in our work at QURI. This features a short walk-through of an experimental app we're working on to express these values.
The Relative Values part of the presentation is is from 22:25 to 35:59.
This post gives a much more thorough description of this work than the presentation does, but the example in the presentation might make the rest of this make more sense.
Challenges with Estimating Value with Standard Units
The standard way to measure the value of items is to come up with standardized units and measure the items in terms of these units.
Many health measure benefits are estimated in QALYs or DALYs
COVID activities have been measured in MicroCOVIDs
Let’s call these sorts of units “value units” as they are meant as approximations or proxies of value. Most of these (QALYs, Basis Points, Micromorts) can more formally be called summary measures, but we’ll stick to the term unit for simplicity.
These sorts of units can be very useful, but they’re still infrequently used.
QALYs and DALYS don’t have many trusted and aggregated tables. Often there are specific estimates made in specific research papers, but there aren’t many long aggregated tables for public use.
There are very few tables of personal intervention value estimates, like the net benefit of life choices.
Very few business decisions are made with reference to clear units of value. For example, “Which candidate should we hire?”, “Should we implement X feature?”, “Which marketing campaign should we go with”, etc.
Longtermist interventions are very rarely estimated in clear units. Perhaps partly because of this, there is fairly little quantified longtermist valuation.
If explicitly estimating value is useful, why is it so unusual?
We think one reason is that these "standard unit valuations" often miss out on a lot of critical information. They lack correlations or joint distributions. This deficiency leads to major compromises and awkward situations, causing human modelers to either give up or generate poor results.
We’ll go through two thought experiments to demonstrate.
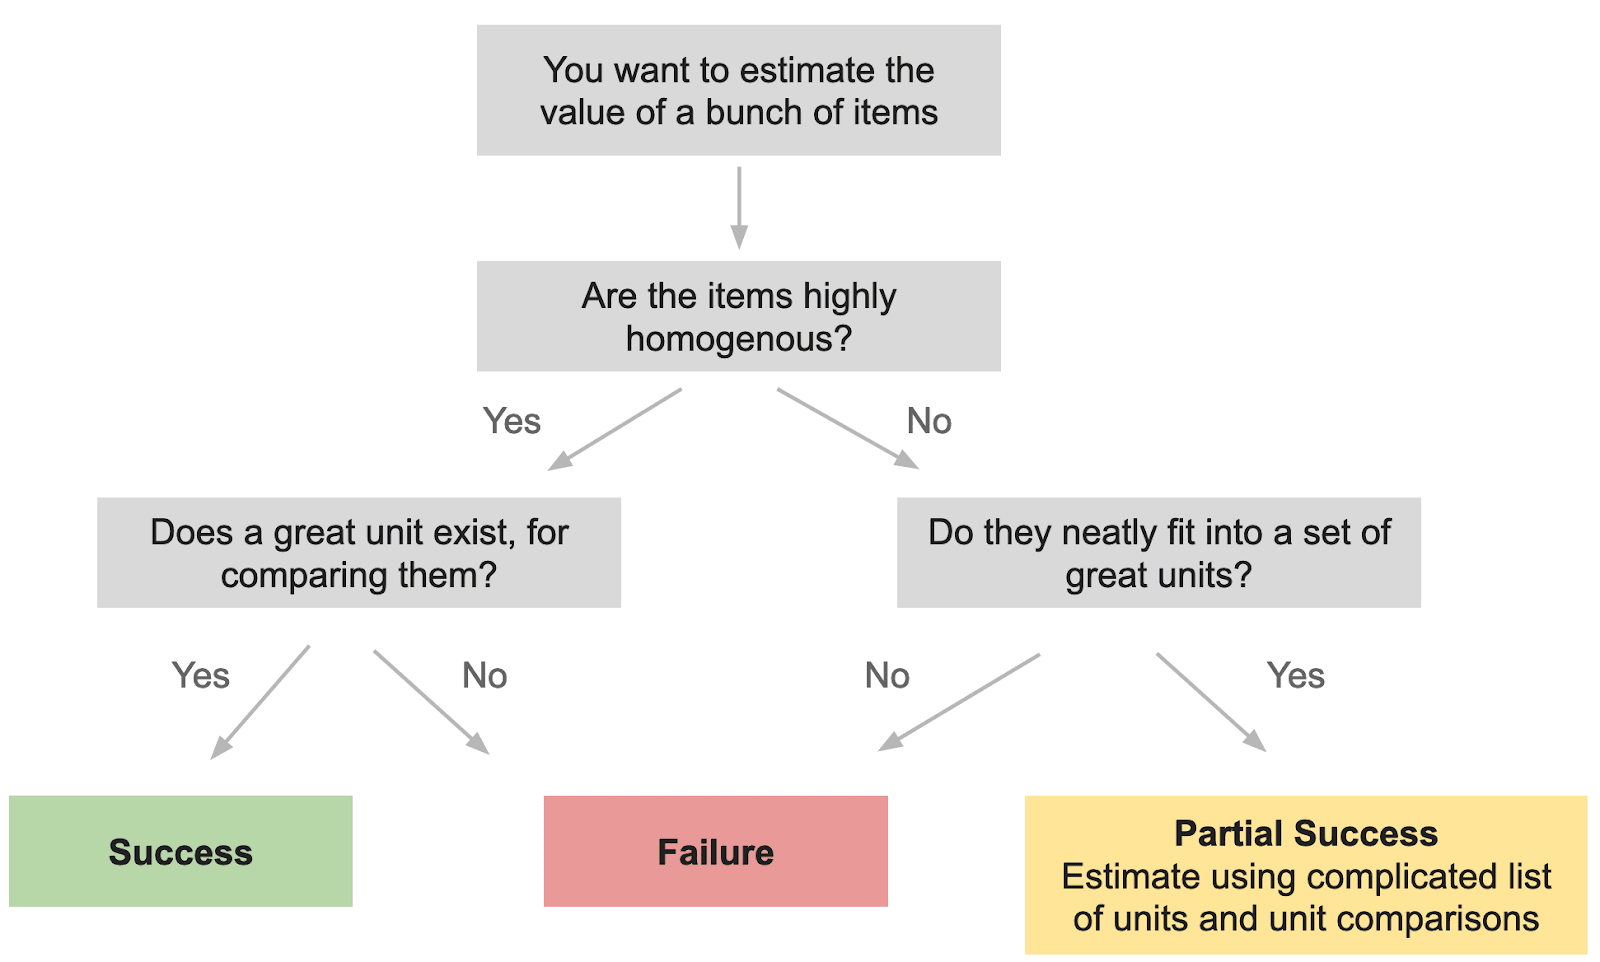
Thought Experiment #1: Comparing Research Documents
Let’s imagine using units to evaluate all scientific research. Where would we start? We could try to come up with some measure like, “a quality-adjusted research paper”. But papers about global health are very different from those on AI transparency. And papers are very different from books, presentations, or Tweets.
There’s an intense tradeoff between generality and complexity. On one hand, we could try to evaluate everything in terms of a few units, but then most of the estimates would be extremely uncertain. If we estimate everything in terms of “microdoom equivalents”, then our global health measures will be almost meaningless.
Alternatively, we could try to use 100+ units, with a huge rule book of which things can be evaluated in terms of which units. Subsequently, a distinct system would be required to convert these estimations into standard units for comparisons between clusters. Determining the optimal units prior to conducting the estimation is challenging, and altering the selected units after estimation would entail significant costs. Nuño outlined one related approach here.
So on the one hand, we could use one unit and get poor estimates. On the other, we could use a bunch of units but then need to enforce a lengthy, slow-moving, and still suboptimal ontology.
Below is a simple diagram to help demonstrate this decision process.
Thought Experiment #2: Dollars, in QALYs
How valuable is it for an average human to be given $1, in terms of a unit like QALYs? It’s very uncertain. First, people’s incomes vary a lot. Second, even when just referencing a specific person, it’s really tough to say how money converts to QALYs.
Let’s assume that we use distributions for estimation.
Suppose we estimate that $1 for an “average person” equates to a rough range of 0.001 to 100 (90% CI) “quality-adjusted life minutes”.
Is $5 better than $1? Not obviously, according to such a unit.
Our estimate for $5 might be “0.005 to 500”. However, without any information on the correlations between these two distributions, it is unclear if they are related.
Readers might assume we are unsure if $5 is more valuable than $1. Based on uncorrelated distributions, one might think that there’s a ⅓ chance the $1 has a higher value.
Lacking proper correlations, we cannot perform even simple arithmetic operations. Basic procedures like addition and division would yield distributions with significantly wider tails than what is accurate. (See Appendix 1 for an example)
This is not an isolated example. In practice, correlations are commonly found between interventions. Some research papers may be clearly more valuable than others, despite both being highly uncertain in terms of shared value units. The absence of correlation data can make certain decisions appear much more uncertain than they truly are.
Takeaways
We’ve discussed estimating value in standard units. This works for homogeneous items with highly relevant known units but breaks down if either the items are heterogeneous or if there’s no appropriate known unit.
A different option is the possibility of providing a set of units, with some conversion factors between them. This allows for the evaluation of more heterogeneous items but introduces substantial complexity.
Can value similar items?
Can value dissimilar items?
Imposed Structure
Single Unit
Yes, if unit exists.
Very poorly
Low. Just the choice of unit.
Set of Units
Yes, if unit exists.
Yes, if all elements fit well with units.
High. Many units, each for different sets of items.
As demonstrated in this table, both approaches have severe downsides.
Relative Values, with Value Ratios
Introduction
One solution to the downside of standard units is relative values: comparing items’ values directly to each other.
To be more specific, we suggest using the ratios of values of items, or value ratios. As with all ratios, these are unitless.
In practice, this works by having human modelers provide estimates for the ratios of every possible pair of items. This could be done by hand, but programming functions would make it scalable to large combinations of items. Storing estimates with programming code is unusual, but powerful.
Minor Aside: Value ratios are actually a generalization of using standard value units. In those cases, valuations are estimates in the format,
value(item)value(unit)
Instead, with value ratios, modelers could generate results for the ratios of any pair of items. This can of course include standard units, but it’s not limited to them.
value(item1)value(item2)
It’s important to use probability distributions instead of point values when dealing with heterogeneous and uncertain estimates. Different comparisons will have wildly different uncertainty ranges, and it’s important to represent this.
In the rest of this section, we’ll go over a concrete example, and then discuss the costs and benefits of this approach.
Comparison Tables
Say we want to compare the value of the following items:
$1
$5
A 0.001% chance of death
A 0.005% chance of death
Instead of creating one unit, let’s make a table of ratio comparisons.
Let’s imagine that we think that $5 is roughly (4.8 to 5) times as valuable as $1, and a 0.005% chance of death is roughly (4.9 to 5) times as bad as a 0.001% chance. Say we have some unit conversion, death_to_dollars, to convert a 0.001% chance of death to dollars. death_to_dollars is probably some very uncertain distribution, like (10 to 100,000).
Here’s a table where each cell is an estimate of the value of the row item, divided by the value of the column item. The top right triangle is just the inverse of the bottom left triangle, so is not fully shown. The diagonals are all exactly a point mass at 1, as they refer to an item's value divided by itself.
$1
$5
0.001% chance of death
0.005% chance of death
$1
1
1/(4.8 to 5)
-1*1/death_to_dollars
…
$5
4.8 to 5
1
…
…
0.001% chance of death
-1*death_to_dollars
-1*death_to_dollars*(4.8 to 5)
1
…
0.005% chance of death
death_to_dollars
-1*(4.9 to 5) *death_to_dollars /(4.8 to 5)
4.9 to 5
1
It might be rare for someone to want to know the value of $5 in terms of “0.001% chance of death”, but in this setup, viewers can access that if they want it. When they do, they’ll see that it’s very uncertain. But we still can see very well the close relationships between $1 and $5, and a 0.001% chance of death vs. a 0.005% chance of death.
It would now be straightforward to add more items to this list, like,
1 Micromort (a one-in-a-million chance of death)
The risk of death from a certain risky activity, like BASE jumping.
The total of both the health and financial costs of BASE jumping.
$1,000.00
Note that if we were to convert everything into “one unit”, that would effectively be one single row of the grid. If we were to try to use a few units, that would force us to split our list up into clusters. Items like “The total of both the health and financial costs of BASE jumping” might not fit well into any one cluster. But with the full grid, we don’t have these disadvantages.
Programming Functions
Manually constructing these tables is needlessly time-consuming. Coding simplifies this process. The majority of the task above involves the estimation of three variables and their appropriate reapplication—a task easily managed by software.
The key function we need is one with approximately the following type definition:
fn(id1, id2) => distribution
Such a function can easily generate the full table if desired, but often we just need a small subset of it.
Writing such functions doesn’t have to be very laborious. The key parts can be just a simple list of relationships. Here's some example pseudocode.
dollar1 = 1 // The value of $1. This is the unit, so we're marking as 1
dollar5 = dollar1 * (4.7 to 5) // The value of $5. Assuming (steeply) diminishing marginal returns
costOfp001DeathChance = 10 to 10k // Cost of a 0.001% chance of death, in dollars
chanceOfDeath001 = -1 * costOfp001DeathChance * dollar1 // Cost of a 0.001% chance of death
chanceOfDeath005 = chanceOfDeath001 * (4.7 to 5) // Cost of a 0.005% chance of death

... boilerplate code ...
We give a simple working example using Squiggle in Appendix 2.
"Functions as Estimates" are more generally a powerful mechanism to embed complicated beliefs. We believe this form deserves more attention, and intend to write more about them specifically in future posts. Relative value functions illustrate some of the possibilities of such an approach.
Specific Formats
There are multiple specific options in how to represent value ratios using probability distributions. Here are a few, each with a slightly different programming type definition.
Value Ratio (Univariate)
fn(id1, id2) => distribution
A single probability distribution meant to represent the quotient of two valuations. This is similar to the ratio form X/Y. Existing valuations that use standard units often use univariate value ratios.
The univariate format is very useful for presentation (i.e. showing to users). Even in more advanced cases, the X/Y univariate format will often be shown.
One important hindrance is that this format can be poor if the value of either compared item has probability mass at negative values, zero, or infinity. In those situations, bivariate or multivariate approaches are preferred.
Value Ratio (Bivariate)
fn(id1, id2) => (distribution, distribution)
A joint density of two probability distributions, meant to represent the ratios of two valuations. This is similar to the ratio form X:Y. These distributions are scale-invariant. For example, the ratio “5:8” is equivalent to the ratio “50:80”.
One downside with the bivariate approach is that it assumes the modelers broadly agree on which items have positive value and which have negative value. In the case of univariate distributions, this distinction is ambiguous, which can, in some situations, be preferable.
For example, say two modelers are comparing clean meat interventions. One modeler suspects that better clean meat work actually leads to net global harm, because of the net impact on insects. The modelers agree on the ratio of these two interventions, but one thinks they are both negative, while the other expects them to be positive. In this case, their univariate distributions could be very similar, but the bivariate distributions will be approximately inverted.
Value Ratio (Multivariate)
fn([id]) => [distribution]
A joint density of more than two probability distributions, representing the ratios of multiple valuations.
Depending on how value ratio programming functions are written, it could either be trivial to go from univariate outputs to multivariate outputs, or it might be very difficult.
Full multivariate distributions clearly have more information than the univariate or bivariate approaches, but it would take additional work to make good use of this information.
Advantages
High information storage capacity
The primary advantage of relative value formats is their ability to hold more information than simple lists of values in basic units. As stated above, a single unit would correspond to just a single row in a full value ratio comparison table; the rest is additional information.
In real-world decision-making, choices often involve comparisons between similar options. Whether it's a business comparing offerings from two appliance vendors or a donor choosing from a pool of researchers in a comparable field, these decisions often can be understood as relative values between similar options. The extra information that relative value formats provide is typically primarily around comparing similar items, so will be useful in these situations. This precision can guide decision-makers towards locally optimal decisions—a significant advantage in the grand scheme of things.
Ease of getting started
One of the major drawbacks of units is the frequent lack of an appropriate unit. An estimator might be ready to estimate the value of several items, but if they don’t know of a great unit to use for comparison, they might easily give up.
In contrast, with relative values, estimators just need to grasp some reasonable value definition. After they have done so, they can start doing the majority of the work by estimating the value of different projects against each other. Later on, if a great unit becomes popular, it would be easy to later add that unit to their estimated item list.
Arguably, units like QALYs should be treated as presentation methods rather than fundamental information storage mechanisms. Estimators shouldn’t need to worry about getting the units right upfront before doing the majority of their work, it should be easy to add conversions later to whatever formats/units viewers find most useful.
Composability
Multiple relative value functions, each pertaining to mostly different sets of items, can be combined using approximation, provided some overlap exists. This process of stitching may not be as accurate as a full function, but in many instances, the approximation could be accurate enough to be useful.
Thus, different parties can independently focus on items they find interesting, and their work can still be integrated into a larger system.
If attempted with units, this would necessitate sets of units, which would impose a lot of overhead and coordination.
Resiliency to different opinions
Differences in opinion often result in minor alterations in relative values. For example, two people may disagree on the value of climate change work versus nuclear risk work, but they are likely to agree on many of the relative values between specific climate change projects and between specific nuclear risk projects. In an extreme example, two people might disagree on if a set of things is harmful or beneficial, but still agree on many of the ratios.
Estimations using sets of units would be similarly robust if the clusters were very well-chosen (“climate change projects” vs. “nuclear risk projects”), but again, this would be a lot of work to get right.
Costs
Relative value functions as we describe them are very novel, so the upfront costs in particular will be expensive. The marginal work of writing the functions will likely require specialized labor.
We need infrastructure for storing and visualizing these functions.
Writing these functions takes knowledge of the right programming tools.
Complex relative value estimation can require large models, which can get very complicated.
Both estimators and audiences will need to become sophisticated in writing and understanding them.
It’s possible that with the advent of AI code generation, these costs can go down substantially.
Limitations
Relative value assessments serve as an advancement of cost-benefit analysis, so have the corresponding limitations of cost-benefit analysis. You can think of relative value functions as enabling tons of simple auto-generated cost-benefit analyses.
Requirement of clear counterfactuals
Cost-benefit analysis necessitates interventions with well-understood counterfactual scenarios. They work best with clear binary decisions. Estimating the net cost-benefit of electing one Presidential candidate over another or in relation to a probable outcome is feasible, yet one can’t evaluate a Presidential candidate's value in isolation. Similarly, the marginal utility derived from consuming a particular food item can only be comprehended when juxtaposed with a distinct alternative scenario.
Narrow definitions, particularly about notions of value
Cost-benefit analyses typically use incredibly narrow notions of value. There’s a very large set of ways to define and estimate value. Specific cost-benefit analyses typically either choose one or choose a very limited subset.
For example, these two following values could be wildly different. Estimating the relative value of a party in terms of that of microCovids, using Utility as the specification of value, will be very different than if you use a microCovid as the specification of value.
We can take the basic ideas of relative values and value ratios, and imagine even more ambitious efforts.
1. Passing in parameters
Instead of each passed-in relative value function parameter being a string representing a single item, we could allow for algebraic data types with continuous variables.
This function call is requesting a comparison of £52 of extra income, to a person with an income of £57,000, to a 12.3% chance of death, to a person who is 45 years old.
These input types can become arbitrarily detailed.
This sort of additional complexity would, of course, require more work for estimators, but the function API could be fairly straightforward.
Functions can also provide estimates for multiple specifications of value. For example, a function could estimate the value of an intervention as judged by either a US Republican voter or a US Democratic voter.
2. Handling combinations of items
Instead of taking in a set of specific items, functions can accept a set of lists of items.
Each input would represent the counterfactual value of the complete set of things. This is important because very frequently there is significant overlap between items.
In the above example, a user wants to calculate the ratio of value between the total of projects [1, 2, and 7], compared to that of projects [5 and 6]. If the modeler believed that projects 1 and 7 were completely replaceable with each other, then this would need to be taken into account.
Shapley values are one way of dealing with item value overlap, but programming functions like above would strictly represent more information. It would be easy to calculate Shapley values using complete functions, but there's not enough information to go the other direction.
This type definition would be difficult to provide very high-resolution estimates for. However, in many cases, simple approximations might still be good enough to be useful.
3. Forecasting
Value ratio functions could be neatly aggregated and scored, like other forecasting formats. There just needs to be some resolution mechanism for the scoring. This would likely require some panel to make subjective judgments.
4. Alternative input formats, for modelers
Functions are valuable for storage, but that doesn’t mean that all modelers need to directly write functions. There could be custom user interfaces that elicit estimates from people in other ways, and convert those into value ratio functions. There’s likely a lot of room for creativity in this area.
5. LLM Generation
With the proliferation of large language models, it seems feasible that such models could either assist in writing value ratio functions, or could do all of the work. In theory, it might be possible to use LLMs to approximate very large value ratio functions using existing online data, and then help use those for decision-making. This sort of format could be useful for clearly specifying value estimates otherwise stored in neural networks.
Tradeoffs and Conclusion
We can now expand the previous trade-off table to include relative values. Relative value formats do very well on the categories in the previous table, but have the new downside of requiring programming and infrastructure.
Def
How well can this value similar items?
How well can this value dissimilar items?
Imposed structure
Needs estimators to produce code?
Handles zeros and negative numbers
Single Unit
(id) => v(id) / v(unit)
Good, if unit exists
Bad
Low. Just the choice of unit.
No
Yes
Set of Units
(id) => v(id) / v(unit_i)
Good, if unit exists
Good, if all elements are covered by units
High. Many units, each for different sets of elements.
No
Yes
Value Ratios, Univariate
(id1, id2) => v(id1) / v(id2)
Very Good
Very Good
None
Yes
No
Value Ratios, Multivariate
(id1, id2) => [v(id1), v(id2)]
Very Good
Very Good
None
Yes
Yes
Later on we can go further, with even more complicated formats. But we think that relative value functions are a good tradeoff to aim for at this point, for groups interested in large-scale heterogeneous valuations.
Further Content
The following is background content that might be useful to some readers. We moved this to the end of this piece to highlight that it is optional.
Relationships to QURI’s previous work
Our work at QURI has involved developing ideas related to value estimation and forecasting.
In Amplifying generalist research via forecasting, a forecasting platform was used to predict generic evaluations by an expert. Similarly, forecasters can use value ratio functions as their direct predictions, with resolutions provided by experts or community panels evaluating a narrow subset of value combinations.
Five steps for quantifying speculative interventions described a workflow for using a set of units to value interventions and using conversion factors to compare interventions of different clusters. Relative values are a different alternative to this option.
Much of our recent work has been on Squiggle, a programming language meant to make estimates using things like relative estimates easy. We’re currently developing some tooling specifically for relative value estimation using Squiggle.
Related Topics
Relative Values in Finance
In financial valuation, relative values serve as an alternative to intrinsic values. These valuations are generally employed to compare a business or investment to a small group of similar alternatives.
The widespread popularity of relative valuations in finance highlights the potential utility of relative values more broadly. However, it is important to note that relative values in finance are typically applied within narrowly defined clusters, which contrasts with the extensive scope we propose when using relative value functions.
Discrete Choice Models
Discrete choice models, or qualitative choice models, serve as valuable tools for extracting preferences between different alternatives. These models have been extensively studied within the field of economics.
Typically, discrete choice models focus on eliciting preferences between a relatively small set of options from individuals who may not have engaged in extensive reflection on their preferences.
Relative value functions, in contrast, are meant primarily as a way to express one’s estimates of value. This can be the value to a collective, not an individual. For example, an estimator could build a relative value function that’s meant to estimate what “a committee of random members of group X would believe”. We could very much imagine the use of discrete choice models being used to inform and complement these estimates, but the relative value functions should provide a different set of information.
Combinatorial Prediction Markets
Combinatorial Prediction Markets have been suggested as one useful tool for scaling prediction questions. One approach to representing complex joint distributions for these formats is by using Bayesian Networks.
Arbitrary functions are more general than Bayesian Networks, which come with different tradeoffs.
Utility Functions
Many value unit tables can be regarded as utility functions. As utility functions, they would be partial (not accounting for all possible outcomes), explicit (as opposed to theoretical), and approximated.
The distinction between value and utility itself is often ambiguous, with different fields using different terminology. In some cases, the words are interchangeable.
It is plausible that numerous reasonable value tables would satisfy the completeness and transitivity criteria required by the Von Neumann-Morgenstern (VNM) utility theorem. If decision-makers were to employ value unit tables while considering expected values, these tables would frequently correspond to VNM utility functions.
All this to say, the techniques and limitations in this document apply to both explicit utility functions and other kinds of value formats.
Appendices
Appendix 1: Dollar Uncorrelated Example
If we treated these as uncorrelated, and used the ranges of (0.005 to 500) and (0.001 to 100), then a simple subtraction would result in
value($5) - value($1) -> -60 to 110 // from calculation
value($5) / value($1) -> 0.0015 to 17,000 // from calculation
But what we really want, if they were properly correlated is:
Let’s consider functions that produce value ratios. We are going to be doing this with Squiggle, a language for probabilistic estimation.
We want a function that takes two strings denoting two items, and returns their relative values:
fn(id,id) -> Distribution
To reach a function of that type, we start with putting the conversion factors of our previous table into code:
dollar1 = 1
dollar5 = dollar1 * (4.7 to 5)
costOfp001DeathChance = 10 to 10k // Cost of a 0.001% chance of death, in dollars
valueChanceOfDeath001 = -1 * costOfp001DeathChance * dollar1
valueChanceOfDeath005 = valueChanceOfDeath001 * (4.7 to 5)
We want to now make two changes to this:
Make sure we have a function that takes in two strings, and returns the corresponding variables. We do this by making a simple dictionary with the IDs as the keys, and the variables as the corresponding values. (Here, we use the same names between them.)
Make sure that all reused variables are done as Sample Sets. This makes sure that repeated values get divided out, or,xx=1.
ss(d) = SampleSet.fromDist(d) // Makes sure we use Sample Sets, which is important for correlations
dollar1 = 1 // The value of $1. This is the unit, so we're marking as 1
dollar5 = ss(dollar1 * (4.7 to 5)) // The value of $5. Assuming (steeply) diminishing marginal returns
costOfp001DeathChance = ss(10 to 10k) // Cost of a 0.001% chance of death, in dollars
chanceOfDeath001 = ss(-1 * costOfp001DeathChance * dollar1) // Cost of a 0.001% chance of death
chanceOfDeath005 = chanceOfDeath001 * (4.7 to 5) // Cost of a 0.005% chance of death

items = {
  dollar1: dollar1,
  dollar5: dollar5,
  chanceOfDeath001: chanceOfDeath001,
  chanceOfDeath005: chanceOfDeath005
}

fn(item1, item2) = items[item1] / items[item2]
//fn("chanceOfDeath005", "chanceOfDeath001")
That’s it. This function now can generate the full value ratio comparison table. Instead of needing 4x4 written comparisons, as we would with a written table, we just really need 4 lines of code (plus boilerplate and helper functions).
As one might expect, these can get significantly more complicated with scale. This specific setup above calculates all listed variables, which will be computationally impractical for functions that estimate large sets of items.
Acknowledgements
This is a project of the Quantified Uncertainty Research Institute. Thanks to Nuño Sempere and Willem Sleegers for comments and suggestions. Also, thanks to Anthropic's Claude, which was useful for rewriting certain sections of this and brainstorming terminology.


Someone asked for an ELI5 explanation to help them grok "what the heck is this thing", so here is my attempt at a non-technical explainer.[1]
The high level idea is that this is supposed to be a flexible framework for evaluating head-to-head many different types of objects while not losing information where you don’t have to.
Here’s an example use case that Ozzie and I discussed IRL. [2]
All mistakes are mine, and I'm writing in a personal capacity, not on behalf of my employer.
As a disclaimer, this is not necessarily meant to represent what CEA as an organization does in our own internal evaluations — this is a toy example for learning!