Introduction & Context
For this project, I collected and aggregated annual growth metrics from a wide range of EA and adjacent projects (14 projects total)[1]. My goals were to: (1) offer a first stab at understanding how various segments of EA are growing; (2) publish data on some core projects in the ecosystem to further the community’s understanding of the ecosystem.
This is an edited version of a memo I wrote for the Meta Coordination Forum[2]. All of the data underlying this post was collected in August, and thus some of the 2023 projections are now potentially out of date.
I had a fairly short deadline to finish this project, and many of the decisions I made on data collection + synthesis were constrained by my time budget. So I intended this post to be a data-driven starting point to further more discussion, but this is certainly not a full investigation of the question.
In general, while I conducted this investigation as part of my role at CEA, the findings here shouldn’t be interpreted as CEA’s opinion on this matter. Most of my colleagues didn’t engage with this memo prior to publishing this on the Forum, and may not necessarily agree with the bottom line conclusions.
Some global data notes:
- Most of the specific numbers reported in this post are ballpark estimates, as opposed to careful and precise numbers. In particular:
- I encouraged orgs to report ballpark numbers if easiest, and didn’t thoroughly check for data inconsistencies or obvious mistakes.
- I often estimated the 2023 projections myself when orgs didn’t provide them (often quite crudely — e.g. linearly extrapolating the data point I received from mid-August to cover the full year).
- I adjusted for seasonality especially for the most critical variables when possible, but did not do so consistently.
- Since seasonality is especially likely to distort the picture for effective giving metrics, when estimating growth rates within effective giving, I only use projected 2023 data from orgs if I have some way of adjusting for seasonality.
- I did not run this report by all the orgs who provided me with data before publishing, and so expect many of the metrics could be off or lacking context in important ways. This also means that programs who gave me data for this project do not necessarily endorse my conclusions about their projects.
- This includes CEA specific programs: Frequently, I estimated 2023 projected year end metrics for CEA programs myself, instead of asking program owners.
- I use projected 2023 data throughout this analysis, as opposed to the year to date numbers.
- 3 organisations whose data I initially used in this memo did not give us permission to publish their data in the public Forum post. I’ve redacted the names of those organisations from this post, but still include the metrics from these orgs when presenting the weighted averages reported throughout.
There are more detailed notes in the limitations and methodology sections below.
Summary chart
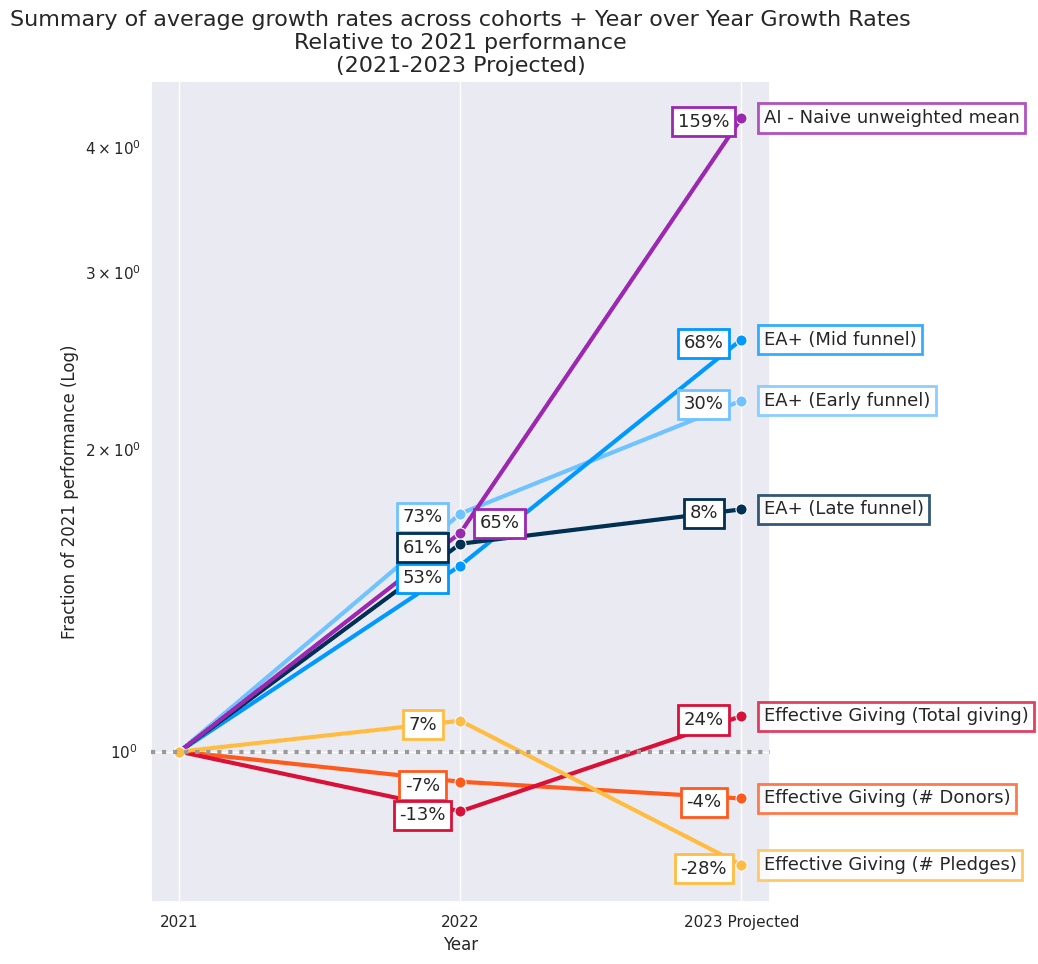
Here is a summary of the overall average growth rates reported by cohort in this memo.
This chart plots the year-over-year growth rates in each cohort, after normalising all metrics to start at 1 in 2021. For instance, this is suggesting that EA+ early funnel metrics grew by ~30% in 2023 relative to 2022.
Key takeaways
Early funnel[3] EA+ metrics are projected to grow by ~30% in 2023, compared to ~73% in 2022.
- Programs with unusually high growth:
- 80k newsletter (74% in 2023)
- Programs with unusually low growth, or that are decreasing over time:
- Google searches for the topic “effective altruism” (-21% in 2023), wikipedia views for the “effective altruism” page (-27% in 2023).
- CEA intro virtual program participants (-18% in 2023), EA newsletter # subscribers (-1%), EffectiveAltruism.org homepage daily page views (-3%)
- Some of these decreases are at least partially due to a spike in attention on EA during the FTX media cycle: e.g. the EA.org homepage saw 90k views in Nov 2022, compared to 37k views in Feb 2023. This general pattern also partially explains the Google and Wikipedia trends.
- I roughly weighted these metrics based on (1) the size of the program, and (2) how informative I thought this was re: tracking early funnel growth.
- Overall, I don’t think these growth rates are very sensitive to what weightings I chose (I go into more detail below).
Mid funnel EA+ metrics are projected to grow by ~68% in 2023, compared to ~53% in 2022.
- Programs with unusually high growth:
- Atlas fellowship high quality applications (91%). 2 other programs with high growth are redacted due to data sharing constraints.
- Programs with unusually low growth, or that are decreasing over time:
- CEA total virtual program participants (-11%), One for the World new givers during the year (3%), Animal Advocacy Careers job board users (-4%)
- I weighted these metrics using a similar strategy as the above.
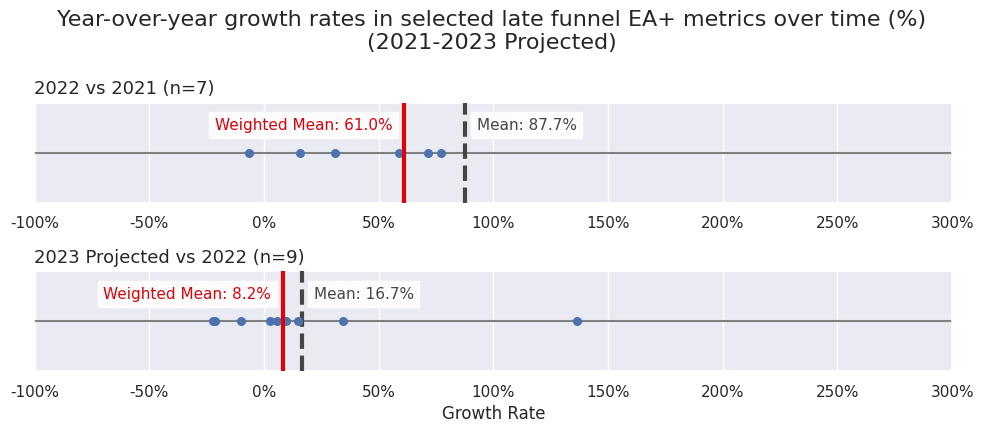
Late funnel EA+ metrics are projected to grow by ~8% in 2023, compared to ~61% in 2022.
- Programs with unusually low growth, or that are decreasing over time:
- Number of 80k 1on1 calls (2%), # total Atlas fellows (-10%), # non-unique EAG / EAGx attendees (-21% / -38%)
- One program I tracked had unusually high growth, but is redacted due to data sharing constraints.
- This decline is mostly tracking factors like the total number of EAG and EAGx attendees decreasing in 2023, as well as growth in EA Funds funding applications slowing down (10% growth in 2023, vs 77% in 2022).
- I think the late funnel results are much less meaningful than the early to mid funnel results — none of these metrics are “quality-adjusted”, which I expect is a much bigger deal for the late funnel. More discussion below.
- I weighted these metrics using a similar strategy as the above.
AI specific engagement metrics will likely grow faster than comparable EA specific engagement metrics in 2023.
- Public interest in AI safety / AI x-risk is projected to grow by ~200% in 2023, compared to ~88% in 2022. However, interest in “effective altruism” remains 1-2x higher in absolute terms for now.
- Google:
- Searches for the topic “Existential risk from Artificial General Intelligence”[4] are increasing by 269% in 2023, compared to 42% in 2022.
- Searches for the topic “effective altruism” are significantly higher in absolute terms (2.3x), but are decreasing by 21% in 2023, compared to increasing 186% in 2022.
- Wikipedia:
- Page-views for the “AI safety” + “x-risk from AGI” pages are increasing by 213% in 2023, compared to decreasing 9% in 2022.
- Views for “effective altruism” are slightly higher than views on the “x-risk from AGI” page (1.2x), but are decreasing by 27% in 2023, compared to increasing 231% in 2022.
- Google:
- Mid to late funnel AI safety / x-risk engagement appears to be growing by ~100-150% in 2023, although I might not have enough data to tell.
- The total number of 50+ karma LessWrong posts tagged “AI” is growing rapidly (102% growth in 2023, vs 143% in 2022).
- Another program redacted from this post has similarly been growing rapidly.
- Applications to the Long Term Future Fund are growing slower (27% growth in 2023, vs 111% in 2022).
- Note that I collected much less AI specific data (I only have data from 5 programs), as this was not the focus of the project.
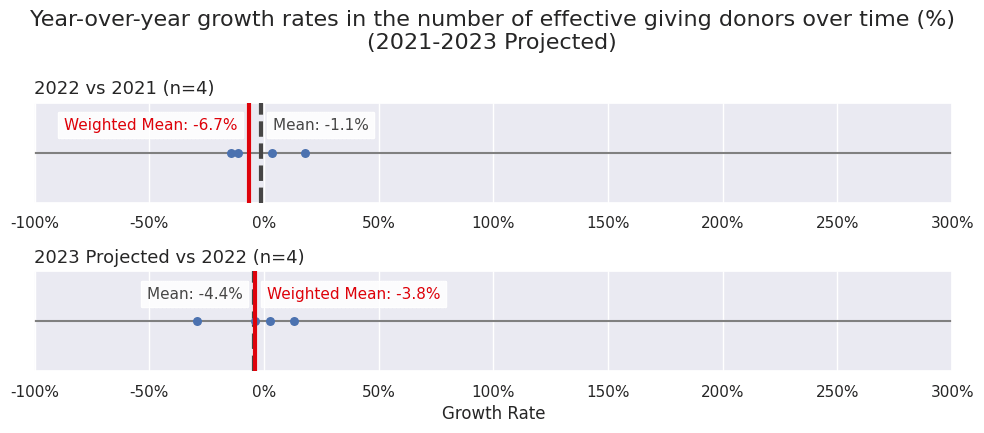
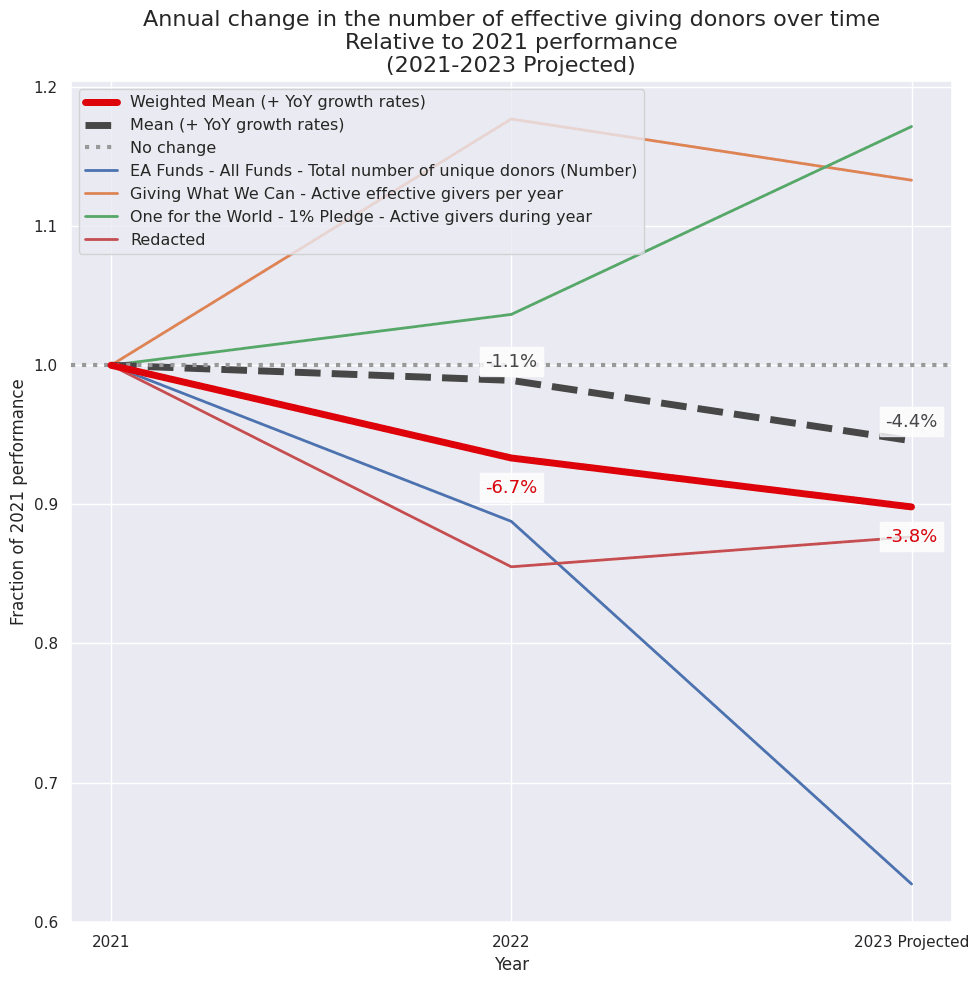
The total number of donors in the effective giving space is projected to decrease by ~4% in 2023, compared to a decrease of ~7% in 2022.
- Although note that in general, I spent much less time on collecting and aggregating effective giving metrics, since this was not the focus of the project.
- One large program has been redacted from this post due to data sharing concerns (but is still captured in the overall growth rates reported in these bullets).
- I weighted these metrics by the total expected number of donors per program in 2023.
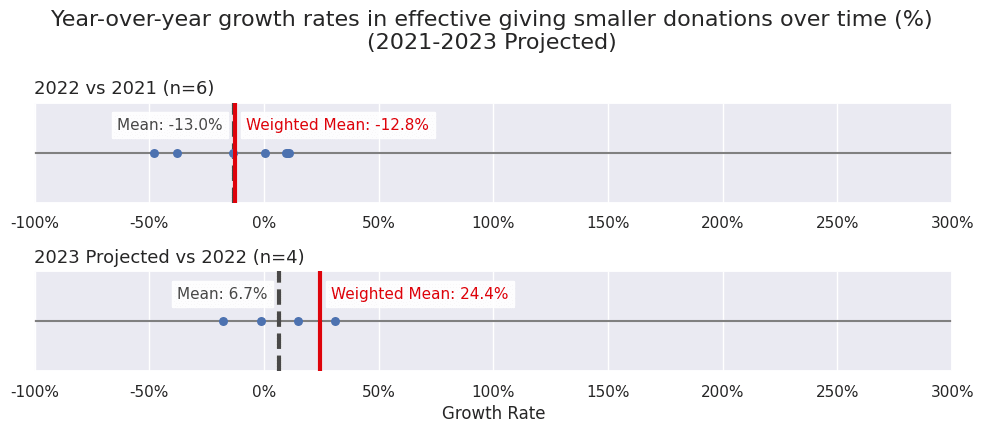
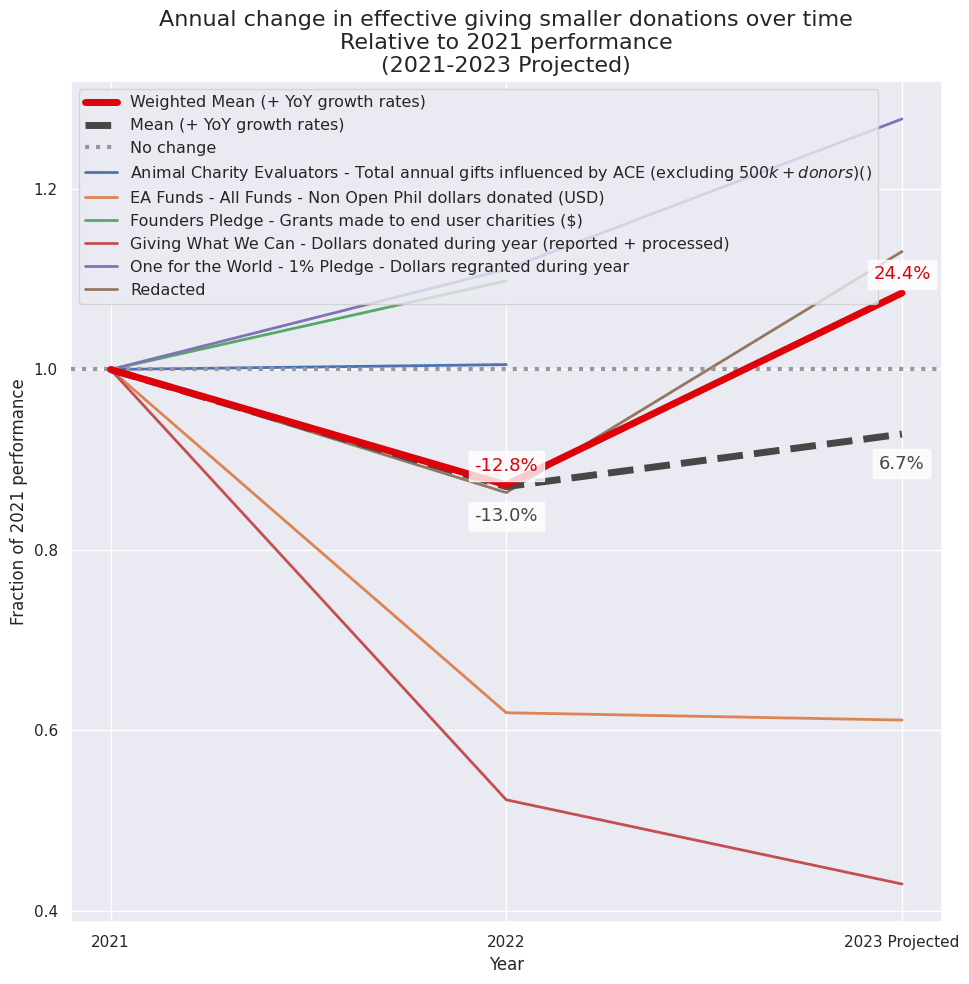
Total donations in dollars from small donors in the effective giving space is projected to increase by 24% in 2023, compared to a decrease of 13% in 2022.
- By “small donors”, I tried to exclude Open Philanthropy funding, and haven’t included historical FTX Future Fund funding in these data.
- But I am probably capturing some funding by medium to large donors outside of OP and FTXFF in this headline result.
- I weighted these metrics by the total funding per program in 2023.
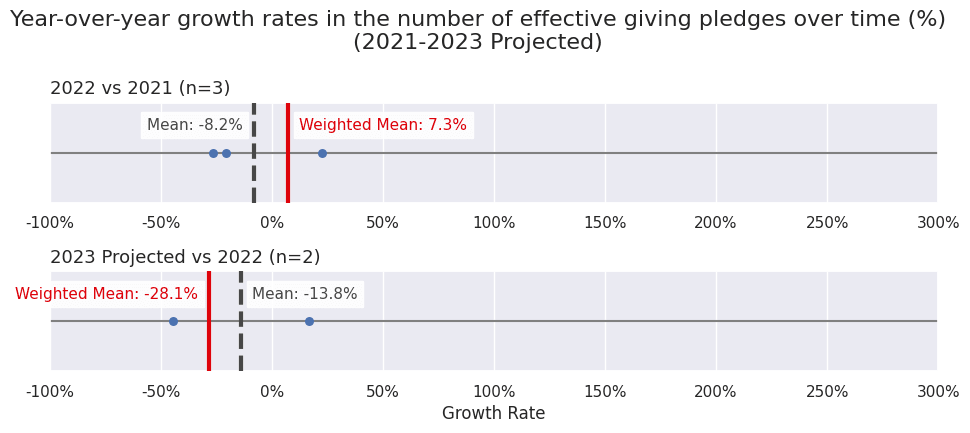
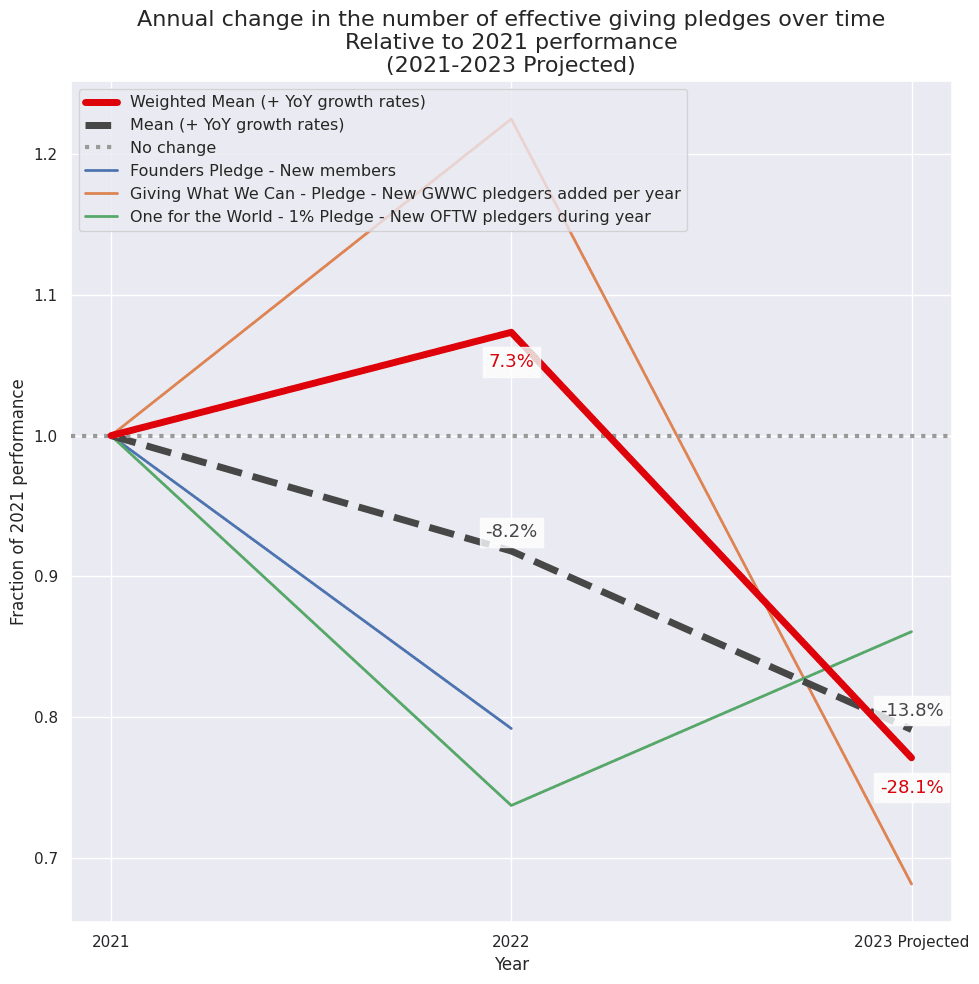
The number of new pledges in the effective giving space is projected to decrease by 28% in 2023, compared to an increase of 7% in 2022.
- This is primarily tracking Giving What We Can’s number of new pledgers added this year, which I am projecting will fall by 44% in 2023, compared to increasing by 22% in 2022.
- I’m not sure how much a decrease in new pledges caches out into in terms of future expected funding.
- For instance, in 2022 only 65% of the donations made via GWWC came from pledged donors, and in 2021 it was 58%.
- I weighted these metrics very roughly based on expected lifetime donations.
Below I discuss the results in more detail.
Early funnel
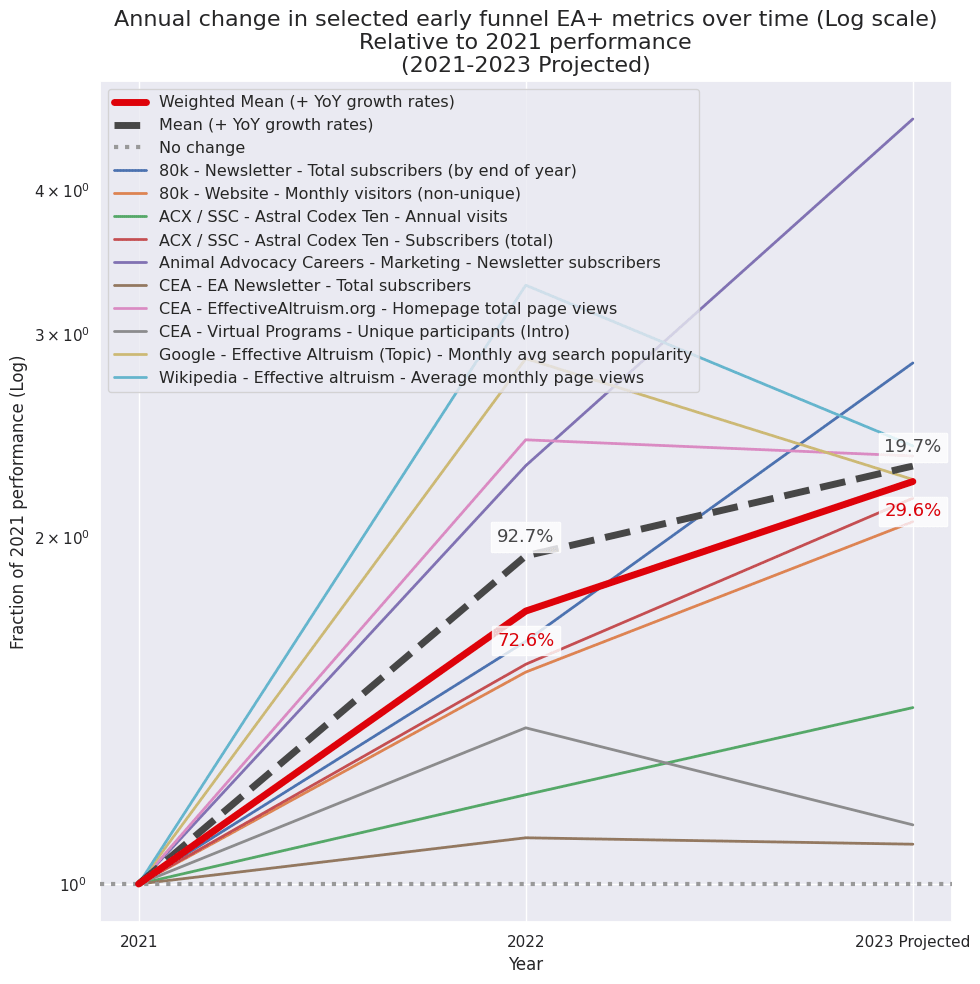
For this plot, I:
- Filtered the data to metrics which seemed (a) to track a lot of people, (b) informative on early funnel growth, and (c) where I had good quality data to report.
- I then weighted these based on a combination of: (1) the size of the program, and (2) how informative I thought this was re: tracking early funnel growth.
- Overall, I don’t think these growth rates are very sensitive to the specific weights I chose — see below for more info.
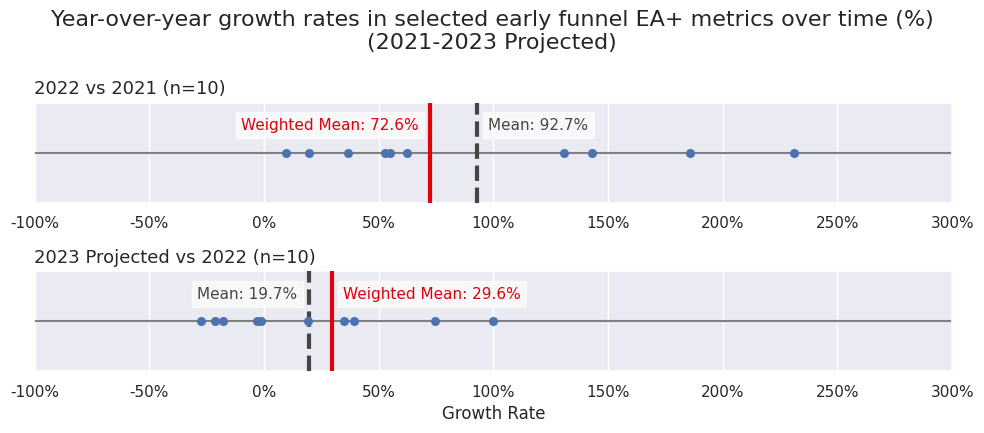
This chart shows how each metric has changed over time, after normalising all metrics to start at 1 in 2021. As you can see, in 2022 none of these metrics decreased, but in 2023 a couple of metrics started to fall.
All early funnel data
| Metric Overview | Data | YoY Growth | ||||||
| Org | Program | Metric | Weight | 2021 | 2022 | 2023 (Projected) | '22 v '21 | '23 v '22 |
| 80k | Newsletter | Total subscribers (by end of year) | 100.0 | 172,015 | 279,409 | 487,472[5] | 62% | 74% |
| 80k | Website | Monthly visitors (non-unique)[6] | 36.6 | 108,113 | 165,141 | 223,049[5] | 53% | 35% |
| ACX / SSC | Astral Codex Ten | Annual visits[7] | 35.9 | 18,456,231 | 22,061,858[8] | 26,259,431[9] | 20% | 19% |
| Effective Altruism (Topic)[10] | Monthly avg search popularity | 29.4 | 12 | 36 | 28[11] | 186% | -21% | |
| CEA | EA Newsletter | Total subscribers | 24.1 | 54,285 | 59,538 | 58,780[12] | 10% | -1% |
| CEA | Virtual Programs | Unique participants (Intro)[13] | 23.7 | 1,026 | 1,402 | 1,155[14] | 37% | -18% |
| CEA | EffectiveAltruism.org | Homepage total page views[15] | 16.4 | 170,376 | 414,064[16] | 400,904[17] | 143% | -3% |
| Wikipedia | Effective altruism | Average monthly page views | 9.8 | 12,447 | 41,208 | 29,882[18] | 231% | -27% |
| ACX / SSC | Astral Codex Ten | Subscribers (total) | 6.3 | 47,608[19] | 73,862[20] | 102,952[21] | 55% | 39% |
| Animal Advocacy Careers | Marketing | Newsletter subscribers | 1.2 | 1,300 | 3,000 | 6,000 | 131% | 100% |
| Mean | 93% | 20% | ||||||
| Weighted mean | 73% | 30% | ||||||
Reasoning behind the weights
- After selecting the metrics to investigate I ended up with a couple of buckets of metrics that were internally comparable:
- Newsletter subscriptions (80k, EA newsletter, ACX, and Animal Advocacy Careers)
- Website visits (80k, ACX, EA.org, Wikipedia pages related to EA+)
- Google search popularity for terms related to EA+
- CEA virtual program intro course participants
- To weight these metrics:
- Within each bucket, I:
- Estimated the sizes of each program in 2023 relative to each other,
- e.g. # subscribers the EA newsletter v.s. the 80k newsletters
- And then applied a subjective adjustment on top of this to account for some metrics being more informative to tracking EA growth rates
- e.g. I expect the change in visits to ACX over time is much less informative than # visits to the EA.org website, since the latter is much more directly about EA.
- Estimated the sizes of each program in 2023 relative to each other,
- This then allowed me to compare within each bucket, how informative the trend lines in e.g. 80k vs EA newsletter vs ACX subscribers was.
- I then roughly weighted these buckets against each other: e.g. estimating how informative a single visit to the 80k website was vs a single additional newsletter subscriber.
- This is inspired by a relative values approach as detailed here.
- Within each bucket, I:
- I attempted this exercise because initially I was worried that the approach of plotting the growth rates of many very different metrics against each other was incoherent, and perhaps the “real” early funnel growth rate might be extremely sensitive to what weights you chose for each metric.
- But in fact, even after trying out several different methods of weighting these metrics, I get pretty similar results.
- And as demonstrated above, even just taking the raw average over the metrics I chose gives you a pretty directionally similar result to the weighted average.
- So I don’t think the overall growth rates reported here are very sensitive to metric weighting, although I do think they are fairly sensitive to which metrics you choose to present / how you define ‘early funnel’.
- But in fact, even after trying out several different methods of weighting these metrics, I get pretty similar results.
For transparency, you can read the reasoning behind the weights I chose here, although as noted above I don’t think the analysis is very sensitive to these weights.
I’m presenting this mostly to give readers a sense of my approach, and so you can check how much we agree / disagree on these relative weights. In general, a lot of these weightings are pretty loosely held and based on rough heuristics.
Mid funnel
I used a similar approach in selecting and weighting metrics as with the early funnel plot.
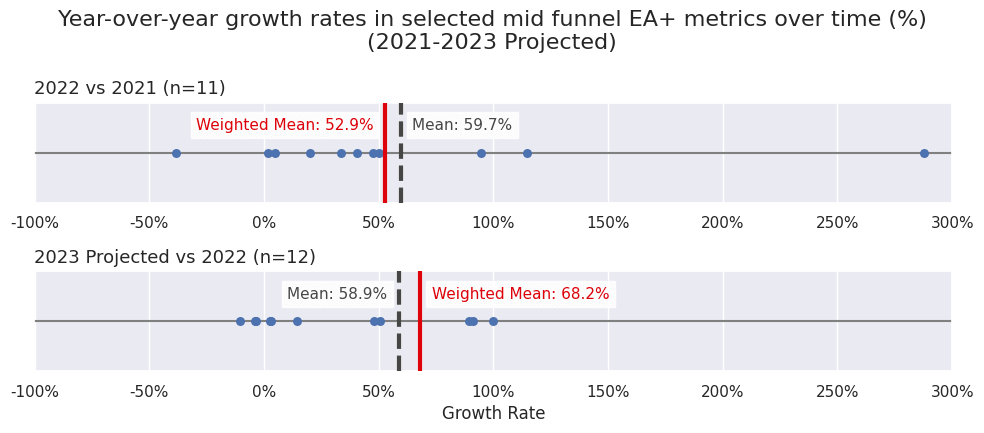
In the following plot, I only graphed metrics that had any baseline data in 2021, which excludes the trendline in Atlas applications.
But for the average and weighted average growth rates, I still used all the data I had in each comparison (i.e. I included Atlas in the 2023 vs 2022 growth rate averages).
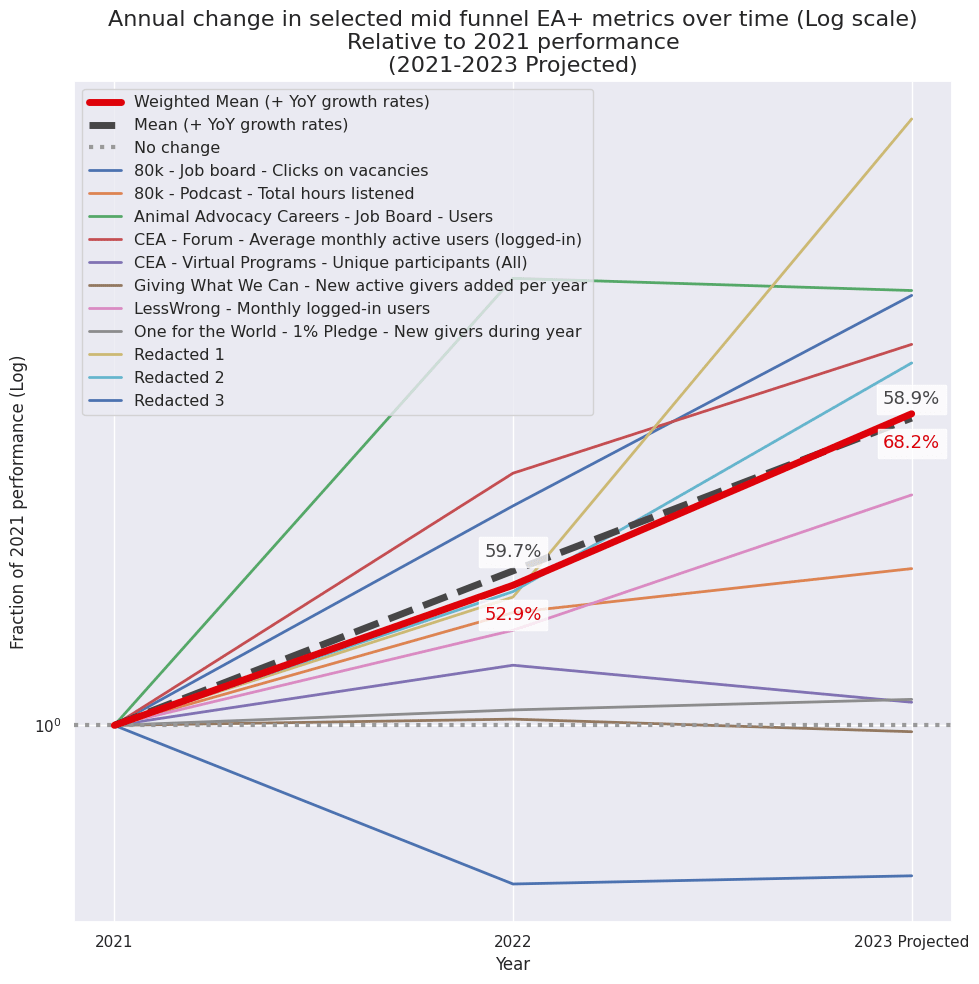
All mid funnel data
Three metrics are redacted from the following table due to data sharing constraints.
| Metric Overview | Data | YoY Growth | ||||||
| Org | Program | Metric | Weight | 2021 | 2022 | 2023 (Projected) | '22 v '21 | '23 v '22 |
| 80k | Podcast | Total hours listened | 290.0 | 186,550 | 262,597 | 300,000 [22] | 41% | 14% |
| 80k | Job board | Clicks on vacancies | 232.2 | 163,163 | 317,348 | 600,664[5] | 94% | 89% |
| CEA | Forum | Average monthly active users (logged-in)[23] | 100.0 | 1,630 | 3,500[24] | 5,173[25] | 115% | 48% |
| Giving What We Can | New active givers added per year | 74.6 | 5,618 | 5,725 | 5,511[26] | 2% | -4% | |
| Atlas | Fellowship | High-quality applications[27] | 73.2 | 2,475 | 4,730 | 91% | ||
| LessWrong | Monthly logged-in users | 70.2 | 3,610 | 4,815 | 7,259[28] | 33% | 51% | |
| CEA | Virtual Programs | Unique participants (All) | 18.8 | 1,510 | 1,812 | 1,620[29] | 20% | -11% |
| Animal Advocacy Careers | Job Board | Users | 15.5 | 5,353 | 20,751 | 20,000 | 288% | -4% |
| One for the World | 1% Pledge | New givers during year | 3.9 | 647 | 678 | 700 | 5% | 3% |
| Mean (includes the redacted metrics) | 60% | 59% | ||||||
| Weighted mean (includes the redacted metrics) | 53% | 68% | ||||||
Reasoning behind the weights
- I follow essentially the same strategy as in the early funnel section.
- After selecting the metrics to investigate I ended up with a couple of buckets of metrics that were internally comparable. I’ve bolded the metric I used as a comparison point below (the following list excludes metrics I can’t share due to data sharing constraints):
- Job board clicks: 80k job board clicks, AAC job board users
- Monthly active users: EA Forum, LessWrong
- New givers: GWWC new givers added per year, OFTW new givers during the year
- Atlas high quality applications
- Virtual Program all unique participants
- 80k podcast total hours listened
- To weight these metrics:
- Within each bucket, I:
- Estimated the sizes of each program in 2023 relative to each other
- and then applied a subjective adjustment on top of this to account for some metrics being more informative to tracking EA growth rates
- I then roughly weighted these buckets against each other. This is inspired by a relative values approach as detailed here.
- Within each bucket, I:
- I present the average and weighted average growth rates above.
- Again, I don’t think the overall growth rates are very sensitive to the weights I chose, and tried different variations with similar results. Because of time constraints, I have presented just the overall weights I ended up with in the table above, without my detailed reasoning.
Late funnel
I used a similar approach in selecting and weighting metrics as with the early + mid funnel plot.
The following figure does not plot metrics with no data in 2021. As such, it excludes metrics such as the number of EAGx attendees, since there were no EAGxs in 2021. Metrics with no data in 2021 are still included in the overall mean + weighted mean growth rates reported for 2023.
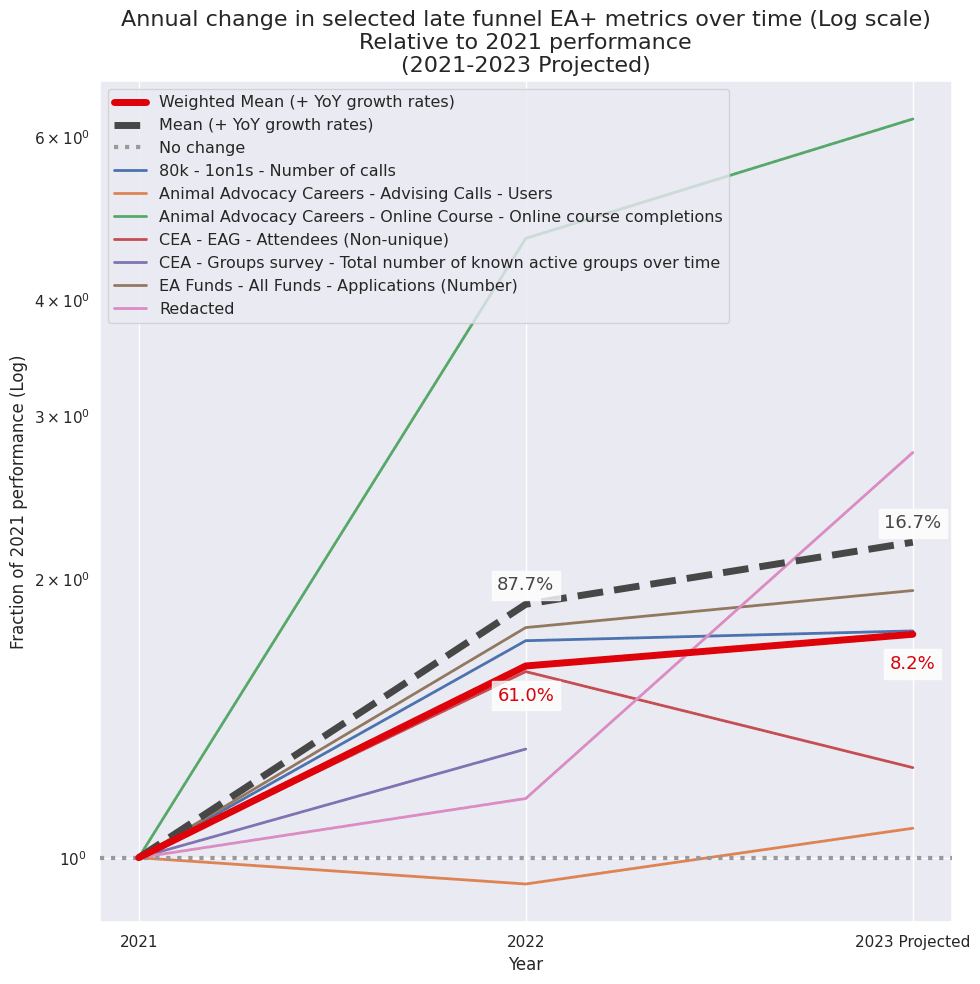
All late funnel data
1 metric is excluded from the following table due to data sharing constraints.
| Metric Overview | Data | YoY Growth | ||||||
| Org | Program | Metric | Weight | 2021 | 2022 | 2023 (Projected) | '22 v '21 | '23 v '22 |
| CEA | EAG | Attendees (Non-unique) | 100.0 | 2,583 | 4,102 | 3,231[30] | 59% | -21% |
| EA Funds | All Funds | Applications (Number)[31] | 79.4 | 1,016 | 1,800 | 1,974[32] | 77% | 10% |
| CEA | Groups survey | Total number of known active groups over time[33] | 61.0 | 276 | 362[34] | 31% | ||
| CEA | EAGx | Attendees (Non-unique) | 40.6 | 5,623 | 4,377[35] | -22% | ||
| Open Phil | Uni Group Organiser Fellowship | Applications | 33.8 | 265 | 280 | 6% | ||
| 80k | 1on1s | Number of calls | 18.1 | 831 | 1,425 | 1,460[5] | 71% | 2% |
| Animal Advocacy Careers | Online Course | Online course completions | 6.9 | 59 | 275 | 370 | 366% | 35% |
| Atlas | Fellowship | Fellows | 6.2 | 111[36] | 100 | -10% | ||
| Animal Advocacy Careers | Advising Calls | Users | 0.5 | 79 | 74 | 85 | -6% | 15% |
| Mean (includes the redacted metrics) | 88% | 17% | ||||||
| Weighted mean (includes the redacted metrics) | 61% | 8% | ||||||
AI
Compared to the funnel based analyses, the AI specific data we have are more sparse and track less similar categories of engagement. As such, I plot but don’t attempt to weigh the metrics below.
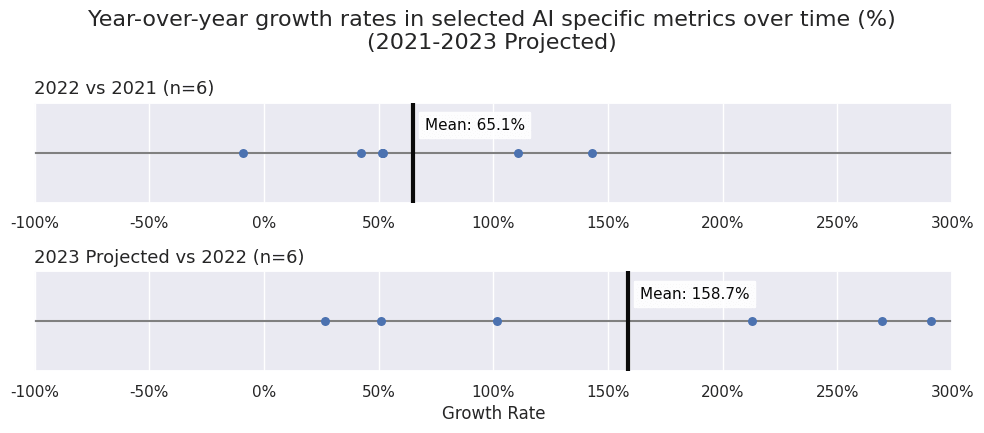
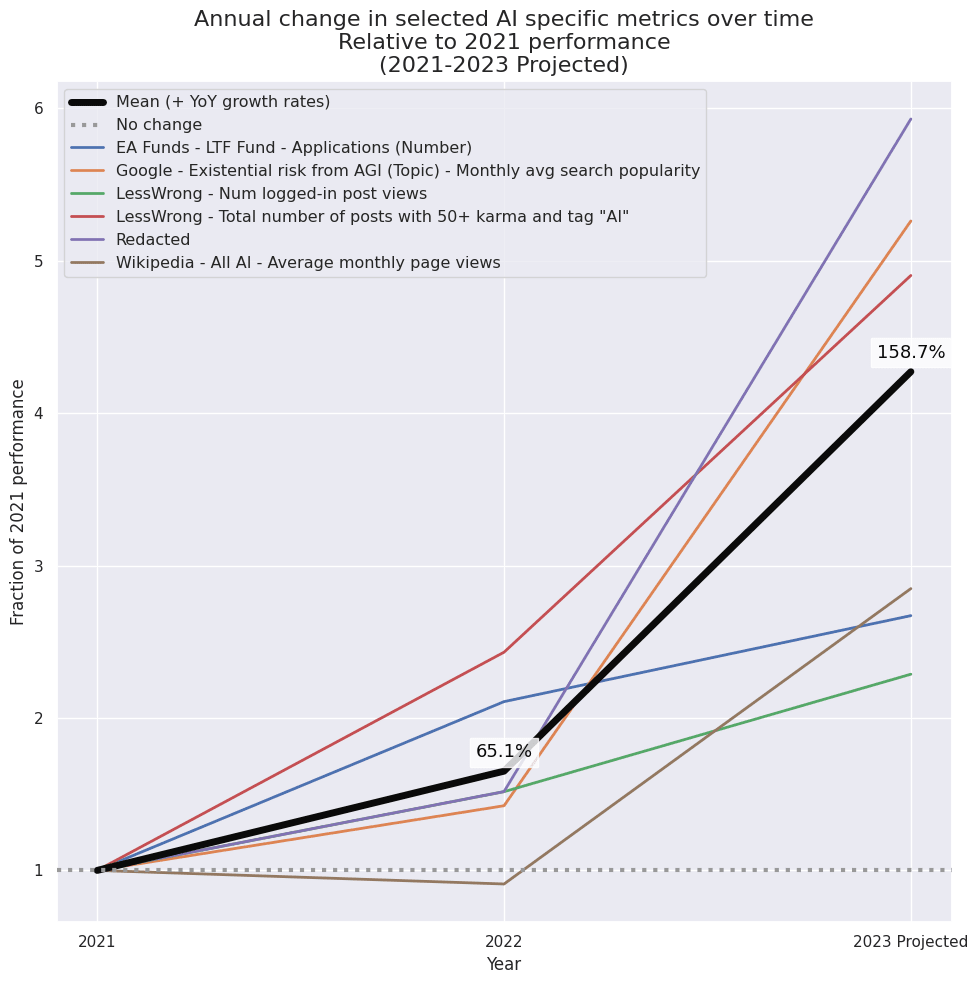
Here is a selection of other AI-relevant metrics that I considered when investigating this question. Note that I’ve redacted metrics relating to one program due to data sharing constraints.
| Metric Overview | Data | YoY Growth | |||||
| Org | Program | Metric | 2021 | 2022 | 2023 (Projected) | '22 v '21 | '23 v '22 |
| EA Funds | LTF Fund | Applications (Number)[31] | 391 | 824 | 1,045[32] | 111% | 27% |
| EA Funds | LTF Fund | Grants - Total (Number)[37] [31] | 98 | 350 | 272[38] | 257% | -22% |
| EA Funds | LTF Fund | Grants - Total (USD) [37] [31] | $5,297,671 | $9,316,431 | $8,369,249[38] | 76% | -10% |
| Existential risk from AGI (Topic)[39] | Monthly avg search popularity | 2 | 3 | 12 | 42% | 269% | |
| LessWrong | Num logged-in post views | 1,364,477 | 2,069,155 | 3,120,961[40] | 52% | 51% | |
| LessWrong | Total number of posts with 50+ karma and tag "AI"[41] | 227 | 552 | 1,113[42] | 143% | 102% | |
| Wikipedia | All AI | Average monthly page views[43] | 9,916 | 9,032 | 28,252[44] | -9% | 213% |
Effective giving
All effective giving data
Here’s a summary of all the data used in this section.
Since I have fairly comparable metrics across orgs within effective giving, I mostly just weighted each metric by size. For instance, under the “number of donors” section, One for the World reports 0.13x the number of donors compared to Giving What We Can’s number of active effective givers per year in 2023, and so I weigh the growth in One for the World donors 0.13x as much when estimating the overall growth rate.
I’ve redacted metrics relating to one program from the following chart due to data sharing constraints.
| Metric Overview | Data | YoY Growth | |||||||
| Org | Program | Metric | Weight | Weight adjustment from base metric | 2021 | 2022 | 2023 (Projected) | '22 v '21 | '23 v '22 |
| Number of donors (1 metric redacted) | |||||||||
| Giving What We Can | Active effective givers per year | 100.0 | Base metric | 11,433 | 13,457 | 12,954[45] | 18% | -4% | |
| EA Funds | All Funds | Total number of unique donors (Number)[46] [31] | 78.3 | 1.3x To account for this underestimating the total # of unique donors | 12,438 | 11,042 | 7,800[38] | -11% | -29% |
| One for the World | 1% Pledge | Active givers during year | 13.1 | 1x | 1,451 | 1,504 | 1,700 | 4% | 13% |
| Weighted mean (includes the redacted metric) | -7% | -4% | |||||||
| Total small donations (thousands of $USD) (1 metric redacted) | |||||||||
| Founders Pledge | Grants made to end user charities ($)[47] | 232.8 | 1x (used 2022 as a comparison point) | $61,000K | $67,000K | 10% | |||
| Giving What We Can | Dollars donated during year (reported + processed) | 100.0 | Base metric | $85,800K | $44,860K | $36,851K[48] | -48% | -18% | |
| EA Funds | All Funds | Non Open Phil dollars donated (USD)[49] [31] | 61.2 | 1x | $36,929K | $22,873K[50] | $22,573K | -38% | -1% |
| Animal Charity Evaluators | Total annual gifts influenced by ACE (excluding $1M+ donors) ($)[51] | 28.5 | 1x (used 2022 as a comparison point) | $8,318K | $8,363K[52] | 1% | |||
| One for the World | 1% Pledge | Dollars regranted during year | 6.3 | 1x | $1,800K | $2,000K | $2,300K | 11% | 15% |
| Weighted mean (includes the redacted metric) | -13% | 24% | |||||||
| Number of new pledges (approx. weighted by expected lifetime donations) | |||||||||
| Giving What We Can | Pledge | New GWWC pledgers added per year | 100.0 | Base metric | 1,219 | 1,493 | 831[53] | 22% | -44% |
| One for the World | 1% Pledge | New OFTW pledgers during year | 36.1 | 0.5x I expect OFTW pledgers donate significantly less in their lifetime | 697 | 514 | 600 | -26% | 17% |
| Founders Pledge | New members [47] | 10.7 | 2x This is a rough adjustment: I expect FP members will donate significantly more overall per person in their lifetimes, but perhaps they are less value aligned than GWWC pledgers on average? | 101 | 80 | -21% | |||
| Weighted mean | 7% | -28% | |||||||
# Donors
Total giving from smaller donors ($)
# Pledges
Limitations
At a high level, I would advocate using this as a general launching off point to start untangling which metrics are performing worse or better, but not draw strong conclusions from this data.
In general, I think the growth rates of the individual programs will probably serve as a better jumping off point for specific discussion.
In my opinion, some core weaknesses of this approach include:
The data is of highly varying quality throughout.
- I rely on a combination of: org reported specific data points, org reported BOTEC / rough data, my own attempts to extrapolate data into the future, public data, etc.
- Unfortunately, how confident I am in each metric isn’t always legible in my documentation, which is a weakness of this approach.
- In general, I would not trust the pinpoint data points reported throughout, and especially not the full year of 2023 projections.
I am measuring growth rates over messy, ill-defined categories.
- There doesn't seem to be a canonical definition of what early / mid / late funnel means, for instance.
I am often comparing different units.
- As an example, some of these metrics are explicitly about the number of users participating in a program (e.g. the # active EA Forum users), and some are about engagement (e.g. total views on the EA.org homepage).
- Also, some metrics track the cumulative total value of a metric over time (e.g. total number of Giving What We Can pledges, total subscribers to the EA newsletter), whereas some metrics track only what changes have been added per year (e.g. new GWWC pledges added per year, number of virtual program participants, number of 80k 1on1 calls).
- The growth rate in the cumulative total metrics will likely be more stable (small numbers change around more easily); h/t Lizka for pointing this out.
- I attempted to adjust for factors like this where possible, but didn’t prioritize doing a rigorous job here (and frequently were bottlenecked by data availability).
I only include programs that have existed since the start of 2022.
- This is primarily to have enough data to compare metrics over time and account for seasonal adjustments.
- But if you think that growth in EA / the ecosystem is primarily being driven by newer programs right now, I don’t have many good signals to capture this kind of growth.
These metrics likely capture overlapping populations, but I don’t know the size of the overlap.
- For instance, I can’t cleanly forecast the total number of effective donors in 2023, because it seems fairly likely that a very similar set of people will donate via GWWC, ACE, etc.
- This double-counting problem is a general problem even within orgs / projects — 80k and CEA, which are some of the biggest orgs represented, likely have many users that participate in multiple programs reported. I ran out of time to address this double-counting problem for this memo, but might turn back to it at some point.
- I expect work like the EA Survey or the Open Phil longtermist CB survey will be significantly more valuable for counting e.g. the total number of people late in the funnel, in part because it can bypass this double-counting problem.
I don’t include any good “quality-adjusted” metrics, which is more of a problem near the bottom of the funnel.
- I expect once you get close to the “late funnel”, for most practical cases, the specifics of how each person is engaging with a program becomes much more important than the raw number of people participating in a program. E.g. some applications to the EA Funds are likely to be much more impactful than others, but this approach effectively weighs all applications equally. Moreover, there are fewer datapoints in the bottom of the funnel, so variations in the count of various metrics means less.
- For the most part, this is out of the scope of this report.
Methodology
What data did I collect and why?
When deciding on the metrics I wanted to collect, I made a list of:
- Large EA relevant projects,
- Non-EA projects that carried some interesting signal about a different segment of the community (e.g. ACX, Atlas),
- A few cause-specific orgs as a comparison point (although this wasn’t my focus point)
I ended up using some level of data from 14 organisations / projects:
- 80,000 Hours
- Astral Codex Ten
- Animal Advocacy Careers
- Animal Charity Evaluators
- Atlas
- CEA
- EA Funds
- Giving What We Can
- LessWrong
- One for the World
- Open Philanthropy
- 3 other projects that are redacted from this report due to data sharing constraints
I also relied on publicly reported data from:
- Founders Pledge (partial)
- Google search popularity results
- Wikipedia page views
Unfortunately I had to drop 3 other projects I initially considered from the analysis because I didn’t have at least 2 full years of data from them. I also reached out to ~6 other projects who either did not respond or declined to participate in this project.
How did I estimate 2023 projected values?
I followed this rough preference order when forecasting 2023 projected values per metric:
- Whenever provided, I deferred to the projections provided by orgs (even when they were rough ballpark numbers).
- If an org did not provide a 2023 projection, but they did have numbers for year-to-date (YTD, Jan-now) AND it was possible to determine what the equivalent 2022 (YTD) was, I usually tried to account for seasonal effects by estimating:
- For instance, if I have an org reports that they received:
- USD$2 million in 2022 total
- USD$1.5 million by this time last year in 2022
- USD$3 million in 2023 YTD
- I would forecast a 2023 projected year end value of [3 million] x (2 million / 1.5 million) = USD$4 million.
- For instance, if I have an org reports that they received:
- Otherwise, in most cases I linearly extrapolated the 2023 YTD value to cover a full year of data.
- In the above example, if an org reported 2023 YTD values on July 1st 2023 (around the half-year mark), I would forecast a projected 2023 year end value of [3 million] x [365 / days_elapsed] = USD$6 million.
In some cases, I had enough information to try a different approach and would deviate from the above approach — for instance to estimate the total non-unique number of EAGx attendees in 2023, I summed up estimates for the number of attendees I thought would attend for each of the remaining EAGxs in the year.
I generally only forecasted 2023 projected values when I had some level of 2023 data to project from — so none of the 2023 projected values are based e.g. solely on 2022 data.
Acknowledgements
Thank you especially to the projects who generously provided me with the data required to conduct this project, and who then allowed me to publish this data on the Forum. That seems like a really valuable act of service to the community (as well as a win for transparency), and I appreciate it.
Thanks also to Michel, Oscar, Lizka, Ben and Max for giving me helpful feedback, as well as everyone who engaged with this memo as part of the Meta Coordination Forum. All remaining mistakes are mine.
- ^
In total, I aggregated data from 15 organisations: 80,000 Hours, Astral Codex Ten, Animal Advocacy Careers, Animal Charity Evaluators, Atlas, Centre for Effective Altruism, EA Funds, Giving What We Can, LessWrong, One for the World, Open Philanthropy, Founders Pledge, and 3 other organisations that are redacted from this report due to data sharing constraints. I also relied on publicly reported data from Google trends and Wikipedia page views. More information in the methodology section.
- ^
I slightly tweaked the value of two metrics relating to the ‘total giving from smaller donors’ section in 2022, based on some updated data. I also added another metric to the naive unweighted AI specific mean growth rates. 2023-10-26 update: I also tweaked one metric based on a comment from Rob Wiblin. Otherwise, the headline results in this post are identical to what was presented in the MCF memo.
- ^
The “funnel model” of effective altruism roughly categorises people’s EA engagement by depth of involvement. Generally speaking, I use the term “early funnel” to describe people who are starting to learn about effective altruism, and the term “late funnel” to describe people who are deeply engaged (h/t Peter Wildeford, who did a similar analysis in 2019). This categorization is pretty fuzzy, and I expect some readers will disagree with me on how to categorise specific programs.
- ^
This is a “topic”, and so covers a group of terms related to the general concept of x-risk from AGI in all languages. This seemed like the most relevant topic to examine after a short amount of experimentation. Unfortunately it’s a bit opaque to me exactly what search terms are covered under this topic and I couldn’t find an easy way to figure this out.
- ^
Unless otherwise specified, this and all of 80k’s 2023 projected metrics in this memo are found by calculating: [2022 total value] x ([2023 YTD value] / [2022 equivalent YTD value]).
For example, if we have 2023 YTD data for the total number of newsletter subscribers until Aug 1, 2023, we would calculate: [Total number of subscribers on Dec 31, 2022] x ( [Total number of subscribers on Aug 1, 2023] / [Total number of subscribers on Aug 1, 2022] ). This is to account for any seasonality effects.
- ^
Calculated by dividing the yearly figure with the number of months in that year.
- ^
Annual visits / views across all platforms. All numbers are approximate, and come from digitizing two underlying charts.
- ^
Based on data from Jan-end of Aug 2022. I then extrapolated this to cover the entire year period.
- ^
I extrapolated this from an average of the May 17-Aug 14 data we have for 2023. Bumped up 2023 projection by 5% to account for seasonality, since Q2-3 seem like significantly lower performing months (based on 2021, where we have a full year worth of data)
- ^
This covers all searches related to the topic of "effective altruism", not just that specific search term.
- ^
Assuming the monthly average stays the same
- ^
This hasn't changed much over the course of the year, so I'm predicting this will stay about the same -- i.e. that the number of new subscribers is about cancelling out the number of un-subscribers. The Newsletter is currently only advertised by word of mouth, on the effectivealtruism.org site, and in some programs (like Virtual Programs).
- ^
Includes only participants who have attended at least 1 session
- ^
VP participants have risen significantly recently. To estimate projected 2023 data, I assume that the Aug-Dec participant numbers will be the same on average as the August participant numbers. I then apply a downwards adjustment to adjust for unique participation.
Note: the VP team does not necessarily endorse this prediction, and I did not ask them for feedback before publishing this post.
- ^
This metric peaked significantly during the FTX media cycle: the EA.org homepage saw 90k views in Nov 2022, compared to 37k views in Feb 2023.
- ^
From around March 22nd until May 12th of this year, there was a technical configuration issue in our Google Analytics, which artificially reduced the page-views we were able to count (but as far as I understand otherwise did not affect the site performance).
To adjust for this: for March and May, I extrapolated the average views on unaffected days to a full month of data, and then for April I assumed that average daily pageviews were equal to the average of the adjusted March + May daily pageview estimates.
Note: the EA.org team does not necessarily endorse this prediction, and I did not ask them for feedback before publishing this post.
- ^
To scale from the [2023 YTD] value to a full year of data, I multiplied the 2023 YTD figure by a [2021 total] / [2021 equivalent YTD] scaling factor. This is to account for any seasonality effects. I used 2021 as a comparison, because 2022 was highly anomalous for EA.org pageviews.
Note: the EA.org team does not necessarily endorse this prediction, and I did not ask them for feedback before publishing this post.
- ^
Assuming the monthly average stays the same
- ^
We have data from March 2021, and then from June 2022. I assume the open thread grew linearly in this period to find the date. The linear growth rate doesn't seem terribly incorrect, based on the updated Aug 2023 data.
- ^
We have data from Aug 2023, and then from June 2022. I assume the open thread grew linearly in this period to find the date. The linear growth rate doesn't seem terribly incorrect, based on the updated Aug 2023 data.
- ^
We have data from Aug 2023, and then from June 2022. I assume the data continues to grow linearly until the end of the period.
- ^
2023-10-26 edit: Updated this metric based on Rob's comment.
- ^
A user is 'active' if they have viewed a post while being logged in at least once during the month. Here I report the average monthly active users across all months we have data on in a year.
- ^
We are missing some data in April and May this year. To adjust for this, when calculating the overall average, I assume MAU in April will be about the same as in March, and MAU in May will be about the same as in June.
- ^
To scale from the [2023 YTD avg MAU] value to a full year of data, I multiplied the 2023 YTD figure by a [2021 overall MAU] / [2021 equivalent YTD avg MAU] scaling factor.
This is to account for any seasonality effects -- MAU tends to rise slightly near the end of the year. I used 2021 as a comparison, because 2022 was a highly anomalous year for the forum.
- ^
Estimated number of cumulative active givers in 2023 - cumulative active givers in 2022.
To estimate the cumulative active givers in 2023, I multiplied the [2023 YTD cumulative active givers] by [2022 cumulative active givers] / [2022 equivalent YTD cumulative active givers], to adjust for seasonality.
- ^
Number of Atlas applicants with outstanding SAT/PSAT/ACT scores
- ^
Assume this will stay the same as the YTD numbers.
- ^
VP participants have risen significantly recently. To estimate projected 2023 data, I assume that the Aug-Dec participant numbers will be the same on average as the August participant numbers. I then apply a downwards adjustment to adjust for unique participation.Note: the VP team does not necessarily endorse this prediction, and I did not ask them for feedback before publishing this post.
Note: the VP team does not necessarily endorse this prediction, and I did not ask them for feedback before publishing this post.
- ^
Rough ballpark estimate from the EAG team.
- ^
The EA Funds team asked us to make clear that these numbers were compiled quickly and haven't been thoroughly checked. The 2023 numbers in particular are potentially quite out of date by the time of posting.
- ^
I just linearly extrapolated the 2023 YTD data to cover the whole of 2023 (I expect application data is less seasonal than grant data).
- ^
Based on the number of known active EA groups in 2020 vs in 2023, see FN 13.
- ^
As of Jan 2023, which seems like a good proxy for 2022 end of year data.
- ^
As of writing this post, there were 4 more EAGxs left in the year: Berlin, Australia, Philippines, and Virtual.
For Berlin, Australia and Virtual, I substituted with the number of attendees who attended in 2022. For EAGxPhilippines, I substituted with the number of attendees at a similar event.
- ^
Ballpark from the website.
- ^
Includes both grants paid out + those still being processed
- ^
To calculate this value, I first linearly extrapolate the original 2023 YTD data through Nov 2023. But then to account for the giving season, I assume that the December values will be 3x the existing average YTD value. I chose this 3x multiplier by looking at the spikes in e.g. comparable GWWC data, but this is a pretty rough heuristic.
For example, let’s suppose that EA Funds had told me they had 1,000 unique donors in 2023 as of Aug 31, 2023. This is an average of 4.13 unique donors a day in this period (242 days between Jan 1 and Aug 31). So I would have estimated the total number of donors in 2023 as: 1,000 + (4.13 x [days between Sept 1, 2023 and Nov 30, 2023]) + (4.13 x [31 days in December] x 3) = 1,756.
This is a pretty high uncertainty approach and I wouldn't be surprised if it was quite off. I would have tried a better approach if I had more time, but adjusting this at all for the giving season seemed better than using just a linear projection, which would have been more legible but also more obviously incorrect.
- ^
This covers all searches related to the topic of "existential risk from artificial general intelligence", not just that specific search term.
- ^
Linearly extrapolating from Jan-May data
- ^
These numbers are approximate and come from digitizing a plot. Note that this 50+ karma threshhold will selectively penalize older posts, from when LW had a smaller user base. So this is also partially tracking LW usage over time, not just the rise in 'high quality AI posts'.
- ^
Linearly extrapolating from Jan-Jun data
- ^
Total across the AI safety + x-risk from AGI pages
- ^
Assuming the average will stay the same for the year.
- ^
I estimate this in three steps:
1. First, I estimate the all time cumulative active givers figure by the end of 2023 as = [2023 YTD number of all time active givers] x [2022 all time active givers] / [2022 equivalent YTD all time active givers], to adjust for seasonality.
2. Then, I estimate the number of new active givers in 2023 = estimated cumulative active givers in 2023 - cumulative active givers in 2022.
3. Finally, to estimate the number of active givers in 2023, I assume that the active to new giver ratio will stay the same as it was in 2022. I.e. I estimate the 2023 number of active givers = ([2022 active givers] / [2022 new givers]) x [2023 estimated new givers]
- ^
This is an underestimate: donations via some platforms + anonymous donations are collapsed into a single "donor".
- ^
All historical data from these impact reports.
- ^
To go from the 2023 YTD to the all time numbers, I multiply the [2023 YTD dollars donated] by [2022 total dollars donated] / [2022 equivalent YTD dollars donated], to adjust for seasonality.
- ^
This is tracking donations to EA Funds, not grants made.
- ^
To calculate this value, I first linearly extrapolate the original 2023 YTD data through Nov 2023. But then to account for the giving season, I assume that the December values will be 3x the existing average YTD value. I chose this 3x multiplier by looking at the spikes in e.g. comparable GWWC data, but this is a pretty rough heuristic.
- ^
Data is from here.
The ACE team asked us to make clear that this is a rough estimate, and that over the years what was counted as “influenced by ACE” might have changed. ACE is currently working on strengthening their metrics and measurement methods of their impact and growth.
- ^
ACE had two reporting changes in 2022 that made historical comparisons a bit harder.
(1) They switched to reporting 'gifts influenced, excluding $500k+ donors', as opposed to excluding $1M+ donors. To try and adjust for that, I assume that 25% of the influenced gifts made by $500k+ donors were by donors giving under $1M total.
(2) They switched to an April to March reporting cycle. I thus calculated an annualized equivalent of my estimated gifts influenced excluding $1M+ donors across the Jan 1, 2022 to March 31, 2023 period (i.e. I find the average daily value in this period, and then multiply by 365).
So the overall formula I use to generate this estimate is: ( [Influenced gifts of <$500k donors in 2022Q1] + [Influenced gifts of <$500k donors in the fiscal year 2022-2023] + [25% x influenced gifts of >$500k donors in the overall period] ) * (365 / [Days between Jan 1, 2022 and March 31, 2023]).
Since giving is highly seasonal, I expect this approach might lead me to overestimate the 2022 figure, since it includes some data from two giving seasons (early 2022, and late 2022–early 2023).
- ^
I first estimate the number of total GWWC pledges in 2023. To do this, I multiply the [2023 YTD total number of pledges] by [2022 total number of pledgers] / [2022 equivalent YTD number of pledgers], to adjust for seasonality.
Then I estimate the number of new pledgers added as = Estimated number of total GWWC pledges in 2023 - total GWWC pledges in 2022.
- ^
I just linearly extrapolated the 2023 YTD data to cover the whole of 2023 (I expect application data is less seasonal than grant data).
Now having data for most of October, knowing our release schedule, and being able to see month-by-month engagement, I'd actually forecast that 80k Podcast listening time should grow 15-20% this year (not 5%), for ~300,000 hours of consumption total.
(If you forecast that Q4 2023 will be the same as Q3 2023 then you get 11% growth, and in fact it's going to come in higher.)
That is indeed still a significant reduction from last year when it grew ~40%.
Let me know if you'd like to discuss in more detail!
Does that figure adjust for number of episodes released? I imagine there are many people who listen to every episode, or who listen to every episode that they're interested in. If that is the case, and because the podcast now has two hosts and seems to publish more content, the indicator may not be a useful proxy for EA growth this year (given the "number of episodes available" confounder).
Okay, I've now updated this metric in the post. For interested readers: this basically didn't change the top level conclusions of the post (it changed the 2023 v 2022 mid funnel growth rate from 67% -> 68%), even though the 80k podcast is a pretty big program.
Thanks Rob! Really glad to hear that the podcast is doing better than I had anticipated. I'm traveling today, but will plan to update the podcast forecast when I have a moment [edit: done].
I'm not planning to update forecasts across the board for projects though: the data is already outdated from Aug, and in general I wouldn't assume that any of the individual 2023 forecasts are very resilient (I was more interested in the overall growth rates than in the numbers for any specific program) — most of my reasoning on specific forecasts should be in the footnotes if readers are interested.
For posterity, the 80K team helped me generate the 2023 end of year forecasts, and used the method detailed in FN 5, which I've included below for convenience (just to clarify, I believe the 80k team used this methodology to generate forecasts, but I wrote the description):
I'll make this clearer in the body of the post.
Helpful data, Angelina!
To forecast future growth, I think it would be useful to have more than 3 years of data (2021 to 2023), but I appreciate it may not be available for many metrics. CEA's dashboard has some metrics plotted for longer timeframes. Here are the 2 plots which have data for at least 6 years.
Total views on the EffectiveAltruism.org home (blue) and intro (orange) pages (per month):
Overall EA Newsletter subscriber count (at the start of each month):
Bases on these, it looks like early funnel growth has stalled. It would be nice to see 80,000 Hours' metrics plotted for long timeframes too, as it is the most important factor for people getting involved in EA. From the 2022 EA Survey:
Thanks Vasco!
For the data from the CEA dashboard, could you please update your top level comment to make clear which metrics you are pasting graphs of? (Total views on the EffectiveAltruism.org home and intro pages (per month), Overall EA Newsletter subscriber count (at the start of each month)).
Thanks for your broader feedback. Making sure all the data in this public post was double checked / had good reasoning transparency took a bunch of time, so I opted to include only the timeframe that seemed most informative to readers. (It's possible this was a mistake, which I'll come back to if we revisit this project!)
FWIW I think a bunch of the historical data across projects is also not straightforward to interpret: I expect 2020 was a super weird year for many projects because of COVID, and the <=2019 data across projects is so far back in the past I'm just not sure how informative it is for the modern day.
Sorry! Done.
On the other hand, it might be interesting to see whether there were any important changes caused by COVID, besides the direct ones of having less in-person events like EAGs and EAGxs. If the median EA view about AI and bio is right, I guess we may have weirder years than COVID in the next decades too.
Fair point. I think it would still be informative in some cases.
FYI these images don't load for me
Thanks, Jeff! I think you can see them now.
Hi Vasco, thanks for your comment it's really interesting, but I can't see the first two pictures, maybe others can't as well?
Hi Vaipan,
Thanks for letting me know. The problem is that, for reasons unknown to me, the figures break a while after edit my comment. They are visible again now, but will probably break again.
Thank you Angelina for this excellent post! I really hope that this analysis, or something quite similar, gets conducted on a regular basis and shared with the entire community.
A few thoughts on this:
Thanks for your thoughtful feedback on this! I really appreciate it.
I might not have time to respond in depth here, but will come back to this if/when we pick this project back up again.
Helpful post! If you'd ever like data from EA Netherlands please feel free to reach out.
Thank you James, I appreciate the offer!
Thank you for this Angelina! It is extremely informative and has given me many useful updates about the size and trajectory of EA and its programs. It has also resolved some uncertainties which helps with my motivation. I expect that many readers will have a similar experience.
I would like to see more of this sort of monitoring in the future. Do you plan to do a similar analysis next year?
Thanks for the feedback!
Curious if you are willing to share, what were the uncertainties?
Thanks! I was initially thinking of this project as a one-off piece for a specific timely event. It's possible we'll conduct another analysis next year, but I think that will depend a lot on my capacity and priorities at the time. But FWIW, some of this data is public and ~live if you ever need to see it, e.g. this dashboard on CEA program metrics is updated every month.
My uncertainties were mainly related to questions like how FTX had affected the trajectory of the community, size of pledge programs, and growth of AI relative to other areas of EA. But also around broader community understanding, like which programs are bigger, growing faster, better to recommend people to etc.
Thanks, I didn't know about the dashboard or had forgotten about it. Very helpful.
Short of doing something like this again, a simple annual post that reminds people this dashboard exists a and summarises what it has/shows, could get a lot of the value of the bigger analysis with a lot less effort. I imagine that a lot of people don't know about the dashboard and a lot of new people won't know next year.