Thanks so much for this! Could we get country-by-country breakdowns? Privately would be fine. For example, I'd love to see how the results for the Netherlands have changed over time. I'd also like to see how different countries compare to one another on various metrics.
Hey James, sorry for the late reply, but thanks for the feedback!
Here are the averages across groups by country for each of the group measures:
It would be time-consuming to show how the group measures have changed by country across groups surveys, and some questions in the 2022 census weren’t asked previously, so I hope the above is useful enough for you.
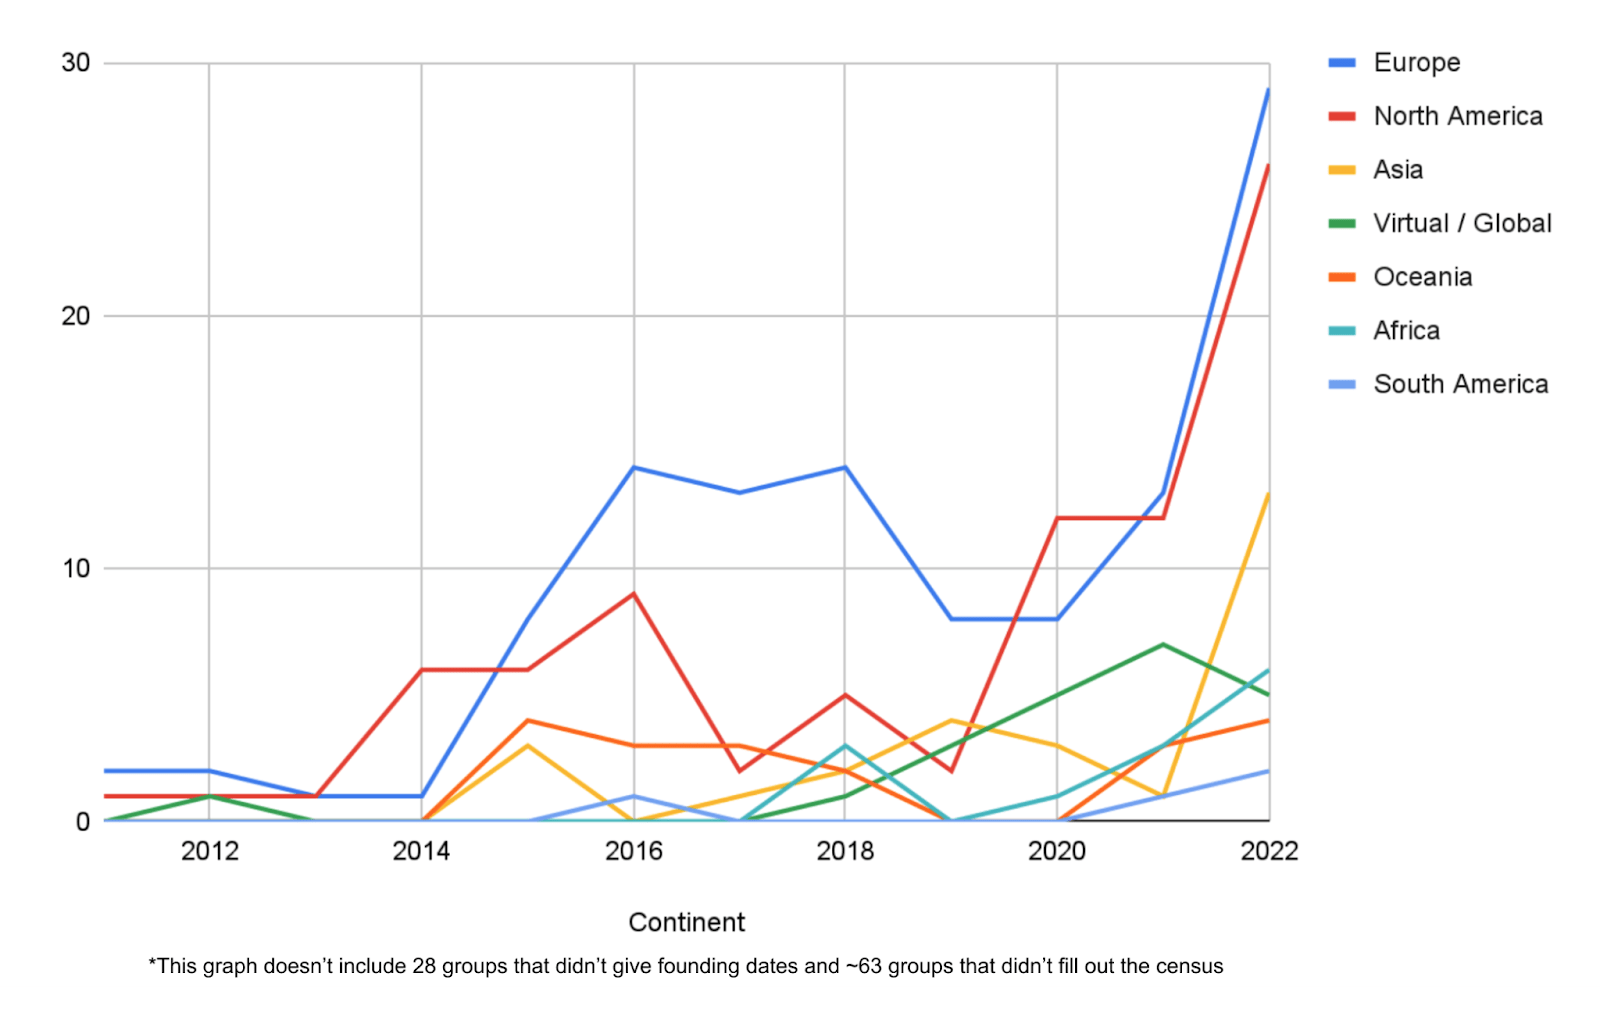
I can share the number of groups founded per country by year since 2011 here though (for groups still currently active):
I only included countries with a minimum of 3 groups that filled out the 2022 census in both images above. I hope this helps!
Thanks for doing that survey and sharing it. This seems potentially quite helpful for EA meta workers & funders, much appreciated!
Minor question (feel free to ignore if busy): Results of EA surveys (both this one and others) seem to often be shared >6 months after the data was collected, and to me it feels at least somewhat outdated by then. Curious to hear if you have any thoughts on that and benefits/costs of sharing sooner.
Hey Manuel, sorry for the late reply, but thanks for your comment!
I agree it would be better for the results of EA surveys (including this one) to be published earlier. The reason the census results came out in June was because:
In January-March, I had to prioritize other tasks/projects instead of analyzing and writing the census results
Analyzing and writing the census results took longer than I expected
We'll try to publish the results for this year's census a bit earlier.
We've already personally spoken about the EA Survey (separate from this survey), of course. But for the sake of other organisers, I'll flag that we're generally happy to provide private analyses to orgs and other movement builders before the formal public posts go out. We've already provided 15-20 such private reports this year.
Growth and engagement in EA groups: 2022 Groups Census results — EA Forum
Growth and engagement in EA groups: 2022 Groups Census results
This is a crosspost from the new Animal Welfare Alignment Newsletter by Anima International. You can subscribe on Substack if you are interested in following these efforts. Audio reading also available on Substack.
The goals of this post are to:
1. Raise a question I see as crucially important to the goal of aligning AI to animal welfare...
“How long have you been v*g*n?”
This is one of the most common icebreakers at animal protection events. It’s a baseline assumption, and it mostly holds true: if you’re out advocating for animals not to be tortured or abused, realistically these days you are v**n, or close. And it makes for good conversation. It seems fairly safe to assume when you meet strangers.
But this assumption is hurting the movement in a way which we don’t always notice: someone new comes into the sp...
Summary
Back in November 2023 I posted here to launch Spiro and raise our first $198k. Two and a half years later this is an update and a fundraiser for the next step.
The short version: we've now reached over-5,900 people with TB preventive medicine, including over 3,000 children under five years old. Our early results have held up well an...
In December 2022, CEA sent out a survey to all groups. 309 EA groups[1] reported that they were active.[2] However, based on our records, we estimate that ~63 active EA groups didn’t fill out the census. Therefore, it’s important to note that the data in this post are not representative of all active groups.[3]
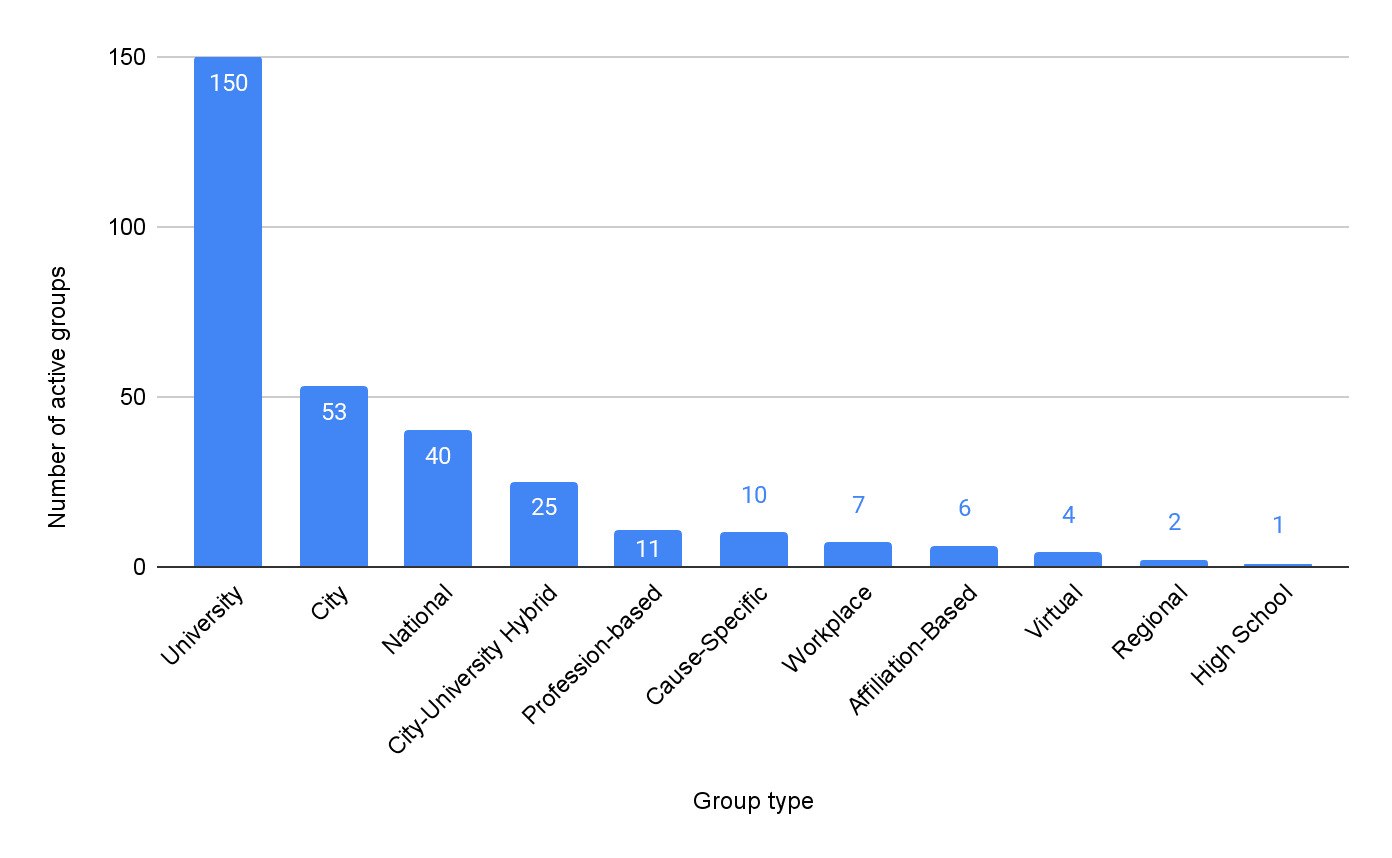
Almost half of all active groups (309) are university groups (150). After that, most groups are location-based (53 city groups, 25 city-university hybrid groups, and 40 national groups). There were 40 groups of other types (e.g. workplace).[4]
The number of groups has been growing quickly in recent years. The net growth in the number of groups was 19% in 2020–2021 and 31% in 2021–2022.[5][6] Most of the groups that were founded in recent years are university groups: the number of university groups roughly doubled between 2020 and 2022.[7]
We hypothesize that the two main reasons for the fast growth rate in general are CEA’s University Group Accelerator Program (UGAP) and the increased focus on and funding for EA community building in 2021–2022.
We’d like to note that we don’t aim to just maximize the number of groups or members — we care about the quality and fidelity of groups, and we’re taking steps to measure and help improve group quality.
There are active groups in 56 countries. Most of the currently active groups are in Europe and North America (39% and 30% respectively). However, the number of groups in Asia, South America, and Africa significantly grew in 2022, ranging from 65-86% growth per continent that year.
We think the high growth in these continents is partially due to UGAP, EA Virtual Programs, and other community building efforts (e.g. by the Spanish-speaking community).
We also asked groups for attendance and engagement data.
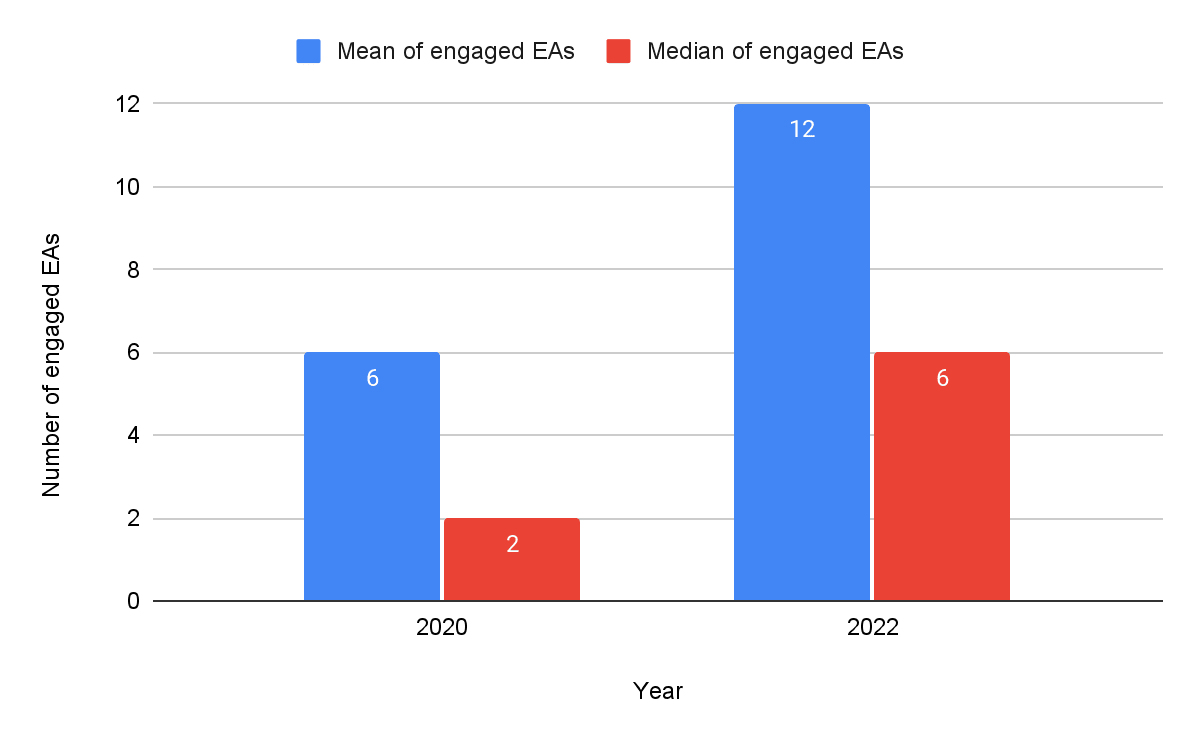
The data we have shows that the median group size remained constant between 2020 and 2022, although due to changes in the questions we asked between the 2020 and 2022 surveys, we can only meaningfully compare the attendance and engagement data of groups on two measures (total event attendees and engaged EAs).
While the total number of attendees per group stayed the same, the number of members who engaged with EA deeply — defined as 100 hours of engagement with EA content and taking some significant action — increased significantly. That is, the mean number of “engaged EAs” per group doubled (from 6 to 12) and the median even tripled (from 2 to 6). We think it’s plausible that this suggests that it has become easier to deeply engage with EA for people around the world (e.g. through accessible fellowships, more conferences, and higher Forum activity).
As expected, engagement data across all measures we asked for were skewed: a small share of the groups produced the majority of outcomes in terms of number of events organized, EAG(x) attendees, engaged EAs, and total attendees. The least skewed measures were the number of regular attendees and intro fellowship participants per group. We discuss potential explanations for this in this post.
On average, organizers rated their satisfaction with CEA’s support as 7.6/10. This is roughly the same as in 2020[8] — though it’s worth noting that the number of groups that CEA supports, and thus the number that rated their satisfaction with CEA’s support, has increased by ~50%.
Compared to two years ago, there was an increase both in groups that are dissatisfied and groups that are very satisfied with CEA support. We think that one of the reasons may be that CEA’s support has become more targeted at specific groups (e.g. city/national groups in key locations and new uni groups in UGAP).
Profession-based and virtual groups were on average less satisfied with support from CEA compared to other group types. Similarly, workplace and profession-based groups had the lowest proportion of groups giving ratings. This may suggest that these groups do not get much support from CEA. Indeed, we deprioritized giving support to profession-based and workplace groups in late 2022.
When asked about further support, organizers most frequently said that they would like to receive: 1) more mentorship from CEA or peers, 2) access to experts and potential speakers, and 3) better resources on events, marketing, M&E, and dealing with the FTX crisis. We will keep this in mind for future programs and services.
Background on the 2022 Census
In 2020 and 2019, CEA and Rethink Priorities ran surveys to get data on EA groups and organizers.[9] CEA intended for the survey to be run yearly, but was unable to run it in 2021 due to capacity constraints.
To make the survey easier to fill out, we significantly decreased the number of questions in the EA Groups Census 2022 compared to 2020. The census’s full question list can be viewed in this document. I analyzed the data, with input from Rethink Priorities on the survey questions and this post, and I wrote this post with Amarins Veringa's help.
650 group organizers across 337 groups filled out the survey in December 2022. Out of the 337 groups that filled it out, 299 EA groups and 10 cause-specific groups indicated that they are active.
Based on our records, we estimate that ~63 active EA groups (17% of all active EA groups) did not complete the census. Groups that didn’t fill out the census are excluded from the remainder of the report. Readers can find an overview of the active EA groups on the EA Forum Community page.
Although the census was sent only a month after FTX’s collapse, we don't think the census fully captures the impact of FTX's collapse on groups yet, apart from potentially the two questions on CEA’s support. This is because the questions about group measures mostly cover event attendance and EA engagement data from the whole of 2022, and not just for after the collapse. We also haven’t observed an increase in the number of inactive groups after the collapse.
We are open to requests for additional analyses, though we can’t promise to do them due to time constraints. You can comment requests below or email them to [email protected].
Number of groups
Number of active groups per type
Almost half (49%) of the active groups that filled out the census are university groups. Note that to simplify the data, hybrid groups were assigned to only one category (e.g. cause-specific university groups were just marked as cause-specific groups.)[10] Footnote 11 explains some group types that people may not be familiar with.[11]
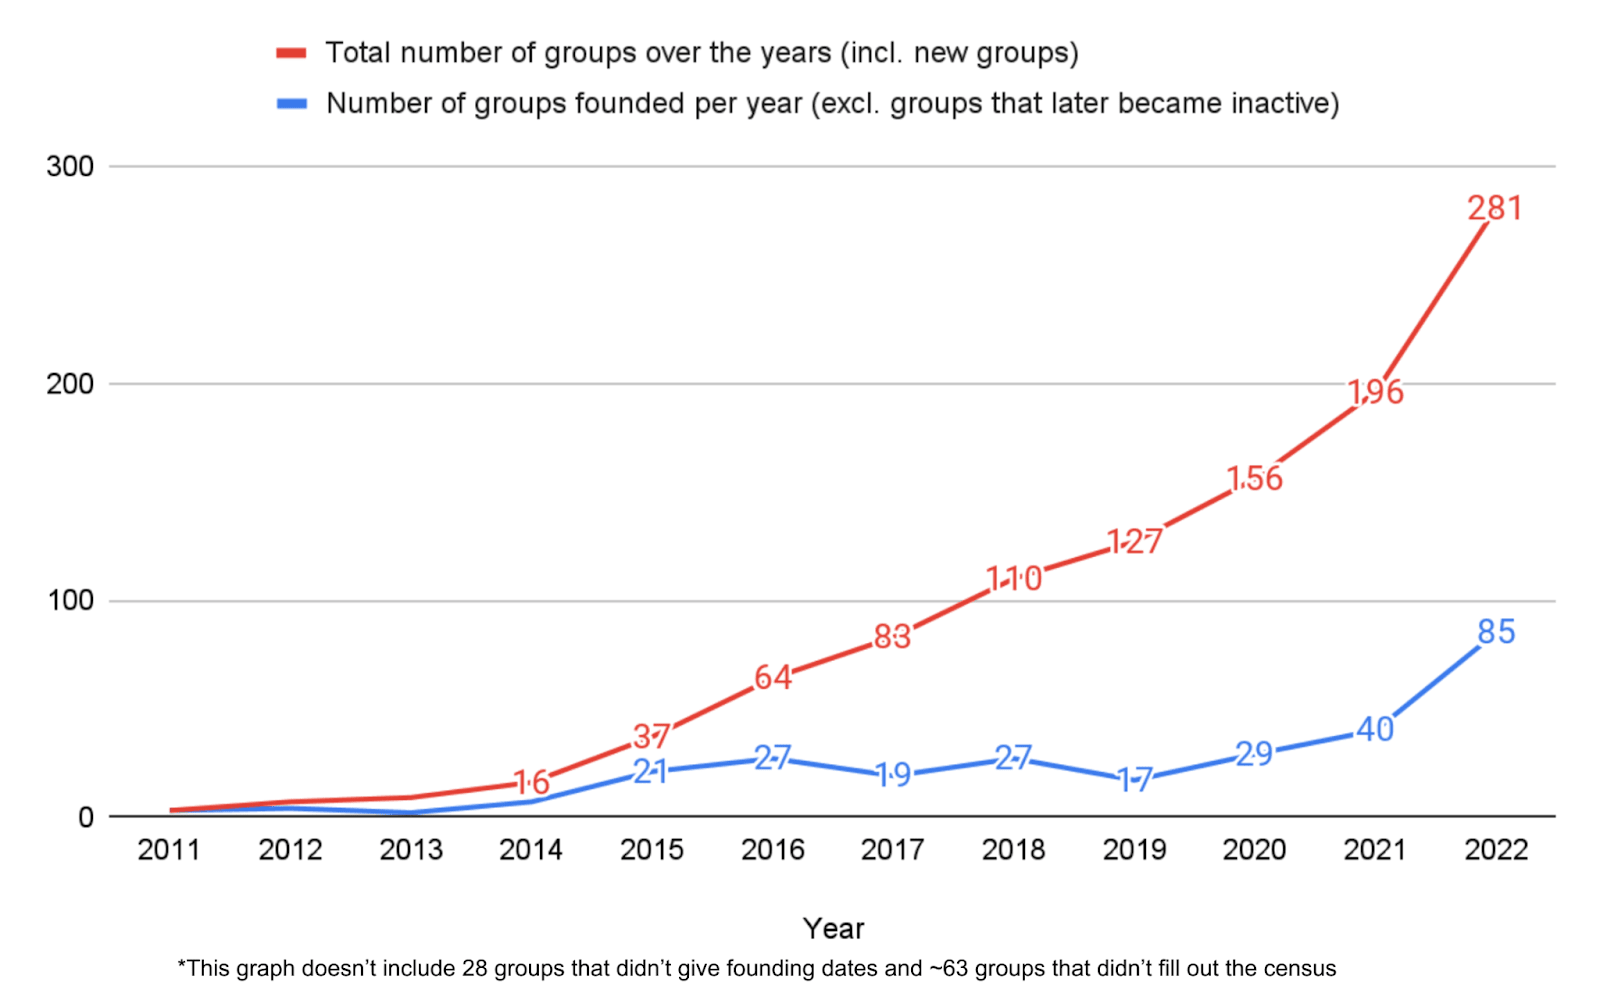
Number of active groups over time
281 of the 309 active groups (91%) provided an approximate founding date. Based on this, the number of active groups seems to have grown by 43% last year (from 196 in 2021 to 281 in 2022). This means that compared to previous years, the rate of growth substantially increased in 2022 (e.g. the growth rate in 2021 was 26%). We discuss the factors that likely contributed to the growth in the number of active groups in this section.
Note that the graph above and some growth rates mentioned in this post only count the number of groups that were still active when we sent the survey, so these don't account for groups that became inactive in the years before we sent the survey. As such, the growth rates mentioned above are likely to give an inflated impression of growth due to attrition in earlier years.
To get a more accurate growth rate between 2020 and 2022, we could compare the total number of known active EA groups at the end of 2020 and 2022. Based on the 2020 survey, there were 233 known active EA groups as of late 2020.[12] As of January 2023, there were 362 known active EA groups. This suggests a growth rate of around 55% over the two years. Based on data from active groups, we then estimated that the group growth rate in 2021 and 2022 were 19% and 31% respectively.[13] Footnote 13 explains how we calculated this.
We’d like to emphasize that CEA doesn’t aim to just maximize the number of groups or group members — we care about the quality of groups and spreading high-fidelity information. We’re taking steps to measure and help improve group quality, such as by surveying group members and increasing our screening/vetting of group organizers.
If you’d like to know how the growth in the number of groups (55%) from 2020–2022 compares to the general growth of the EA community (via data from Rethink Priorities), you can read this section of the appendix.
On groups becoming inactive
28 groups marked themselves as inactive in the census. Half of those were not active yet because they had just got started, while the other half had previously been active but became inactive after a while.
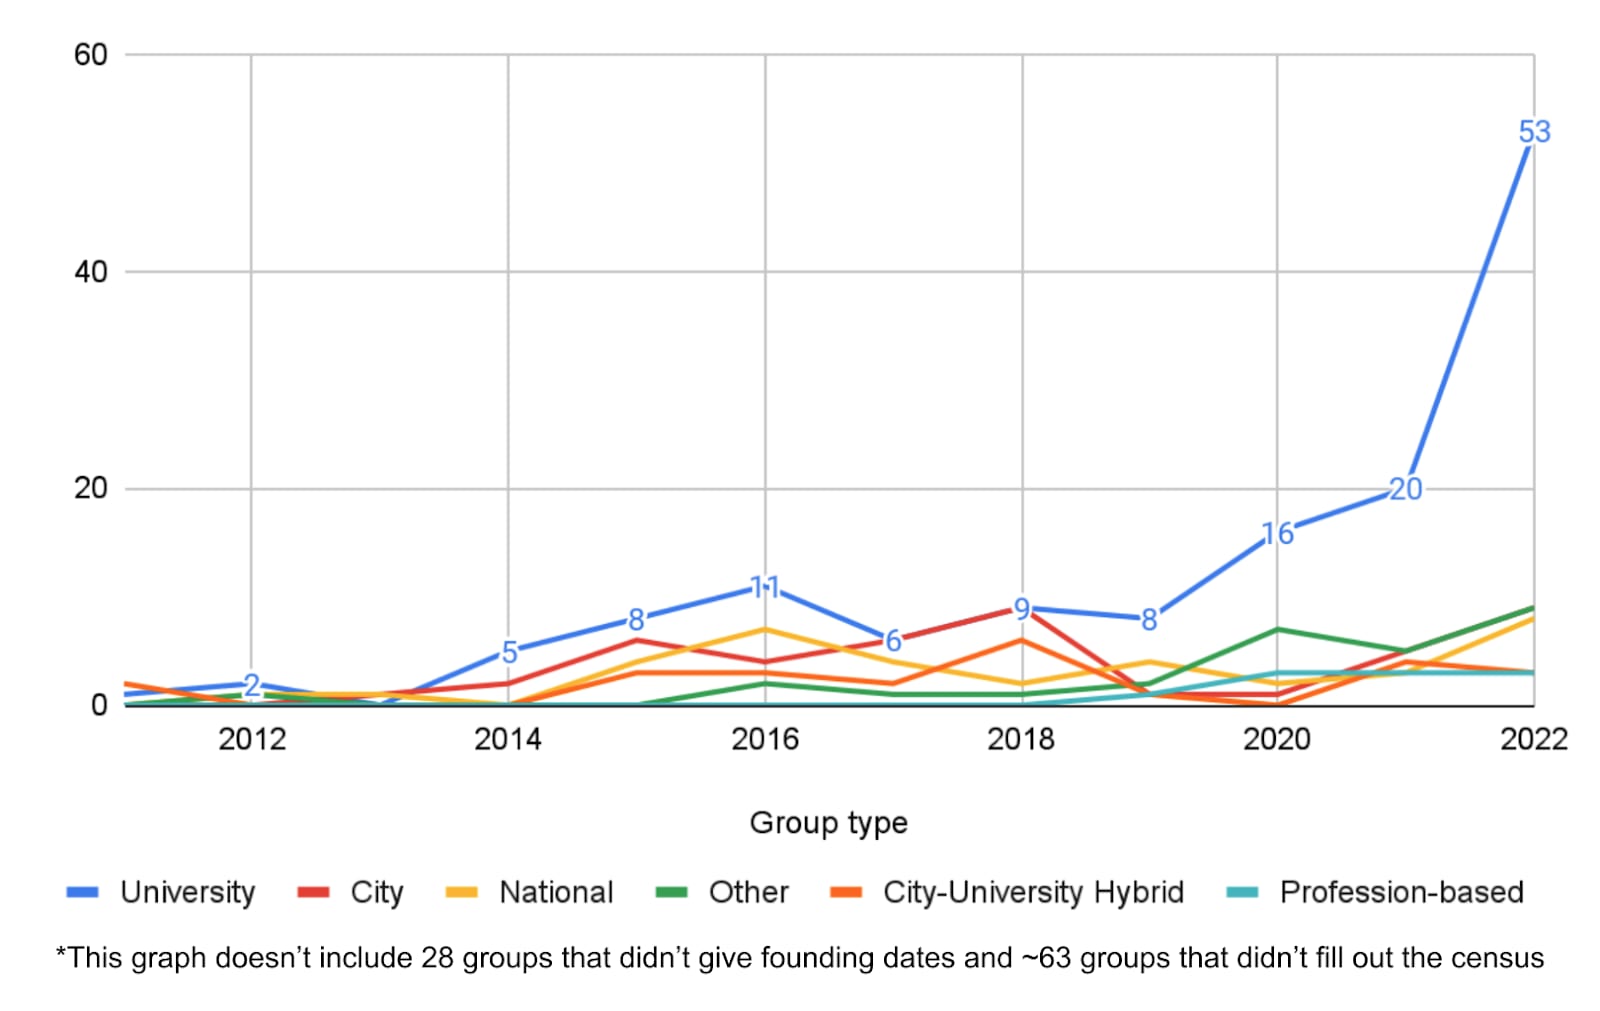
New groups founded per year by type
In 2022, the growth in university groups was faster than in post-university groups - both in absolute and relative terms. That is, the number of active university groups grew by 30% in 2021 and 62% in 2022 based on the census. Meanwhile, the number of city and national groups only grew by 25% and 29% respectively in 2022.
What contributed to the growth in the number of groups?
We think our University Group Accelerator Program (UGAP) significantly contributed to the growth in the number of groups, as 76 groups participated in UGAP across three rounds in 2021-2022 (and 66 of those filled in the census). This was complemented by efforts from EA groups to seed university groups, such as by EA Netherlands and Stanford EA.
In addition, EA Virtual Programs may have played a role: due to the existence of virtual programs, people from any location can now more easily learn about EA. Indeed, we’ve observed that several organizers finished a virtual program before starting a group.
We think that (before the FTX collapse in November) there was also increased positive coverage of EA in 2022, which might have contributed to more people wanting to start groups. Perhaps more importantly, total EA community building funding was higher in 2021 and 2022 than in previous years, which might have made organizing a more viable and/or attractive option for many people.
We expect fewer groups to be founded in 2023 than in 2022. One of the main reasons is the decreased funding availability in EA post-FTX, which means that we expect less funding will be available for groups in 2023 (compared to 2022). The university groups team has also increased the bar for which organizers to accept into UGAP, as less funding is available and they are worried about the negative externalities of endorsing organizers who are possibly not ready to run a group (yet). You can learn more about the common pitfalls that we are aiming to avoid through screening organizers in this talk by Jessica McCurdy.
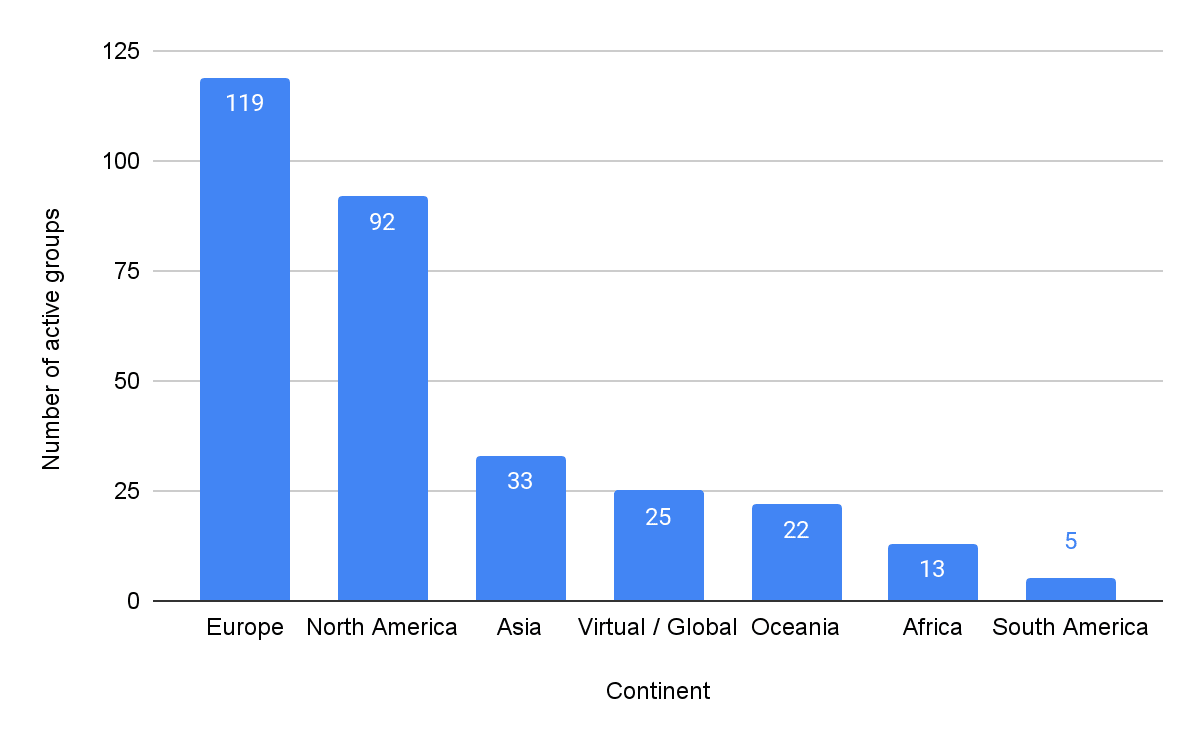
Number of active groups by location
By continent
Like in previous years, the majority of the groups is in Europe (39%) and North America (30%).[14]
By founding year and by continent
However, the number of groups in Asia, Africa, and South America has increased significantly. 13 of the 33 groups in Asia, two of the five groups in South America, and six of the 13 groups in Africa were founded in 2022. This means that a large portion (39-46%) of the active groups in Asia, Africa, and South America were founded only last year.
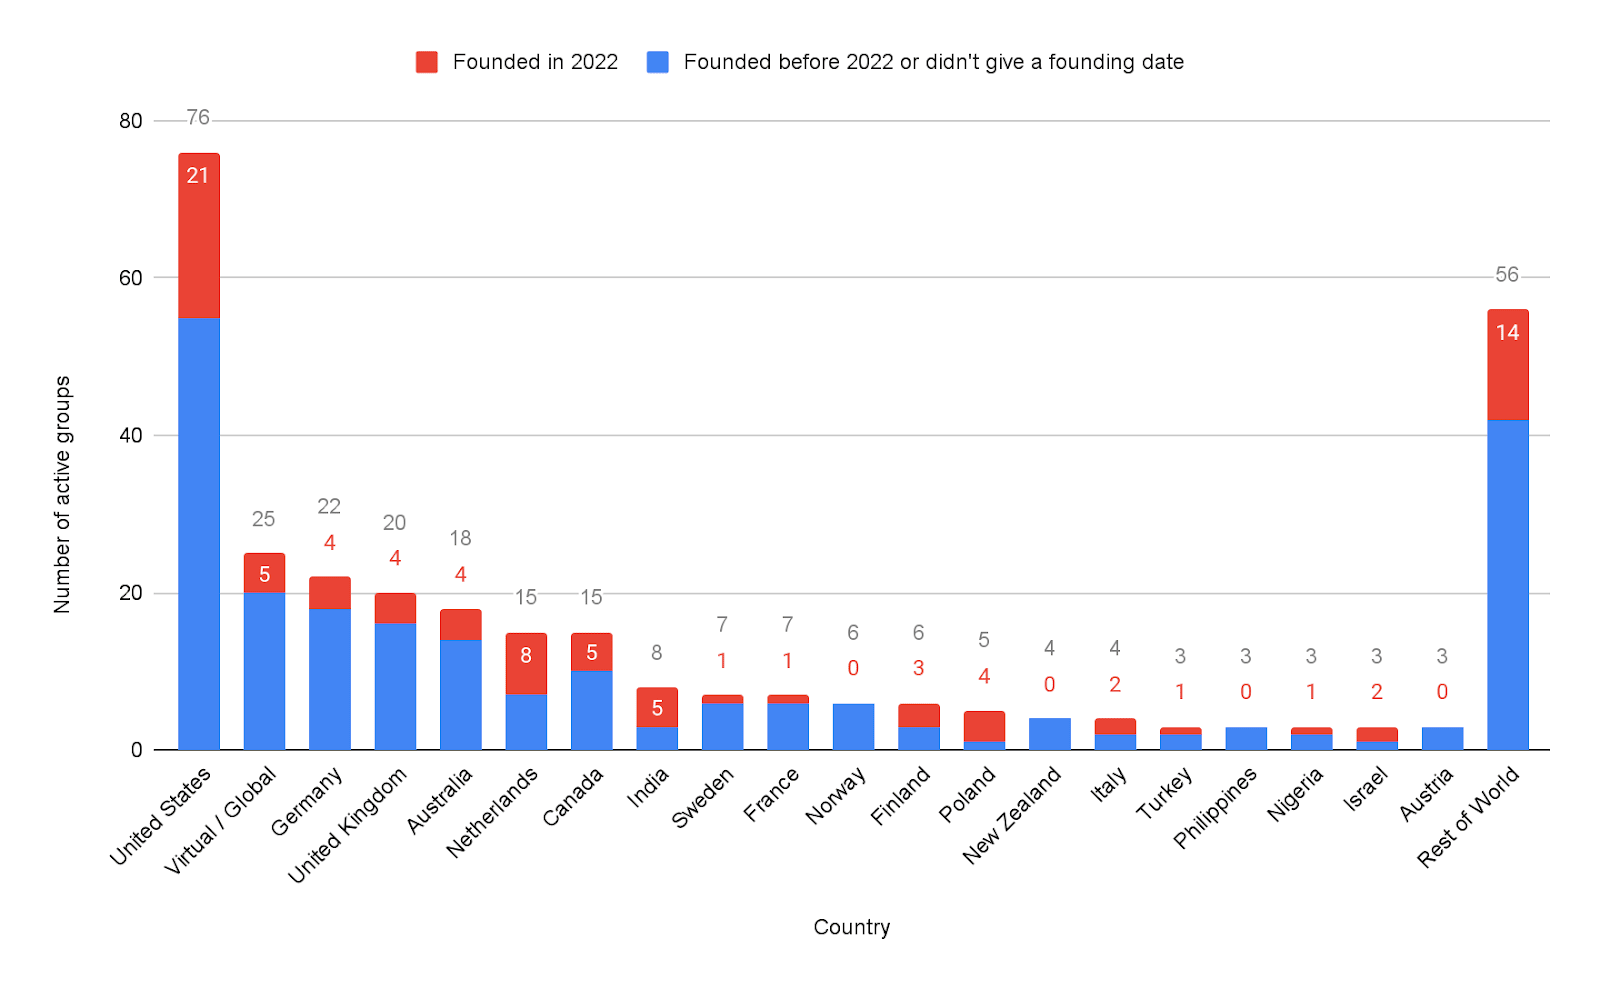
By country
When we look at the country level, the US has by far the largest number of active groups (76 groups, which is 25% of all groups). The US also has the largest number of groups that were founded in 2022 (21), followed by the Netherlands (8), Canada (5), and India (5).
Data on groups’ activity levels, size, and EA engagement
We also asked groups six questions about the activity level and size of their group, as well as their members’ engagement with EA.[15] We include some aggregated data and findings from these questions below.
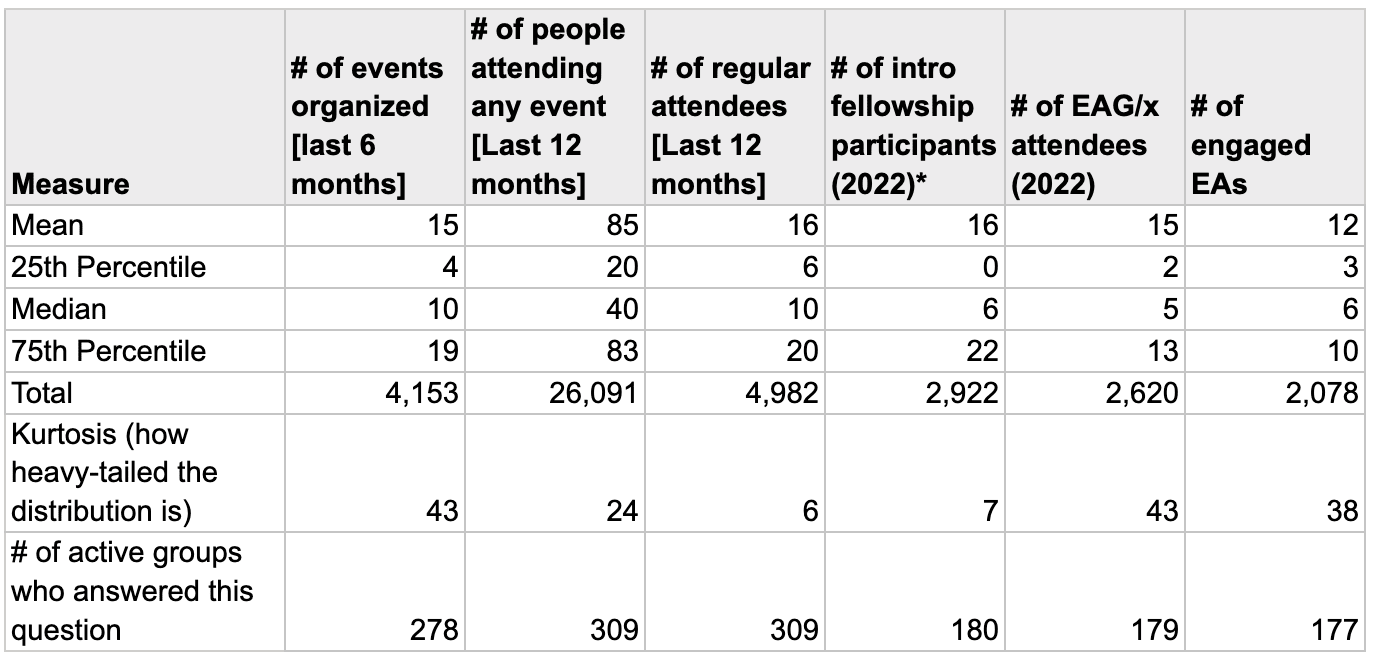
Summary of the group measures
Below you can find an overview table for the measures of each of the six questions and a count of the number of groups that answered each question.
*Note: The mean, median, 25th, and 75th percentiles for the number of intro fellowship participants in 2022 include groups that didn’t hold a fellowship. If we only include groups that did fellowships, the mean is 26, and the median is 15.5.
The overview table shows that on average groups host 2-3 events per month, with 85 attendees in total over the course of a year, and 16 regular attendees. The table and graphs per measure (in the sections below) also show us that all measures are heavy-tailed, but some much more so than others.[16]
We think the skew in conference attendees might be due to the difference in the accessibility of conferences for groups from different regions (e.g. visa issues and the target audiences of EAGxs can make conferences more accessible for some locations than others). Similarly, the skewed number of engaged EAs may be a result of differences in funding (though the causality may also be the other way around), as the top 13 groups with the most engaged EAs all had at least one FTE worth of funded organizers for their groups in 2022. We realized the number of events organized was likely skewed by differences in interpretation (e.g. some of the outliers had counted each fellowship cohort meeting as a separate event.)
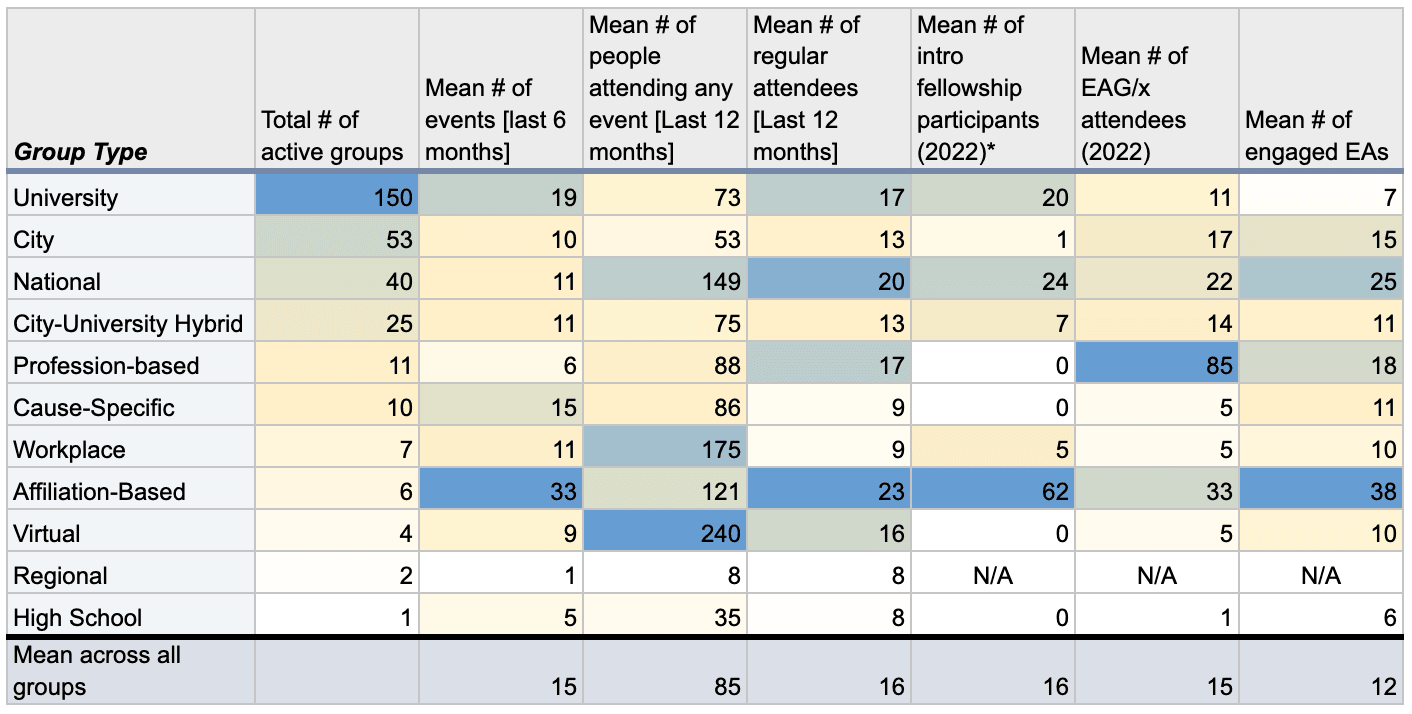
Mean of the group measures by group type
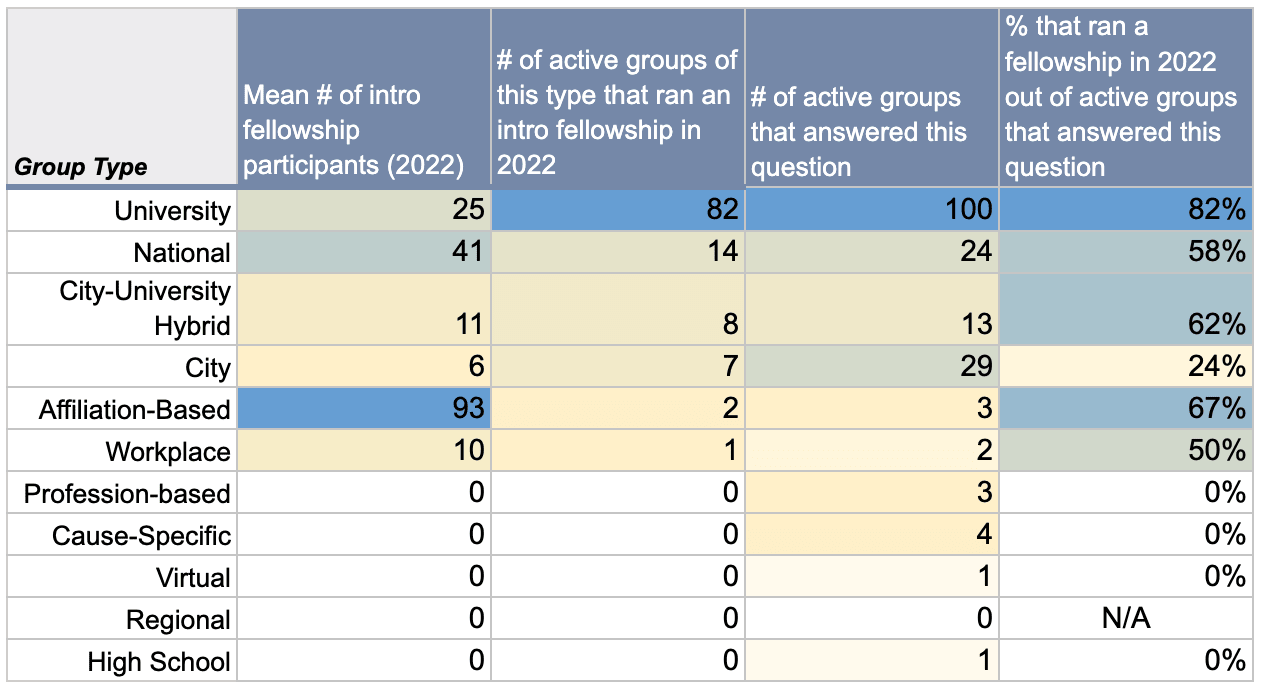
We also compared the mean score on each question for different types of groups (e.g. university groups or profession-based groups). The table below shows an overview of this. Note that the table should be interpreted with caution for group types with smaller sample sizes (column 2), as means can be heavily influenced by one or a few groups in these cases. This is especially true for the optional measures, as not every group that filled out the survey chose to fill the optional measures out as well.
*Note: The mean number of intro fellowship participants shown here per group type include groups that didn’t hold a fellowship. The data here shows the mean number of participants per group type excluding groups that didn’t hold a fellowship.
There are a few insights that stand out from this data:
On average, affiliation-based and university groups organize much more events than other groups. We think this is likely because a couple of affiliation-based groups are quite large and hold events virtually or in separate cities (e.g. EA for Christians). Similarly, university students might have more capacity to organize and attend events than members of other groups.
Only university, national, and affiliation-based groups have a mean of more than 10 intro fellowship participants in 2022. For all other group types, most of them did not hold intro fellowships — we discuss this in more depth here.
Almost all groups (particularly national and affiliation groups) report having more engaged members than regular attendees — except for university groups and virtual groups, which tend to have fewer engaged members than regular attendees.
National and affiliation groups have the largest mean number of engaged EAs. This might be because these groups tend to have a larger target audience, and a higher proportion of these groups has at least one FTE in funded organizers in 2022.
The next sections discuss the data about the number of engaged EAs, regular attendees, and EAG/x attendees per group in 2022. For the data on the number of events organized, fellowship participants, and total attendees within the last year per group, you can go to this section of the appendix.
Engaged EAs per group in 2020 vs. 2022
We asked groups to estimate the number of members who have a certain level of EA engagement (see here for the definition), which is comparable to a similar question in the EA Group Survey 2020.[17] The results showed that the mean number of engaged EAs per group has doubled since 2020 (from 6 to 12), while the median has even tripled (from 2 to 6).
2020 Survey
2022 Census
Total number of engaged EAs across active groups
864
2,078
Total number of active groups who responded with an estimate
133
177
% of survey respondents who gave an estimate
60%
57%
The table above also shows the total number of engaged EAs across (instead of per) active groups that answered this question in 2020 vs. 2022. This shows that the overall number of engaged EAs in groups has increased by 141% over the last two years (from 864 in 2020 to 2,078 in 2022).
We think it’s plausible that this suggests that it has become easier to engage with EA for more people around the world over the past years (e.g. through accessible fellowships, more conferences, and higher Forum activity), as the “engaged EA” definition requires members to have engaged with EA content for at least 100 hours.
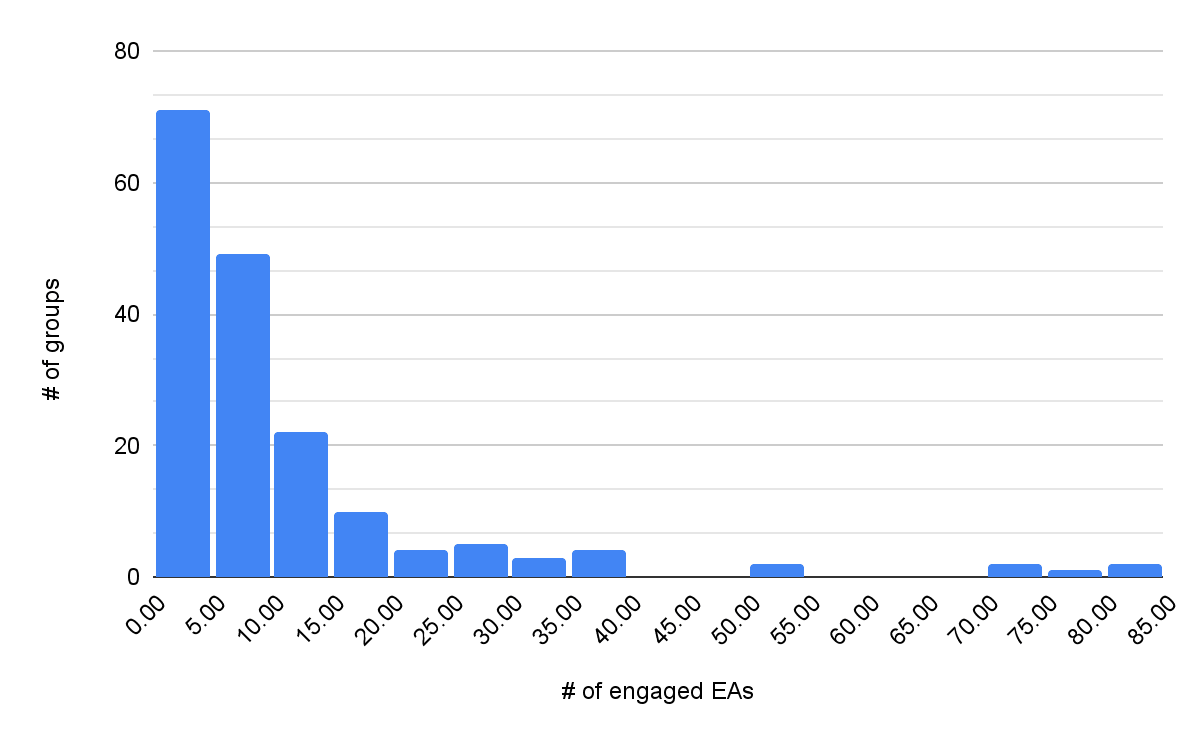
Number of engaged EAs per group in 2022
Note: Some of the charts below and in the appendix have two decimal places due to a limitation of Google Sheets for histograms.
2 outlier groups with more than 80 engaged EAs are not shown in this chart.
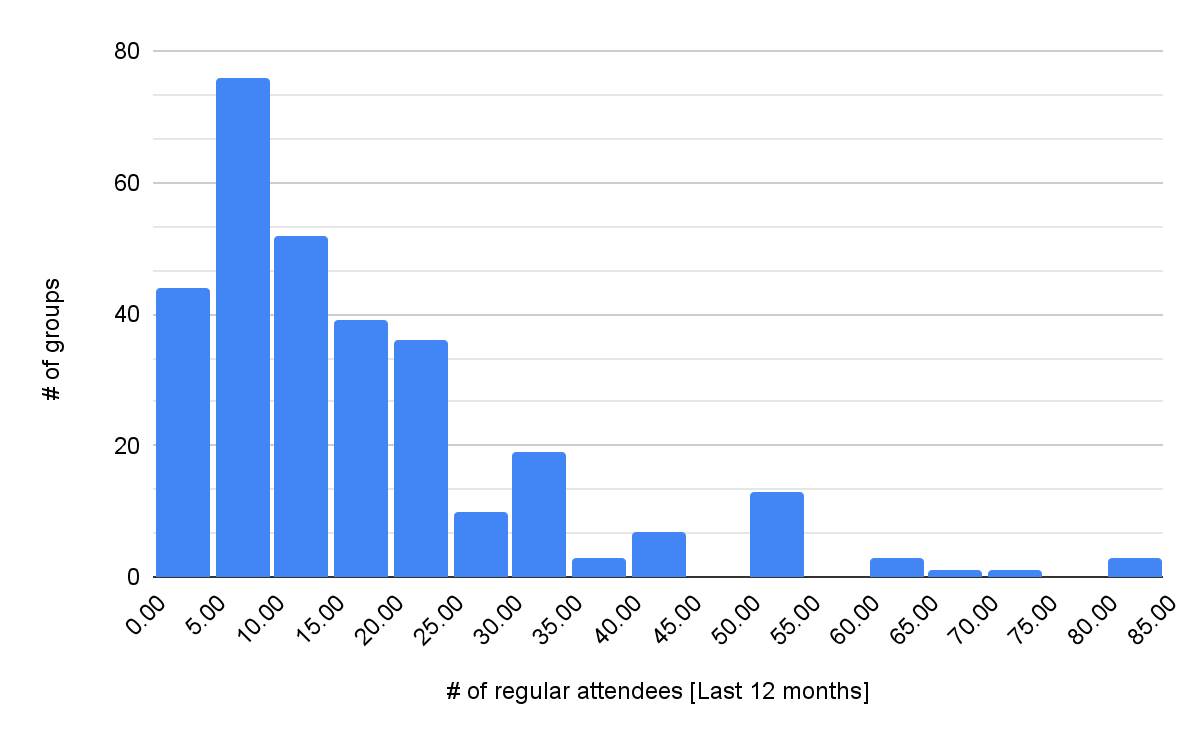
Regular attendees (last 12 months)
The number of regular attendees is also heavy-tailed, but less so than the number of total attendees. That is, the top 20% of groups had about half (2,540) of the total number of regular attendees (4,982) of all groups (whereas the top 10% of groups had half of the total amount of attendees). This might be because it’s easier to skew for total attendees (e.g. through one 500-person event) than to skew for regular attendees.
1 outlier group with more than 100 regular attendees is not shown in this chart.
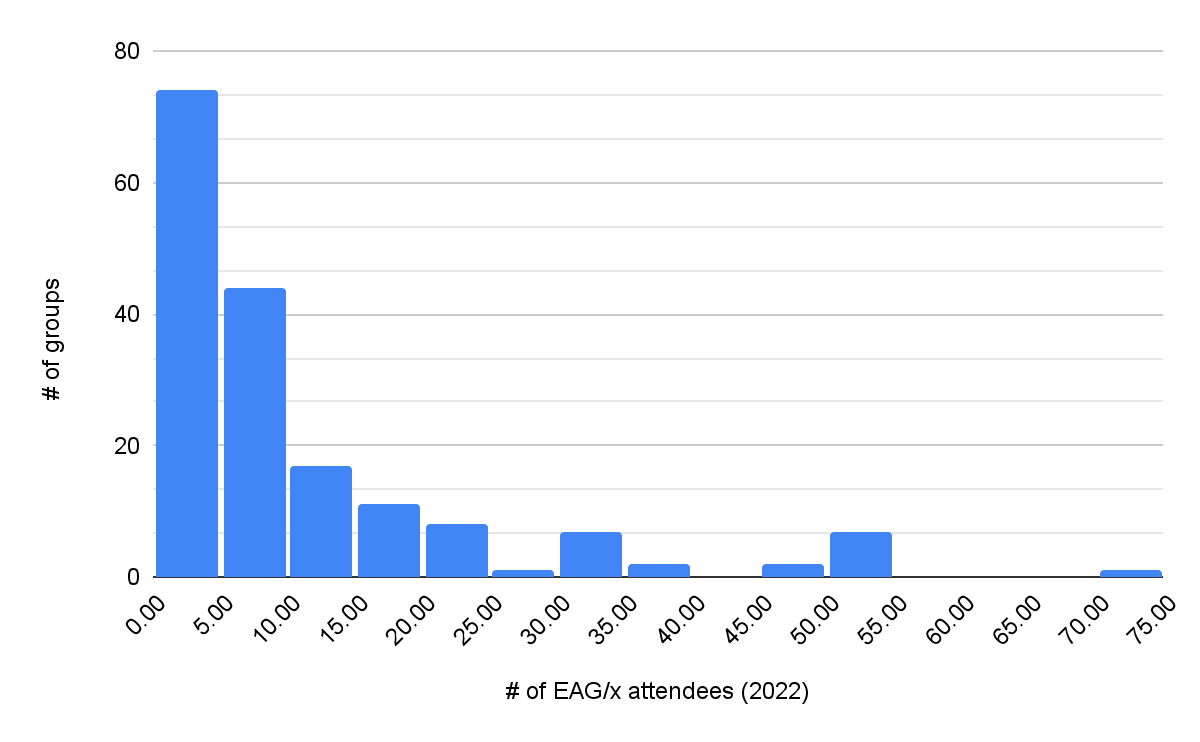
EAG/x attendees per group in 2022
41% of groups had less than five EAG/x attendees. The top 15 groups on this measure all had at least one FTE in paid organizers for most or all of 2022, which might have contributed to their number of EAG/x attendees. Five outlier groups (e.g. EA NYC) with more than 100 EAG/x attendees in 2022 are not shown in the chart below.
Satisfaction with CEA support and additional support groups would like from CEA
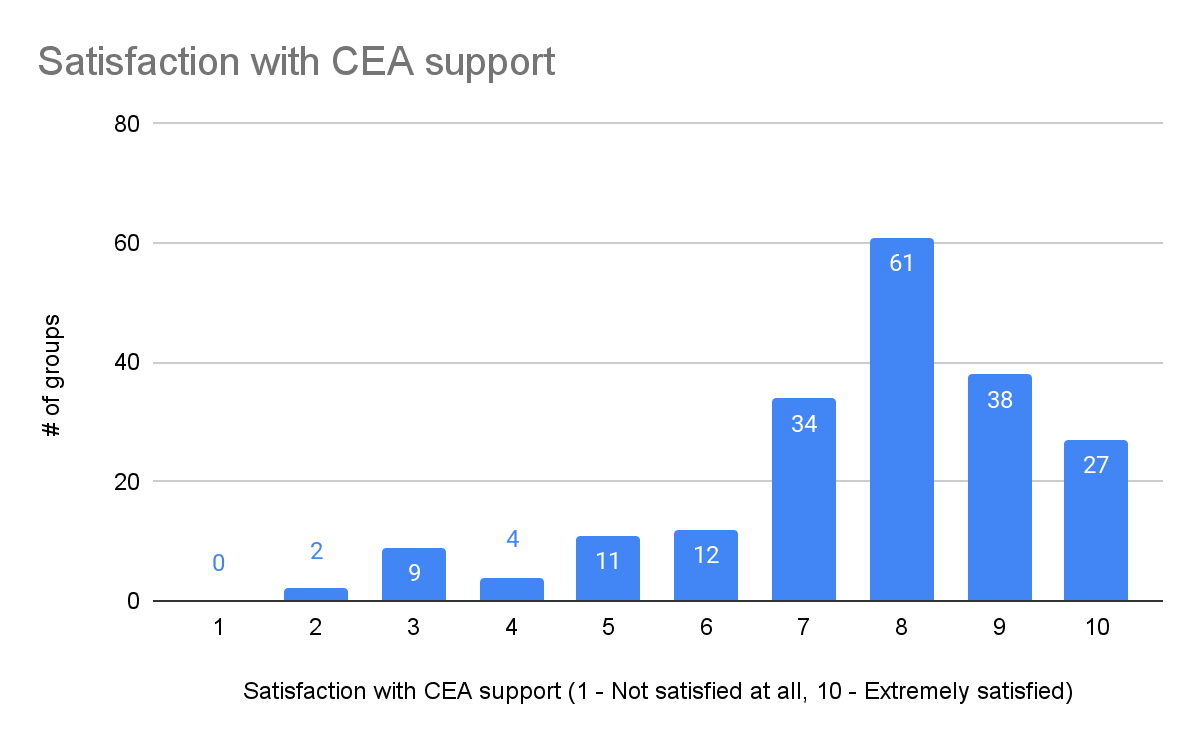
We also asked one main organizer from each group to rate their satisfaction with the support that CEA provides for their group from 1-10. The mean satisfaction rating was 7.64 across 198 responses among groups.
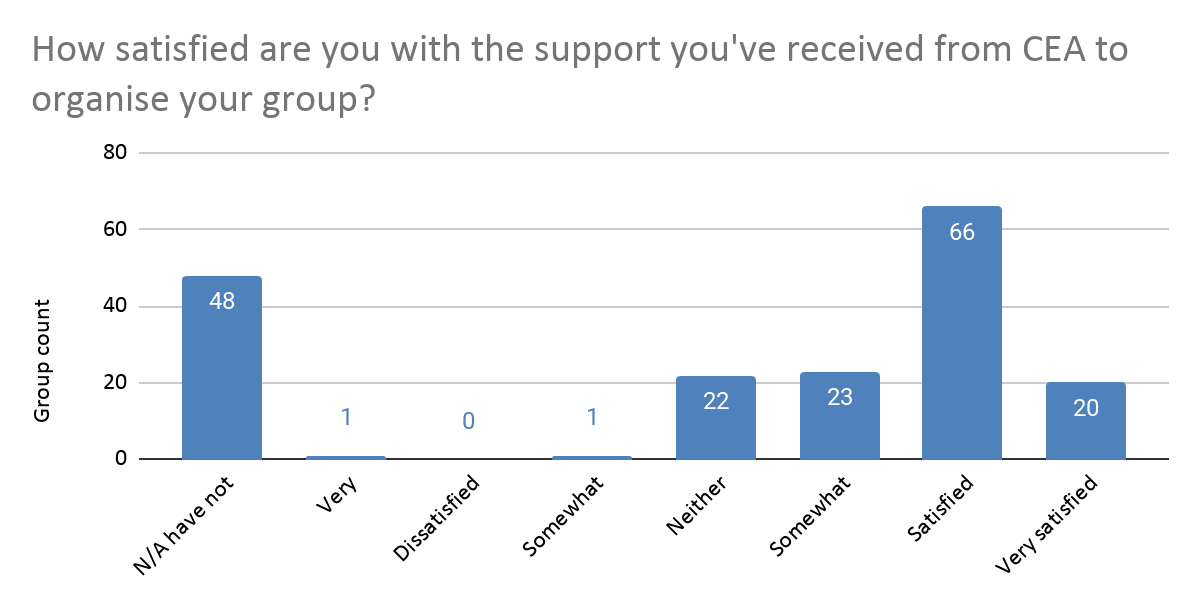
There was a similar question on satisfaction with CEA support in the 2020 groups survey that we were able to compare the scores to. However, the 2020 version was a 7-point Likert scale (instead of a scale from 1-10), and it allowed people to indicate that they haven't received any support:
Compared to 2020, there was an increase both in the number of groups that are dissatisfied and the number of groups that are very satisfied with CEA support.[18] However, the number of groups that CEA supports (and conversely that rated their satisfaction with CEA) has increased by around 50% during this period[19], so there were many more of these satisfied groups.
We think that one of the reasons for the increased variance in satisfaction may be that CEA’s support has become more targeted at specific groups (e.g. the Community Building Grants program narrowed its scope in 2021 and 2022, and the university groups team has focused its support on new university groups via UGAP). Looking at the groups that gave us low satisfaction ratings, these tended to be groups that we gave less support to (e.g. we had less contact with them).
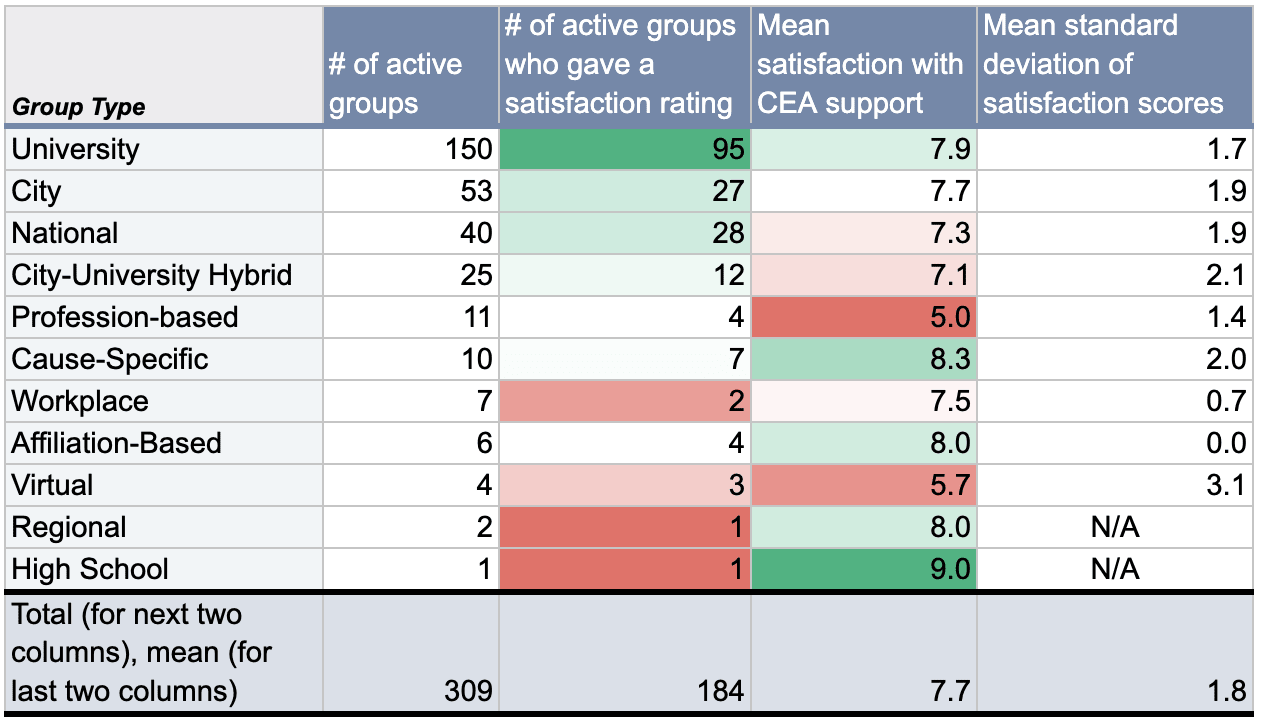
Satisfaction scores by group type
We also looked at the average satisfaction score per group type. You can find an overview of the mean satisfaction per group type in the table below.
Based on this table, two findings stand out:
The average satisfaction scores seem to be lower for profession-based and virtual groups (although only four profession-based and three virtual groups answered this question).
The two types of groups where the lowest proportion of them gave satisfaction ratings were profession-based and workplace groups.
This suggests that these three group types do not get much support from CEA. This reflects that we indeed deprioritized giving support to profession-based and workplace groups in late 2022, and currently don't have targeted support for these groups anymore (apart from general services like funding basic group expenses).
The survey also allowed groups to comment on what types of additional support they would like to receive from CEA. We used ChatGPT to help us analyze the comments. The top clusters of comments were on (roughly in descending order):
More mentoring, advice, and training from CEA in general
Helping them connect with other current (or former) group organizers for advice and support
More/better templates and materials for events
Access to subject matter experts or potential speakers for events
Advice/resources on marketing, communications, and/or website management
Advice/resources on monitoring and evaluation (e.g. impact measurement)
Advice/resources on how to deal with the FTX crisis and its implications
We’re taking this feedback into account in planning our current and future programs.
Feedback and closing thoughts
If you have any feedback or questions about this post, please comment them below or email them to [email protected]!
To close, the insights from the census only give us a high-level overview of groups, as reported by group organizers. To get a deeper understanding of groups and their members, CEA, in consultation with Rethink Priorities, developed a “Group Member Survey” to get a deeper understanding of groups and their members. We’re targeting this survey at EA group members (rather than organizers). This new survey will ask questions directly targeted at identifying what outcomes EA groups produce, and we will work with group organizers to send the survey out to their members.
We hope this will serve as a consistent way to track and evaluate group performance. We piloted an initial version of the survey last month with groups participating in the Spring 2023 round of our University Group Accelerator Program, and we rolled it out more broadly to all other EA groups yesterday.
Credits
Thanks to Amarins Veringa, Rob Gledhill, Conor McGurk, Jessica McCurdy, and David Moss for their feedback on this post. Thanks also to Catherine Low, Jesse Rothman, David Moss, Willem Sleegers, and Asya Bergal for their input on the census questions. Thanks also to OpenTent for their help in creating the census form.
Lastly, thanks to all the group organizers who filled out the census and for all their work. All errors are my own.
Appendix
Definition of “engaged EAs”
Note: This “engaged EAs” definition is different from the definition of the “Highly-Engaged EA” or (HEA) measure we have referenced in the past, such as in here.
Please estimate the number of people in your group (including organizers) who fulfill the following criteria: They have spent 100 hours or more engaging with effective altruism content (e.g. fellowship readings, talks, podcasts, or videos) and EA ideas and principles played a major role in them doing at least one of the following:
- Taking the GWWC pledge - Applying for specific internships or jobs - Choosing their degree program - Volunteering for 6 or more hours a week on effective altruism-related projects and they’ve had at least 2 touchpoints (i.e. attending an event or having a 1-1 with an organizer) with your group within the last year.
Comparing the growth in the number of groups to the growth of the EA community from 2020-2022
We also compared the growth in the number of groups to the general growth of the community. As we didn’t get data on general community growth from the census, we used data from Rethink Priorities. Based on the EA survey, Rethink Priorities estimates that the number of highly-engaged EAs (HEAs) grew by 80% between 2020 and 2022.
They didn’t run the EA survey in 2021, so we assume equal growth in the two years between those surveys to estimate the growth between 2020-2022. This suggests that the number of HEAs increased by 34% in both 2021 and 2022. This is much higher than in the year before that: the number of HEAs only grew by 14% between 2019-2020. That suggests that the community has been growing faster in recent years than in the years before. It also suggests that the growth in the number of HEAs (80%) over the past 2 years has been faster than the growth in the number of groups (55%).
Rethink Priorities also estimated that the total moderately engaged EA community (defined as engagement level 3-5) grew by 33% between 2020-2022.[20] This means that the total community growth (33%) is lower than the growth rate of active groups (55%), while the growth in HEAs is higher (80%) than the growth rate of active groups (55%). Rethink notes, however, that the estimated number for total community growth is more speculative because they are more uncertain about what percent of the broader (less highly engaged) EA community took the EA Survey, whereas they have proxy measures (like EA Forum membership) to estimate the percentage of HEAs who took the survey.
Group measures questions
Abbreviated name for measure
Question
# of events organized [last 6 months]
In the last 6 months, roughly how many in-person or virtual events has your group organized? (Don’t include one-on-one meetings.)
# of people attending any event [Last 12 months]
[Required] In the last 12 months, roughly how many people in total have attended at least one of your group’s events?
# of regular attendees [Last 12 months]
[Required] In the last 12 months, roughly how many individuals attend your group's events regularly (i.e. they attend at least one event every 2 months)?
# of intro fellowship participants (2022)
Approximately, how many people have completed a multi-week introductory fellowship (also known as an intro program or seminar) that your group has run in 2022?
# of EAG/x attendees (2022)
Approximately how many people from your group have attended an EAG or EAGx conference in 2022?
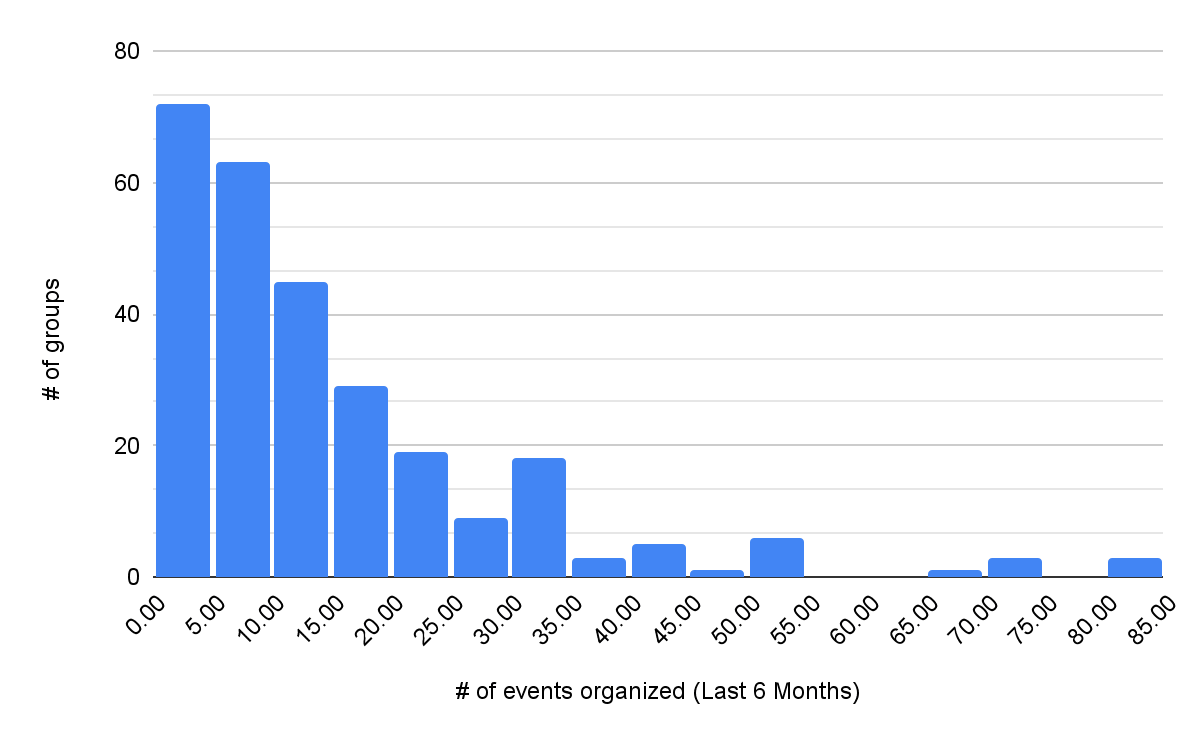
278 active groups responded to the question about the number of events that groups organized within the last six months (not including one-on-ones). The chart above shows that the distribution is quite skewed, with a few groups having organized 4 or 5 times as many events as the mean group.
Note however that some of these events may have a low number of attendees, as some groups counted each fellowship cohort’s meetup (e.g. 4-5 participants and one facilitator) as separate events, while a few groups seem to have counted each fellowship meetup as only one event. For example, the group that organized the most events[21] (210) counted each fellowship meetup separately. (If they did not count these separately, their number of events would have been 80.)
We will clarify this question more in next year’s census so that the answers are less subject to the interpretation of organizers. Given the discrepancies in whether groups’ counted each fellowship cohort’s meetups as unique events, we recommend interpreting the current data on events with caution.
Number of groups that held intro fellowships and their number of participants
Mean # of participants in 2022 across groups that ran a fellowship
# of active groups that ran an intro fellowship in 2022 (based on census)
% of active groups that ran an intro fellowship in 2022, out of those that answered this question
26
114
63%
Here are some insights from the tables above:
Out of all the groups that ran a fellowship last year, 72% were university groups. This is likely because uni groups are encouraged (or even required if they are in UGAP) to hold an intro fellowship, as many uni groups have found them to be an effective way to get new members and potential contributors up to speed with EA ideas.
City groups were least likely to hold intro fellowships.[22] There are several potential explanations for this. For example, city group organizers might not have the capacity to organize this, or their members (who tend to be professionals) may not be able to commit to an 8-week course.
Affiliation-based and national groups had the highest mean number of intro fellowship participants. This is likely due to similar reasons as to why they had the largest mean number of engaged EAs (i.e. covering a larger target audience and tending to have paid organizers).
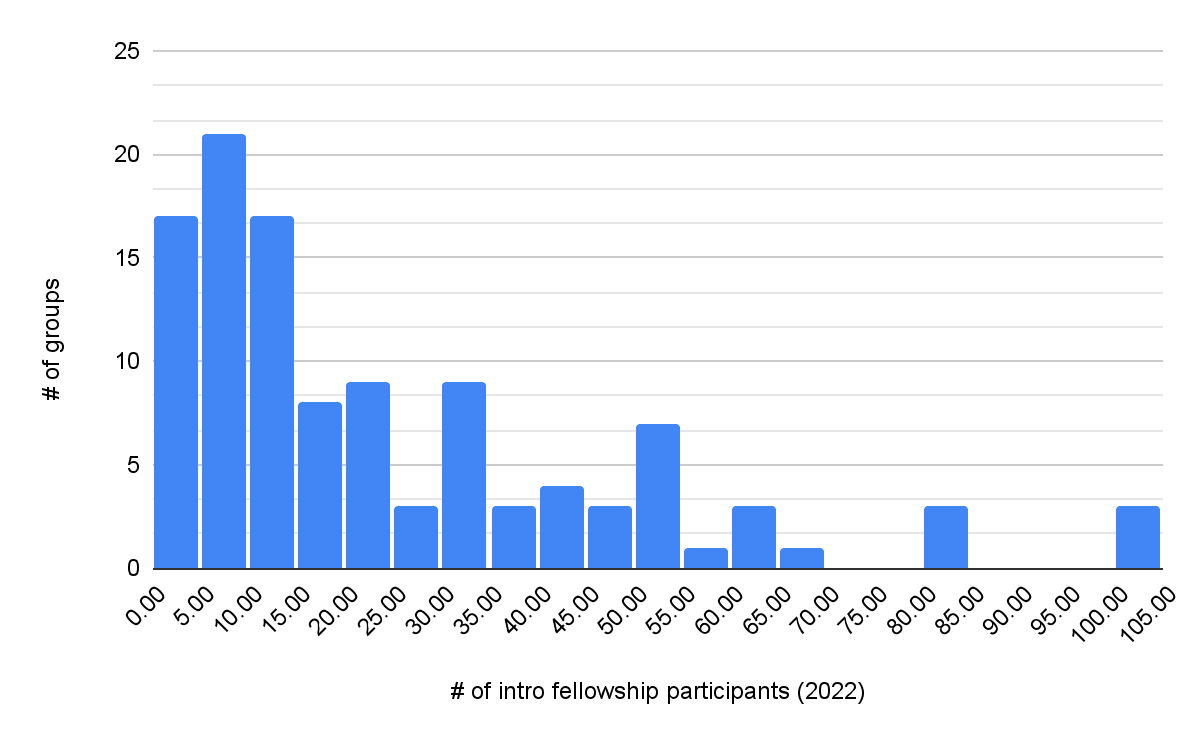
The chart below shows the distribution of how many intro fellowship participants groups had in 2022. The chart below doesn’t include the 66 groups that reported no participants and the two groups that had more than 100 participants.
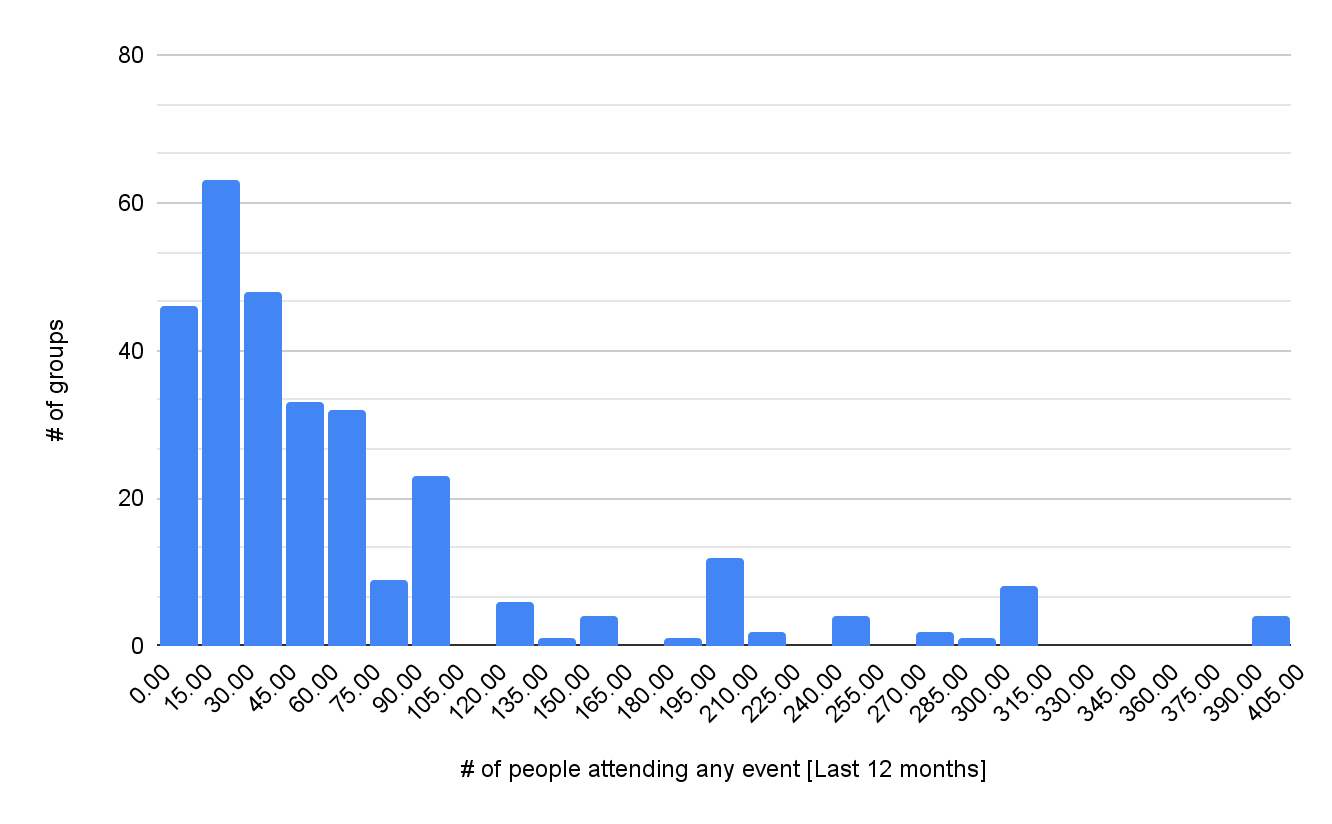
Number of people attending any event within the last 12 months
The graph above shows the distribution of the number of total attendees that groups said they had over the last year. It’s worth noting that the number of total attendees seems particularly heavy-tailed, with the top 10% of active groups in this measure reporting almost half (12,440) of the total number of attendees (26,091) across all groups. Note that this was partially due to nine outliers with more than 400 total attendees (which were not included in this chart, as it traded off against showing a more detailed distribution for the other groups).
Mean and median total attendees within the last year per group in 2019, 2020, and 2022
The two tables above show that the mean, median and total number of attendees across all groups all decreased between 2019 and 2020. This drop was likely due to the pandemic as groups held fewer in-person events, and some groups chose not to hold or barely hold any virtual events in 2020.
However, the total number of attendees across all groups and mean attendees per group increased between 2020 and 2022, while the median number of attendees per group remained the same. The increased number of total attendees is likely due to the high influx of new groups, which pushed up the total even if they have few attendees initially. New groups having fewer attendees on average also meant that the median number of attendees did not increase over time, despite older groups having a higher mean number of attendees than before.
We define an EA group as any group that has in-person or online events to discuss or spread the ideas and principles of effective altruism. The 309 groups include ten cause-specific groups.
We defined active in the census as “(e.g. the group is holding an event/meetup around at least once every 2 months)”.This meant that a few groups just starting out (e.g. they started within the last 2 months of filling out the census) or were only about to start marked themselves inactive.
There were 362 EA groups and 20 cause-specific groups marked as active in CEA’s database as of January 2023. Out of these, 63 EA groups and 10 cause-specific groups didn’t fill out the census. (403 EA and cause-specific groups are now in our database as of May 2023.) This includes groups not originally in our database but who filled out the census and got added to our database. We think a few of these groups that were marked as active in our database then but didn’t fill out the census might actually be inactive, but we canceled this out to account for there likely being a few active EA groups then that are not in our database.
These types include profession-based, cause-specific, workplace, affiliation-based, virtual, regional, and high school groups. We assigned each group only one main group type, even if some of them fall into more than one type (e.g. cause-specific university groups or virtual profession-based groups).
Details on how we asked this question on satisfaction and how we compared it to the 2020 survey, which used a Likert scale, can be found in footnote 18. This question was not about their likelihood to recommend.
For groups that labeled themselves as a city group or as a city-university group hybrid, we asked them what percentage of their group's members are university students. We used this to assign a main type per group — Above 67% as university groups, 34-67% as a city-university hybrid, and below 34% as city groups. Also, some of the university groups cater to more than one university.
To calculate the growth rate in 2022 (31%), we assumed that the proportion of active groups becoming inactive in 2021 and 2022 was the same. (This assumption may not be true, as groups may be more likely to become inactive on their 2nd year than on their first year, but we’re using this assumption for this estimation.) With this, we can assume the growth rate grew by 65% from 2021 to 2022, as the growth rate among groups still active in 2022 is 43%, which is 65% higher than the 26% growth rate in 2021. So if x is the growth rate in 2022, then this equation can be used to find x: (1+x/1.65)*(1+x)=1.55.
1.55 is from the two growth rates combining to be 55%, as this was the growth in the number of groups from 2020-2022. This results in x (the growth rate in 2022) being 30.7%, and the growth rate in 2021 being 18.6%.
The count of virtual/global groups in the chart above includes profession-based (e.g. High Impact Medicine, High Impact Engineers), virtual (e.g. EA Anywhere), affiliation-based (e.g. EA for Christians), and workplace groups (e.g. Microsoft EA). These groups may have in-person meetings but are not based in a single country or continent.
The means are pushed upwards by a small number of groups that reported very high numbers for these measures. We emailed groups that reported outliers to understand better whether their results were true outliers or due to overreporting. This showed that most outliers are not inflated (though a few data points per measure seem inflated). As such, we think this suggests that there really is significant heavy-tailedness in the activity and engagement levels of groups.
The 2020 group survey asked organizers to estimate the number of people in their group who reached certain EA engagement levels (from category 1 to 4). The 2022 census asked organizers to estimate the number of people in their group who reached category 3 and above via this question.
If we roughly convert the Likert scale above (excluding those who answered N/A) into a 1-10 scale, then the mean satisfaction rating then was 7.61. This means that the average satisfaction with CEA stayed almost the same between 2020 and 2022.
The neutral point of a 1-10 scale is technically 5.5. From this, we can roughly convert these likert ratings to the 1-10 scale: Very Dissatisfied - 1.50, Dissatisfied - 2.83, Somewhat Dissatisfied - 4.17, Neither - 5.5, Somewhat Satisfied - 6.83, Satisfied - 8.17, Very Satisfied - 9.5.
The question asked in the 2020 survey, which was basically the same as in the 2019 survey, was this: “Please estimate how many people in total have engaged in some way with your group over the last year (12 months) e.g. have attended an event, engage in online discussion, engage in group activities of any other kind. Note: please don’t include people who have only ‘liked’ or joined the Facebook group but not engaged in any other way.”
As some groups are virtual and some attendees could be attending events of more than one group (e.g. someone attending events of a uni group and a national group), this is likely an overestimate of the unique number of total attendees.


Thanks so much for this! Could we get country-by-country breakdowns? Privately would be fine. For example, I'd love to see how the results for the Netherlands have changed over time. I'd also like to see how different countries compare to one another on various metrics.
Hey James, sorry for the late reply, but thanks for the feedback!
Here are the averages across groups by country for each of the group measures:
It would be time-consuming to show how the group measures have changed by country across groups surveys, and some questions in the 2022 census weren’t asked previously, so I hope the above is useful enough for you.
I can share the number of groups founded per country by year since 2011 here though (for groups still currently active):
I only included countries with a minimum of 3 groups that filled out the 2022 census in both images above. I hope this helps!
Beaut, thanks very much!