Hey Brian, we created all of these Likert scale plots (also called diverging stacked bar charts) in R. There is a very convoluted way to make them in Excel, but I think Google Sheets doesn't have the manual editing tools required. I put links to a few guides below. Hope this helps!
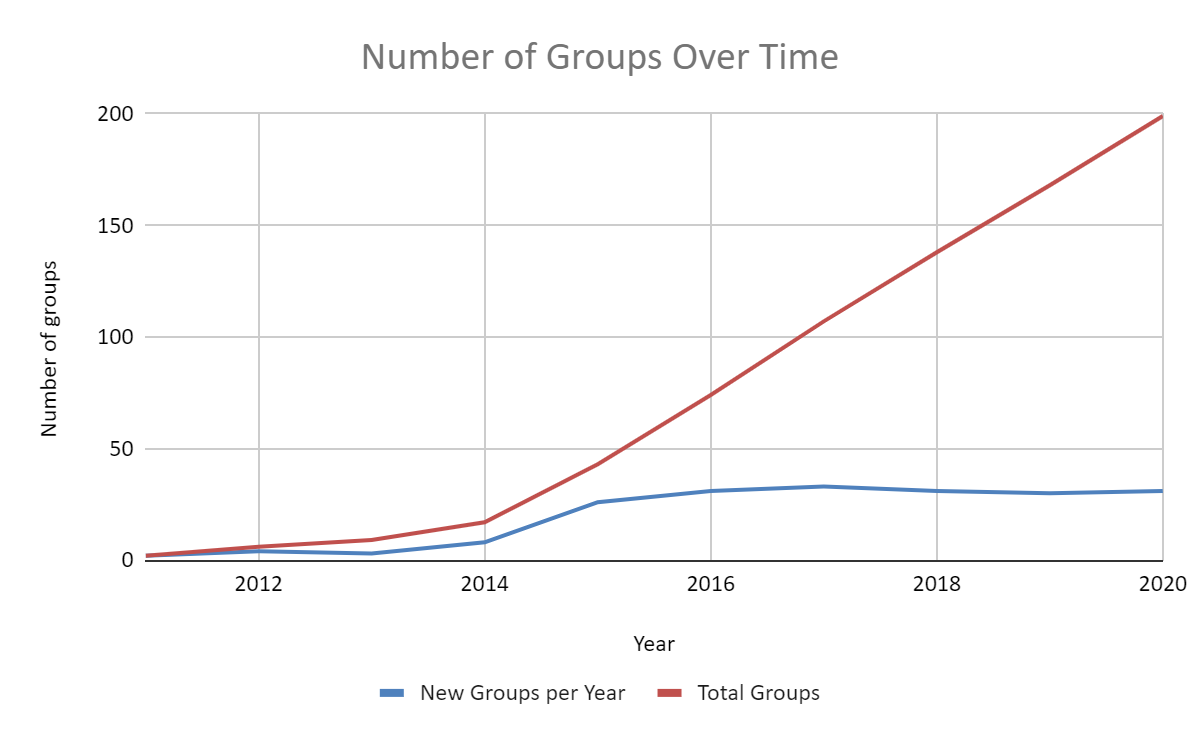
In the 'Number of New Groups' chart, and where it says "It appears that growth has stalled since a dramatic surge in 2015, with roughly 30 groups starting per year since 2015.", is this on net/does this take into account old groups disbanding? Or does it assume groups don't disband?
The graph isn't accounting for groups which disbanded before the 2020 survey, because we don't have direct access to how many groups came into existence and then stopped existing before the survey (although we do have good information about this for recent years, since CEA are aware of almost every active group (I assume- it seems unlikely there are a lot of secret groups)).
That said, as discussed here, when we compare cross year data, we don't see evidence of much attrition on a yearly basis.
Hi sorry if I'm not seeing it in the nice series of posts on the survey, but how was the survey distributed? I'd be curious to any context to get a sense of any potential selection bias in the survey. It seems like there's around 2200 respondents. Does someone have a sense of ballpark how many that is relative to the total number of EA participants and potential respondents?
Also is there a reason why there wasn't a survey in 2021?
Thanks for your comment! (Just to clarify, this is a post about our separate EA Groups survey, but I assume you're asking about the EA Survey).
The EA Survey is distributed through a variety of different channels or 'referrers' (including e-mails and social media from the main EA orgs, the EA Forum, e-mailing past survey takers, and local groups). The vast majority of responses come from a relatively small number of those referrers though (80,000 Hours, EA Forum, Local Groups, e-mail to past respondents and the EA newsletter being the main ones). You can see more detail on the composition here.
We discuss representativeness issues in more detail here (the major issue, of course, is that no-one knows the true underlying composition of the EA community, so it's hard to assess the representativeness of the sample against the true population), and provide some sensitivity checks based on the different referrers here.
Our post on what we estimate the size of the EA community as a whole is here. We can estimate the size of the population of people who are highly engaged with EA reasonably well through comparing various benchmarks for which we do have data, and we estimate that in 2019 we sampled around 40% of that population (a little less in 2020). We estimate that we sampled much lower shares of people who are less engaged with EA, though it's also much more difficult to estimate the true size of these populations (e.g. it's much harder to know how many people in total have read a few articles about EA or listened to a few podcasts). We do have some more analyses forthcoming about estimating these different stages in the funnel following on from our work on how many people have heard of EA here (which is even harder to estimate).
There wasn't a survey run in 2021 because the 2020 survey was run very late in the year (right at the end in fact). On average, there's historically been around 15 months between EA Surveys, rather than 12 months, which means we also skipped 2016, and it's also better not to run the EA Survey during the very end of the year (due to holidays and so on), so we thought it better to run it during the middle of the year this year.
Is this survey going to be run again? It seems there isn't a 2021 survey? (Or at least the results are published yet)
Yeh, I noted in my reply to your earlier comment, there wasn't an EA Survey run in 2021, but we are planning to run one this year. (That is assuming that you are referring to the EA Survey, not the Groups Survey).
Thanks for your suggested questions as well. Unfortunately, space is very limited in the EA Survey, and there are a lot of requests from other orgs, so it may not be possible to add any new questions.
We have previously asked some questions, at least somewhat related to the ones you suggest, i.e. we have previously asked about donation targets (all years, though limited responses), political ID (all years pre-2020), volunteering (pre-2017), and occupation/experience with software engineering/machine learning (pre-2018 and 2019 respectively).
222 unique groups completed the survey from 50 different countries.
There were roughly equal numbers of city groups (78) and university groups (77), with a smaller number of national/regional groups ( 39), joint university/city groups, (12) and other groups (16).
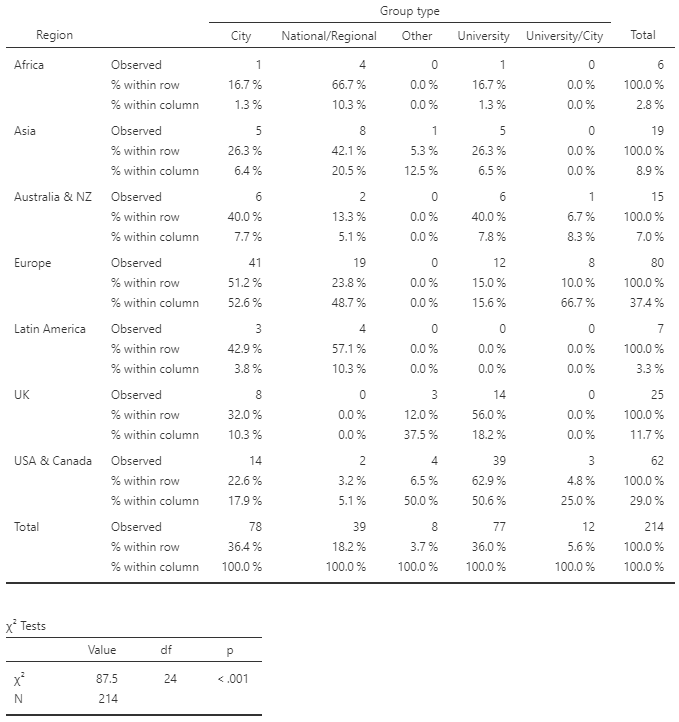
The largest proportion of groups are in Europe (37%), followed by US/Canada (29%), the UK (12%), Australasia (7%) and 15% in the rest of the world
The number of new groups founded per year has remained steady since 2015
Nearly 12,000 people interacted with these groups in some fashion in the previous year, lower than in previous years (likely explained by the pandemic)
Many organizers do not rate their groups as well able to help members with volunteering or taking action in their spare time, while many organizers do rate their groups as well able to help members with donations or careers
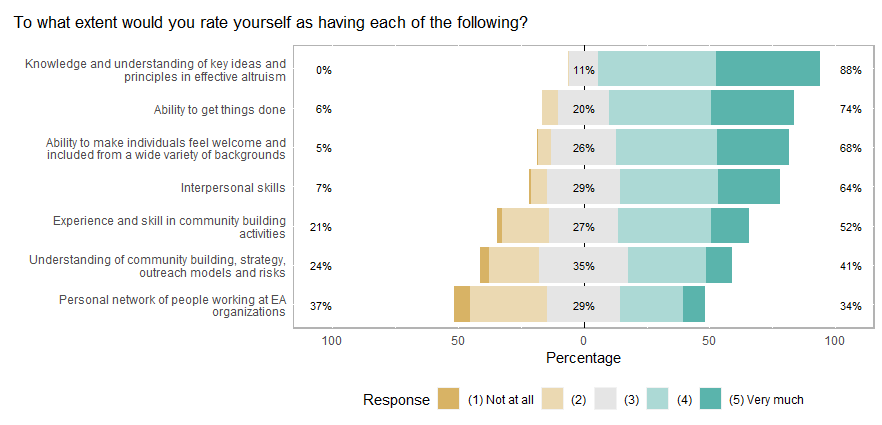
Most organizers rate themselves as possessing a good knowledge of EA concepts, but lower in understanding of movement-building risks and strategy
The median number of hours spent by respondents organizing groups was 10 per month, and the median number of hours they estimate to be spent organizing their group overall is 20 per month
Introduction
The EA Group Organizers Survey is run as a collaboration between Rethink Priorities and the Centre for Effective Altruism. In addition to providing information about groups to aid CEA in their activities, the survey also provides public aggregate information to organizers and other members of their community to aid their movement-building efforts. We are open to requests for additional analyses, though we can’t promise to be able to undertake all of these.
Note: full size versions of graphs can be viewed by opening them in a new tab.
Group Growth
There were 222 unique local groups represented in the survey responses. 199 provided a founding year. This accounts for around 95% of known groups.
It appears that growth has stalled since a dramatic surge in 2015, with roughly 30 new groups in each cohort of the survey since 2015. Despite the pandemic, the growth in new groups does not seem to have slowed, with 19 of the 31 groups beginning in 2020 starting after March.
Examining the growth of different group types, the growth of city groups appears to have declined since 2017-2018.
The majority of new groups being founded are in Europe (excluding the UK) or the US/Canada.
Comparing group growth across region, Africa, Asia, and Latin America are mostly made up of national/regional groups (40-65%), likely reflecting a low number of groups overall, aside from the national groups of various countries. Europe (excluding the UK) has the highest percentage of city groups (50%) and only 15% university groups, while the UK and the USA & Canada are only 20-30% city groups and roughly 60% university groups.
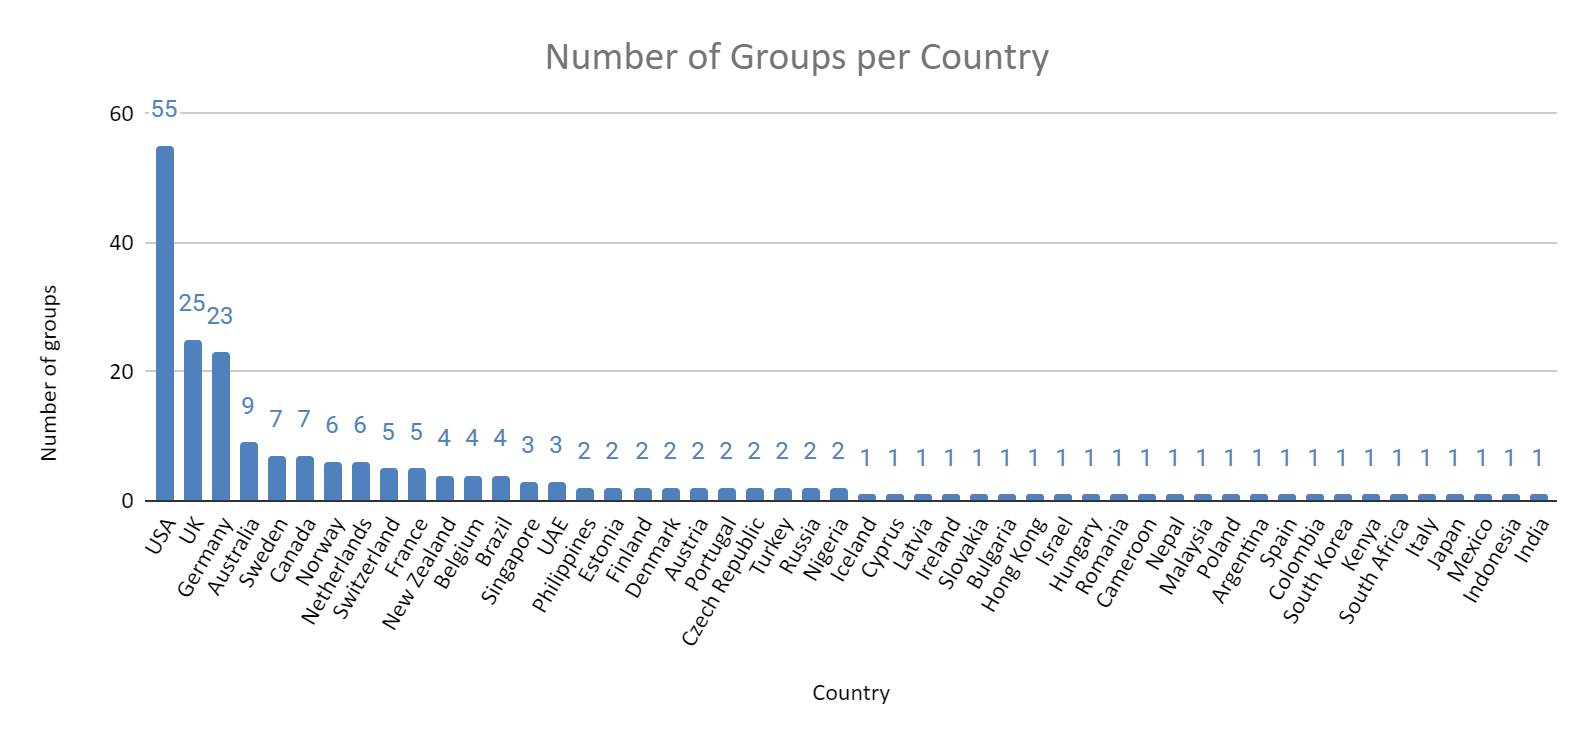
Similar to 2019, the USA, the UK, and Germany have the highest number of groups by some distance, but of these only the UK ranks in the top ten for groups per capita.
Group Composition
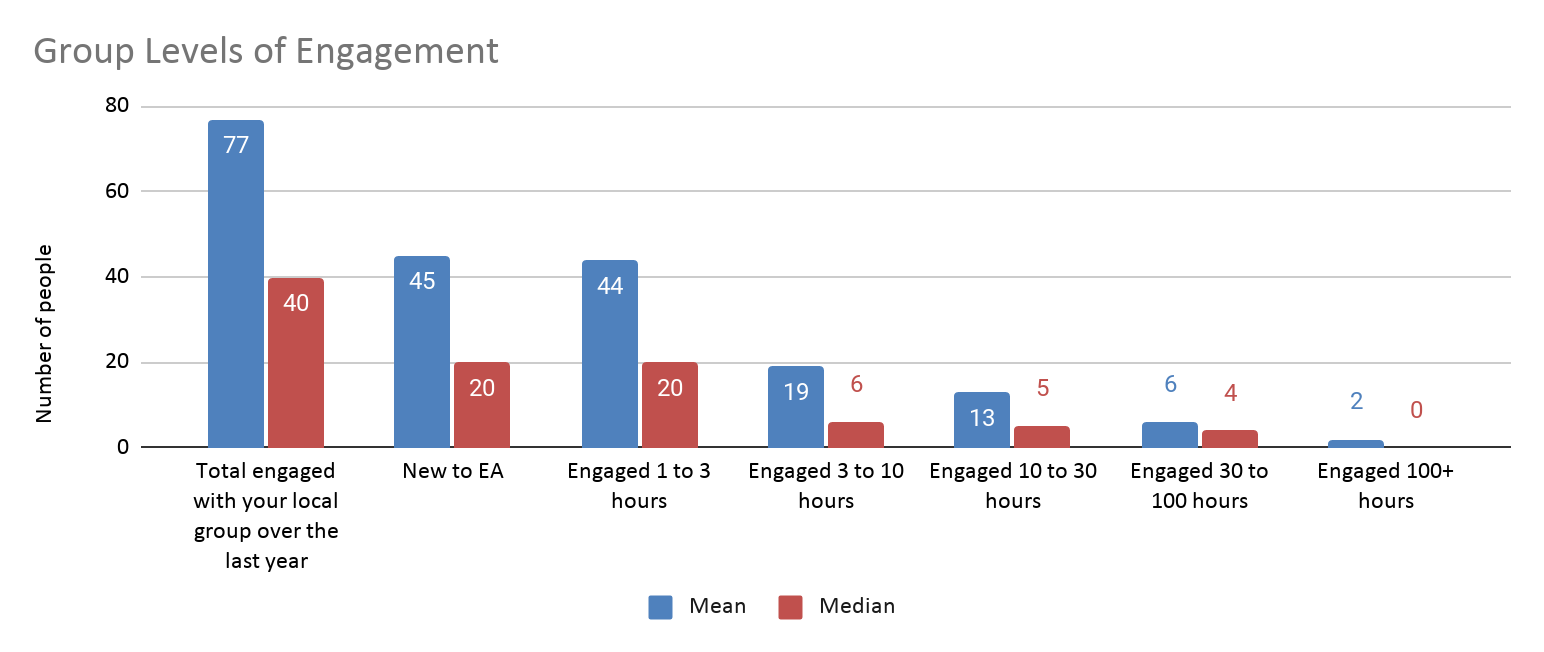
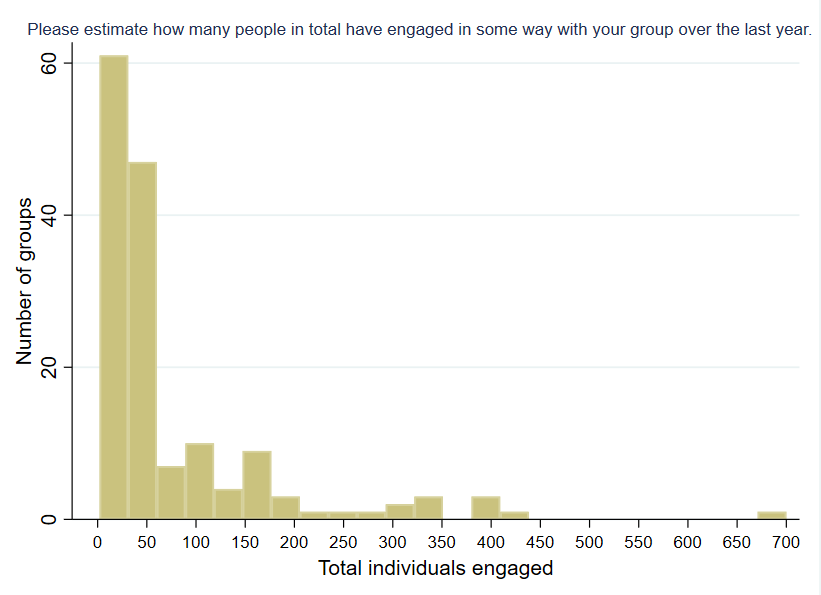
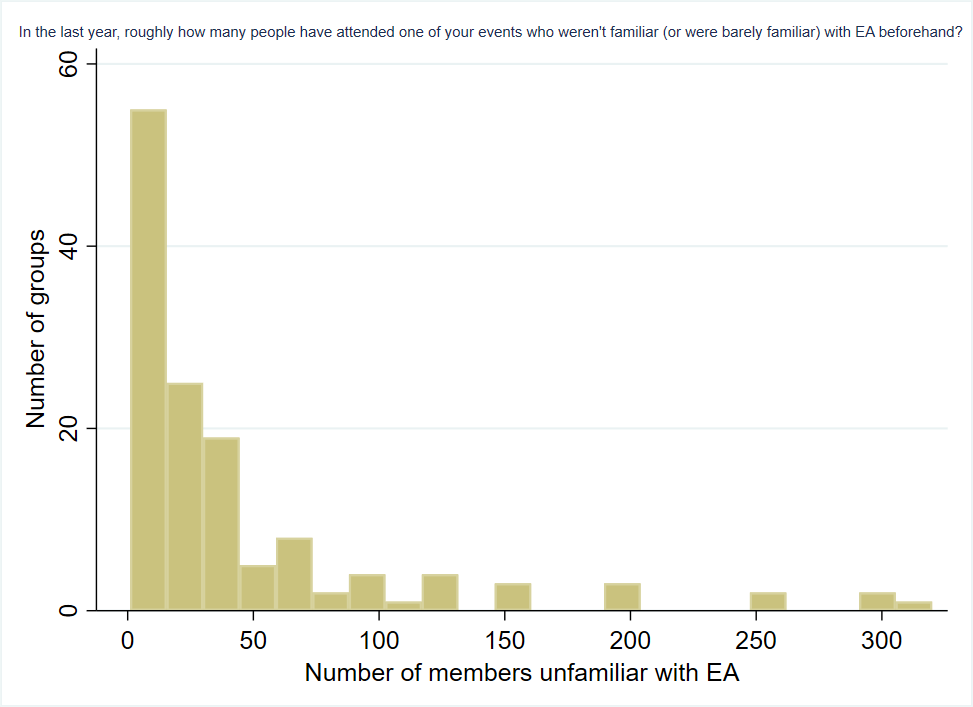
This year, we asked respondents how many people engaged with their group in total (excluding people who only ‘engaged’ by liking or joining a Facebook page or group, but not engaged in any other way). We also asked how many people who engaged with the group were new to EA. We cut two questions that we had asked in previous years, about how many group members regularly attended events and how many members were highly engaged with the EA community.
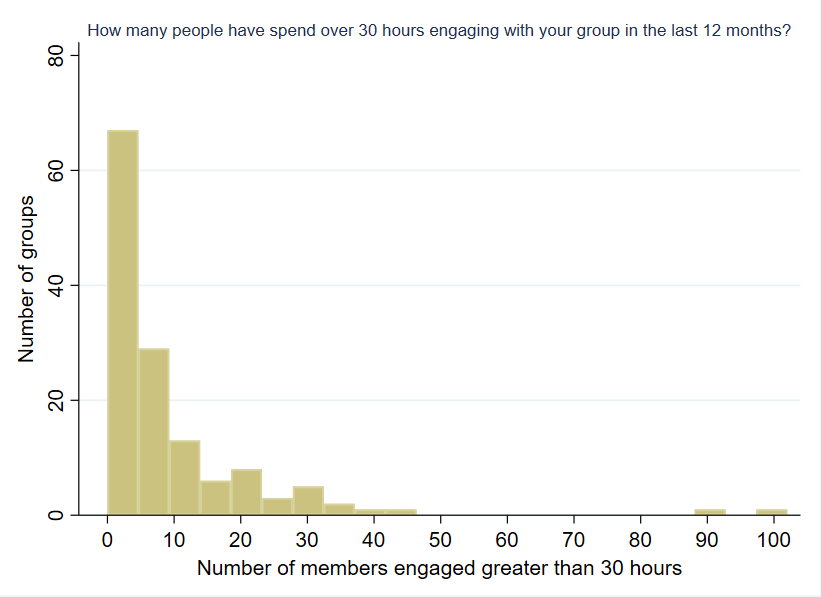
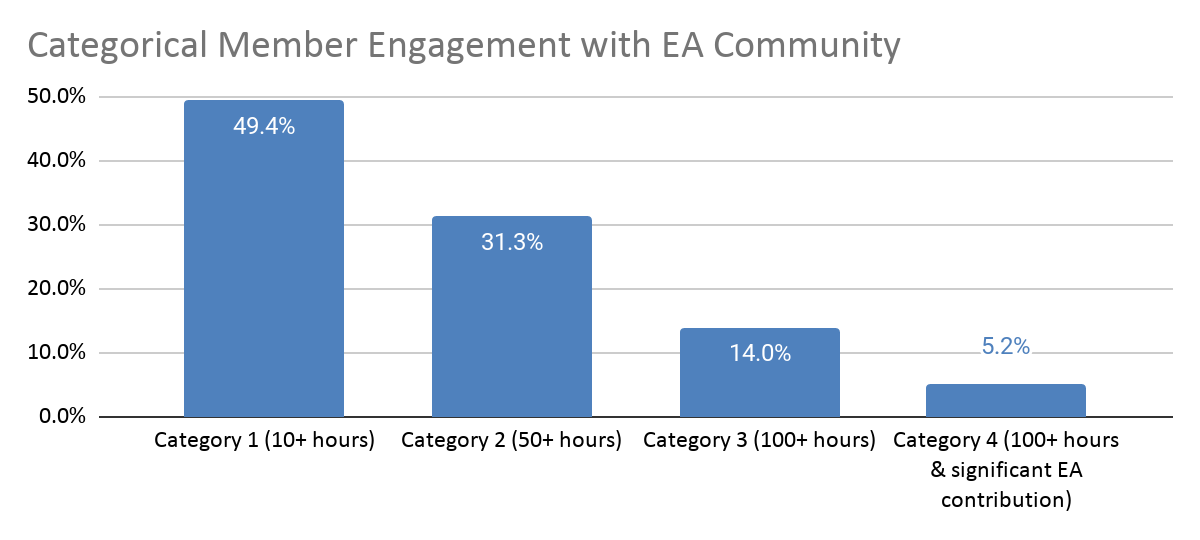
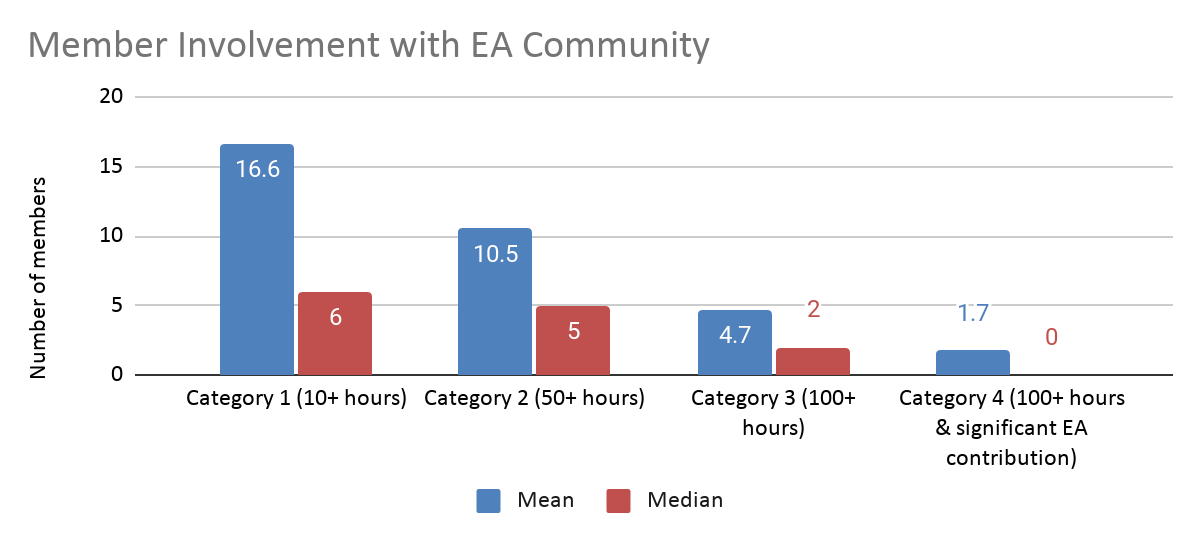
In place of these questions, we asked respondents to estimate the composition of their groups in terms of the numbers of hours their members engaged with the group and in terms of their qualitative levels of engagement (loosely based on the EA Survey engagement scale).
Of note, the engagement scale used here starts at a substantially higher level than the hours spent engaged scale, since this former question stipulates that organizers should only include members who have engaged with the group for >10 hours, and the lowest response category includes only members who have engaged with EA content for at least 10 hours (see Appendix). As such, responses to these two questions will not be overlapping.
There was also considerable non-response to these two questions, with only about 60% of respondents completing them, so the sum total of members at different levels is likely considerably under-estimated. We cannot speak to whether or in what way the pattern of results are distorted as a result of this non-response (e.g. it is possible that organizers with lower total numbers of members, or lower proportions of highly engaged members were less likely to complete these questions).
While total group count increased from 2019, the total number of people who engaged with groups dropped from 14,392 to 11,971 in 2020. The average number of people who engaged with groups dropped from 102 to 77, and the median decreased from 50 to 40.
The average number of new members who were unfamiliar with EA decreased from 61 to 45 and the median is down from 30 to 20. Much of this is likely explained by the pandemic, as open comment responses attest.
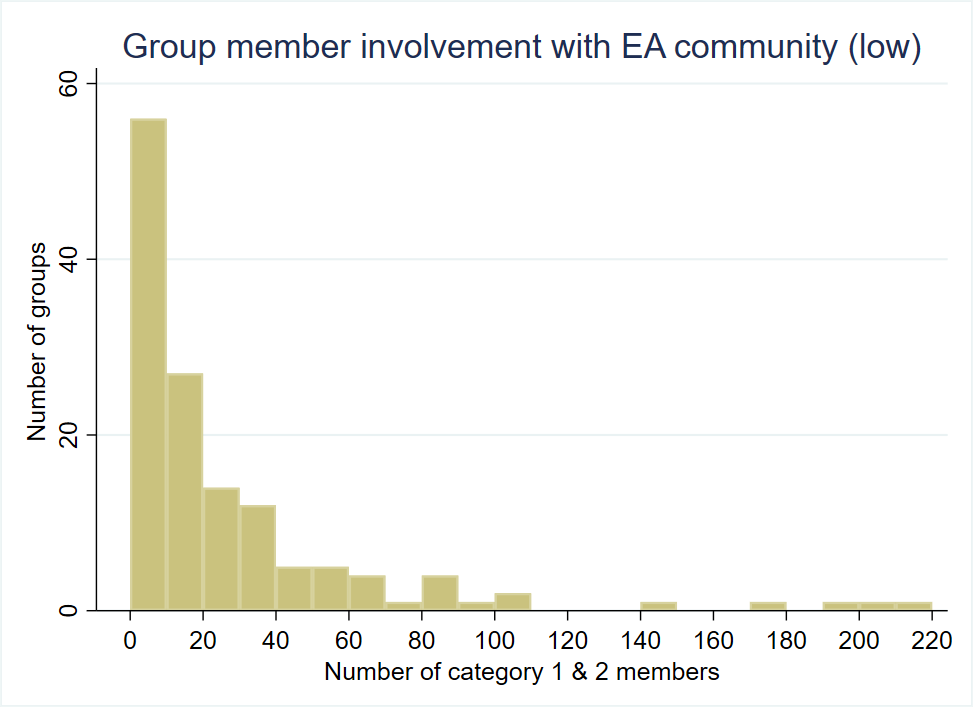
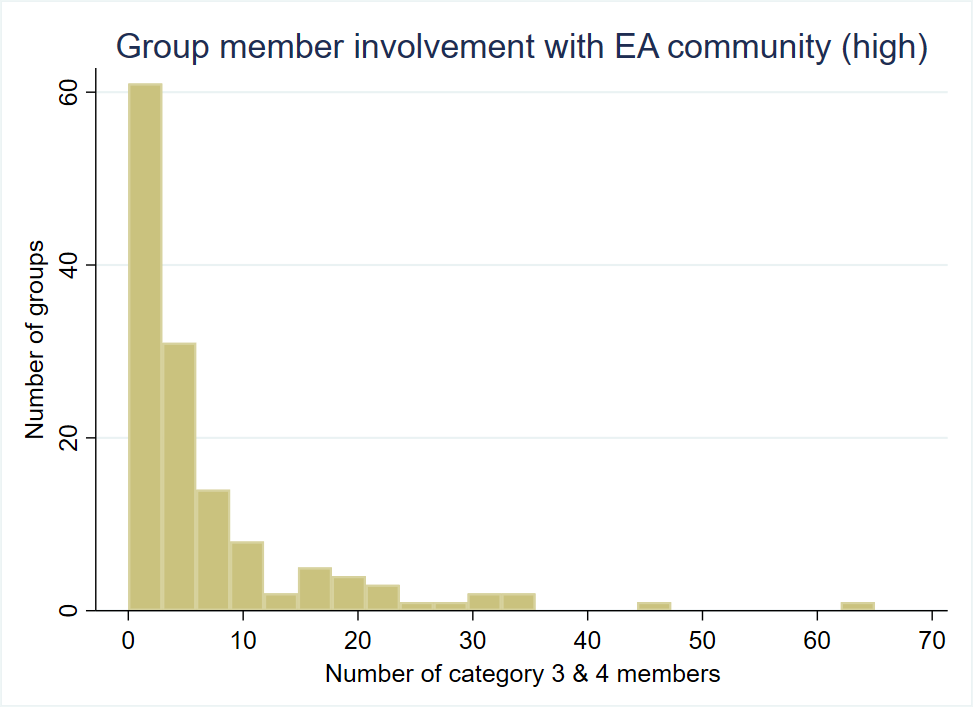
The distributions for most engagement metrics are quite skewed, with a handful of groups having much higher numbers than others. The large means are being pushed up by a small number of groups with very high levels of engagement, as can be seen by the frequency charts below.
Respondents estimated that there were 4500 members in total who fell within one of the 4 specified engagement categories.
Events and outreach
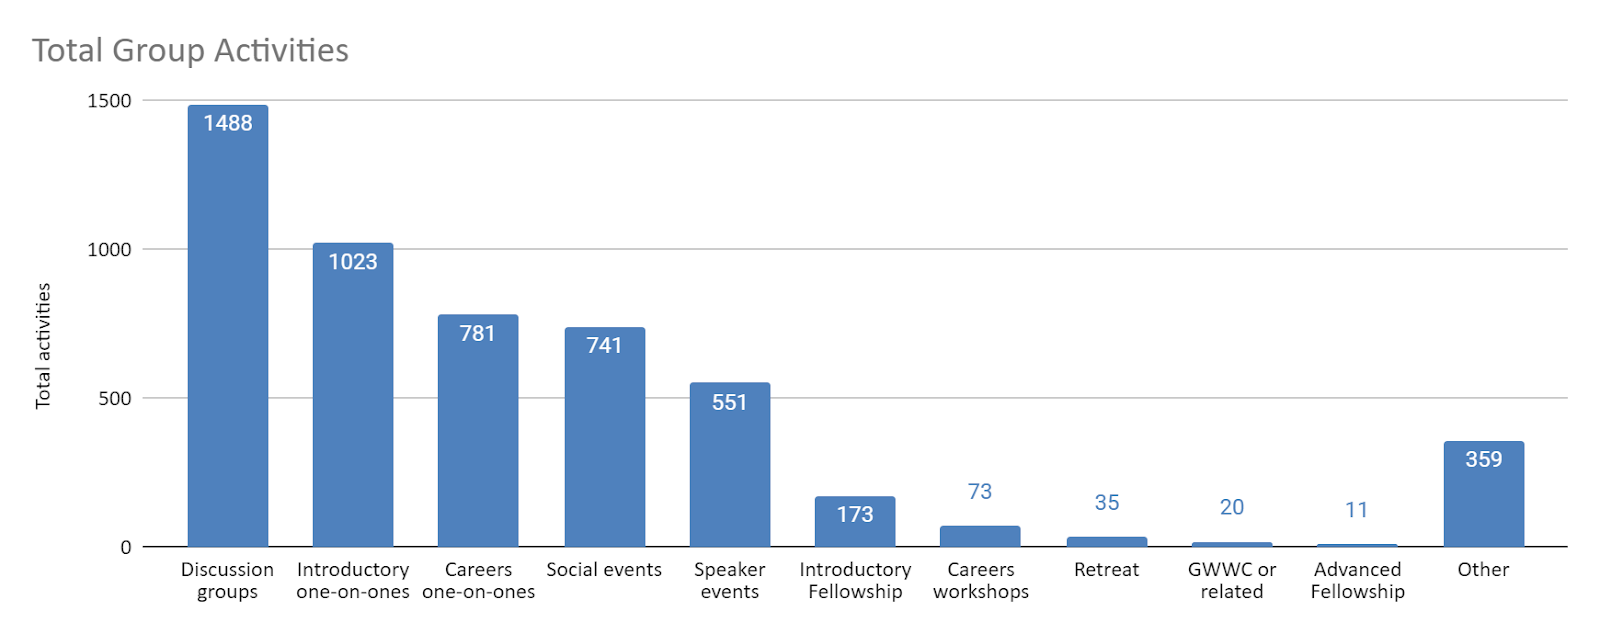
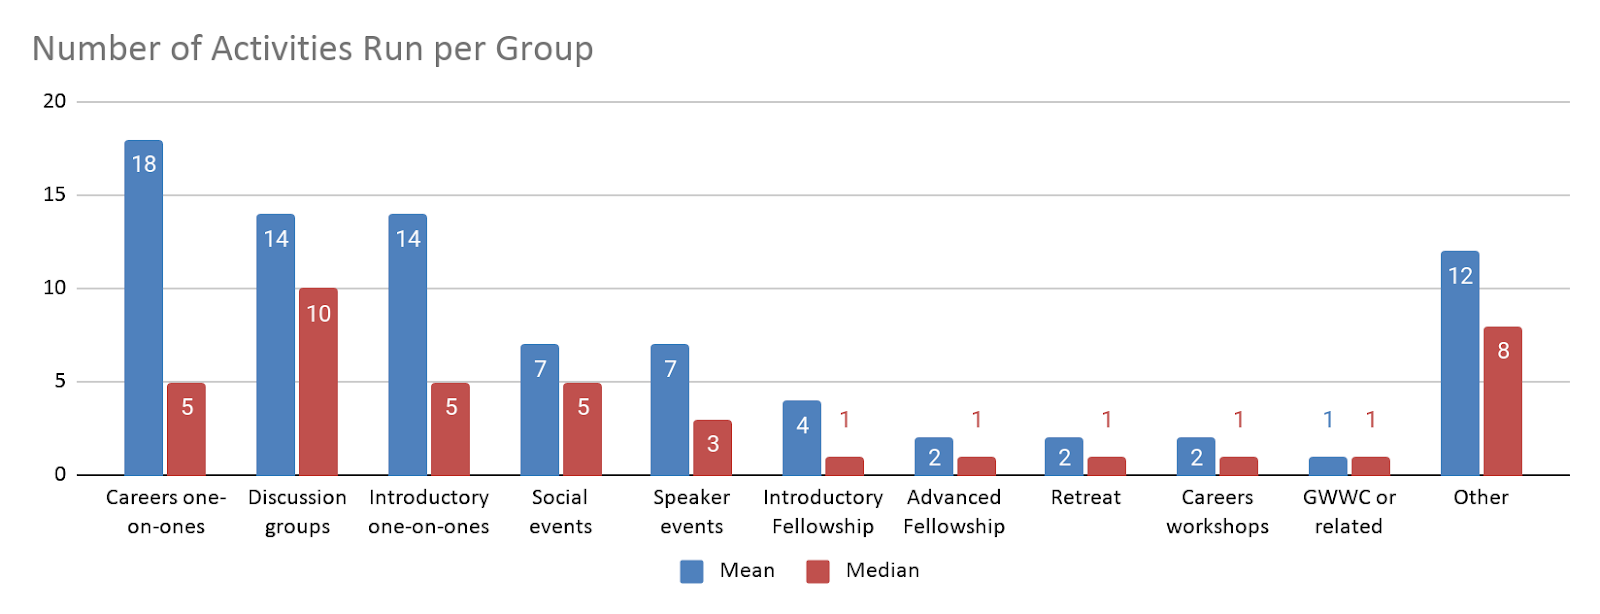
The most commonly held group activities were one-on-ones of different kinds and discussion groups, although the vast majority of one-on-ones were being held by a small number of groups. Events in the ‘Other’ category include things like lunches, reading groups, workdays, group career discussions, individual member presentations, outreach/community events, and advice/mentorship programs.
Many more (>10x) introductory fellowships were run than advanced fellowships.
Speaker events drew in the largest crowds on average, with most other event types only having 20 or fewer average attendees.
Note: Organisers were asked for “the average number of attendees” so the median reported is the median of group means.
Group Focus
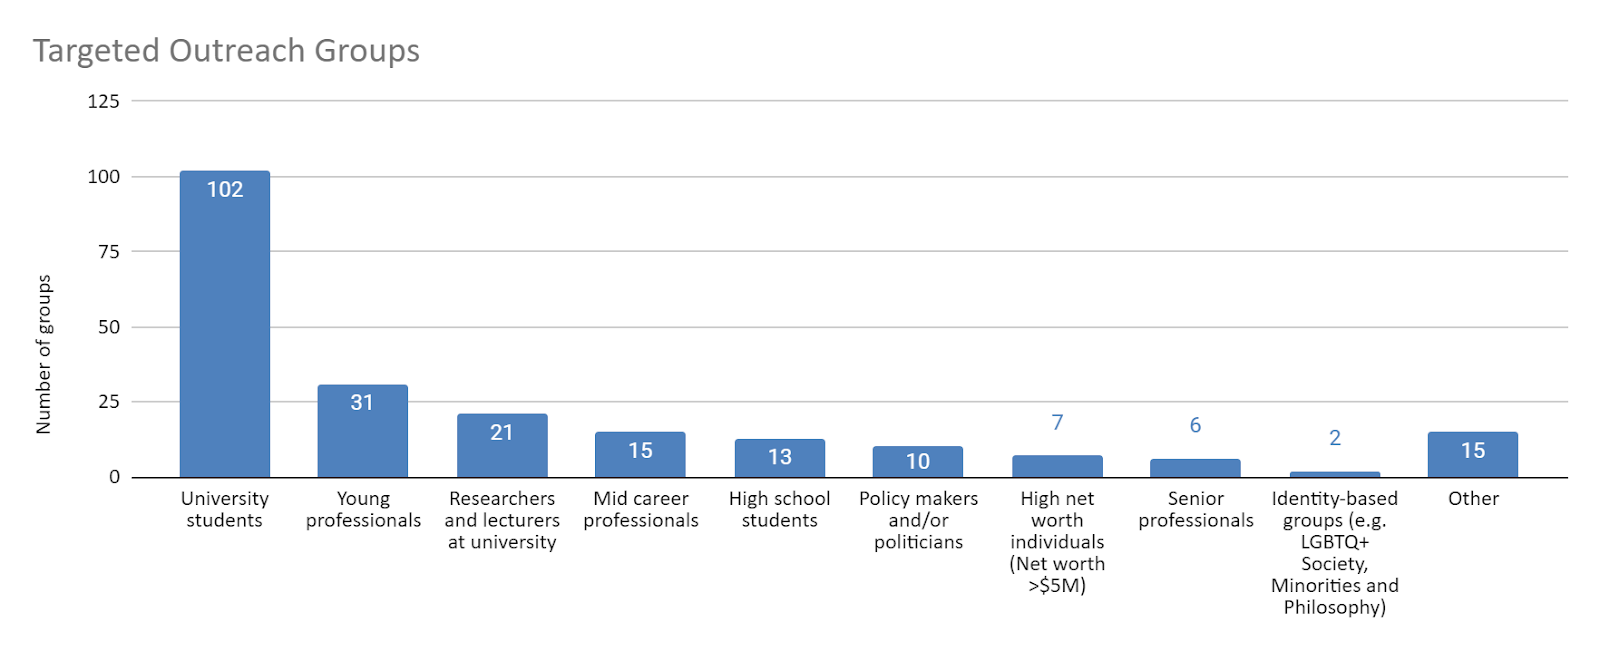
The vast majority of groups running specific outreach programs are focused on students, followed by minorities selecting young professionals and researchers/lecturers at universities. Very few identified themselves as focusing on mid-career or senior professionals, high school students, policy-makers, HNWs or identify-based groups.
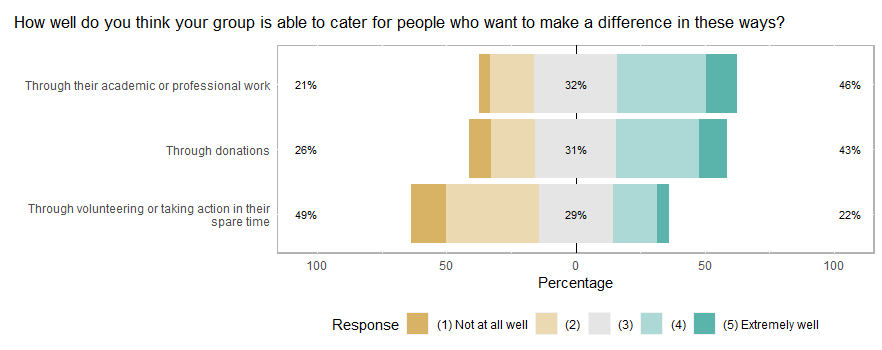
Organizers were asked how well their group was able to cater for groups with different interests on a scale from (1) Not at all well to (5) Extremely well. Roughly 50% of organisers responded with only a 1 or 2 for catering well to people wanting to make a difference through volunteering or effectively using their spare time. Groups were most likely to feel able to cater to those looking to make a difference through study or professional work. Groups rated themselves roughly equally able to cater to people interested in making a difference through donations or academic/professional work.
Group Resources & Community Health
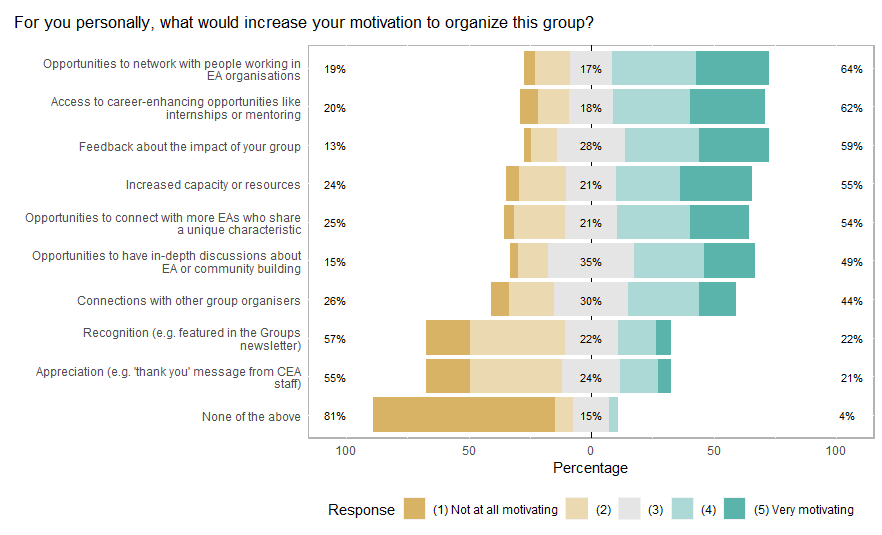
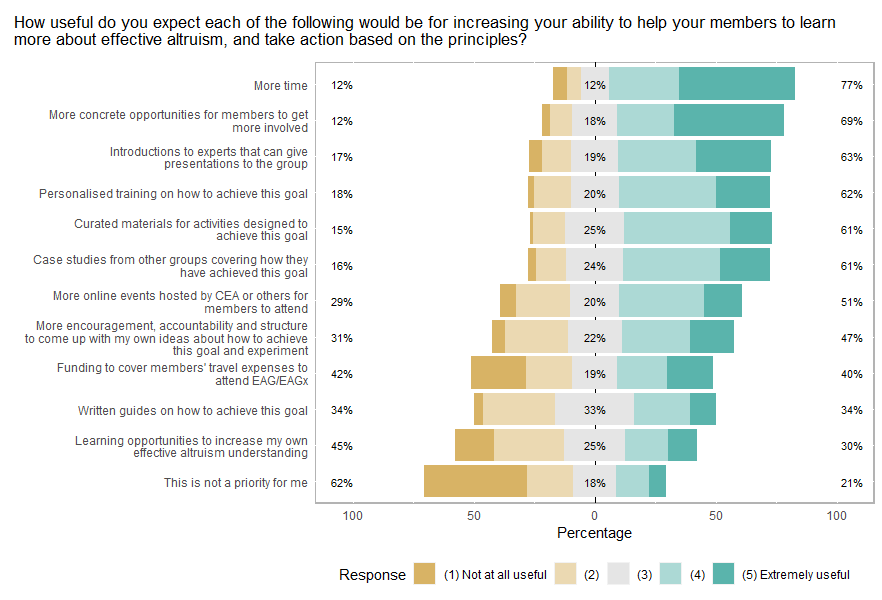
Large numbers of organisers report that opportunities to network with people in EA orgs, career-enhancing opportunities like internships or mentoring, feedback on the impact of their group, increased capacity or resources, and opportunities to connect with EAs who they share unique characteristics and opportunities to have in-depth discussions about EA or community-building would increase their motivation to organize their group. Many fewer report that appreciation and recognition would be motivating.
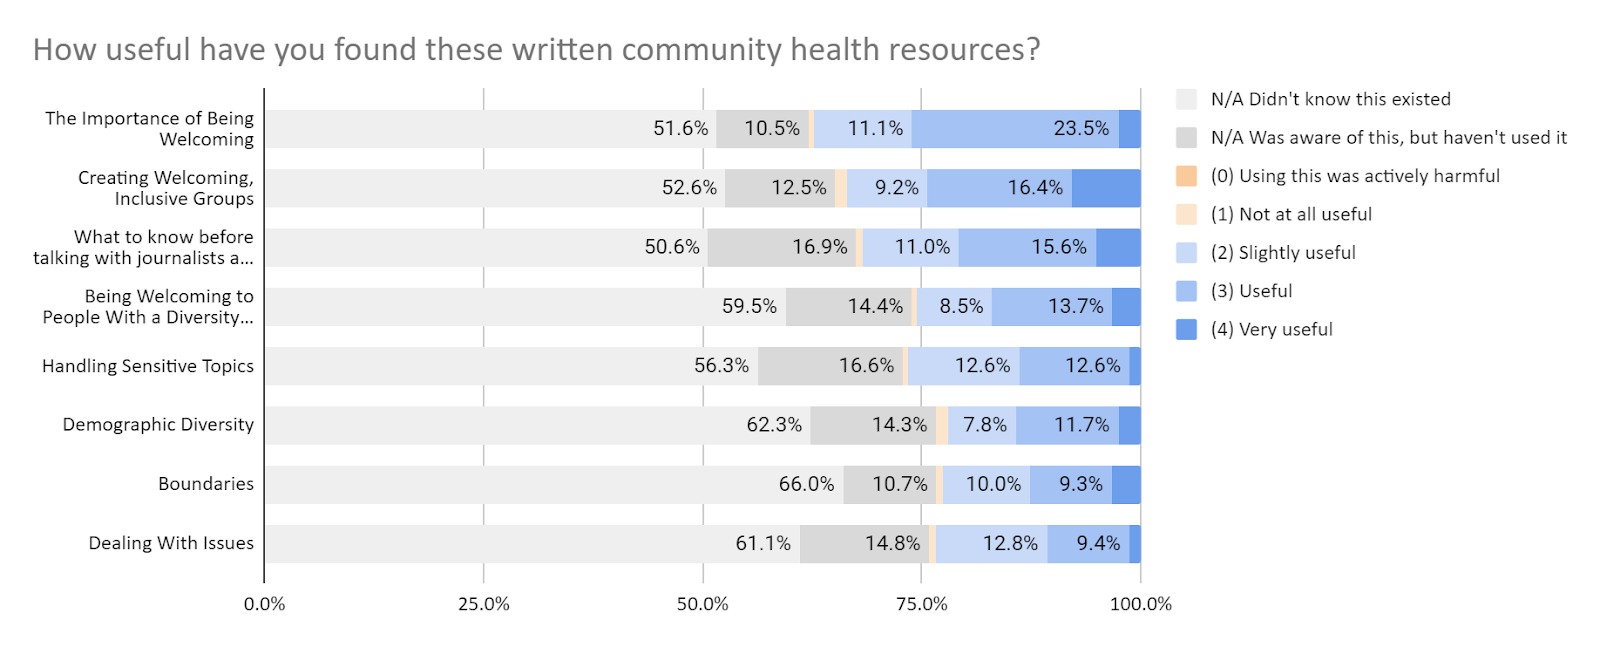
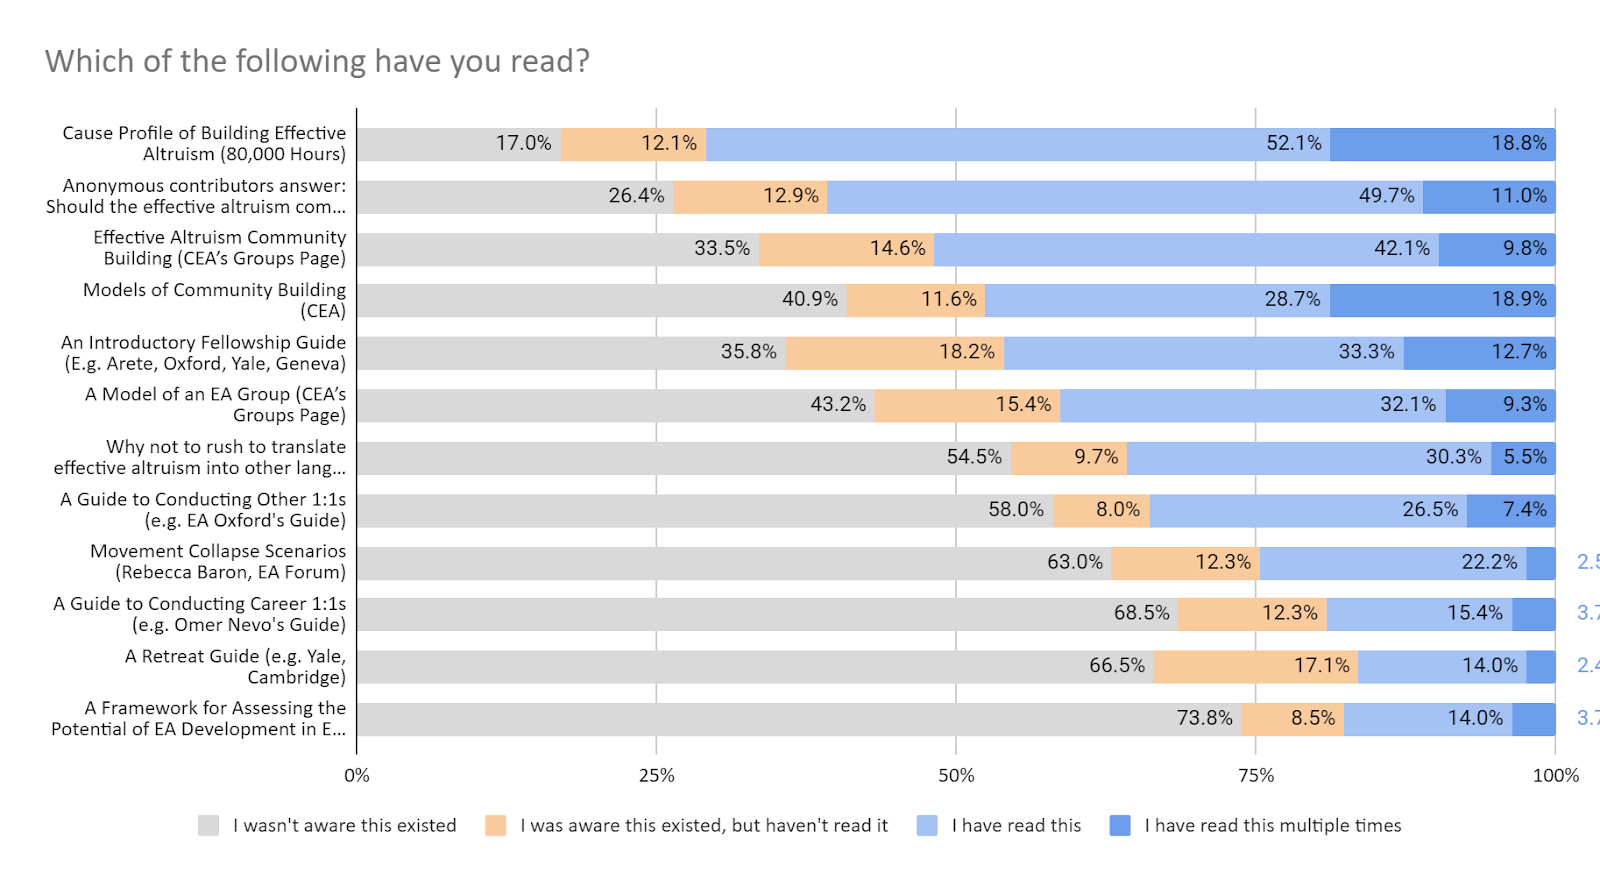
Overall, large number of organisers were not aware of or had not used various resources for groups, but those who had overwhelmingly found them helpful.
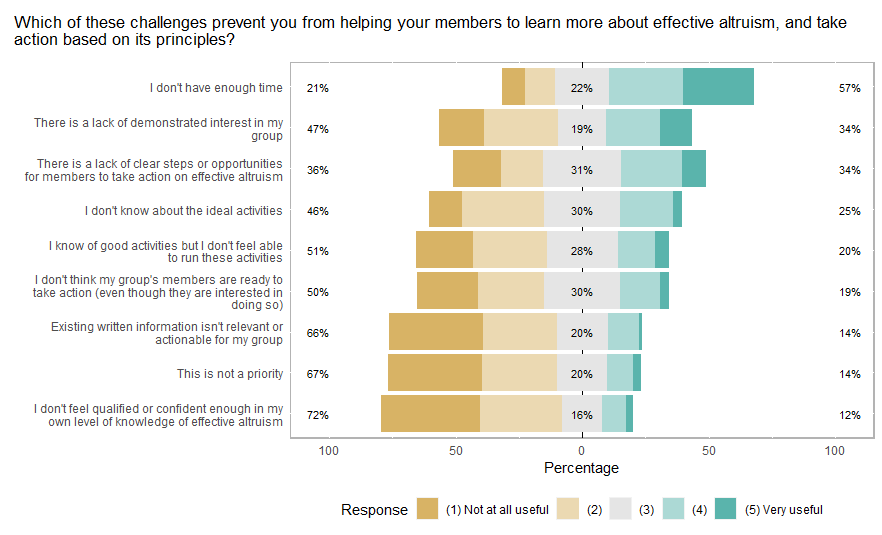
Organizers reported that the most significant challenge for them helping their members to learn more about EA and take action is a lack of time, followed by a lack of clear steps and a lack of demonstrated interest by members. Other reported issues include lack of ‘impact road map’, lack of funding, organisers being only part time, and personal issues distracting attention from organising.
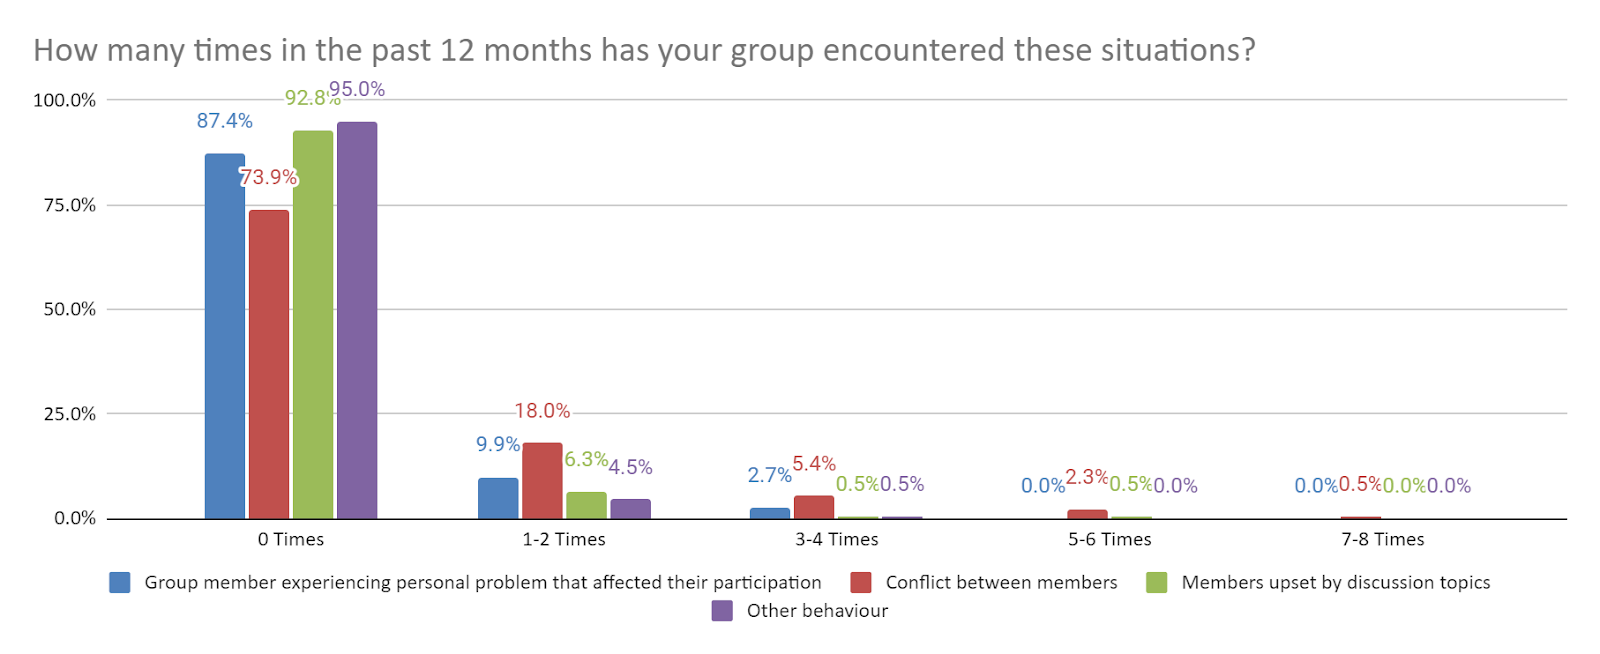
We also asked respondents about how many times their group had encountered certain challenging situations in the last 12 months. Many organisers left these responses blank, so it is not certain whether they skipped this portion of the survey or if they intended a blank reply to mean zero. Results should be interpreted with this in mind.
How many times in the past 12 months has your group encountered these situations?
Total occurrence reported
Number of responses
Number of responses (excl. zero)
Group member experiencing personal problem that affected their participation
126
120
59
Conflict between members
46
113
28
Members upset by discussion topics
28
109
16
Other behaviour
13
86
11
Two thirds of organisers that experienced these situations resolved them without feeling outside help was necessary. Minorities (20%) used resources within EA, 11 % used resources outside of EA to help resolve them, and 2% would have liked help but didn’t know where to find any.
If relevant, did you use any resources to help work out how to handle this situation?
Count
Percent
I handled it without feeling external resources were necessary
55
67%
I used resources within EA
16
20%
I used resources outside of EA
9
11%
I would have liked help or resources but didn't find any or didn't know about any
2
2%
Over 60% of organisers report being somewhat to very satisfied with support from CEA, 12% were indifferent, and only 2 individuals were somewhat or very dissatisfied (1%). Just over a quarter of organisers report not having received any support from CEA.
Organiser Characteristics
Nearly all organisers rate themselves as having a key understanding of EA principles. About 20 percent rate themselves as not having an understanding of or experience in community building. Thirty seven percent don’t have a personal network of people working at EA organizations.
The median number of hours individual organisers reported spending organizing their group in a typical month was 10, and the median number of hours they estimated spent organizing their group overall (including other organizers) was 20. A small number of respondents reported much higher numbers than this, increasing the mean number of hours spent.
Organizers only knew a median of 5 other EA organizers who they would feel happy asking for advice related to community building, while some knew up to 50. This may speak to the need for more opportunities for networking and advice for organizers.
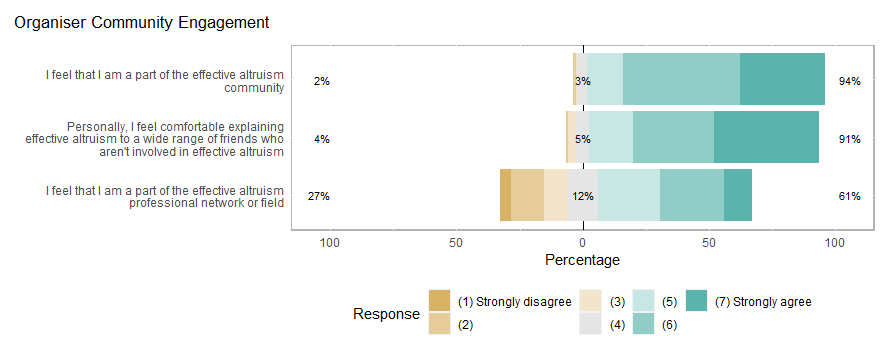
Predictably, the vast majority of organizers report that they feel they are part of the EA community. Just over a quarter disagree that they feel part of the “effective altruism professional network or field.” It is unclear what this means, but it is perhaps not surprising given that most organisers are not paid to organize groups professionally.
Organiser Demographics
Just over 70% of organizers were male, roughly in line with the proportion found in the EA Survey sample overall. Almost half are 25 or younger and almost 90% younger than 34 (somewhat younger than the total EA sample). However, only 47% identify as white (much lower than the EA community overall), which is likely explained in large part by the many organizers from majority non-white countries, with relatively low numbers of EAs overall.
Demographic
Category
Count
Percent
Gender
Male
128
70.3%
Female
46
25.3%
Non-binary
8
4.4%
Age
18-25
92
49.5%
25-34
73
39.2%
35-44
17
9.1%
45+
4
2.2%
Racial/ethnic category
American Indian, Alaska Native, or indigenous origin
3
1.4%
Asian, Asian American, or Asian British origin
31
14.4%
Black, Black British, African American, African Caribbean, or African origin
11
5.6%
Hispanic, Latin American, or Iberian origin
18
9.5%
Middle Eastern, North African, or Arab origin
8
4.5%
Native Hawaiian/Pacific Islander origin
3
1.2%
White or European origin
142
47.0%
None of these apply (please describe):
3
1.6%
Degree
High school diploma
13
7.2%
2-year degree or associate’s degree
2
1.1%
Professional degree
7
3.9%
Undergraduate university degree
88
48.9%
Graduate degree (e.g. Master’s)
47
26.1%
Doctoral degree (e.g. PhD)
23
12.8%
First generation student
Yes
40
21.5%
No
146
78.5%
Financial or employment instability is/was a major worry
Always
8
4.4%
Often
17
9.4%
Sometimes
40
22.1%
Seldom
58
32.0%
Never
58
32.0%
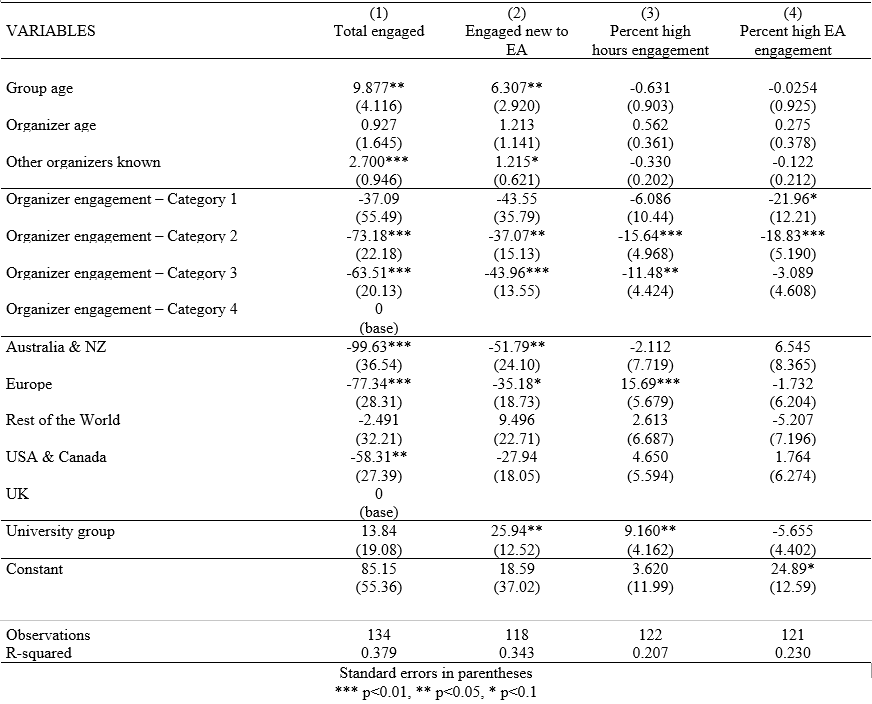
Regression Models
We selected four outcome variables for multiple linear regression analysis. These metrics are:
Total engaged - Please estimate how many people in total have engaged in some way with your group over the last year (12 months)
Engaged new to EA - In the last year, roughly how many people have attended one of your events who weren't familiar (or were barely familiar) with effective altruism beforehand?
Percent high hours engagement- Of members that engaged with the group for at least one hour in the last year, what percent have spent more than 30 hours engaging with your group?
Percent high EA engagement - Of members that engaged with your group for at least 10 hours in the last year, what percent were at level 3-4 engagement?
Models 1 and 2 reveal similar results, suggesting an older group age and more organizers known result in greater total engaged and engaged new to EA. This effect is slightly stronger for total engaged. Groups whose organisers report being most involved in EA (category 4) are likely to have more total engaged and more engaged new to EA than groups with less involved organizers (categories 2&3). We see that groups from the UK are more likely to have a higher total engaged than those in Australia & NZ, Europe, and the USA & Canada. A group from the UK is also likely to have engaged more people that are new to EA than a group in Australia & NZ or Europe. University groups are more likely to have more members who are new to EA than other group types.
Models 3 and 4 find fewer significant results. If an organizer reports being in the highest level of community engagement, the group is statistically likely to have 22% more members who are highly engaged in EA, relative to groups whose organizer is in the lowest engagement category and 19% more than the second lowest. Groups run by the most involved organizers are likely to have a higher percent of group members engage with the group for more than 30 hours in the last year. European groups are more likely to have a higher percent of members who are more involved with the group, relative to groups from the UK. University groups are more likely to have a higher percent of members that engaged with the group for more than 30 hours in the last year than non-university groups.
Credits
This research is a project of Rethink Priorities, based on the EA Groups Survey run in collaboration with the Centre for Effective Altruism. This post was written by Jacob Schmiess and David Moss. Thanks to Peter Hurford and Joan Gass for comments.
They have spent 10 hours engaging with effective altruism content. For example, someone that has done all of the following:
- Read Doing Good Better
- Listened to a few of 80,000 Hours podcasts
Category 2
They have spent 50 hours or more engaging with effective altruism content. For example, someone that has done all of the following:
- Read 50 effective altruism related posts or articles, such as EA Forum posts, 80,000 Hours website content, etc.
- Listened to 10 of 80,000 Hours podcasts
- Participated in an introductory effective altruism fellowship
And
Effective altruism ideas and principles played a major role in them doing at least one of the following:
- Choosing where to donate
- Developing their career plans
- Volunteering for 2 or more hours a week on effective altruism-related projects
Category 3
They have spent 100 hours or more engaging with effective altruism content. For example, someone that has done all of the following:
- Listened to the majority of 80,000 Hours podcasts
- Attended a weekly effective altruism discussion group for 6 months
- Read hundreds of effective altruism related posts or articles, such as EA Forum posts, 80,000 Hours website content, etc.
- Attended EA Global
And
Effective altruism ideas and principles played a major role in them doing at least one of the following:
- Taking the GWWC pledge
- Applying for specific internships or jobs
- Choosing their degree program
- Volunteering for 6 or more hours a week on effective altruism-related projects
Category 4
They meet the criteria for group 3 and
Either
Effective altruism ideas and principles played a major role in them choosing their current job
Or
They have made significant contributions to the effective altruism community’s understanding on an effective altruism-related topic, for example by giving a talk at EA Global, or writing an influential EA Forum post.
This is a crosspost from the new Animal Welfare Alignment Newsletter by Anima International. You can subscribe on Substack if you are interested in following these efforts. Audio reading also available on Substack.
The goals of this post are to:
1. Raise a question I see as crucially important to the goal of aligning AI to animal welfare...
“How long have you been v*g*n?”
This is one of the most common icebreakers at animal protection events. It’s a baseline assumption, and it mostly holds true: if you’re out advocating for animals not to be tortured or abused, realistically these days you are v**n, or close. And it makes for good conversation. It seems fairly safe to assume when you meet strangers.
But this assumption is hurting the movement in a way which we don’t always notice: someone new comes into the sp...
Summary
Back in November 2023 I posted here to launch Spiro and raise our first $198k. Two and a half years later this is an update and a fundraiser for the next step.
The short version: we've now reached over-5,900 people with TB preventive medicine, including over 3,000 children under five years old. Our early results have held up well an...


Thanks for this report! Two minor questions:
2. Is the graph above possible to make via Google Sheets or some easy-to-use platform? Thanks!
Hey Brian, we created all of these Likert scale plots (also called diverging stacked bar charts) in R. There is a very convoluted way to make them in Excel, but I think Google Sheets doesn't have the manual editing tools required. I put links to a few guides below. Hope this helps!
R - https://cran.r-project.org/web/packages/likert/likert.pdf Excel - https://mbounthavong.com/blog/tag/Diverging+stacked+bar+chart
Got it, thanks! Were all of the charts and tables here made using R?