Fantastic writeup, I haven't read all of it yet, but I really want to shout out whoever made the charts. All of these charts are super well done, I really respect the effort that went into them, and it totally paid off. Especially the first chart, that could have very easily been a very ugly pie chart, is instead a beautiful linear proportion chart. Hats off!
Thank you Chris! One would think that years of disappointing cake and pizza apportionment would have taught people that we don't read things very precisely when they're circles, but the pie chart remains...
I find the proportion of people who have heard of EA even after adjusting for controls to be extremely high. I imagine some combination of response bias and just looking up the term is causing overestimation of EA knowledge.
Moreover, given that I expect EA knowledge to be extremely low in the general population, I’m not sure what the point of doing these surveys is. It seems to me you’re always fighting against various forms of survey bias that are going to dwarf any real data. Doing surveys of specific populations seems a more productive way of measuring knowledge.
I’ll update my priors a bit but I remain skeptical
I find the proportion of people who have heard of EA even after adjusting for controls to be extremely high. I imagine some combination of response bias and just looking up the term is causing overestimation of EA knowledge.
Just so I can better understand where and the extent to which we might disagree, what kind of numbers do you think are more realistic? We make the case ourselves in the write-up that, due to over-claiming, we would we generally expect these estimates to err on the side of over-estimating those who have heard of and have a rough familiarity with EA, that one might put more weight on the more 'stringent' coding, and that one might want to revise even these numbers down due to the evidence we mention that even that category of responses seems to be associated with over-claiming, which could take the numbers down to around 2%. I think there are definitely reasonable grounds to believe the true number is lower (or higher) than 2% (and note the initial estimate itself ranged from around 2-3% if we look at the 95% HDI), but around 2% doesn't strike me as "extremely high."
For context, I think it's worth noting, as we discuss in the conclusion, that these numbers are lower than any of the previous estimates, and I think our method of classifying EAs were generally more conservative. So I think some EAs have been operating with more optimistic numbers and would endorse more permissive classification of whether people seem likely to have heard of EA (these numbers might suggest a downward update in that context).
given that I expect EA knowledge to be extremely low in the general population, I’m not sure what the point of doing these surveys is. It seems to me you’re always fighting against various forms of survey bias that are going to dwarf any real data. Doing surveys of specific populations seems a more productive way of measuring knowledge.
I think there are a variety of different reasons, some of which we discuss in the post.
Firstly, these surveys could confirm whether awareness of EA is generally low, which as I note above isn't completely uncontroversial, and as we discuss in the post, seems to be generally suggested by these numbers whatever the picture in terms of overclaiming (i.e. the estimates at least suggest that the proportion who have heard of EA according to the stringent standard is <3%).
I think just doing surveys on "specific populations" (I assume implicitly you have in mind populations where we expect the percentage to be higher) has some limitations, although it's certainly still valuable. Notably our data drawn from the general population (but providing estimates for specific populations) seems broadly in accord with the data from specific populations (notwithstanding the fact that our estimates seem somewhat lower and more conservative). So we should do both, with both sources of data providing checks on the other.
I think this is particularly valuable given that it is very difficult to get representative samples from "specific populations." I think it's sometimes possible to approximate this and one could apply weighting for basic demographics in a college setting, for example, but this is generally more difficult / what you can do is more limited. And for other "specific populations" (where we don't have population data) this would be impossible.
I also think this applies in cases like estimating how many US students have heard of EA, where taking a large representatively weighted sample, as we did here, and getting estimates for different kinds of students, seems likely to give better estimates than just specifically sampling US students without representative weighting, as in the earlier CEA-RP brand survey we linked.
I think that getting estimates in the general population (where our priors might be that the percentages are very low), also provides valuable calibration for populations where our priors may allow that the percentages are much higher (but are likely much more uncertain). If we just look at estimates in these specific populations, where we think percentages could be much higher, it is very hard to calibrate those estimates against anything to see if they are realistic. If we think the true percentage in some specific population could be as high as 30% or could be much lower, it is hard to test whether our measures which suggest the true figure is ~20% are well-calibrated or not. However, if we've employed these or similar measures in the general population, then we can get a better sense of how the measures are performing and whether they are under-estimating or over-estimating (i.e. whether our classification is too stringent or too permissive).
I think we get this kind of calibration/confirmation when we compare our estimates to those in Caviola et al's recent survey, as we discuss in the conclusion. Since we employed quite similar measures, and found broadly similar estimates for that specific population, if you have strong views that the measures are generally over-estimating in one case, then you could update your views about the results using similar measures accordingly (and, likewise, you can generally get independent confirmation by comparing the two results and seeing they are broadly similar). Of course, that would just be informal calibration/confirmation; more work could be done to assess measurement invariance and the like.
I would also add that even if you are very sceptical about the absolute level of awareness of terms directly implied by the estimates due to general over-claiming, you may still be able to draw inferences about the awareness of effective altruism relative to other terms (and if you have a sense of the absolute prevalence of those terms, this may also inform you about the overall level of awareness of EA). For example, comparing the numbers (unscreened) claiming to have heard of different terms, we can see that effective altruism is substantially less commonly cited than 'evidence-based medicine', 'cell-based meat', 'molecular gastronomy', but more commonly cited than various other terms, which may give a sense of upper and lower bounds of the level of awareness, relative to these other terms. One could also compare estimates for some of these terms to their prevalence estimated in other studies (though these tend not to be representative) e.g. Brysbaert et al (2019), to get another reference point.
Likewise, data from the broader population seems to be necessary to assess many differences across groups (and so, more generally, what influences exposure to and interest in EA). As noted, previous surveys on specific populations found suggestive interesting associations between various variables and whether people had heard of or were interested in EA. But since these were focused on specific populations, we would expect these associations to be attenuated (or otherwise influenced) by range restriction or other limitations. If you only look at specific population that are highly educated, high SAT, high SES, low age etc., then it's going to be very difficult to assess the influence of any of these variables. So, insofar as we are interested in these results, then it seems necessary to conduct studies on broader populations, otherwise we can't get informative estimates of the influence of these different factors (which are probably, implicitly, driving choices about which specific populations, we would otherwise choose to focus on).
I think something like 0.1% of the population is a more accurate figure for how you coded the most strict category. 0.3% for the amount I would consider to have actually heard of the movement. These are the figures I would have given before seeing the study, anyway.
It's hard for me to point to specific numbers that have shaped my thinking, but I'll lay out a bit of my thought process. Of the people I know in person through non-EA means, I'm pretty sure not more than a low-single-digit percent know about EA, and this is a demographic that is way more likely to have heard of EA than the general public. Additionally, as someone who looks at a lot at political polls, I am constantly shocked at how little the public knows about pretty much everything. Given that e.g. EA forum participation numbers are measured in the thousands, I highly doubt 6 million Americans have heard of EA.
We didn't dwell on the minimum plausible number (as noted above, the main thrust of the post is that estimates should be lower than previous estimates, and I think a variety of values below around 2% are plausible).
That said, 0.1% strikes me as too low, since it implies a very low ratio between the number of people who've heard of EA and the number of moderately engaged EAs. i.e. this seems to suggest that for every ~50 people who've heard of EA (and basically understand the definition) there's 1 person who's moderately engaged with EA (in the US). That would be slightly higher with your estimate of 0.3% who've heard of the movement at all. My guess would be that the ratio is much higher, i.e. many more people who hear of EA (even among those who could give a basic definition) don't engage with EA at all, and even fewer of those really engage with EA.
We'll probably be going into more detail about this in a followup post.
Really cool survey, and great write up of the results! I especially liked the multilevel regression and post-stratification method of estimating distributions.
Peter Singer seems to be higher profile than the other EAs on your list. How much of this do you think is from popular media, like The Good Place, versus from just being around for longer?
Peter Singer is also well known because of his controversial disability/abortion views. I wonder if people who indicated they only heard about Peter Singer (as opposed to only hearing about MackAskill, Ord, Alexander, etc.) scored lower on ratings of understanding EA? I've had conversations with people who refused to engage with the EA community because we were "led by a eugenicist", but that's clearly not what EA believes in.
Also kinda sad EA is being absolutely crushed by taffeta.
Peter Singer seems to be higher profile than the other EAs on your list. How much of this do you think is from popular media, like The Good Place, versus from just being around for longer?
Interesting question. It does seem clear that Peter Singer is known more broadly (including among those who haven’t heard of EA, and for some reasons unrelated to EA). It also seems clear that he was a widely known public figure well before ‘The Good Place’ (it looks like he was described as “almost certainly the best-known and most widely read of all contemporary philosophers” back in 2002, as one example).
So, if the question is whether he’s more well known due to popular media (narrowly construed) like The Good Place, it seems likely the answer is ‘no.’ If the question is whether he’s more well known due to his broader, public intellectual work, in contrast to his narrowly academic work, then that seems harder to assign credit for, since much of his academic work has been extremely popular and arguably a prerequisite of the broader public intellectual work.
If the question is more whether he’s more well known than some of the other figures listed primarily because of being around longer, that seems tough to answer, since it implies speculation about how prominent some of those other figures might become with time.
I wonder if people who indicated they only heard about Peter Singer (as opposed to only hearing about MackAskill, Ord, Alexander, etc.) scored lower on ratings of understanding EA?
This is another interesting question. However, a complication here seems to be that, I think we’d generally expect people who have heard of more niche figures associated with X to be more informed about X, than people who have only heard of a very popular figure associated with X for indirect reasons (unrelated to the quality of information transmitted from those figures).
Also kinda sad EA is being absolutely crushed by taffeta.
Agreed. I had many similar experiences while designing this survey, where I conducted various searches to try to identify terms that were less well known than ‘effective altruism’ and kept finding that they were much more well known. (I remember one dispiriting example was finding that the 'Cutty Sark' seemed to be much more widely known than effective altruism).
I'd heard of Peter Singer in an animal rights context years before I knew anything around his EA association or human philosophy in general. I wonder if a lot of people who have heard of him are in the same place I was.
Similarly, I’d heard of Peter Singer as a result of campus controversies over his (alleged) views on disability long before I heard anything else about him. But it was actually learning about that controversy that prompted me to go see him speak some time in 2001 or so and I was surprised by what I heard.
We also found sizable differences between the percentage of Republicans (4.3% permissive, 1.5% stringent) estimated to have heard of EA, compared to Democrats (7.2% permissive, 2.9% stringent) and Independents (4.3% permissive, 1.5% stringent). [emphasis added]
It looks like the numbers for Republicans were copy-pasted for Independents? Since the text implies that the numbers should be very different but they're identical, and since if those are the correct numbers it seems weird that the US adult population estimates would be much closer to the Democrat estimates than to the Republican and Independent estimates.[1]
[I work at Rethink Priorities, but on a different team, and I read this post and left this comment just for my own interest.]
The total population estimate is "We estimate that 6.7%[2] of the US adult population have heard of effective altruism using our permissive standard and 2.6% according to our more stringent standard."
So the current text suggests the percentages in the total population were slightly lower than in Democrats but much higher than in Republicans and Independents. This could make sense if there are notably more US Democrats than US Republicans and US Independents put together, but I doubt that that's the case in the US population?
It seems very plausible that the sample included far more Democrats than Republicans+Independents. But I assume your weighting procedure to get US adult population estimates should adjust things so that overrepresentation of Democrats in the sample doesn't distort estimates for the population?
(I wrote this chunk of text before I realised the issue was probably just a typo, and then rearranged it.)
Nitpicking: there's a copying error in the summary, in the party affiliation section regarding independents:
We also found sizable differences between the percentage of Republicans (4.3% permissive, 1.5% stringent) estimated to have heard of EA, compared to Democrats (7.2% permissive, 2.9% stringent) and Independents (4.3% permissive, 1.5% stringent).
This post is co-authored with Ben Garfinkel. It is cross-posted from the CEA blog. A PDF version can be found here.
Summary: Some strategic decisions available to the effective altruism m...
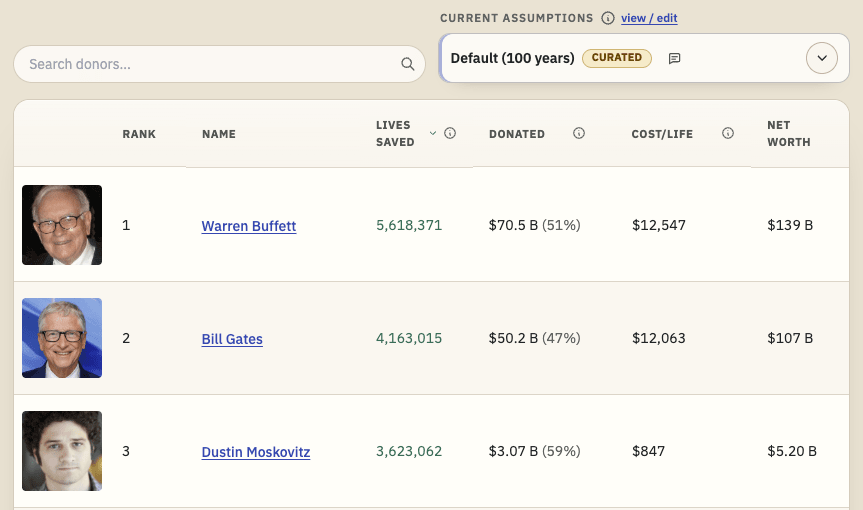
TL;DR: I'm releasing a website that ranks philanthropists according to EA principles and research, and allows users to re-rank the list using their own assumptions. I'd like feedback and help making it better. I'd especially like ideas for how to make the results more trustworthy. Funding may be available.
Crossposted to LessWrong.
...
Disclaimer: Although I work on the Groups Team at CEA, I’m writing this in a personal capacity, and this post does not constitute an endorsement by CEA.
Agency - the realisation that you really can just do things.
TL;DR
Biosecurity needs people (of any background) who are agentic and have a high execution velocity and track record....
This post reports the results of a survey we ran in April 2022 investigating how many people had heard of ‘effective altruism’ in a large (n=6130[1]) sample, weighted to be representative of the US general population.
In subsequent posts in this series, we will be reporting on findings from this survey about wherepeople first hear about effective altruism and how positive or negative people’s impressions are of effective altruism.
This survey replicates and extends a survey we ran in conjunction with CEA in early 2021, which focused only on US students. Because that survey was not representative, we think that these new results offer a significant advance in estimating how many people in the US population have heard of EA, and in particular sub-groups like students and even students at top-ranked universities.
Summary
After applying a number of checks (described below), we classified individuals as having heard of effective altruism using both a ‘permissive’ standard and a more conservative ‘stringent’ standard, based on their explanations of what they understand ‘effective altruism’ to mean. (Though, as we argue below, even the most stringent standard may be inflated by false positives).
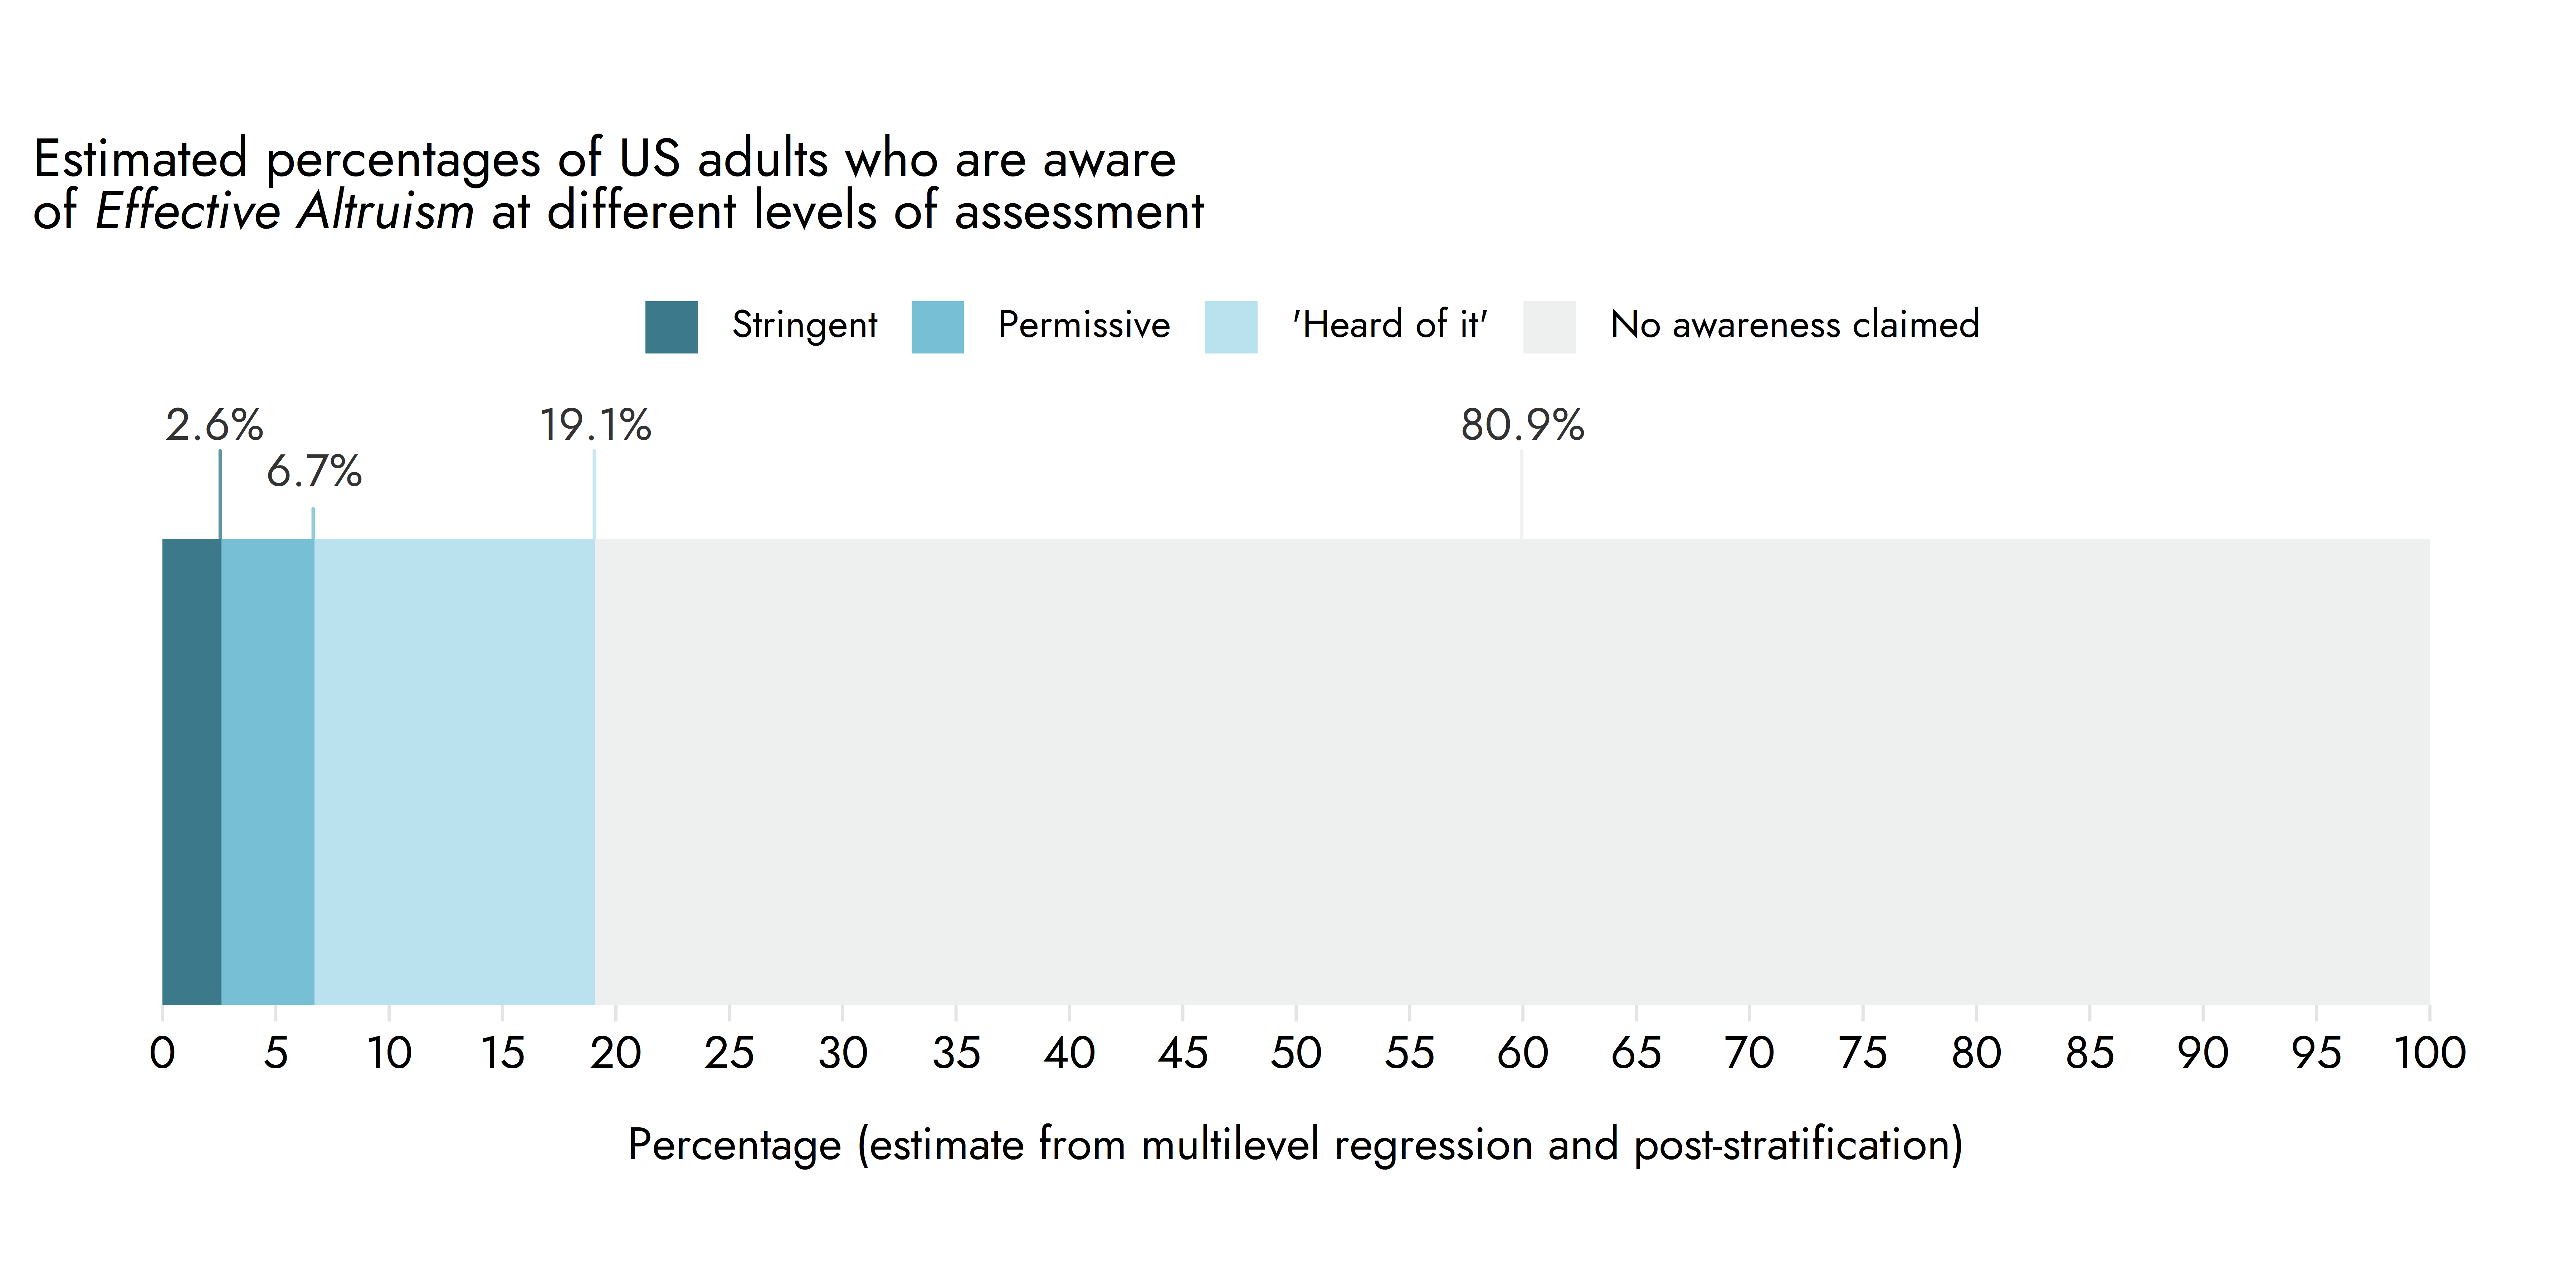
We estimate that 6.7%[2] of the US adult population have heard of effective altruism using our permissive standard and 2.6% according to our more stringent standard.
We also identified a number of differences across groups:
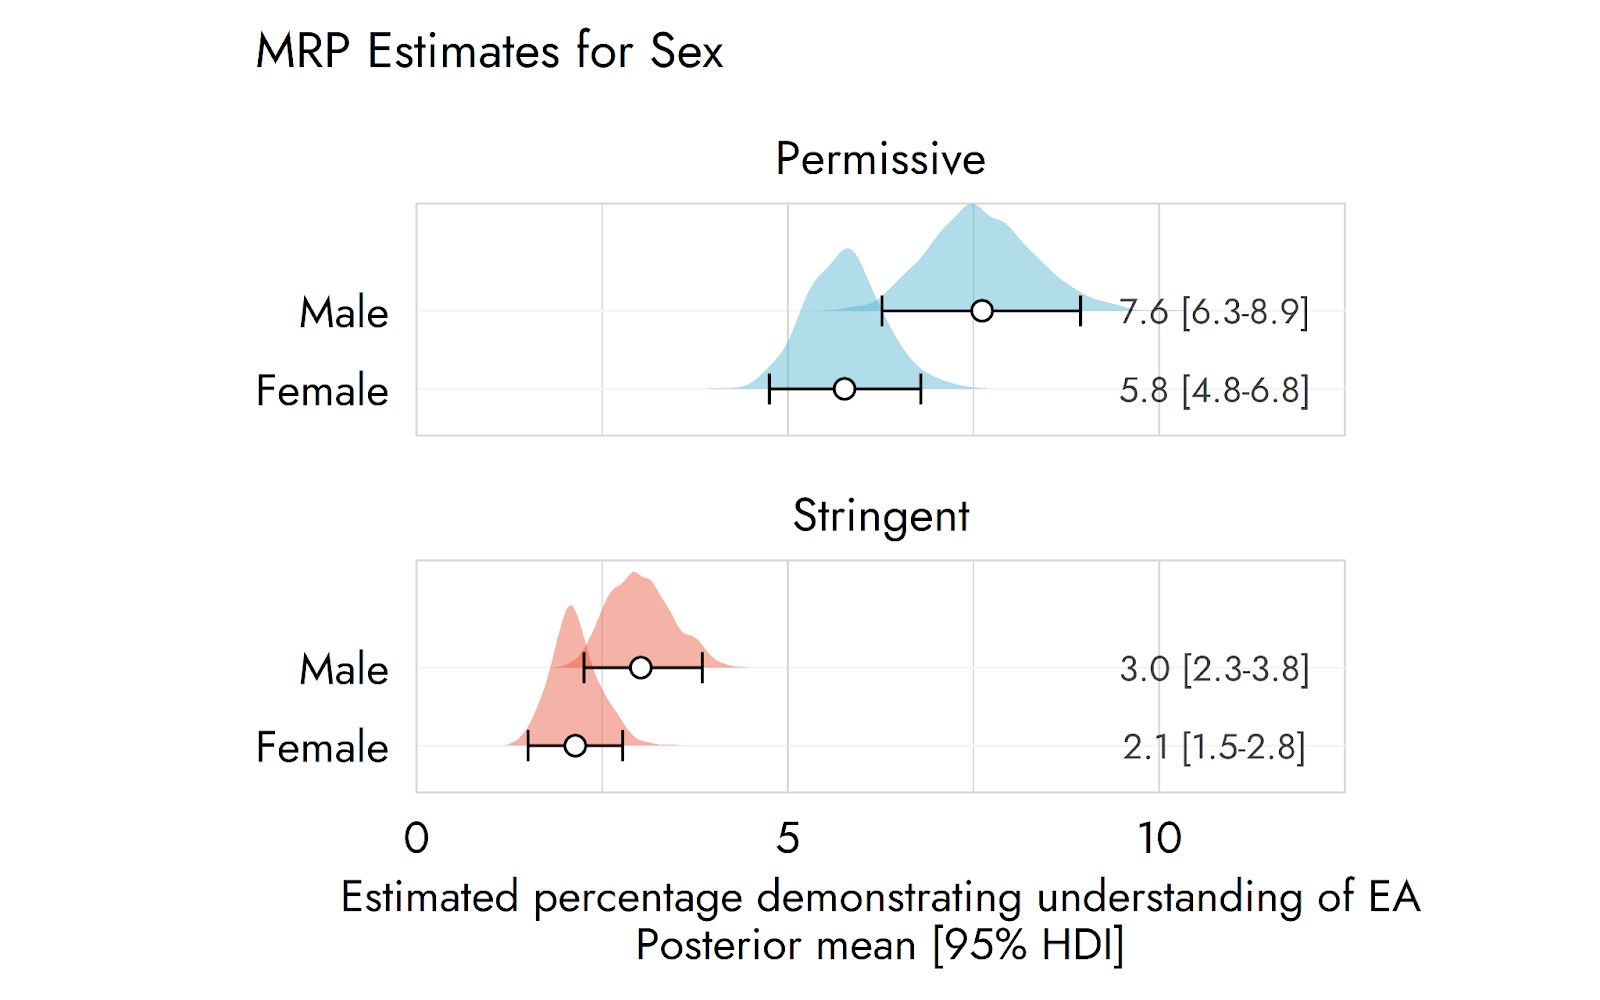
Men (7.6% permissive, 3.0% stringent) were more likely to have heard of effective altruism than women (5.8% permissive, 2.1% stringent)
Among students specifically, we estimated 7% had heard of EA (according to a permissive standard) and 2.8% (according to the stringent standard).
However, students from top-50 ranked universities seemed more likely to have heard of EA (7.9% permissive, 4.1% stringent). We also found that students at top 15 universities were even more likely to have heard of EA, though this was based on a small sample size.
Younger (18-24) people seem somewhat less likely to have heard of effective altruism than older (25-44) people, though the pattern is complicated. The results nevertheless suggest that EA’s skew towards younger people cannot simply be explained by higher rates of exposure.
Higher levels of education were also strongly associated with being more likely to have heard of EA, with 11.7% of those with a graduate degree having heard of it (permissive standard) compared to 9.2% of college graduates and 3.7% of high school graduates.
We also found sizable differences between the percentage of Republicans (4.3% permissive, 1.5% stringent) estimated to have heard of EA, compared to Democrats (7.2% permissive, 2.9% stringent) and Independents (7.7% permissive, 2.9% stringent).
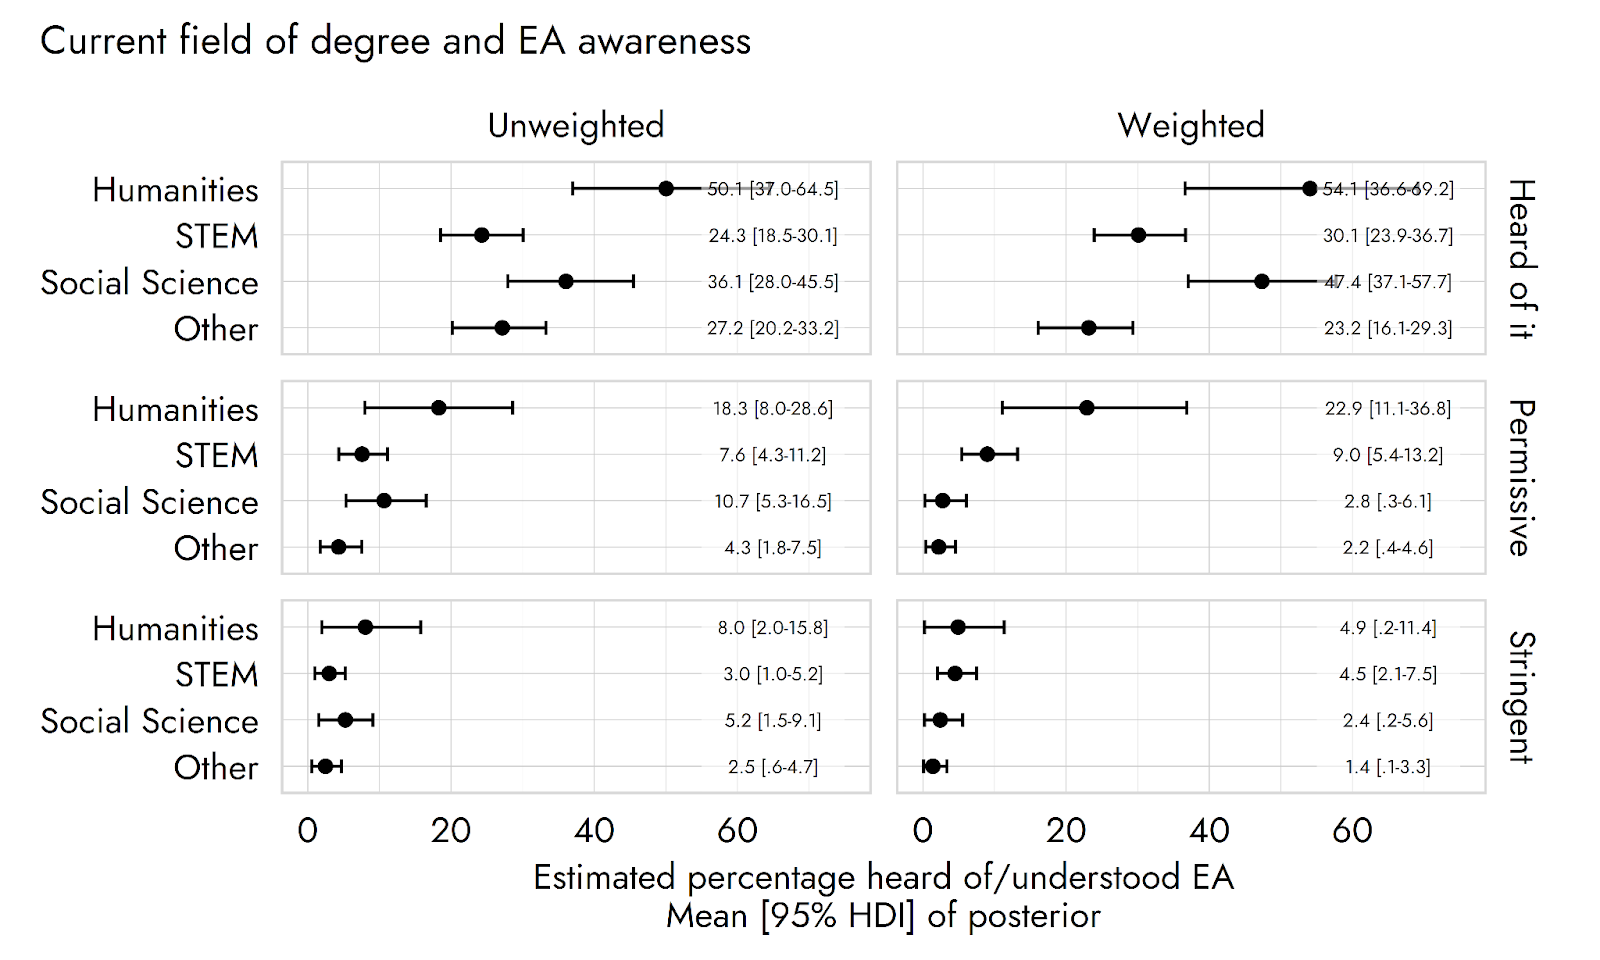
Humanities students (or graduates) seem more likely to have heard of EA than people from other areas of study.
We estimated the percentages that had heard of various EA and EA-adjacent figures and organisations including:
Peter Singer: 11.2%
William MacAskill: 2.1%
GiveWell: 7.8%
Giving What We Can: 4.1%
Open Philanthropy: 3.6%
80,000 Hours: 1.3%
(Edit: note we did not include additional checks for real familiarity with the organisations and individuals listed, like we did for 'effective altruism'. We would expect these numbers, like those for EA, to be commensurately lower after applying permissive or stringent checks.)
Note: ‘Heard of it’ includes all respondents who claimed to have heard of ‘effective altruism’ but most of those could not meet either our permissive or more stringent standards for having probably heard of effective altruism.
Why it matters how many people have heard of EA
Knowing how many people have already encountered EA is potentially relevant to assessing how far we should scale up (or scale down) outreach efforts.
This may apply to particular target groups (e.g. students at top universities), as well as the total population.
Knowing how the number of people who have encountered effective altruism differs across different groups could highlight who our outreach is missing.
A priori, it would not be surprising if both active EA outreach and more organic methods like referrals through personal contacts were systematically missing certain groups (e.g. because people’s personal networks are skewed towards people similar to themselves).
Knowing who is being exposed to effective altruism is necessary to identify who our outreach is reaching but failing to recruit.
Without knowing how many people we’re reaching from different groups, it is hard to know whether we are appealing to these groups or consistently turning them off. For example, suppose around 40% of people newly joining EA are students (which is, in fact, suggested by unpublished EA Survey data). If 30% of people we reach are students, this implies that we are appealing to students much more than non-students. Conversely, if 70% of the people we reach are students, this implies that many fewer students become involved in effective altruism than we would expect given exposure. These outcomes would presumably suggest very different responses.
Such differences could be because our outreach isoff-putting (or perhaps a poor fit for particular audiences), or because of differences in the level of interest of different groups (e.g. younger people being more interested in potential career changes).
We think research of this kind, looking at the very start of the ‘funnel’ across the broad population may be particularly important, and neglected. Research that only examines those who have become, and remained, highly engaged EAs misses what has happened earlier in the funnel and is apt to be distorted by survivorship bias. Research only on select highly promising populations can likewise be limited by range restriction. For example, if we focus on young or highly educated people (because we believe these are more promising), we will not be able to discern the true influence of age on our outcomes of interest.
Methodology
We recruited 6130 US respondents from Prolific.co, a platform for recruiting respondents to complete surveys and other research tasks.[3] We discuss the weighting procedures we applied below.
The questions we asked are based on those we designed for our research with the Centre for Effective Altruism. The core questions and raw (unweighted) responses to them can be found in Appendix 1.
How we identified people as having heard of effective altruism
Discerning whether people have really heard of effective altruism is hard. The majority of individuals who have heard of effective altruism will only have heard of it briefly and so would not be expected to display extensive (or necessarily accurate) knowledge of it. Moreover, it can be hard for an individual to remember whether they have heard of it.
On the other hand, there is also a tendency for respondents to over-claim familiarity. We believe that this is mostly motivated simply by people not wanting to appear ignorant or uninformed. We also do not think this mostly takes the form of outright lying about things that people know they haven’t heard of, but rather people erring on the side of saying that they have heard of things if it sounds familiar and they are not sure.
As such, we employed a large number of different checks and questions to assess whether people seemed to have heard of effective altruism:
(1) We first asked respondents to select all the terms that they had heard of out of a long list of possible options.
We included a large number of other items (19) which were unrelated to effective altruism and which would be likely to be more or less well known by different groups for two reasons.
Firstly, to avoid prompting individuals either with what effective altruism meant or that the survey was about effective altruism or a related topic. This is particularly important because we wanted to assess whether individuals seemed familiar with effective altruism. If we prompted the idea that effective altruism was related to charity or social movements or even asked people whether they had heard of effective altruism, the ‘philosophy or social movement’, this would make it much easier for respondents to accurately guess or confabulate its meaning in the later screening questions. (This was a major concern since, in this and our previous study with CEA, we found that respondents were quite good at guessing what effective altruism meant).
Secondly, so that we could (in theory) distinguish whether different groups were more or less likely to have heard of effective altruism in particular, or just more likely to have heard of any term (or, for example, any science-related term).
We also included a number of ‘low incidence’ items which individuals would be very unlikely to have actually encountered (e.g. gastronomic realism), which serve as an additional check on our results, but did not include any outright ‘fake’ terms for this question. This was motivated by the concern that fake or ‘trick’ items can increase distrust in respondents and alter the way they would naturally respond. For example, we would not want to prompt respondents to start googling items on this list to check whether they were real (although as noted below we do include some ‘fake’ options in a later question towards the end of the survey).
(2) We then asked those respondents who selected ‘effective altruism’ in this list to indicate their level of understanding of effective altruism, out of the following options:
(1) I have not heard of it
(2) I have heard of it, but I don’t really know what it means
(3) I have heard of it, and have a basic understanding of what it means
(4) I have heard of it, and have a thorough understanding of what it means
(3) All respondents who had selected ‘effective altruism’ were then also asked to briefly explain what they understood by the term “effective altruism.”
We hand-coded the explanations of those respondents who had indicated having heard of EA.[4]
To be classified as meeting our ‘stringent’ standard, respondents had to provide an explanation of EA that was accurate and specific enough to very clearly indicate familiarity with effective altruism (i.e. one would be very unlikely to be able to give this explanation if one had not actually encountered effective altruism), e.g. referring to the use of evidence and reason to work out how to maximise the amount of good done in one’s charitable donations or career. (Direct references to specifics like utilitarianism or Peter Singer also counted in favour of being classified in this category.)
Note that we were ultimately interested in assessing whether people had really heard of effective altruism, not the depth of their understanding, so we did not downgrade responses for including things that may be misconceptions, but which nevertheless suggested familiarity (e.g. that effective altruism is specifically about using quantifiable evidence and RCTs to identify the most effective charities etc.).
We classified responses as meeting a looser ‘permissive’ standard if it seemed probable that they indicated familiarity with effective altruism, but it was unclear due to the explanations being broadly accurate but more vague.
We were deliberately conservative in classifying responses as meeting the ‘stringent’ category, so the ‘permissive’ category includes responses ranging from highly accurate responses, which were nevertheless not quite specific enough for us to be confident that they clearly indicated familiarity (e.g. general references to working out what helps in the most effective way possible or doing as much good as possible), and weaker references to finding effective charity, which we still thought were probable indicators of familiarity.
These two categories served as our main two outcome measures, although we also employed additional checks on respondents described below.
One factor that is important to bear in mind with these measures is that it seems (perhaps surprisingly) easy for respondents to give a pretty accurate definition of “effective altruism” even if they have no real familiarity with it. Many respondents were able to give a definition along the lines of ‘finding the most effective ways to help others and doing so’ simply based on knowing what the individual words “effective” and “altruism” mean. Many would explicitly say they didn’t really know what it meant and/or they hadn’t heard of it, but would describe working it out from the definitions of the words in their comments.
This counts against simply using accuracy of explanations as a standard, and may lead one to put more weight on the stringent standard (subject to caveats below). This also suggests the value of including additional independent checks (described below).
(4) All respondents who had selected ‘effective altruism’ were then also asked to briefly explain where they encountered effective altruism.
We will describe these results in a later post. These responses were sometimes used as a tie-breaker for classifications of the above responses, since these descriptions sometimes quite clearly indicated that a person had encountered effective altruism (e.g. they heard about it via a TED Talk from Peter Singer) or that they had not (e.g. they clarified they hadn’t heard of it and were just guessing).
(5) We also asked all respondents two questions, asking them to indicate which people from a list they had heard of:
As with the terms in our first question, these lists also contained a mix of EA or EA-adjacent figures, and unrelated figures who varied on different dimensions.
These results are of direct interest, but also serve as another check on the validity of responses as we discuss below.
(6) We also asked all respondents to indicate which out of a list of organisations or institutions they had heard of, including several EA and EA-adjacent organisations, amongst others:
These results are of direct interest, but also serve as another check on the validity of responses as we discuss below.
(7) We also asked respondents to indicate which people out of a list of made up names[5] they had heard of:
This was at the end of the survey after all the other questions of interest had been answered, so we were less concerned about prompting different patterns of response at this point. Overall, we think that there are hard to weigh pros and cons to including this sort of question.
Ultimately, we decided on excluding respondents who selected any of these names from the analyses below, though we did not observe dramatically different results based on this.
95% of respondents (unweighted) selected none of the above for this question, placing the proportion selecting a ‘false’ name within the range of ‘Lizardman’s Constant’. (As with the other questions, it is certainly plausible that some of these respondents legitimately confused listed names for similar sounding real names.)
(8) We are also running a followup survey on those respondents who indicated having heard of EA to further explore their attitudes towards effective altruism.
The results of this will be reported in a later post.
How accurate do we think our classification of whether people have heard of EA is?
The ‘permissive’ and ‘stringent’ classifications are both based on whether people were able to give explanations of EA that were accurate and specific enough to indicate that they had heard of effective altruism. But, as we noted above, many individuals who have legitimately heard of effective altruism may not remember what it means or may not be able to give an accurate or specific definition (even people who definitely do know what it means might give a vague definition like ‘helping effectively’). So, taken at face value, we would expect these measures to understate the number of people who have actually encountered effective altruism, given that many people will legitimately have encountered it, and then either forgotten what it means or never really understood what it means. (That said, for most purposes, we may be most interested in people who have encountered EA and who didn’t quickly forget or never understand what it meant, so this may not be too concerning).
At the same time, we would expect individuals to err on the side of claiming that they have heard of terms (when they haven’t), and would expect some individuals to give good enough explanations - at least for the ‘permissive’ standard - based on reasoning out what the term means, or based on surreptitiously looking up what ‘effective altruism’ means (which is more of a concern for the ‘stringent’ classification). As such, on balance, we expect these estimates to err on the side of over-estimating the number of people who have encountered EA and who are roughly familiar with what it is.
Notably, with our additional checks, we found some evidence of over-claiming of this kind. Even after excluding respondents who selected one of the fake names above, we still found that respondents in either the permissive or stringent categories were significantly more likely to have said that they had heard of ‘gastronomic realism’ (a very low incidence item). Even though only around 2.8% of respondents (unweighted) in the sample overall, had claimed to have heard of gastronomic realism, around 8.2% and 10.4% in the permissive and stringent groups claimed to have done so, which seems unrealistic even accounting for the fact that people familiar with EA are more likely to be familiar with obscure metaethical terms.
The fact that this held true even for the extremely conservative ‘stringent’ coding of responses, suggests that the problem here may be that some respondents literally searched for a definition of “effective altruism” before writing their explanation. It’s unclear how far this behaviour represents outright deception on the part of the respondents, rather than individuals simply erring in favour of saying they’ve heard of terms they think they’ve heard of and then googling to ‘check’ what it means when asked. But in either case, it suggests that even the strictly coded qualitative responses are picking up a disproportionate number of over-claiming respondents and so over-estimate the number of respondents displaying clear familiarity with effective altruism.
If we were to count all the respondents who selected ‘gastronomic realism’ as not really being familiar with EA, then the numbers counted as ‘stringently’ or ‘permissively’ familiar with EA in the raw data would fall by around 0.6% points and 0.25% points (both roughly a 10% drop). This is something important to bear in mind when using this kind of qualitative coding to assess familiarity with EA. We will probably add additional checks for respondents in future iterations of this survey.
Interestingly, we did not observe such suspicious patterns of responding for answers regarding which people and organisations individuals had heard of. Here we found that very few respondents claimed familiarity with the less well known EA figures. Moreover, though those who claimed to have heard of EA were more likely to have heard of many figures, ‘permissive’ and ‘stringent’ respondents were less likely to have heard of a popular evangelical Christian figure (T.D. Jakes). Likewise, very few respondents claimed knowledge of most EA-related organisations listed.[6]
Importantly, this uncertainty does not actually change the main conclusions about how many people have heard of EA substantially. This is because the vast majority of respondents unambiguouslyhave not heard of effective altruism (a large majority do not even claim to have heard of it). So even if the numbers in our coded categories are, say, 25% lower, this only changes the estimates from 2.7% to 2.0%.[7]
Weighting
Our analyses used two different approaches aimed at producing estimates that are representative of the US population.
In order to produce estimates for population subgroups (e.g., sex, income, education, political identification) we used multilevel regression and post-stratification (MRP). MRP regression models estimated the influence on responses of respondent state and region (including the Republican vote share of their state in the 2020 Presidential election), education level, sex, household income, racial identification, age, and political party identification (Republican, Democrat, or Independent). A poststratification table was constructed using population estimates of all these subgroups from the 5-year American Community Survey (ACS) from the Census Bureau. Party identification was added to the post-stratification table through multilevel regression on 20000 respondents from the 2019 Cooperative Election Study (CES) database. This post-stratification table was then used to predict responses for the US population, based upon regression estimates from our present sample.
The second approach we used was traditional survey weights (using raking), in which respondents are weighted according to their proportions in the sample relative to their proportions in the US population, along various demographic features. For weighting, we included geographic region, age, education, sex, income, and racial identification (all from the 5 year ACS), and further included party identification from Gallup Polling (using a 6-month average), and liberal vs. moderate vs. conservative leanings from the 2021 General Social Survey (GSS). Weights were produced using the American National Election Survey raking algorithm in the R Package Anesrake.
Results
How many people have heard of EA?
How many people have heard of EA overall?
In the above graph we report the overall percentages of adults estimated to have heard of EA (across the whole US population aged 18 and above) using different standards for counting people as having heard of EA[8] and the two different methods of weighting. The two different methods for weighting generate extremely similar conclusions.[9]
Based on these numbers, we would estimateapproximately 2.6% of the US population meet our ‘stringent’ standard for having heard of EA, and 6.7% our permissive classification.
How many people have heard of EA in different groups?
Sex
We observe that a higher proportion of men[10] reported having heard of EA than women.[11] The differences are small in absolute terms (e.g. 3% vs 2% for the stringent classification) though, as noted above, such a ratio could dramatically distort the composition of the EA community, i.e. if recruitment matched this ratio, this alone could generate a skew of 60% men vs 40% women (though note the actual composition of the EA community in EA Survey data is more skewed at 70.5% male, 26.9% female).[12]
Race
We appear to observe some small differences across groups, though the estimates here are less confident than for sex, or most other analyses, due to the relatively smaller number of respondents outside the White or Caucasian group.
However, there is sufficient precision to indicate a possible difference in likelihood of hearing about EA between White or Caucasian and Black or African American adults, with White individuals estimated to be substantially more likely to have heard of EA than Black individuals.[13]
Age
Here we find the potentially surprising result that younger respondents (18-24 year olds) are somewhat less likely to have heard of effective altruism than those who are older (25-44), although in the ‘stringent’ category the very oldest (65+) remain the least likely to have heard of EA). This is despite the fact that the EA community is extremely strongly skewed towards younger people (very few are older than 35), and current effective altruists tend to report getting involved in effective altruism in their early-mid 20s (median 24[14]). Our impression is that many people believe that younger people are more likely to have encountered EA and that this explains a large part of the age composition of the movement, but this presents evidence against that view.
One might wonder whether the broad age categories reported here are obscuring a tendency for younger people to be more likely to have heard of EA, i.e. if 24 or 25 year olds are much more likely to have heard of EA than 40 year olds. Looking at the overall non-linear relationship across age and likelihood of hearing of EA in the raw data, this does not seem to be the case. The likelihood of having heard of EA peaks in one’s 40s and then declines.
Nevertheless, this pattern might be somewhat explicable if we suppose, in line with the EA Survey data, that most people hear about EA around the age of 24. Then people 24 or above would be much more likely to have heard of EA than those below, even though older individuals are less likely to hear of EA. Note though that, since effective altruism has only been prominent in the public arena for around 10 years, this would not afford people older than around 35 any substantial advantage in having heard of EA. Notably, this pattern of results also does not seem to support a view where people are more likely to hear about EA much earlier than 24 (e.g. 18-21), since then we would then expect the likelihood of having heard of EA to peak and drop off even earlier.
In addition, as will be seen below, completed higher levels of education, as well as higher incomes, are both quite strongly associated with increased probabilities of having heard of EA. Both of these characteristics are generally expected to increase with age: the younger members of the 18-24 group are unlikely to be high earners or to have completed university education.
Nevertheless, these results suggest that younger people being more likely to encounter EA seems unlikely to be able to explain the age distribution of EA in itself. The median age of people who have heard of EA (according to either the permissive or stringent standard) in our sample is 37, substantially older than the median US EA community member at 27.
We found strong associations between higher level of education and likelihood of having heard of EA. 9.2% of those who had graduated college were estimated to have heard of EA (according to the permissive standard), compared to only 3.7% of those who had only graduated high school, whereas 11.7% of those who had completed graduate school were estimated to have heard of EA.[15]
Income
We also found strong associations between income and having heard of EA, with those earning $100,000-$150,000 or more, in particular, much more likely to have heard of EA than other income categories.
Education x Income
Given that education and income are likely to be related, we also present the percentages having heard of EA across both different levels of education and income simultaneously. (Independent effects of both income and education are also apparent from the multilevel regression coefficients of the model).
We continue to find an association between both education and income, i.e. high-earning people who completed graduate school seem more likely to have heard of EA than lower earning people with the same education level, and more educated people seem more likely to have heard of effective altruism than less educated people with similar income.
Party identification
Here we find large differences between the proportion of Republicans who have heard of effective altruism, compared to Independents and Democrats, with Republicans being barely more than half as likely to have heard of effective altruism.
Student status
Top to bottom: claim to have heard of EA, permissive, stringent.
Educated at top 50 institutions
Top to bottom: claim to have heard of EA, permissive, stringent.
Current student at top 50 institutions
Top to bottom: claim to have heard of EA, permissive, stringent.
Area of Study
These results show the percentages of people who have heard of EA split by broad area of study. Perhaps contrary to expectations, people with a STEM background were not more likely to have heard of EA and, in fact, those in humanities were substantially more likely to have done so than those from other areas. This is plausibly partly explained by the fact that the Humanities contains philosophy (which is, unsurprisingly, heavily over-represented in EA). Indeed, we can see from the fine-grained subject areas below that the Liberal Arts category in particular, is associated with a higher percentage of people having heard of EA, though that each individual area of study has a relatively low number of respondents. Notably, we do not see higher proportions having heard of EA among other areas which are also heavily over-represented in EA e.g. computer science and math (though see discussion of current students below).
We believe this pattern of results may be partly explained by our findings about where individuals most commonly hear about EA (often in a college course), which we discuss in a later post.
We also examined results for respondents who were currentstudents only, rather than looking at the area of study of those who had completed an undergraduate degree. Naturally this has even fewer respondents and so the estimates are less confident, though the pattern of results is broadly similar. Notably, here, current students in engineering or computer science and maths are among the groups most likely to have heard of EA, though as noted, these estimates are less confident.
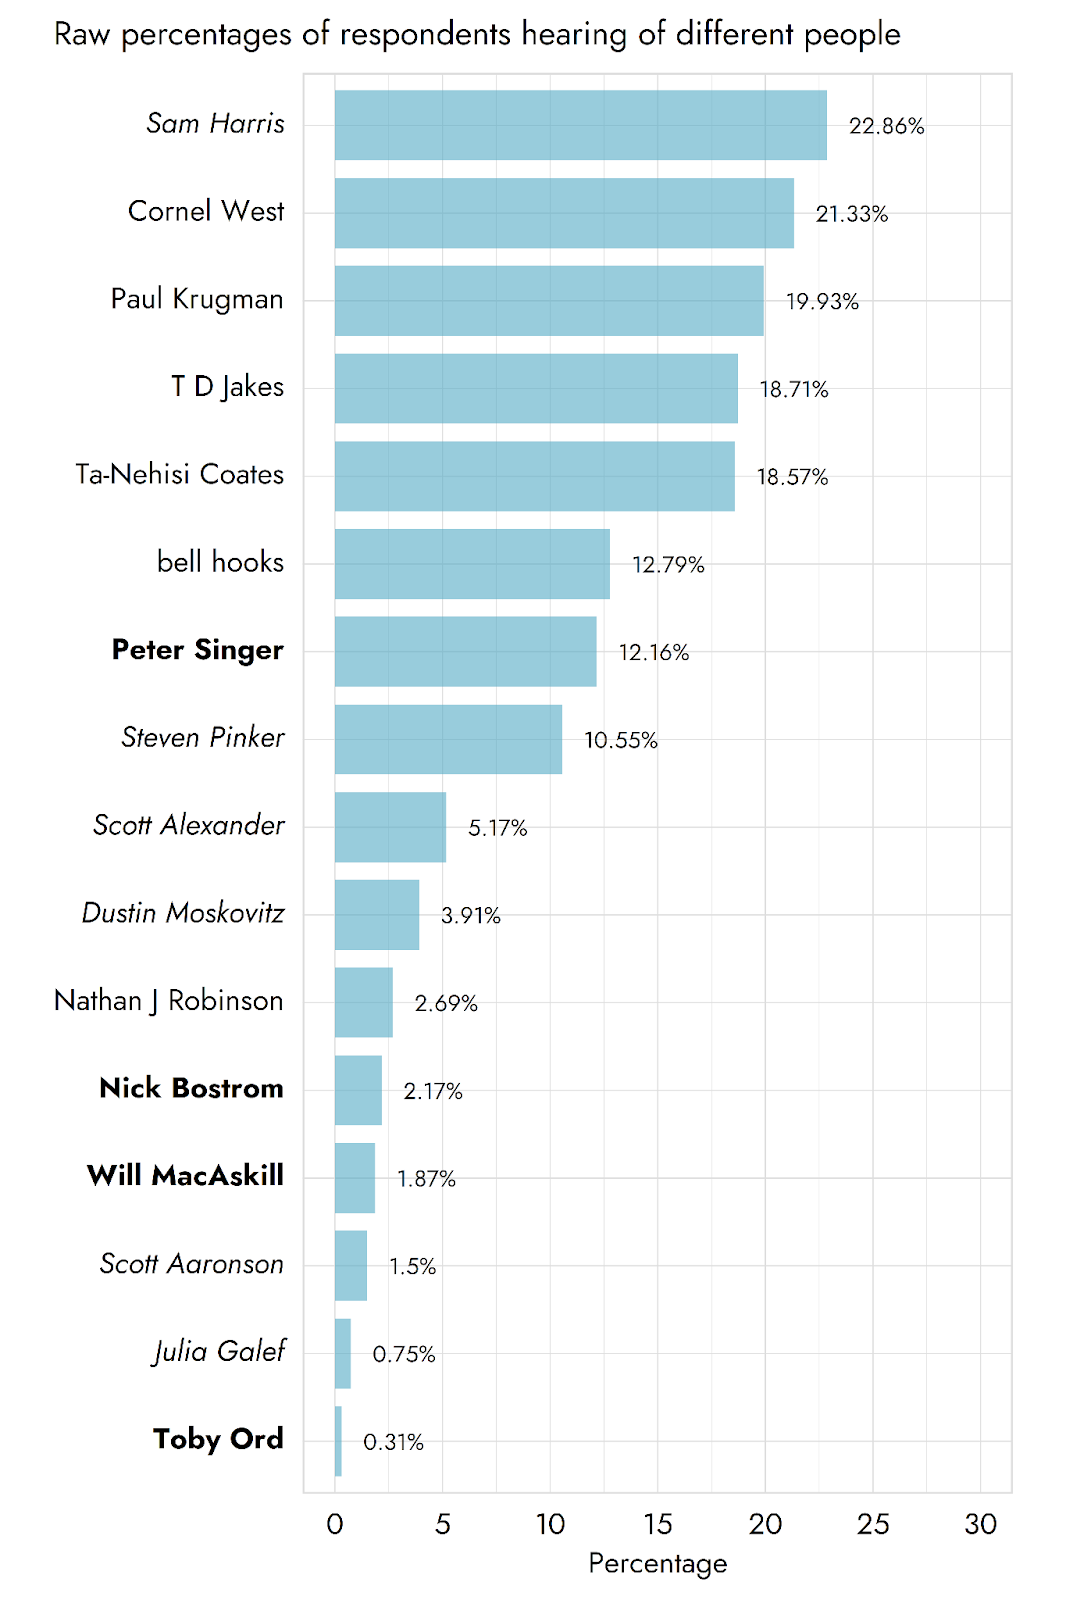
How many people have heard of different public figures?
We also provide estimates for how many people in the US population have heard of various public figures overall.[16] Note that we did not screen these responses for true familiarity in the way that we did for the questions about having heard of EA, so these numbers should definitely not be taken at face value. They are most akin to the numbers initially claiming to have heard of the term 'effective altruism', which were dramatically lower after screening for familiarity.
Perhaps unsurprisingly, Peter Singer was the most commonly known of the core EA figures (11.2%). He was less well known than EA-adjacent figure, Sam Harris (20.2%), though more well known than Steven Pinker (8.0%), having roughly similar levels of recognition to Ta-Nehisi Coates (11.7%).
Most other EA figures appeared to be comparatively less widely known (<5% claiming to have heard of them). Now that we have this ‘baseline’ data, it will be interesting to see whether these numbers increase over time (e.g. in response to new book releases or press coverage).
On the face of it, Scott Alexander appears to be somewhat more widely known (5.5%), though since this is a relatively common (and perhaps familiar-sounding) name, this could be partly driven by false positives. As shown in our analysis below, very few people reported having heard of his new blog ‘Astral Codex Ten’ (though SlateStarCodex was spontaneously mentioned in some responses about where respondents heard of EA, which we will discuss in a later post).
If there were particular interest, we could easily conduct additional followup studies to check for familiarity with these figures or with EA organisations.
We also did not display the differences in proportions having heard of different public figures across different groups, though could provide this information on request.
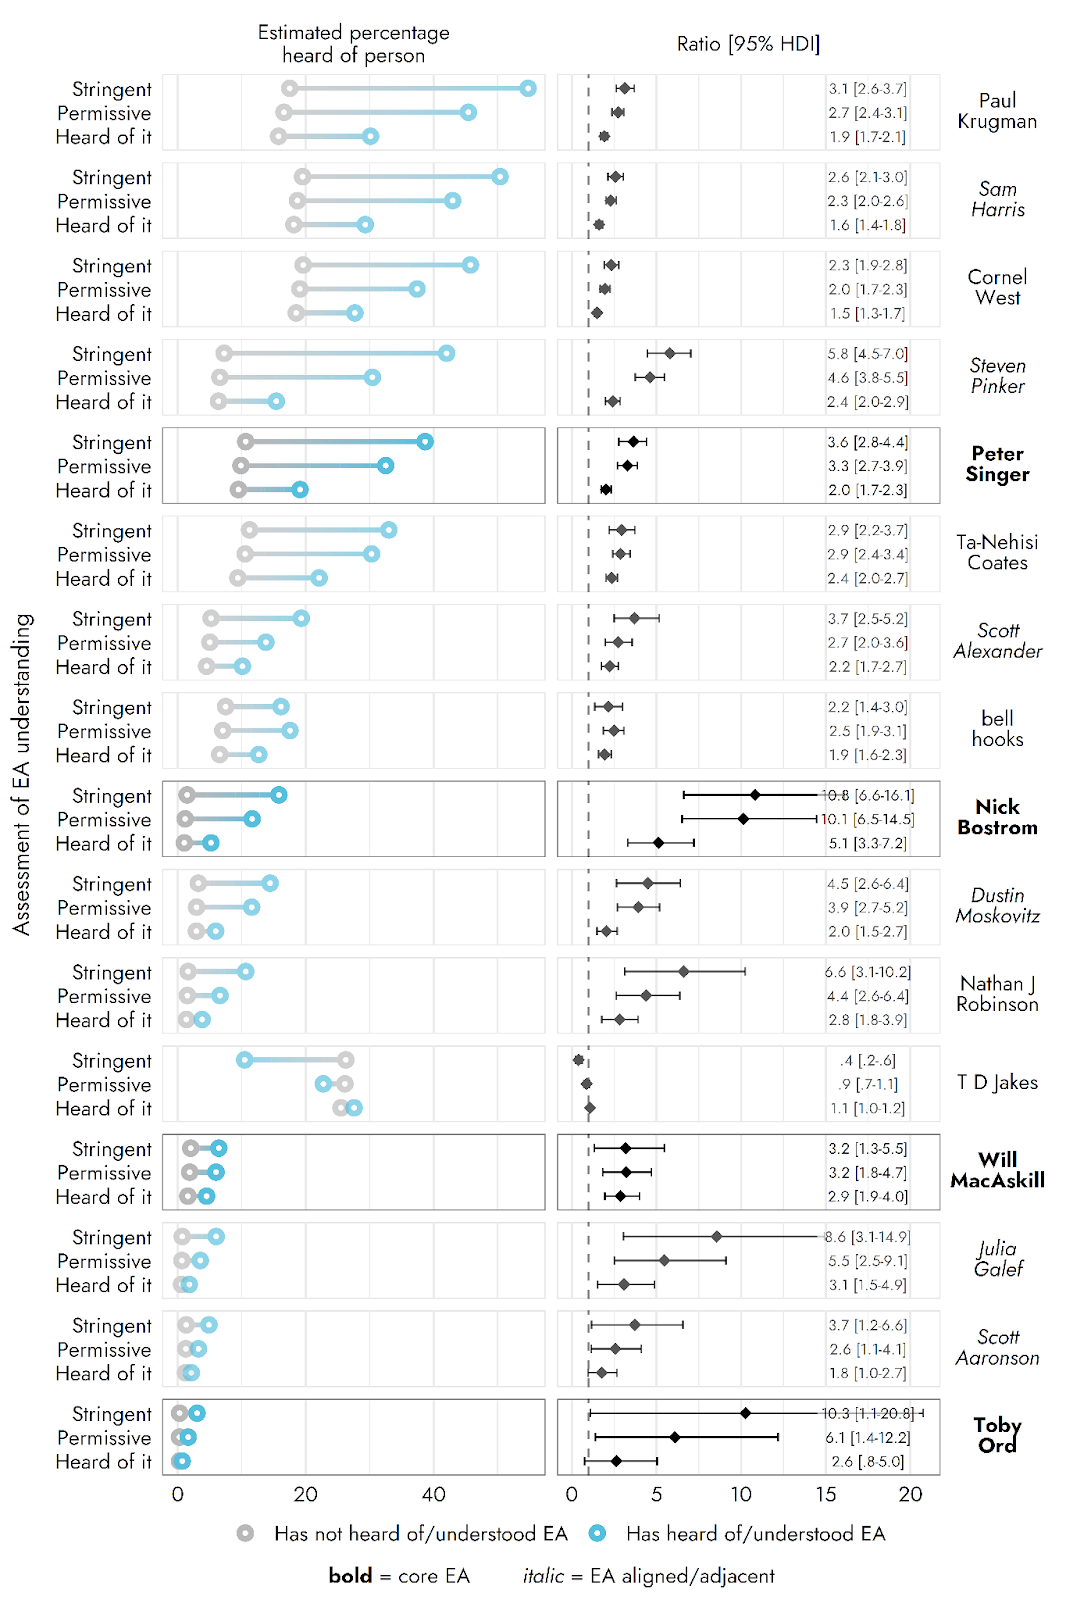
We also examine the proportions of individuals who have heard of the different figures among those who we classified as having heard of EA, compared to those who we did not.
In most, though importantly not all (see T.D. Jakes), we find that people who had heard of EA were more likely to have heard of most of the figures displayed below (which makes sense since most of the figures displayed are public intellectuals of one kind or another). As noted above, people who were classified as having heard of EA were also more highly educated, along with other differences, which may account for some of this trend.
If we look at the ratios on the right hand side of the graph, we can see those classified as having heard of EA, are particularly more likely to have heard of less generally well known EA figures, such as Nick Bostrom and Toby Ord.
Notably, these results also suggest that most people who seem to have heard of EA do not have any familiarity with any key EA figures (though large numbers report having heard of Peter Singer). We discuss the implications of this in our conclusion.
How many people have heard of different orgs/institutions?
The most widely known EA-related organisation was GiveWell (7.8%). Perhaps surprisingly, they were not too far behind Charity Navigator (9.1%). Other EA related orgs were less well known (<5%).
We also examined how many people reported having heard of these organisations among those who had heard of EA, compared to those who had not.
Here we also observe a general tendency for people classified as having heard of effective altruism to have heard of the various organisations or institutions in greater numbers, but with particularly pronounced effects for some EA or EA-adjacent options. For example, people classified as having heard of EA are several times more likely to indicate having heard of GiveWell, Astral Codex Ten or 80,000 Hours.
Conclusions
These results offer the first representatively weighted estimates of how many people in the US general population have heard of effective altruism to our knowledge. Numbers who have heard of EA are relatively low, and though higher in some groups than others, are not dramatically high, even some of the potentially more likely groups.
Comparing these results to the earlier (non-representative) survey we conducted with CEA we can see our estimates for the number of US students who have heard of EA is somewhat lower (7%), compared to the 10-15% mentioned previously for that survey. We think this is primarily due to more stringent classification of whether people seemed to have heard of EA in our analysis. If we compare the raw (unweighted) numbers claiming to have heard of EA, they are much more similar: 21.9% in the first survey and 22.8% in our more recent survey.
Our new survey also offers insight into the differences between different types of university. Here we found that people who had attended (or were current students at) top 50 ranked US universities were more likely to have heard of EA. We also found a trend in the direction of attendees of a more select group of around 15 universities were even more likely to have heard of effective altruism, though we didn’t report that here due to smaller sample size. We will further explore these differences in a more fine-grained sense once we have recruited a larger number of students as mentioned above.
Once we have recruited a larger number of students, this may also allow us to assess what drives differences between different types of universities, i.e. how far are these effects specific to different universities or driven by differences in the composition of the student body at highly ranked universities.
Our results are also broadly in line with Lucius Caviola and co-authors’ recent survey focused on students at NYU. They found that 7.4% of their respondents had heard of EA using their more stringent measure, while 10.6% met their more permissive measure. This compares to 4.1% using our more stringent measure and 7.9% using our more permissive measure for students at top 50 universities. As we noted above, we found that even higher percentages at yet more highly ranked universities (NYU is top 10 ranked), so our estimates for NYU specifically would have been higher still. As with our earlier survey with CEA, we think the remaining difference is likely primarily explained by more conservative coding (our ‘stringent’ code was particularly conservative) and additional checks. Looking at whether people claimed to have heard of EA, the NYU survey found 40.7% saying they had, compared to 44.2% estimated for current students at top 50 universities overall in our survey, which is much more similar.
We also found a number of substantial differences in the numbers of people who had heard of EA among different groups. Each of these require different follow-up research and may suggest different explanations. For example, we need to know where different groups are hearing (or not hearing) about effective altruism to understand why different groups are more likely to hear about effective altruism. We will explore this in our later post about where people first hear about EA. These differences may suggest different ways to improve EA outreach and may point to problem earlier in the ‘funnel’ causing differences in the composition of the EA community.
As we also highlighted, not only is it the case that relatively few people have heard of most EA related organisations or public figures, but also even among people who seem to have heard of effective altruism and roughly know what it is, few recognise most core EA figures or orgs. While this is plausibly partly explained by ‘false positives’ who seem to have heard of effective altruism (but have not actually heard of EA or anything related to it), we think that it is plausible that most people who have heard of EA and have a rough basic understanding of what it means, nevertheless have almost no familiarity with any other part of the movement such as its core figures or organisations. We think this may be under-estimated by EAs (who may be inclined to imagine that people who have heard of EA will have a greater level of familiarity than they actually do- due to a combination of the curse of knowledge and typical mind fallacy). As such, even among the relatively small numbers of people who seem to have some basic familiarity with effective altruism, there may be much more scope to introduce them to key figures, organisations and ideas.
Appendix 1: Unweighted results
Which of the following terms have you previously heard of? Select all that apply.
Which of these responses best describes your level of understanding of the term "effective altruism"?
Please briefly explain what you understand by the following term: “effective altruism”
Which of the following have you previously heard of? Select all that apply.
Which of the following have you previously heard of? Select all that apply.
Appendix 2: Reported familiarity with terms (weighted)
To provide more points of comparison for how many people claim to have heard of ‘effective altruism’, we also show the percentages of people in the US adult population estimated to have heard of the various different terms shown in our first question.
Of course, these are simply the percentages of people who claimed to have heard of these terms and, as we have argued above, most people who claim to have heard of ‘effective altruism’ do not seem able to demonstrate any familiarity with it. Since this very likely applies to other items on this list, but the rate of false positives may vary across the other items, these unscreened results may not reflect the real magnitude of the differences between how many people have heard of these terms.
These results place ‘effective altruism’ in the middle of the pack in terms of the various items that we listed, in between the ‘Barbizon school’ of art and the term ‘verisimilitude’. Evidence-based medicine, conservation biology and cell-based meat, as well as molecular gastronomy were all much more commonly selected as terms that respondents had heard about.
Acknowledgements
This research is a project ofRethink Priorities. This post was written by David Moss and Jamie Elsey. Thanks to Peter Wildeford and Lucius Caviola for comments, to Annabel Rayner for research assistance, and to CEA for their collaboration on the earlier brand awareness survey.
We have since begun recruiting an additional sample of current students (of around an additional 5000), which will allow us to make even more specific estimates for this sub-population.
The 95% highest density intervals (HDIs) for these estimates can be viewed in the Results section below. In Bayesian analyses, estimates take the form of a 'posterior distribution': a range of values given different levels of plausibility on the basis of the analysis performed. A highest density interval (HDI) of 95% reflects the most likely 95% of values in the posterior distribution.
All responses were first coded by coder #1, coder #2 then reviewed and amended responses. All open comment responses were coded without coders being able to see the demographic information of respondents, so the group differences below should not be influenced by this.
We think there are two plausible kinds of explanations for this. The more pessimistic explanation is that respondents were more likely to over-claim in response to the first question because they were more likely to think that it was a ‘screening’ question for the survey, where they needed to indicate knowledge in order to be eligible for a future survey. Prolific does not allow internal screening within surveys, i.e. where respondents are barred from completing a survey because they do not answer a screening question in a certain way, but one can run an initial survey to detect eligibility and then offer eligible respondents a followup survey. It’s possible that after answering these initial questions respondents were more likely to believe they had already been screened and therefore felt less pressure to claim to have heard things in the later questions.
The more innocent explanation is that people were more likely to mistakenly believe that they remembered having heard of general terms (in particular terms like ‘effective altruism’ and ‘gastronomic realism’ which are combinations of real words and so may sound familiar), than they are of for names of specific organisations or persons. They may also feel less embarrassed to not know particular figures or charities, than general terms, which they feel they should know.
Note that such responses could cause difficulties for conclusions about differences across groups. However, fortunately, when we examined differences across groups excluding responders who had selected gastronomic realism, the results were largely unchanged.
The ‘exclusive’ numbers above counted respondents as having heard of EA only if they self-reported at least a ‘basic’ level of understanding of effective altruism in the first followup question, regardless of how their qualitative response was coded. The ‘inclusive’ numbers included all respondents who were coded as understanding, regardless of their self-reported level of understanding (though excluding those who reported they have ‘not heard of’ EA after having initially claimed to have heard it). The numbers can be seen to converge very closely, largely because few respondents who self-reported less than a basic level of understanding were coded as seeming to have heard of EA. Given this, we only report the ‘inclusive’ percentages in the remaining analyses below.
The ‘heard of it’ measure is simply the percentage selecting effective altruism in response to the first question asking which terms they had heard of. We include this for reference, but believe that many of these responses will be false positives.
We use each of these different weighting methods for particular analyses looking at differences across groups below, based on which variables were included in the different weighting methods and what format the outcome variables of interest were in.
These correspond to reliable differences for both the permissive and stringent categories, with odds ratios suggesting that men are 1.33 [1.09-1.58] and 1.44 [1.01-1.91] times more likely to have heard of EA than women. Note, however, that the HDIs do give credence to quite negligible differences between men and women.
Of course, other factors could also influence the composition of the community including, i) how many of those reached are interested in engaging with EA, ii) how many of those are retained in EA and for how long, iii) how these rates have changed over time (e.g. in earlier years those who heard of EA may have been more likely to be male), so current composition may differ from current recruitment, (iv) the interaction of other variables (e.g. if men are more likely to hear about EA from podcasts, and people who hear about EA from podcasts were more likely to get involved, this could generate a skew in composition even in the absence of any difference in men and women’s inherent propensity to get involved).
Though note that the confidence interval for this difference indicates plausible values so low as to be negligible, or not present in Stringent responses, alongside also possibly very high values: Permissive = 1.8 [1.06-2.82], Stringent = 2.00 [.91-3.81]).
The uncertainty of the estimate for those with ‘less than high school’ education owes to the low number of respondents in the sample with this level of education.
We have excluded a number of non-EA figures who were extremely commonly known for ease of visualisation (e.g. Jennifer Lawrence, Hugh Jackman, Rashida Jones, Joel Osteen and Jordan Peterson). We have also excluded a number of non-EA adjacent control figures, who were selected by relatively few individuals (John McWhorter, Adolph Reed, Slavoj Zizek, Freddie de Boer and Rod Dreher).


Fantastic writeup, I haven't read all of it yet, but I really want to shout out whoever made the charts. All of these charts are super well done, I really respect the effort that went into them, and it totally paid off. Especially the first chart, that could have very easily been a very ugly pie chart, is instead a beautiful linear proportion chart. Hats off!
That is Jamie Elsey's magic, and I anticipate 'more where this came from' coming soon. :)
Thank you Chris! One would think that years of disappointing cake and pizza apportionment would have taught people that we don't read things very precisely when they're circles, but the pie chart remains...