Hide table of contents

A huge thanks to @Agustín Covarrubias 🔸  for his feedback and support on the following article:


Shapley values are an extremely popular tool in both economics and explainable AI.

In this article, we use the concept of “synergy” to build intuition for why Shapley values are fair. There are four unique properties to Shapley values, and all of them can be justified visually. Let’s dive in!

A figure from Bloch et al., 2021 using the Python package SHAP

The Game

On a sunny summer day, you and your two best friends decide to run a lemonade stand. Everyone contributes something special: Emma shares her family’s secret recipe, Liam finds premium-quality sugar, and you draw colorful posters.

The stand is a big hit! The group ends up making $280. But how best to split the profits? Each person contributed in a different way, and the success was clearly due to teamwork…

Luckily, Emma has a time machine. She goes back in time — redoing the day with different combinations of team members and recording the profits. This is how each simulation went:

Who was involved?Total profits
Only Emma$20
Only you$30
Only Liam$10
Emma and you$90
You and Liam$100
Liam and Emma$30
Emma, Liam, and you$280

Individually, Emma makes 20 dollars running the lemonade stand, and you make 30 dollars. But working together, the team makes 90 dollars.

The sum of individual profits is 20 + 30 = 50 dollars, which is clearly less than 90 dollars. That extra 90 - 50 = 40 dollars can be attributed to team dynamics. In game theory, this bonus is called the “synergy” of you and Emma. Let’s visualize our scenario as a Venn diagram.

Note: Synergies can also be negative (e.g., if Liam and Emma fought it could hurt profits).

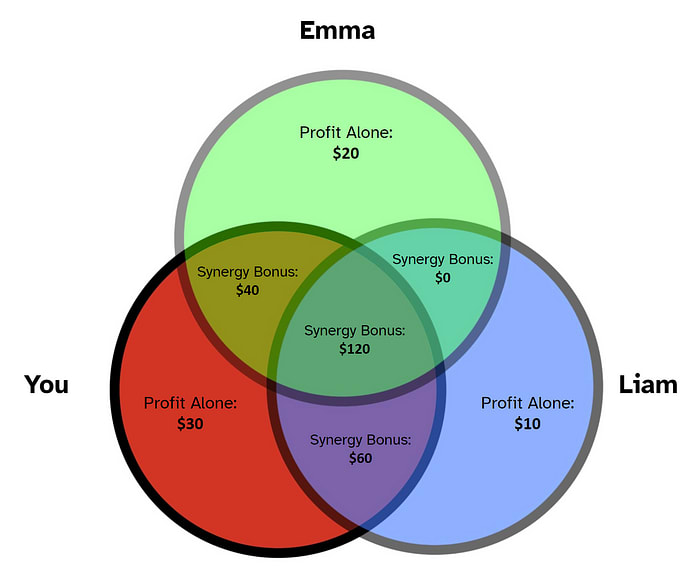
The synergy bonuses in the Venn diagram are “unlocked” when the intersecting people are part of the team. To calculate total profit, we add up all areas relevant to that team.

For example, when the team consists of just you and Liam, three portions of the Venn diagram are unlocked: the area exclusive to you (30 dollars), the area exclusive to Liam (10 dollars), and the area exclusively shared by you and Liam (60 dollars). Adding these areas together, the total profit for team “You and Liam” comes out to 30 + 10 + 60 = 100 dollars.

Referring to our Venn diagram, the same formula holds true for every other team:

Team membersSum of synergiesTotal profits
Emma$20$20
You$30$30
Liam$10$10
Emma, You$20 + $30 + $40$90
You, Liam$30 + $10 + $60$100
Liam, Emma$10 + $20 + $0$30
Emma, You, Liam$20 + $30 + $10 + $40 + $60 + $0 + $120$280

Emma and Liam are impatient and want their fair share of money. They turn to you, the quick-witted leader for help. While staring at the Venn diagram, an idea strikes!

Take a moment to look over the visual. How would you slice up the Venn diagram fairly? Pause here, and continue when ready.


You decide to take each “synergy bonus” and cut it evenly among those involved.

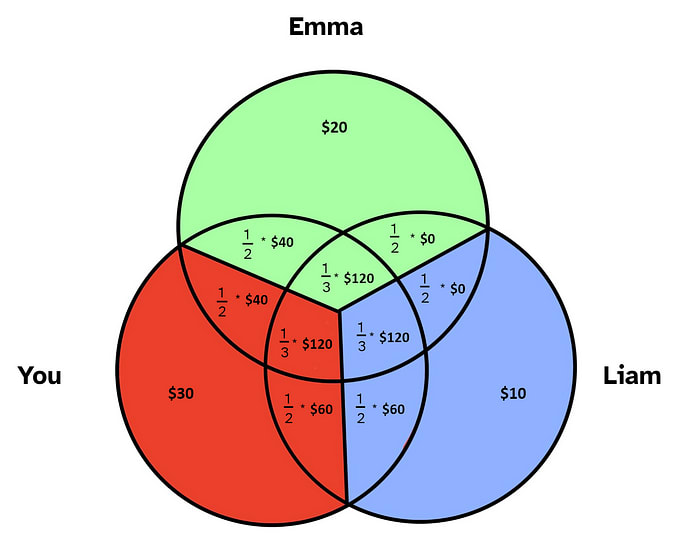
Doing the math, each person’s share comes out to:

Emma and Liam agree the splits are fair. The money is handed out, and everyone skips happily home to dinner.

In this story, the final payouts are the Shapley values of each team member. This intuition is all you need to understand Shapley values. For the adventurous reader, we now tie things back to formal game theory.


The Formalities

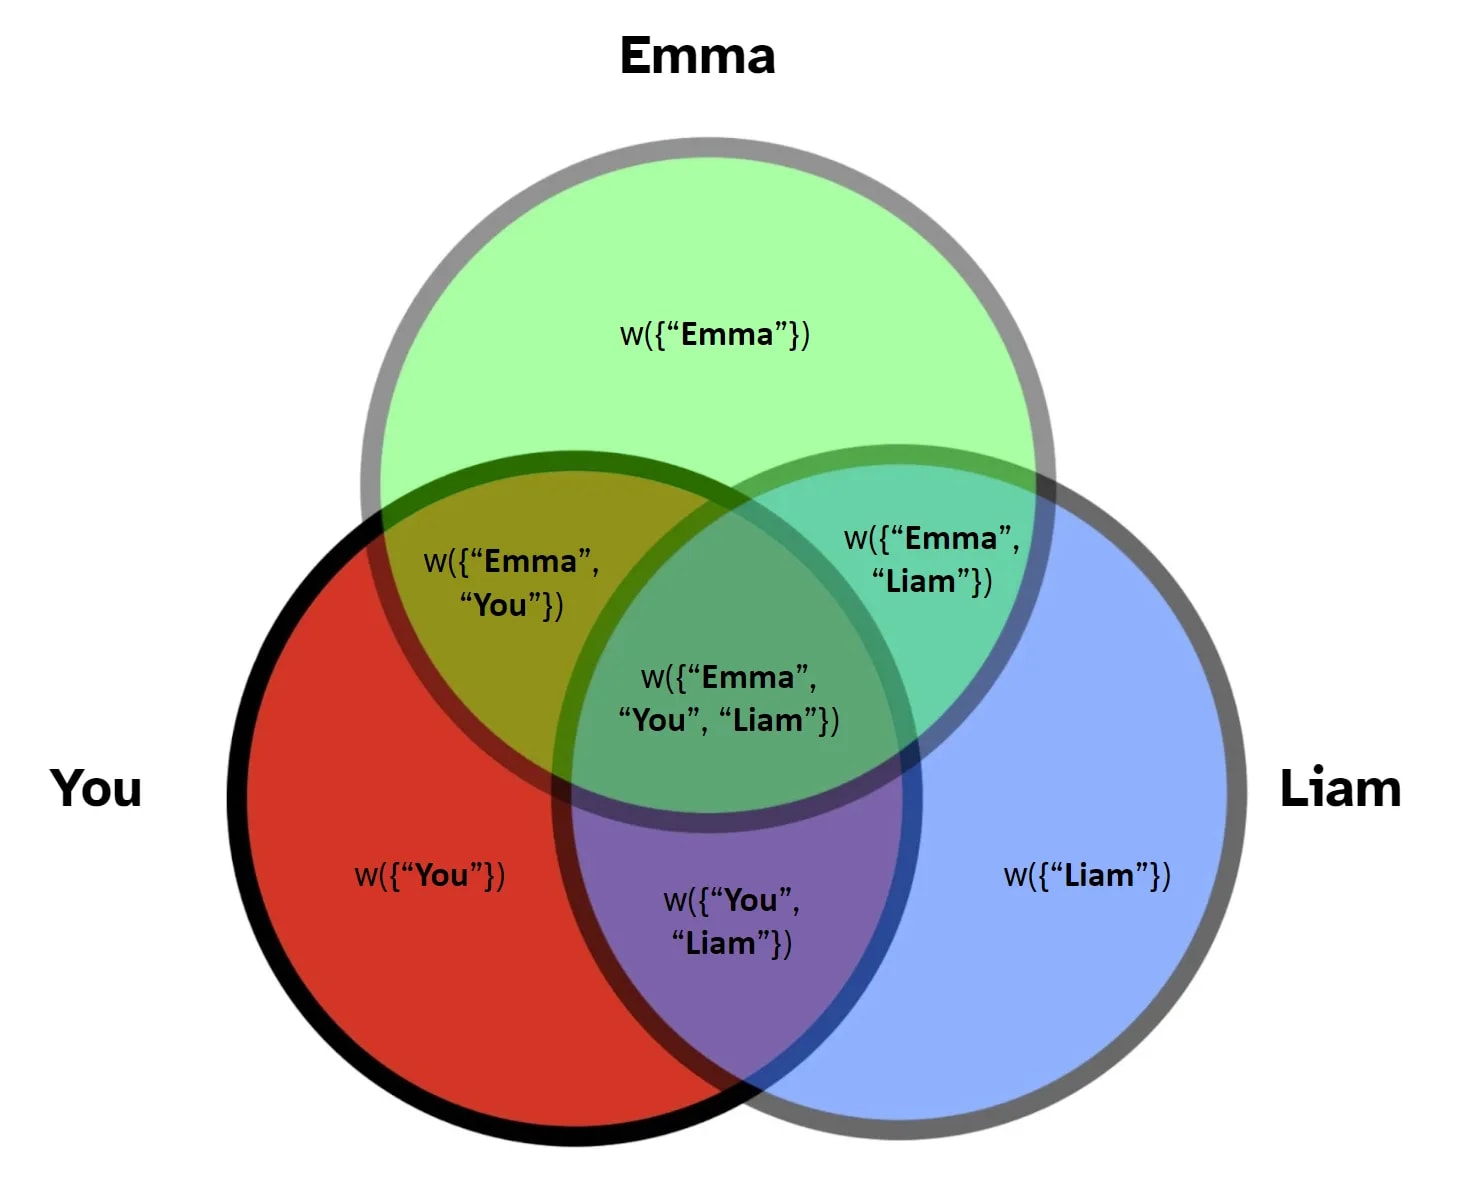
Shapley values are a concept from cooperative game theory. You, Liam, and Emma are all considered “players” in a “coalition game”. Every possible “coalition” (or team) has a certain “payoff” (or profit). The mapping between coalition and payoff (a.k.a. which just corresponds to our first table of profits) is called the “characteristic function” (as it defines the nature, or *character*, of the game).

We define a set of players  (which, in this case, is You, Emma, and Liam), and a characteristic function , where :

We can see how this is the same mapping we had in our table of profits by players:

Who was involved?Total profits
Only Emma$20
Only you$30
Only Liam$10
Emma and you$90
You and Liam$100
Liam and Emma$30
Emma, Liam, and you$280

We also define a synergy function labeled  where :

Similarly, the synergy function just corresponds to areas of the Venn diagram:

https://miro.medium.com/v2/resize:fit:4800/format:webp/1*QilJDt6fx0PcgpSnLks_fw.png

Thus, for a given player , the Shapley value is written as:

Which, in more compact notation, becomes:

The last is exactly the formula described on Wikipedia.


Concluding Notes

Shapley values are the ONLY way to guarantee:

  1. Efficiency — The sum of Shapley values adds up to the total payoff for the full group (in our case, $280).
  2. Symmetry — If two players interact identically with the rest of the group, their Shapley values are equal.
  3. Linearity — If the group runs a lemonade stand on two different days (with different team dynamics on each day), a player’s Shapley value is the sum of their payouts from each day.
  4. Null player — If a player contributes nothing on their own and never affects group dynamics, their Shapley value is 0.

Take a moment to justify these properties visually.

No matter what game you play and who you play with, Shapley values always preserve these natural properties of “fairness”.

Hopefully, you have gained some intuition for why Shapley values are “fair” and why they account for interactions among players. Proofs and more rigorous definitions can be found on Wikipedia.

Thanks for reading! :)

Comments4


Sorted by Click to highlight new comments since:

Thanks for posting this.

Do we have an intuition for how to apply shapely values in typical EA scenarios, for example: • How much credit goes to donors, vs charity evaluators, vs object level charities? • How much credit goes to charity founders/executives, vs other employees/contractors? • How much credit goes to meta vs object organizations?

Seconding this question, and wanted to ask more broadly: 

A big component/assumption of the example given is that we can "re-run" simulations of the world in which different combinations of actors were present to contribute, but this seems hard in practice. Do you know of any examples where Shapley values have been used in the "real world" and how they've tackled this question of how to evaluate counterfactual worlds?

(Also, great post! I've been meaning to learn about Shapley values for a while, and this intuitive example has proven very helpful!)

Executive summary: Shapley values, which determine fair allocation of rewards in cooperative games, can be intuitively understood using Venn diagrams to visualize how individual contributions and synergies between players combine to create total value.

Key points:

  1. Shapley values calculate fair payouts by dividing both individual contributions and "synergy bonuses" (additional value from cooperation) among relevant team members
  2. Using a lemonade stand example, the method shows how to split $280 total profit among three contributors based on their individual and combined performances
  3. Venn diagrams provide an intuitive visualization where overlapping regions represent synergies between specific team combinations
  4. The approach guarantees four key properties: efficiency (payouts sum to total), symmetry (equal contributors get equal shares), linearity (additive across games), and null player (no contribution means no payout)
  5. This framework has practical applications in both economics and explainable AI for understanding and attributing value fairly


This comment was auto-generated by the EA Forum Team. Feel free to point out issues with this summary by replying to the comment, and contact us if you have feedback.

Thanks for cross posting, this got Shapley values to "click" for me!

Curated and popular this week
 ·  · 1m read
 · 
(Audio version here, or search for "Joe Carlsmith Audio" on your podcast app.) > “There comes a moment when the children who have been playing at burglars hush suddenly: was that a real footstep in the hall?”  > > - C.S. Lewis “The Human Condition,” by René Magritte (Image source here) 1. Introduction Sometimes, my thinking feels more “real” to me; and sometimes, it feels more “fake.” I want to do the real version, so I want to understand this spectrum better. This essay offers some reflections.  I give a bunch of examples of this “fake vs. real” spectrum below -- in AI, philosophy, competitive debate, everyday life, and religion. My current sense is that it brings together a cluster of related dimensions, namely: * Map vs. world: Is my mind directed at an abstraction, or it is trying to see past its model to the world beyond? * Hollow vs. solid: Am I using concepts/premises/frames that I secretly suspect are bullshit, or do I expect them to point at basically real stuff, even if imperfectly? * Rote vs. new: Is the thinking pre-computed, or is new processing occurring? * Soldier vs. scout: Is the thinking trying to defend a pre-chosen position, or is it just trying to get to the truth? * Dry vs. visceral: Does the content feel abstract and heady, or does it grip me at some more gut level? These dimensions aren’t the same. But I think they’re correlated – and I offer some speculations about why. In particular, I speculate about their relationship to the “telos” of thinking – that is, to the thing that thinking is “supposed to” do.  I also describe some tags I’m currently using when I remind myself to “really think.” In particular:  * Going slow * Following curiosity/aliveness * Staying in touch with why I’m thinking about something * Tethering my concepts to referents that feel “real” to me * Reminding myself that “arguments are lenses on the world” * Tuning into a relaxing sense of “helplessness” about the truth * Just actually imagining differ
Garrison
 ·  · 7m read
 · 
This is the full text of a post from "The Obsolete Newsletter," a Substack that I write about the intersection of capitalism, geopolitics, and artificial intelligence. I’m a freelance journalist and the author of a forthcoming book called Obsolete: Power, Profit, and the Race to build Machine Superintelligence. Consider subscribing to stay up to date with my work. Wow. The Wall Street Journal just reported that, "a consortium of investors led by Elon Musk is offering $97.4 billion to buy the nonprofit that controls OpenAI." Technically, they can't actually do that, so I'm going to assume that Musk is trying to buy all of the nonprofit's assets, which include governing control over OpenAI's for-profit, as well as all the profits above the company's profit caps. OpenAI CEO Sam Altman already tweeted, "no thank you but we will buy twitter for $9.74 billion if you want." (Musk, for his part, replied with just the word: "Swindler.") Even if Altman were willing, it's not clear if this bid could even go through. It can probably best be understood as an attempt to throw a wrench in OpenAI's ongoing plan to restructure fully into a for-profit company. To complete the transition, OpenAI needs to compensate its nonprofit for the fair market value of what it is giving up. In October, The Information reported that OpenAI was planning to give the nonprofit at least 25 percent of the new company, at the time, worth $37.5 billion. But in late January, the Financial Times reported that the nonprofit might only receive around $30 billion, "but a final price is yet to be determined." That's still a lot of money, but many experts I've spoken with think it drastically undervalues what the nonprofit is giving up. Musk has sued to block OpenAI's conversion, arguing that he would be irreparably harmed if it went through. But while Musk's suit seems unlikely to succeed, his latest gambit might significantly drive up the price OpenAI has to pay. (My guess is that Altman will still ma
 ·  · 16m read
 · 
Over the years, I have learned many things that are rarely taught about doing cost-benefit or welfare analysis. Here are a few things that I often end up repeating when I mentor individuals or teams working on these kinds of projects: A Point Estimate is Always Wrong For any purpose other than an example calculation, never use a point estimate. Always do all math in terms of confidence intervals. All inputs should be ranges or probability distributions, and all outputs should be presented as confidence intervals. Do not start with a point estimate and add the uncertainty later. From day one, do everything in ranges. Think in terms of foggy clouds of uncertainty. Imagine yourself shrinking the range of uncertainty as you gather more data. This Google Sheets Template allows you to easily set up Monte Carlo estimations that turn probabilistic inputs into confidence-interval outputs. Use Google Sheets I have experience programming in half a dozen languages, including R. Sometimes they are useful or necessary for certain kinds of data analysis. But I have learned that for almost all cost-benefit analyses, it is best to use Google Sheets, for several reasons. The main one is transparency. A cost-benefit or welfare analysis is a public-facing document, not an academic one. You should not use esoteric tools unless absolutely necessary. Anyone in your society with basic literacy and numeracy should be able to read over and double-check your work. When you are done and ready to publish, you make your Sheet visible to everyone, and add a link to it in your report. Then anyone can see what you did, and effortlessly copy your code to refine and extend it, or just play around with different priors and assumptions. This transparency also helps improve results and correct mistakes as you are doing the work. The more people review your math, the better it will be. The number of people who are willing and able to look over a spreadsheet is orders of magnitude higher than the