Maybe. We're a little unsure about this right now. The code base for this is part of the bigger Cross-Cause Cost-Effectiveness Model which we haven't made a final determination on whether we will release it.
Do you mind sharing your main consideration against releasing it? Not trying to push back, but rather to understand this as I'm considering working on related topics
This looks like a really cool framework! Hoping to experiment with the inputs sometime to inform my future career decisions / my thoughts on funding desk research versus original research / value of replications.
Moving some funders from an overall lower cost effectiveness to a still relatively low or middling level of cost effectiveness can be highly competitive with, and, in some cases, more effective than working with highly cost-effective funders.
I’ve suspected this but never had the framework to formalize it. Or what parameters my claim was sensitive to. Mostly I had a toy metaphor in my head of “small nudge on giant slow rock” > “big nudge on tiny speeding rock” (the former being a bureaucrat nudging an agency budget and the latter being a CEO pivoting an EA-style non-profit). So having more of these cruxes and levers listed out here is very helpful
One concrete case I feel is a sort of “constrained optimization” where a funder has a specific theme they want to stick to. With governments, this might be a legal requirement.
This is great! I just wanted to specifically call out that I liked the footnote on the use of DALYs. That's exactly the kind of thing I was hoping to see more of when I wrote the improving EA communication surrounding disability post.
Executive summary: A model is presented for estimating the value of research aimed at influencing funders' allocations. Key inputs include chance of influencing funder decisions, amounts donated, cost-effectiveness of current vs. potential funding, and research costs.
Key points:
The model estimates the impact of research by assessing the likelihood of influencing a funder and the resulting change in funding cost-effectiveness.
It accounts for research costs, donation amounts, years of influence, and uncertainty. Monte Carlo simulations are used.
Examples suggest research can often compare favorably to direct funding even with limited years of influence.
Shifting funders from low to moderate cost-effectiveness can be highly cost-effective.
Limitations include estimating influence, transition costs, alternate uses of money, declining returns, and uncertainty.
The model currently uses an expected value framework and doesn't account for risk aversion or moral uncertainty.
This comment was auto-generated by the EA Forum Team. Feel free to point out issues with this summary by replying to the comment, andcontact us if you have feedback.
A Model Estimating the Value of Research Influencing Funders — EA Forum
A Model Estimating the Value of Research Influencing Funders
Various groups seek to improve the allocations of funders by completing research. Often the estimates for the impact of such work stop at estimates for the amount of money it influences. In this post, we outline a detailed methodology for estimating the impact of research of this nature, and share some deterministic spreadsheets and online Monte Carlo tools for doing so. We further elaborate on some brief examples of using this method for our work on global health and development, as well as animal welfare. Readers are encouraged to use their own inputs in our spreadsheets or tools in order to estimate the potential value of research of this nature.
We also highlight two notable potential implications of estimating the value of research using our model:
It can, at times, estimate that it is more cost effective to do research than to directly fund highly effective interventions, even if one thought the estimated counterfactual impact of working with funders was likely to last one year or less.
Moving some funders from an overall lower cost effectiveness to a still relatively low or middling level of cost effectiveness can be highly competitive with, and, in some cases, more effective than working with highly cost-effective funders.
Lastly, we also note various limitations to using this model, and provide a fuller description of the formulas within the model in the formulas appendix.
As some further context, this model is one module of the larger forthcoming Cross-Cause Cost-Effectiveness Model from Rethink Priorities’ Worldview Investigation Team which is currently planned to be released over the course of the next six weeks.
An Overview of The Model
This model for estimating the impact of this work assumes that the value of influencing a funder[1] can be roughly estimated by the following six main variables, each with a few inputs:
Estimating how likely one is to produce a report that leads a funder to update and change their decisions by estimating:
How likely one is to find a donor to work with who’s donating the money stated in (2)
How likely one is to produce a report that reaches a conclusion that suggests the donor should update their behavior (this accounts for the chance of producing a report that ultimately doesn’t have implications for what to do)
How likely the funder is to update given them receiving a report which suggests they should update their behavior
Estimating the annual amount of money that could be influenced by the produced report:
Estimating the amount of money from the funder that is influenceable per year
Estimating the percentage of reports the funder updates on
Estimating the value of the good that the funder is currently doing, and the good they could be doing with (2):
Estimating the amount of good a funder is currently doing based on the cost effectiveness of the current intervention(s) they fund
Estimating the amount of good a funder could be doing via the cost effectiveness of the target intervention they could update to funding based on the results of the research
Estimating the total amount of DALYs[2] that would be prevented via the total amount of money being influenced by the funder by:
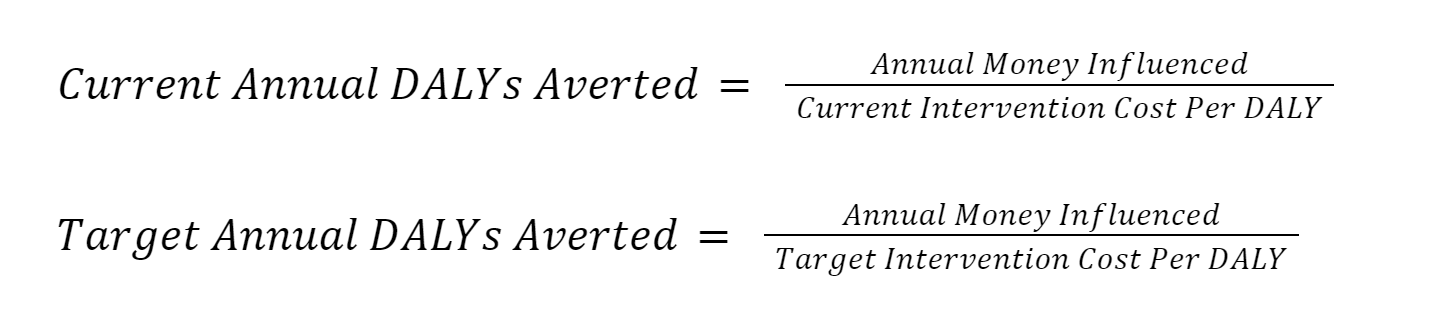
Estimating the annual DALYs averted by subtracting the value of the current good from the value of the good that could be done in (3)
Multiplying the estimated annual DALYs averted figure by an estimate of the number of years of counterfactual credit
Estimating costs per research project:
Estimating the average number of full-time employees (FTE) per project
Multiplying that average FTE by any further costs to employ them
Taking all of those together, one can estimate:
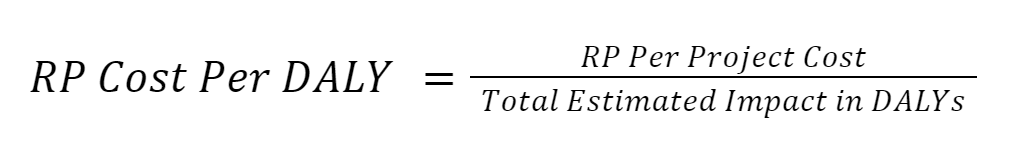
The cost per DALY by dividing the per project costs from (5) with the total estimated DALYs from (4)
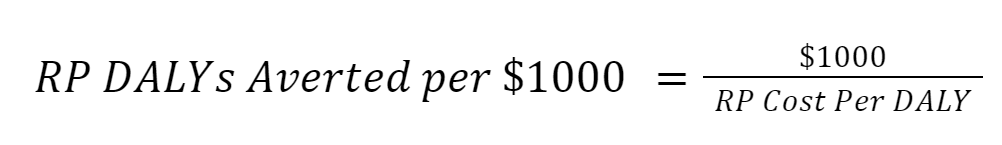
The number of DALYs averted per $1,000 by dividing $1,000 by the value from the prior step
For animal welfare and global health and development research of this nature we have made deterministic spreadsheetversions (for GHD and Animal Welfare respectively) of the model and onlinetools too made in Python using Monte Carlo simulations of distributions for inputs to account for uncertainty, which allows users to live update the parameters and results. Within that online tool we also have various templates associated with different general types of research too (e.g. a project to modestly improve a well-funded GHD project, or a speculative project to improve a state of the art and well funded GHD project).
Again, for a fuller explanation of the formula in the model please see the description in the appendix.
Some Further Elaboration for Rethink Priorities’ Global Health and Development Work
You can use an online tool that uses Monte Carlo simulations to account for uncertainty about many of the parameters. The tool allows you to live change the parameters within ranges and see how results are altered as a result. We have also implemented this model in this spreadsheet, which fixes several parameters as static inputs but could potentially be more intuitive for some users.
0.25 FTE year spent finding the funder for who the project is for
The funder currently granting at ~$20K per DALY averted and our work attempts to influence them to $250 per DALY averted
99% the funder updates in the correct direction[4]
Given these assumptions, projects cost about $88K each. If the funder updates their behavior, then they go from averting ~13 DALYs with that money to averting ~1,026 DALYs. Accounting for some chance of being wrong with our recommendation, that’s about 1,004 extra DALYs averted per year in expectation. Then the value of the research is ~$89 per DALY or ~11 DALYs averted per $1,000.[5]
27% chance of a report a target updates on (90% creating a report worth updating, 30% the funder actually updates)
$181K for annual RP staff costs per staff
1 year of counterfactual credit
8 weeks per project
2.5 FTE staff per project
0.25 FTE year spent finding the funder for who the project is for
A funder currently granting at ~$1000 per DALY averted being moved to $100 per DALY averted
99% the funder updates in the correct direction
Given these assumptions, projects cost about $115K each. If the funder updates their behavior, then they go from averting ~257 DALYs with that money to averting ~2,565 DALYs. Accounting for some chance of being wrong with our recommendation, that’s about 2,262 extra DALYs averted per year. Then the value of research is ~$50 per DALY or ~20 DALYs averted per $1,000.
In the deterministic spreadsheet we outline a number of further generic examples, and again encourage readers to use their own inputs in our online tool.
Some Further Elaboration for Rethink Priorities’ Animal Welfare Work
Interested readers can use an online tool that uses Monte Carlo simulations to account for uncertainty about many of the parameters, and has some templates for depending on the type of intervention being evaluated. The tool allows you to change the parameters within ranges and see how results change, in real time. We have also implemented this model in this spreadsheet, which fixes several parameters as static inputs but could potentially be more intuitive for some users.
Example 3
Using the online tool and starting with these premises:
$3-7M per year being spent
80-99% of that money is influenceable
20-40% creating a report worth updating
95-99% the funder actually updates
$170-190K for annual RP costs per staff
0.5-1.5 years of counterfactual credit
0.4-0.6 FTE staff per project
A funder currently granting at $2 per DALY, being moved to $1 per DALY[6]
If you assume you are already working with the funder, a 100% chance of finding them and zero time searching to find them, the value of research here is ~6.1K DALY per $1,000 (see the full results of the model with the listed specifications here).
45% chance of a report a target updates on (30% creating a report worth updating, 99% the funder actually updates)
$181K for annual RP staff costs per staff
1 year of counterfactual credit
5 months per project
2.5 FTE staff years per project
1 FTE year spent finding the donor
A funder currently granting at ~$1.50 per DALY averted being moved to $1 per DALY averted
95% the funder updates in the correct direction
Given these assumptions, projects cost about ~$95K each. If the funder updates their behavior, then they go from averting ~990K DALYs with that money to averting ~1.49M DALYs. Accounting for some chance of being wrong with our recommendation, that’s about 446K extra DALYs averted per year. If you assume you are already working with the funder, and therefore a 100% chance of finding them and zero time searching to find them, the value of research is ~$0.21 per DALY or ~4,711 DALYs averted per $1000.
Briefly on Two Potential Notable Implications of the Model
We strongly encourage interested readers to usetheirowninputs in order to estimate the potential value of research of this nature. From our own use of the models, we’ve come to place greater credence on the following two notable potential implications:
It can, at times, estimate that it is comparable or more cost effective to do research than to directly fund highly effective interventions, even if one thought the estimated counterfactual impact of working with funders was one year or less.
For instance, within global health and development, GiveWell estimates that charities that they recommend are somewhere between $50 to $100 per DALY, and we gave two at least somewhat plausible estimates in that range above.
Moving some funders from an overall lower cost effectiveness to a still relatively low or middling level of cost effectiveness can be highly competitive with, and, in some cases, more effective than working with highly cost-effective funders.
For instance, compare working with the likes of GiveWell or Open Philanthropy with the likes of some theoretical HIV or hypertension funders on global health and development. In examples within the related deterministic spreadsheet there were roughly similar levels of cost effectiveness for working with each.
Furthermore, for Animal Welfare a) consider potentially moving someone from $20 to $10 per DALY, compared to b) potentially from $6 to $5 per DALY, with other variables set the same, and the estimated cost effectiveness for a) is ~$1.64 per DALY, compared to ~$2.46 for b).
Limitations of the Model
There are many limitations to this model. In brief: (a) it depends on there being funders who update their behavior in response to evidence, (b) doesn’t account for any costs to a funder in switching grantees, (c) doesn’t consider alternate uses for money, (d) does not account for the strong potential for a declining ability to influence decisions via research, (e) many of the parameters are uncertain, (f) it only works well for research designed to estimate the cost effectiveness of interventions, (g) assumes a single actor, and (h) it only doesn’t account for possible different attitudes towards aspects such as risk aversion or moral uncertainty. We more fully describe these limitations below.
Many factors influence and limit the ability of research to influence funders decisions
This method of estimating the value of research takes as a core assumption that donors will update their behavior when presented with evidence. This may often not be true.
For example, some donors (and groups) may be responsive to evidence but constrained from changing their behavior by structural factors. For some of these actors, the correct estimate of how likely they are to update their behavior in response to evidence may be quite low. For others, as explained in the limitation section below on estimating the chance of producing a report a funder updates on, even if there is some chance they update their behavior it may be really uncertain how likely they are to update, and you may need to make a guess at how likely it is.
There may be transition costs to a funder switching their behavior
In order for a donor to update their behavior, they may need to pay significant transition costs. For this model, the ideal transition would be changing their behavior by routing their funds from the bank account of one group to another. However, in many instances the transition may not be that seamless.
There may be costs associated with winding down an existing funding program, such as exit grants or changing staff. There could also be costs associated with scaling up a new funding program, such as seeking out a new implementer, changing staff, setting up contracts and/or procurement mechanisms, and potentially needing to help set up an implementation program from scratch.
In assigning a non-zero positive finite number of counterfactual years of credit, our model is assuming these costs would have been paid at some point but there may be greater costs associated with updating sooner rather than later. Depending on the size of these costs, whether they occurred sooner or later, it could not be worth it for a donor to update their behavior and it could substantially reduce the cost-effectiveness of research to update their behavior.
Alternate uses of money
This methodology does not take into account alternate plans for money and assumes money will be spent in the present. So this doesn’t account for the potential value of, say, investing the money as an alternative to donating.
Additionally, over time, the number and kind of available opportunities to donate will change, so the above approach doesn’t represent an all-things-considered view of how donors should consider the value of research. One reasonable action a donor can take is to consider whether to donate at all based on comparing current opportunities to the expected effectiveness of future giving opportunities. This model does not account for that.
Interaction effects between actors
This assumes that individual actors don’t have interaction effects with each other. That is, what one donor does isn’t altered by what another donor does. This assumption is false. One consequence may be that it’s more important than this model suggests to influence the behavior of donors that are relatively inefficient compared to their peers in an area but even that assumes donors or groups don’t enter or leave areas based on what is happening in other spaces, which is also likely false.
The limited number of opportunities to influence donors with research
The amount of topics where additional research (particularly desk research) can inform and influence the behavior of donors or groups is limited. The marginal effects of this kind of research may be steadily declining as the most promising places to revise behavior are addressed first. However, even if this is generally true, different donors and groups may be at various stages with regard to any given topic. Additionally, particularly in areas where little is known, fundamental research may, at times, significantly alter the approach of donors to a space, resetting a large fraction of a given portfolio.
Given the heterogeneity of topics and relevant actors it is difficult to generalize how research will impact all relevant actors over time and when and how much the returns to research will decline.
Not all research is designed to assess the overall cost-effectiveness of interventions
Only some portion of all research RP has done is a direct estimate of the cost-effectiveness of an existing or potential intervention. Other types of research include assessing some portion of an intervention (i.e. how neglected is fungal disease?) or addressing a meta or foundational question (i.e. what discount rate should be used?). While those research projects have value, they can not be as easily assessed by this type of model. If one thought the combined value of all of that work was zero, you could effectively recreate the value estimate of all of RP’s work by increasing the cost of projects to account for all research projects RP does, not just the portion that is focused on assessing intervention cost-effectiveness.
However, if one thought the meta-questions had a chance to shift some portion of the overall giving of a funder you could compare the cost-effectiveness before and after all relevant giving using the same type of current and target intervention approach. Similarly, if you thought some partial intervention investigations (i.e. what is the burden of X disease?) had some chance to influence spending (though perhaps to do so would need to go through another round of research) you could effectively model this by decreasing the chance that you produce work that requires updating.
Accurately estimating values for some inputs
There’s a general concern that much of the work here is guesswork, with many variables without reliable empirical evidence allowing for many possible outputs of the model. This is one reason the Python Monte Carlo simulation version of this model is preferable, while it can be valuable to play around with the inputs in the deterministic model and the Python model to see how changes in assumptions alter the outputs.
Several of these inputs could be called out for closer scrutiny, but two particularly important but difficult to estimate inputs are how many years of counterfactual credit to take credit for, and what is the chance of a potential donor actually updating their behavior after work is produced.
Years of Counterfactual Credit
It’s extremely difficult to accurately estimate something like the counterfactual number of years of credit to take for a project. Even verbal attestation about what would have happened had it not been for the research directly from a donor or group should not necessarily be taken literally. However, the impact effects of doubling the number of years of counterfactual credit is a straightforward doubling of the estimated cost-effectiveness.
It’s also possible that even within the same donor, there may be high variance across types of projects. That is, it’s possible that the same donor may have been be inclined towards completing most projects within ~1-2 years, but certain projects may have never come up at all (this also cuts against any given research group working with a funder, since it’s always possible someone else would have come up with some insight you had not). Given this, it’s possible the “true” counterfactual years of credit across and within donors is log-normally distributed such that many projects would have happened on a given brief timeline, but some projects may not happen within 10-20 years.
Chance of producing a report a funder updates on
Each step of estimating this value has significant uncertainty. Assuming you are not presently working with a donor, it can be difficult to forecast how likely you are to get a project to work with. Even after agreeing to work on a project, it can be really difficult to forecast both the probability that the research will produce meaningful conclusions and that a donor will actually heed any advice given to them.
The chances of finding an intervention more cost-effective than the present intervention likely decline as cost-effectiveness increases
For illustrative purposes, this exercise treats the chance of finding a cost-effective intervention to recommend to a donor as independent of the current cost-effectiveness of the interventions being pursued. In practice, the odds of finding better and better things would be great in theory but likely decline in practice as the baseline cost-effectiveness of interventions being done improves. Basically, the current intervention's cost-effectiveness, and your chance of finding a better target intervention are correlated.
Accounting for meta-ethical and decision-theoretic uncertainty
This model currently works exclusively within a risk-neutral expected value consequentialist framework. That is, there may be many plausible theories of value and of how to deal with risk but the model only currently attempts to answer a question of the value of research intervention within the traditional expected value framework. Accounting for these considerations could significantly alter the conclusions. As is, outputs in the (for now) private online tool are given such that you can observe the distribution of the outcomes but working on interventions that are $100 per DALY averted because the underlying intervention is a high probability of achieving an effect around that rate is treated the same as an input that could be $100 per DALY averted because it’s a low probability intervention that if it works achieves an even better cost-effectiveness.
Providing more options for understanding and observing the differences in handling the same inputs given alternative risk aversion approaches within this tool is in progress.
To make further progress on the true value of RP’s research, we will need to:
Further estimate the net effect of RP’s work on broader non-profit and governmental spending, rather than just the actions of the donor we are working with
Estimate the value of potential future interventions,
Estimate the value of more research that isn’t addressing cost effectiveness,
Estimate the expected amount of research projects that will be useful for funders
Estimate the declining value of research projects as one becomes more and more informed about a given space.
Appendix - Formulas
Percentage of Reports Funder Updates On
The Percentage of Reports a Funder Updates On based on RP's research is based on three primary factors:
How likely RP is to find a donor to work with who’s donating the stated amount of money
How likely RP is to produce a report that reaches a conclusion that suggests the donor should update their behavior
How likely the funder is to update given (2).
(1) is a prerequisite to any research project having any value at all. If you are already working with a donor, the odds here can be set to 100%. If you are not already working with a funder, the odds of finding a donor to work with are often heavily contingent on how many donors there are at that size, with donors giving more per year being less likely to be engaged simply because there are many less of them.
The chances of (2) are heavily dependent on the nature of the project, with information and evidence availability playing an important role. The odds of (3) may vary considerably based on the alignment and beliefs of the funder, as well as the clarity of the research report about what actions should be taken.
Annual Money Influenced
To estimate, Annual Money Influenced, which is how much money an RP report is influencing in expectation per year, we estimate how much money is influenceable per year and the annual money being donated by the funder:
In many cases, you may not be able to directly assess the amount of money to be donated before working with a specific funder (and in some cases even after you are working with a funder). These variables are designed to give flexibility in estimating the amount of influenceable money per year depending on what information you possess.[7]
Taking the resulting Influenceable Money Per Year, and given the above Percentage of Reports Funder Updates On, you can multiply with the amount of money influenceable per year in order to estimate the annual money influenced:
This resulting figure, Annual Money Influenced, is an estimate of how much money a report for a given funder is likely to be influencing in expectation.
The cost-effectiveness of current and target interventions
Taking Annual Money Influenced, along with estimates of the cost-effectiveness of the current intervention a funder is supporting, and the cost-effectiveness of the (target) intervention they could be updating to, you can estimate the total amount of good (measured here as DALYs averted) that could be achieved with the amount of money being influenced:
Total Estimated Impact
Taking these figures, we can make an initial estimate of the amount of DALYs averted per year.[8]
As interventions get closer in estimated cost-effectiveness, there is some increasing probability you are wrong about your cost-effectiveness estimates for one or both interventions in such a way that you are actually causing the opposite effect as you believe. When using distributions for inputs, as the Monte Carlo model does, this can be accounted for by using overlapping distributions, which naturally will allow for some samples where the target intervention is actually less cost-effective than the current intervention. When using static inputs, as the spreadsheet version of this model does, this can be captured by a variable that explicitly assigns a chance that you are directionally incorrect, Directionally Correct Percentage. The odds of this being lower than ~100% may be very small if the current intervention and the target intervention are estimated to be very far apart in cost-effectiveness.
Taking these figures, we can estimate the DALYs averted per year:
Given this figure,[9] you then need to take account of how many years of counterfactual credit each project gets. That is, were this project not completed when it was, how long would it have been before the funder updated through other means (e.g. commissioned research from another group). Depending on the funder, this could be a very brief time (less than half a year) or very long (five years or more).
RP Per Project Cost
Estimating RP Per Project Cost is a matter of estimating all-in annual costs per staff on a project, how many people in full-time equivalent (FTE) work on a project, and the project duration in years.
If you are already working with the donor, FTE years to find the donor can be set to 0 (along with Chance of finding donor being set to 100%).
Per project cost can then be estimated as:
Outcome Metrics
Taking all of the above you can produce outcome metrics estimating impact:
RP Cost Per DALY captures the efficiency of a given project, how much does it cost for RP to generate one DALY averted. Standardizing this to be in DALYs averted per $1000 can be helpful when making comparisons:
Finally, it is useful to think not of pure efficiency as RP Cost Per DALY and RP DALYs Averted per $1000 do but, given projects differ in duration and the number of staff that could be assigned to an area differ, to account for the amount of work that could be accomplished in one year:
Total DALYs Averted from Possible Projects Per Year may be a preferable metric to consider because there are various reasons why the number of projects with a funder may be limited, or you may not want to dedicate all of your staff to working on a given project.
Appendix - Value of Information
The value of information (VOI) of finding more cost-effective interventions can be calculated given a certain baseline cost-effectiveness and a certain amount of spending. This can be estimated from the gap between what the current intervention buys in DALYs, and what the target intervention buys. For spending the money to gather that information to be worth it, the cost to find that better intervention should not exceed the value gained by simply buying more DALYs at the current cost.
Depending on how you are assessing the value of RP’s work, you can take the relevant amount of money as originating from different amounts of money. That is, the baseline amount of money used to judge how many DALYs could be bought could be based on:
The amount of money influenced in expectation, that is the amount of money moved in expectation given a research project happens (which is influenced by how likely a given actor updates on a report).
The amount of money that could be altered by a given project, whether or not in practice that amount of money is altered.
Both of these are applied in the linked spreadsheets in columns AM and AN. Naturally, (1) is always smaller than or equal to (2). See Chapter 9 of MacAskill, Bykvist, and Ord 2020 for examples of why value of information in a research context may be valuable.
Acknowledgments
This post is a project of Rethink Priorities, a global priority think-and-do tank, that:
Researches and implements pressing opportunities to make the world better.
Acts upon opportunities by developing and implementing strategies, projects, and solutions to key issues.
Does this work in close partnership with foundations and impact-focused non-profits or other entities.
This draft was written by Marcus A. Davis and then polished and published by Kieran Greig. Thanks to Chase Carter, for the framework, Melanie Basnak, Rachel Norman, Tom Hird, Neil Dullaghan, Daniela Waldhorn, David Moss, Aisling Leow, Jacob Peacock, Sagar Shah, and Peter Wildeford for their helpful feedback.
Note throughout this post, “funder” is used to explain who the work is influencing but largely the same arguments and math holds for, say, convincing an animal welfare charity to pursue a slightly more efficient intervention as applies to convincing a funder to switch between two different charities doing the two different interventions.
Note we use DALYs here but are not committed to this being the best way of measuring welfare, goodness, or badness. Indeed, DALYs have various limitations. To some extent they are useful here as a shorthand, and because they are commonly used within Global Health and Development cost-effectiveness estimates.
This includes the total costs of RP employing including benefits and any further costs, not just salary. Also, while a marginal project could often be bought at this rate, if one commissioned a large enough number of projects, policies such as parental leave and further paid time could drive costs up (it depends on whether they are already included in marginal project cost modeling).
As interventions get closer in estimated cost-effectiveness, there is some increasing probability you are wrong about your cost-effectiveness estimates for one or both interventions in such a way that you are actually causing the opposite effect as you believe. When using distributions for inputs, as the Monte Carlo model does, this can be accounted for by using overlapping distributions, which naturally will allow for some samples where the target intervention is actually less cost-effective than the current intervention. When using static inputs, as the spreadsheet version of this model does, this can be captured by a variable that explicitly assigns a chance that you are directionally incorrect, Directionally Correct Percentage. The odds of this being lower than ~100% may be very small if the current intervention and the target intervention are estimated to be very far apart in cost-effectiveness.
Note that here and elsewhere we also assume zero additional time maintaining the relationship with the funder (like time spent writing grant reports, renewal requests, and meeting with the funder), or that these are items are incorporated into the overall project costs already.
For pragmatic reasons we use DALYs here too. We aren’t meaning to imply through their use that animal welfare interventions are necessarily more cost effective than global health and development interventions. More so just as that this way we don’t change terminology much between examples mentioned in this post, or need to change it within the relevant tools and spreadsheets. A further reason is that using these units also helps avoid getting bogged down with welfare ranges/interspecies comparisons in the model/explanation.
For instance, sometimes you may know the total amount of money a funder is spending, but not exactly how much is going into the area a report may put up for reconsideration. In that case, you could directly use your known figure for Annual Money to be Spent while estimating Percentage of Money Influenceable as something less than 100%. Other times, you may know the precise amount of money a funder is spending in a given area. In that case, you could set the Percentage of Money Influenceable to 100% for research in that area, and use the figure you know for the Annual Money to be Spent.
Note that the Monte Carlo version will use what is here labeled as Initial Annual DALYs Averted, and the chance of being directionally wrong will be built into the distributions selected for Current Annual DALYs Averted and Target Annual DALYs Averted.
This is a crosspost from the new Animal Welfare Alignment Newsletter by Anima International. You can subscribe on Substack if you are interested in following these efforts. Audio reading also available on Substack.
The goals of this post are to:
1. Raise a question I see as crucially important to the goal of aligning AI to animal welfare...
Hello! I'm Justin Portela. I got hired by GWWC to make YouTube videos after AI in Context did such a kickass job.
My channel is using that same cinematic, high-production value beauty to talk about everything in the EA universe that isn't AI.
...
This is a linkpost for Request for Proposals: Research and Applied Work on Digital Minds.
I'm glad to announce a request for proposals for research and applied work on digital minds at Longview Ph...


That's really exciting! Do you plan on open-sourcing the project?
Maybe. We're a little unsure about this right now. The code base for this is part of the bigger Cross-Cause Cost-Effectiveness Model which we haven't made a final determination on whether we will release it.
Do you mind sharing your main consideration against releasing it? Not trying to push back, but rather to understand this as I'm considering working on related topics