I absolutely love this @Thomas Kwa. Something along these lines of thinking has been a deep part of my Christian tradition, from the parable of the widow's mite
"Just then he looked up and saw the rich people dropping offerings in the collection plate. Then he saw a poor widow put in two pennies. He said, “The plain truth is that this widow has given by far the largest offering today. All these others made offerings that they’ll never miss; she gave extravagantly what she couldn’t afford—she gave her all!”
Obviously this is a bit more "deontological" and "heart focused" reasoning but agrees in practise with your comment "one should obviously give up more utility if beneficiaries gain more per unit you sacrifice"
I used to argue that someone who earns 100k and gives 10% has in a non-utilitarian sense might have given "more" than someone who earns $200,000 and gives half away. But I think I almost like your "sliding scale" more as there's some nuance there.
Your table is very similar to the one Peter Singer presents close to the end of The Life You Can Save. I do like the mathematically clarity of your approach, and we now have an intuitive explanation for where the numbers come from - very nice!
Honestly, now that I write this it seems strange that there is no Pledge that matches this way of thinking? Your suggestion could be a nice complement to the existing 10% and Further Pledge and it now seems a little strange that I have not heard about people actively donating according to Singer's table. Maybe it is just a lot harder to explain than the other pledges, and this kind of defeats the point of a public pledge?
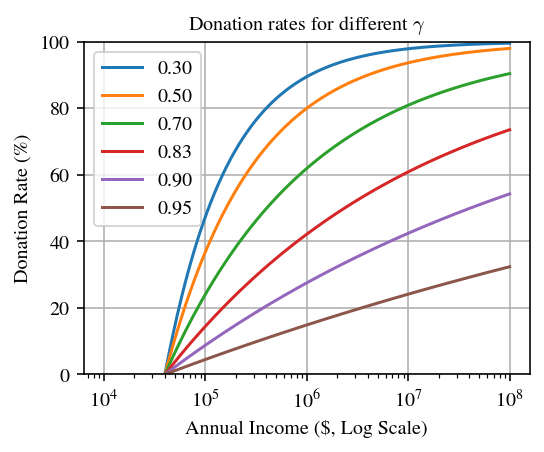
In case someone else wonders what the donation rate would look like for other choices of γ:
I think a pledge which puts the bar for zero donations at the US-median income [edit: oops, I got that wrong and it is not the median income value. I still think that my point is directionally right] is a little strange – even in the US, many pledgers would never reach non-zero pledged donations and this seems off for a pledge that has income-sensitivity as a central property. Intuitively, a softer rule like "in any case, aim for 1% donations unless you really need all income" or a different reference for the zero-donations bar would be more wholesome.
The appendix of the ebook (pdf, p. 218 & 221) suggests structuring it like tax brackets, giving (as a percentage of adjusted gross income):
1% of the first $81,000, 5% of the next $59,000, 10% of the next $180,000, 15% of the next $160,000, 20% of the next $1,520,000, 25% of the next $9,000,000, 33.3% of the next $42,000,000, and 50% of the remainder
Thanks! I somehow managed to miss their pledge when looking at their website.
It does seem to be somewhat different from e.g. the 10% pledge: At least according to the current formulation, it is not a public or lifetime pledge but rather a one-year commitment:
This coming year, I pledge to give [percentage field] of my income to organizations effectively helping people in extreme poverty.
As an approach, this sounds very reasonable for TLYCS. I imagine that a lifetime pledge that adjusts to one's income level is something that is harder to emotionally resonate with and might feel like too-large a commitment for many.
And recommitting to the pledge yearly might make it easy for people to adjust their giving to their current income without needing to think about the maths.
Thanks Thomas. I largely agree with your suggestion. I wrote a paper on the topic, with a few additional ideas that might interest you and others here. https://www.tandfonline.com/doi/full/10.1080/16544951.2023.2246257 Besides income, I think it's worth considering a few other relevant factors, including net wealth.
This was pretty much the first thing I thought of when I heard about the 10% pledge, and I was actually surprised to see so little of this reasoning here. It’s fairly obvious that for someone on a low income, 10% is still a huge sacrifice, whereas for the wealthy, giving away 10% doesn't change much. Even though they give much more in absolute terms, they’re still left with far more money than they actually need.
This is especially important from the perspective of the rich: with 'only' a 10% commitment, a lot of potential generosity goes to waste - money that could make a massive difference. But it would also help those on lower incomes, allowing them to join the pledge without it being financially draining. That said, I think the percentage should never drop to zero; psychologically, it would imply that low earners can't or shouldn't contribute. Not only is that untrue, but it would also feel very 'exclusionary' for many.
Finally, I’d say the calculation should be adjusted for the cost of living and local salaries. For instance, $39k might not be much in the US, but in many other countries - and not necessarily poor ones, like where I live - it’s actually a good salary.
I mostly view the 10% pledge as a social commitment device rather than a sensible rule for how much to donate.
strikes me as missing the fact that small donors can spend much more cognition evaluating per unit dollar and are less heavily optimized against, so there are many high EV opportunities which can ~only be picked up by small-scale donors. Especially within-network donations to support projects that are too early stage or speculative to pass grantmaker bars.
Really enjoyed this post thanks. I agree that "the 10% pledge as a social commitment device rather than a sensible rule for how much to donate". It's memorable and simple which is part of its effectiveness, but I like the analysis into the logic and maths of giving which will appeal to whose brain operates that way.
In 2023, the top 20 donors to GiveWell gave more than the other 31,890 donors combined. These donors gave at least $1 million each with a mean of $5.87 million.
With stats like these, I mostly view the 10% pledge as a social commitment device rather than a sensible rule for how much to donate. One can think of the 10% pledge as requiring people to give up a constant amount of personal utility under logarithmic utility of consumption. But this doesn't make sense; one should obviously give up more utility if beneficiaries gain more per unit you sacrifice. [1][2]
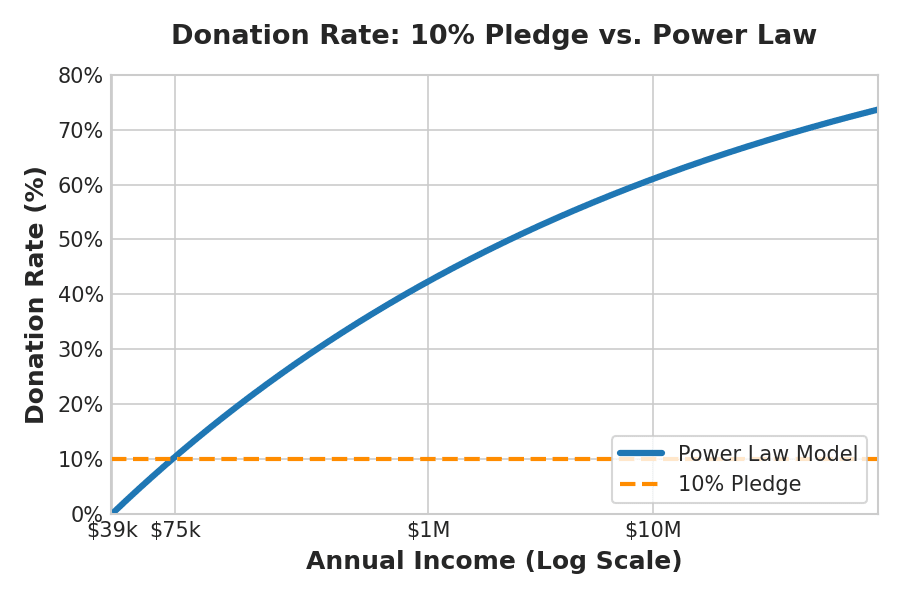
Is there something better that captures the extreme variance in salary these days, eg with junior AI engineers earning >$1M/year? I propose a progressive schedule; specifically a power law where someone with income Y should donate everything except a consumption budget C=X⋅(Y/X)γ. Then the donation rate is calculated as 1−(X/Y)(1−γ).
With parameters somewhat arbitrarily set such that the median American household (income $75K) donates 10% and someone with $10M income donates 60%, we get X≈$39.3k and γ ≈ 0.83, meaning that every 1% increase in income allows you a 0.83% increase in consumption. We get the following table, which seems pretty reasonable:[3] [edit: commenters suggest a minimum donation of ~1% at all income levels to keep the spirit]
Income
Donation Rate
Donation $
Consumption $
≤$39.3K
0-1%
$0-$393
≤$39.3k
$50K
3.7%
$1,872
$48,128
$75K
10.0%
$7,500
$67,500
$100K
14.2%
$14,190
$85,810
$150K
19.8%
$29,651
$120,349
$200K
23.5%
$47,006
$152,994
$500K
34.3%
$171,406
$328,594
$1M
41.4%
$414,135
$585,865
$5M
55.1%
$2.76M
$2.24M
$10M
60.0%
$6M
$4M
$100M
72.7%
$72.7M
$27.3M
The difference between $10-100M earners donating 10% vs 60-70% is immense. If the 2023 numbers were from high earners donating 10%, this tiny group going up to 65% would 3.75x total donations; if they were at 65% already, going down to 10% would basically halve GiveWell's revenue.
There's another interpretation of this power law. In economics, different goods have different income elasticities of expenditure, with necessities having γ ≈ 0, "normal" goods γ < 1 and "luxury" goods γ > 1. We can interpret the policy of γ = 0.83 for aggregate consumption as asking people to forego none of their necessities, some near-luxury γ ≈ 0.83 goods, and a large proportion of luxury γ > 1 goods as their income increases. For some concrete examples, I had Claude generate this table from the empirical literature:
Category
Elasticity
Range
Source
Housing (renters)
0.2–0.4
0.19–0.5
RAND/HUD, NBER
Food at home (groceries)
0.3–0.4
0.2–0.5
Various US studies
Tobacco
0.4
0.3–0.5
Wikipedia
Housing (owners)
0.5–0.7
0.36–0.87
Mayo review, Harmon 1988
Food away from home
0.7–0.9
0.5–1.1
USDA ERS
Clothing & footwear
0.8–1.0
0.7–1.1
USDA ERS cross-country; US footwear study
Gasoline
0.8–1.0
0.66–1.26
Wikipedia summary of studies
Transportation
0.95–1.0
0.8–1.1
USDA ERS high-income
Education
1.0–1.1
0.9–1.2
USDA ERS
Healthcare/Medical
1.2–1.4
1.0–1.6
USDA ERS (US = 1.21)
Recreation/Entertainment
1.4–1.5
1.2–1.8
USDA ERS high-income
Air travel/Tourism
1.2–2.1
0.6–2.5
Meta-analyses
Interpretation
The rough correspondence suggests γ = 0.83 is asking for sacrifice at the "nice-to-have, not need-to-have" margin, which seems ethically defensible.
The other extreme would be everyone donating all their income down to a flat rate, equal to the consensus selfish:altruistic utility ratio. One of many issues is that this removes all selfish incentive to earn more.
This post is co-authored with Ben Garfinkel. It is cross-posted from the CEA blog. A PDF version can be found here.
Summary: Some strategic decisions available to the effective altruism m...
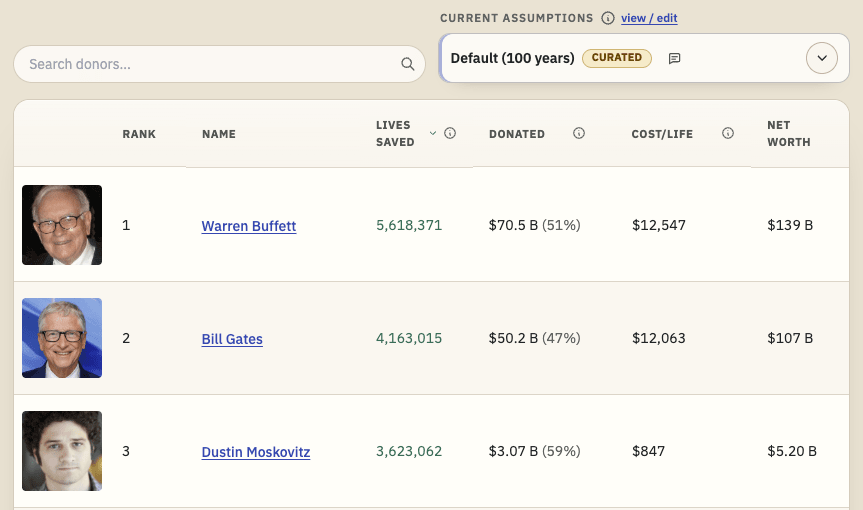
TL;DR: I'm releasing a website that ranks philanthropists according to EA principles and research, and allows users to re-rank the list using their own assumptions. I'd like feedback and help making it better. I'd especially like ideas for how to make the results more trustworthy. Funding may be available.
Crossposted to LessWrong.
...
Disclaimer: Although I work on the Groups Team at CEA, I’m writing this in a personal capacity, and this post does not constitute an endorsement by CEA.
Agency - the realisation that you really can just do things.
TL;DR
Biosecurity needs people (of any background) who are agentic and have a high execution velocity and track record....

I absolutely love this @Thomas Kwa. Something along these lines of thinking has been a deep part of my Christian tradition, from the parable of the widow's mite
"Just then he looked up and saw the rich people dropping offerings in the collection plate. Then he saw a poor widow put in two pennies. He said, “The plain truth is that this widow has given by far the largest offering today. All these others made offerings that they’ll never miss; she gave extravagantly what she couldn’t afford—she gave her all!”
Obviously this is a bit more "deontological" and "heart focused" reasoning but agrees in practise with your comment "one should obviously give up more utility if beneficiaries gain more per unit you sacrifice"
I used to argue that someone who earns 100k and gives 10% has in a non-utilitarian sense might have given "more" than someone who earns $200,000 and gives half away. But I think I almost like your "sliding scale" more as there's some nuance there.