Comments
Fascinating work; thanks for sharing it. The graphs are clear and helpful, and the regression models seem quite informative. Bravo.
Fascinating work; thanks for sharing it. The graphs are clear and helpful, and the regression models seem quite informative. Bravo.
Like this a lot, especially the plot designs.
Surprised there’s not much in demographic differences even with all the caveats that go with interpreting disparities there. Not sure what to make of that yet but will be chewing on that for a while.
Lastly, got a question. Do you have any sense of what a good baseline for the mental health section might be? The question of “has your mental health increased / decreased/ stayed the same since getting involved with X” is new to me
Thanks Geoffrey!
I think the mental health increase/decrease question (which was an external request) is not best interpreted with reference to the idea of a 'good baseline', since (as you are perhaps suggesting), I don't think it's clear what a good reference class would be for this (e.g. movements vary a lot in their composition and other potentially relevant characteristics).
I think it's better interpreted by comparison to what your expectations would be for the absolute pattern of outcomes within the EA community (e.g. some people seem to believe that EA often has a negative impact on the mental health of those involved), and is also potentially informative in terms of group differences and, in the future, could be informative in terms of changes within the EA community over time.
In this post, we report on a number of questions about people’s satisfaction with the EA community, their likelihood of remaining in EA, and EA’s impact on their mental health. Note that we significantly shortened the EA Survey this year, meaning there are fewer community-related questions than in the previous EA Survey.
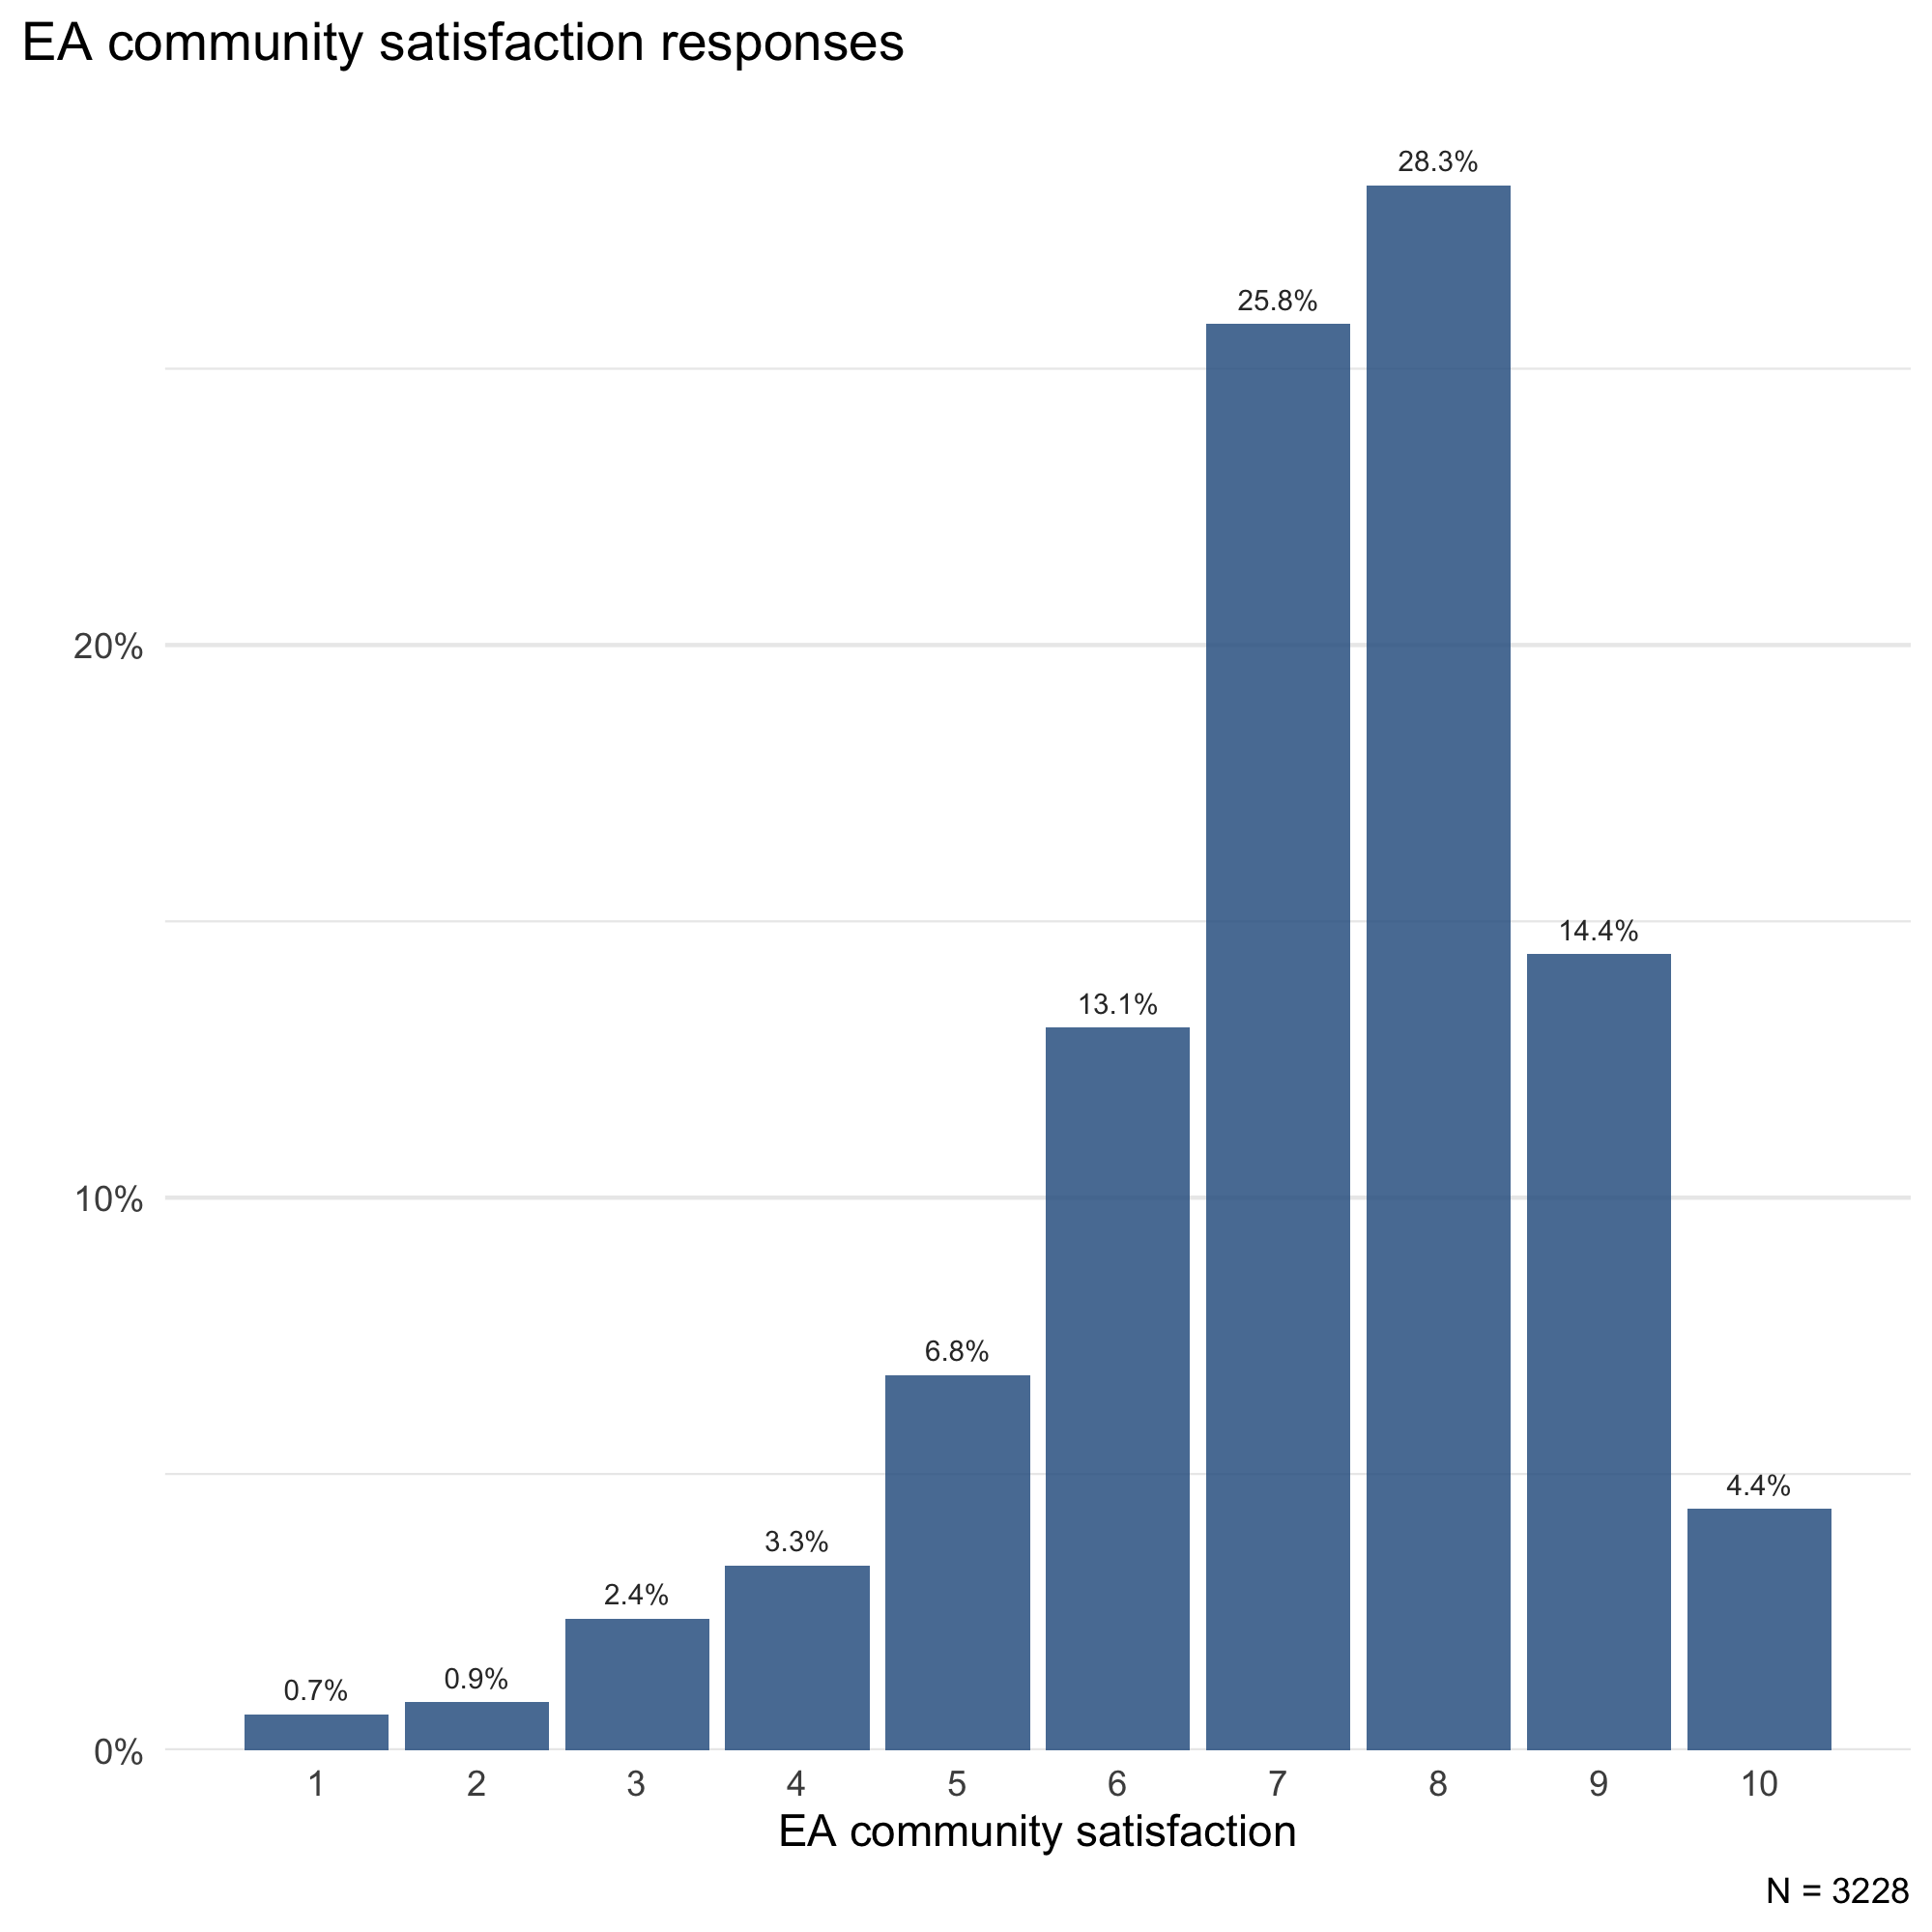
Respondents indicated being generally satisfied with the EA community, scoring an average of 7.16 (SD = 1.66) on a 10-point scale. The median satisfaction response was a 7.
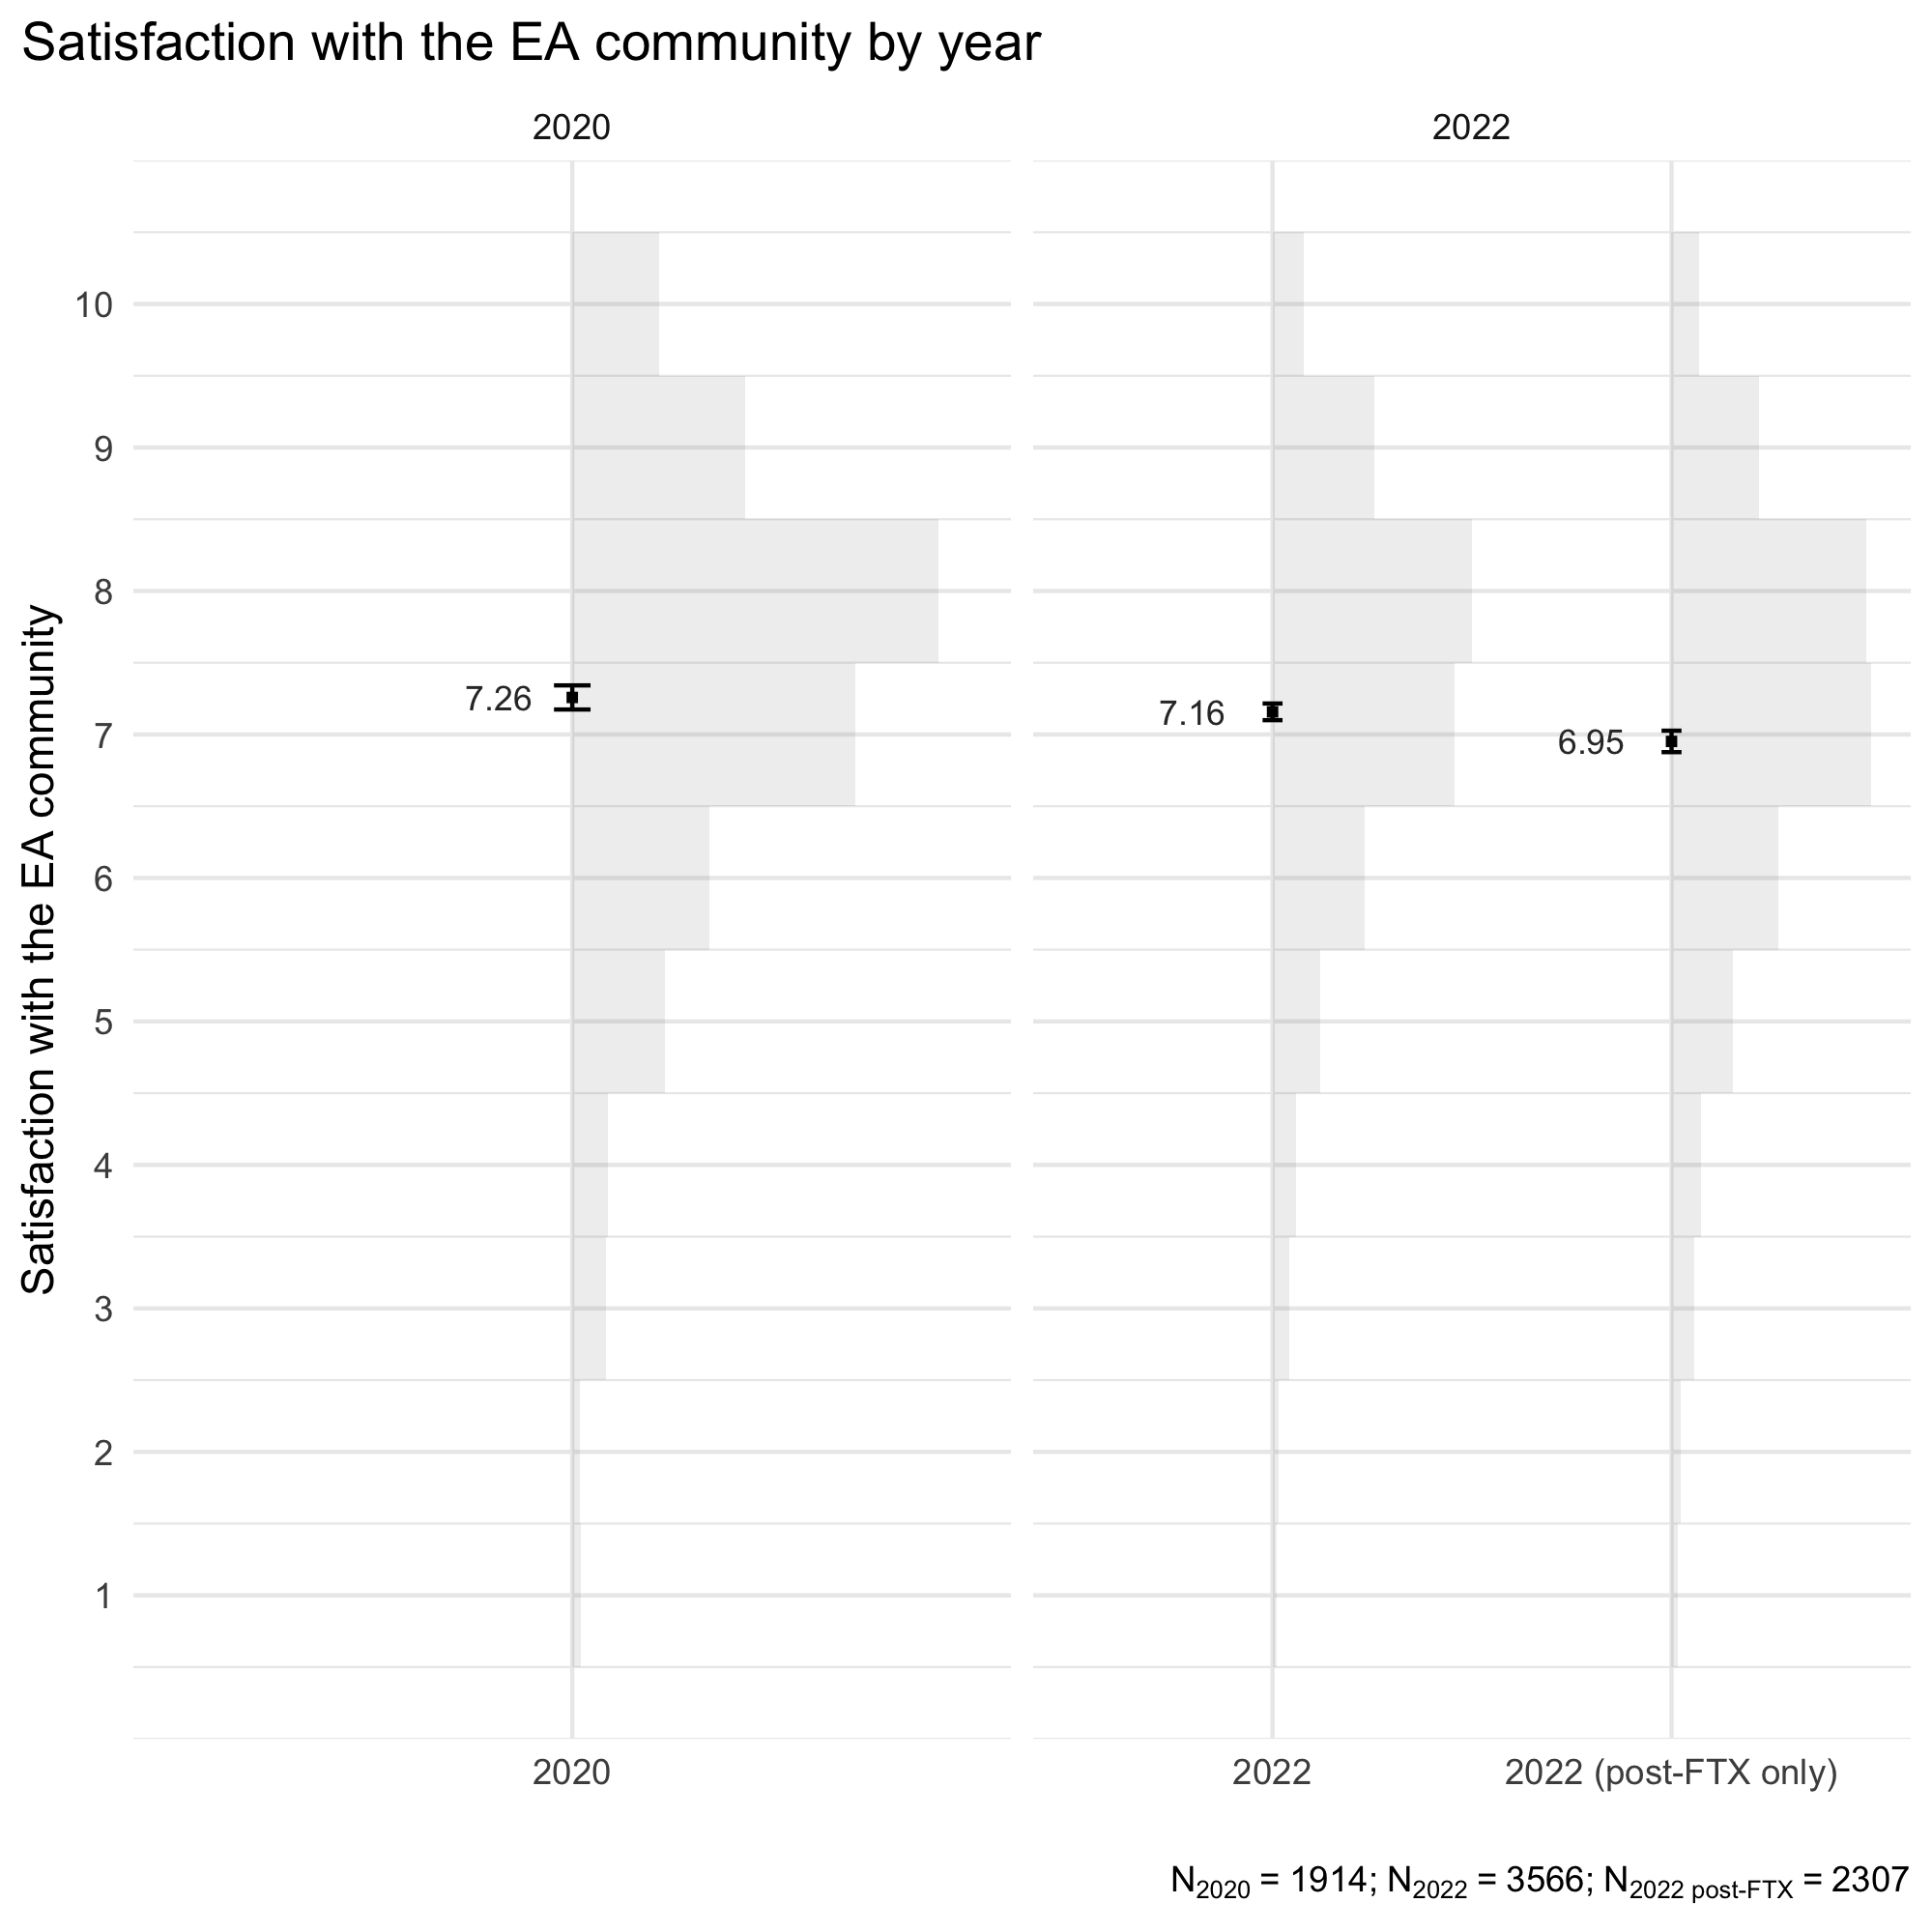
As we noted in our recent post on community responses to the FTX crisis, community satisfaction seems to have declined following the FTX crisis. In 2020, respondents reported an average satisfaction of 7.26 (SD = 1.72). In 2022, the average of all respondents was 7.16 (SD = 1.66) and 6.95 (SD = 1.72) for respondents who completed the survey after the FTX crisis. It’s also possible that much less satisfied respondents disengaged from the EA community and did not take the survey. Had they participated, the average satisfaction post-FTX could be lower than what we report here.
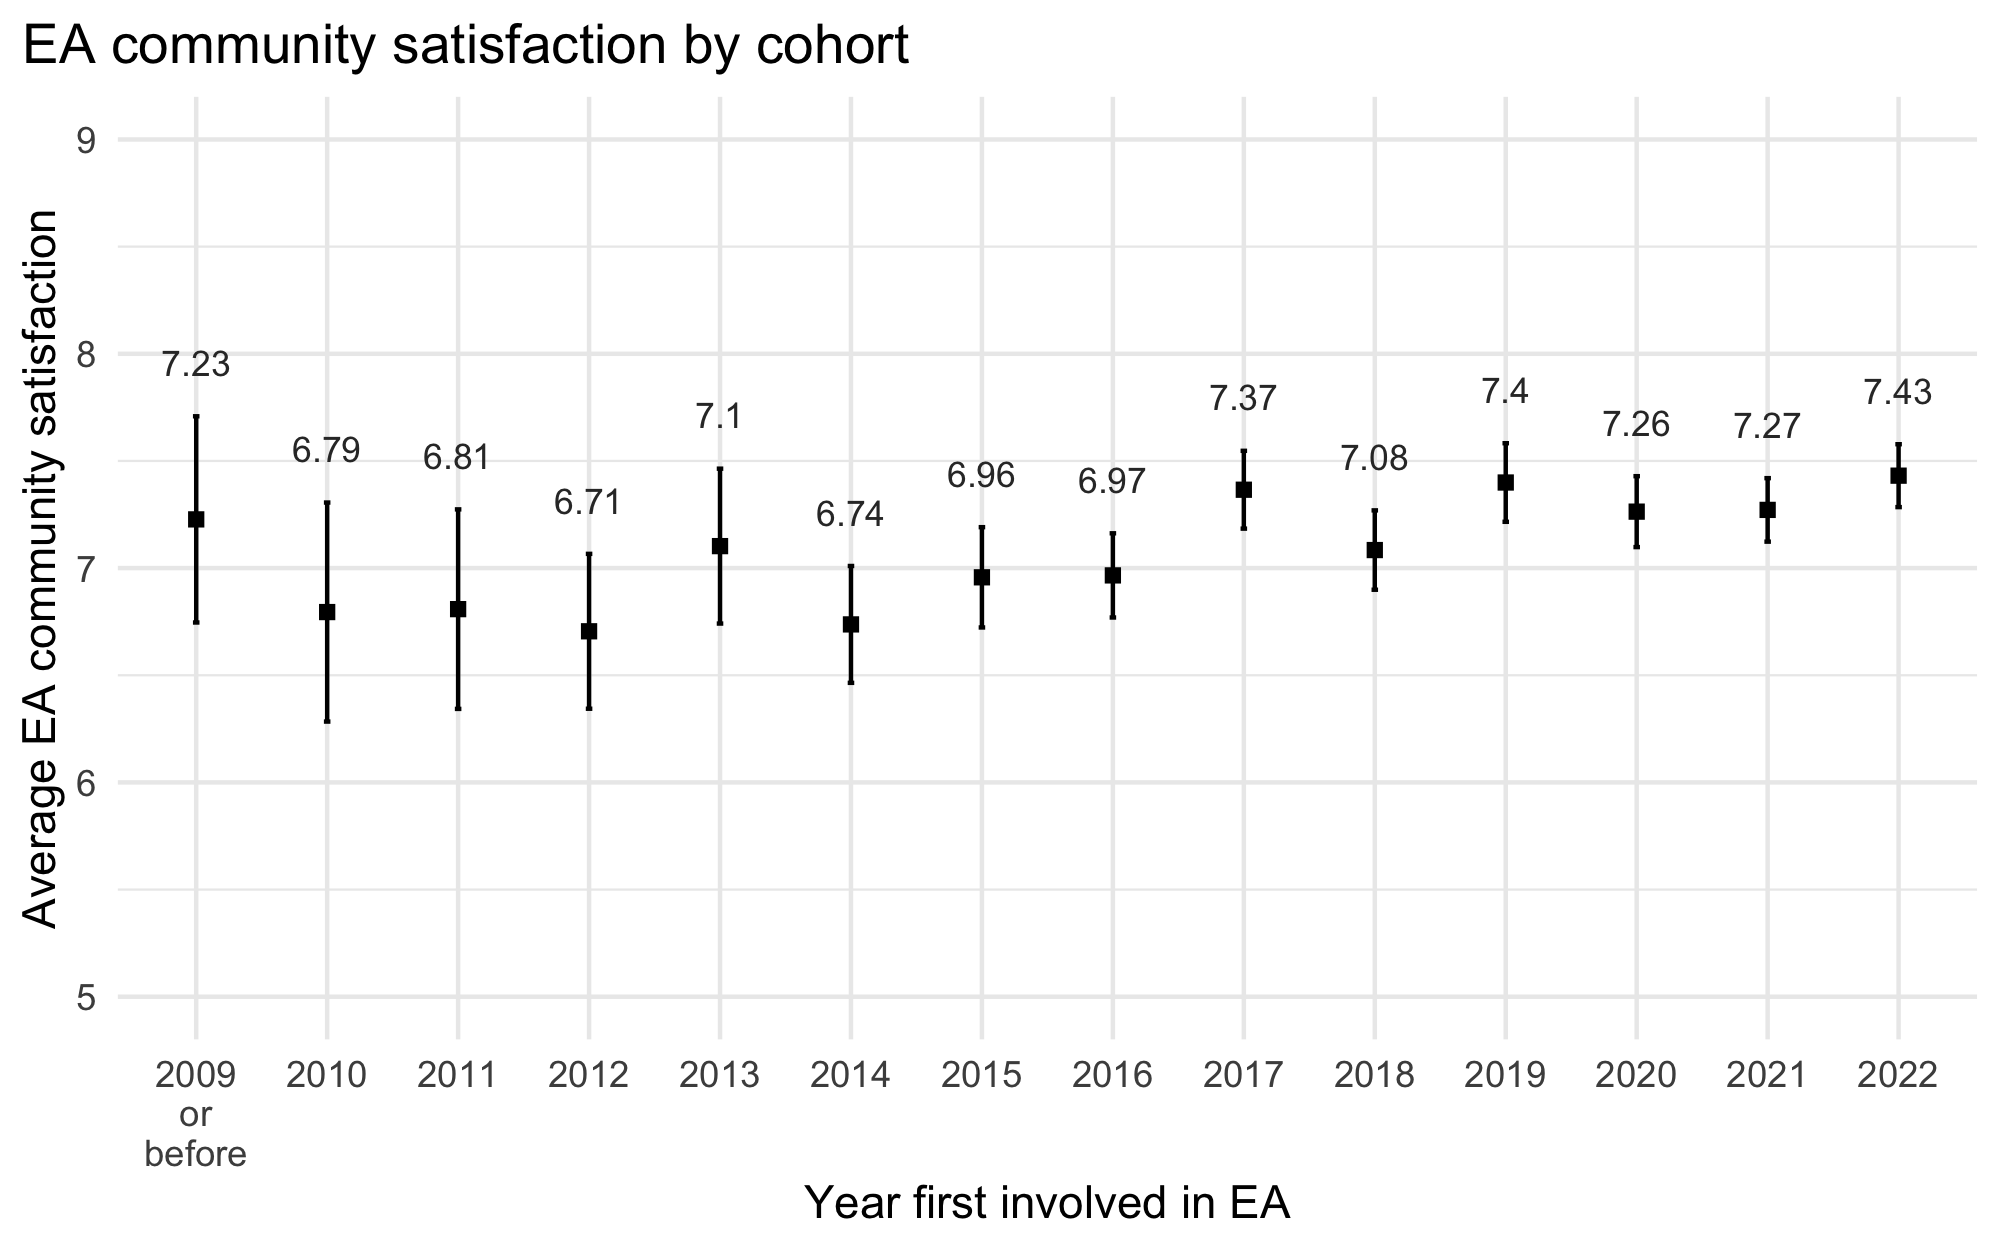
Respondents who recently joined the EA community seem to be more satisfied with the community than earlier cohorts. This pattern is less clear for the earliest cohorts, possibly because the sample size for these groups is relatively small compared to newer cohorts.
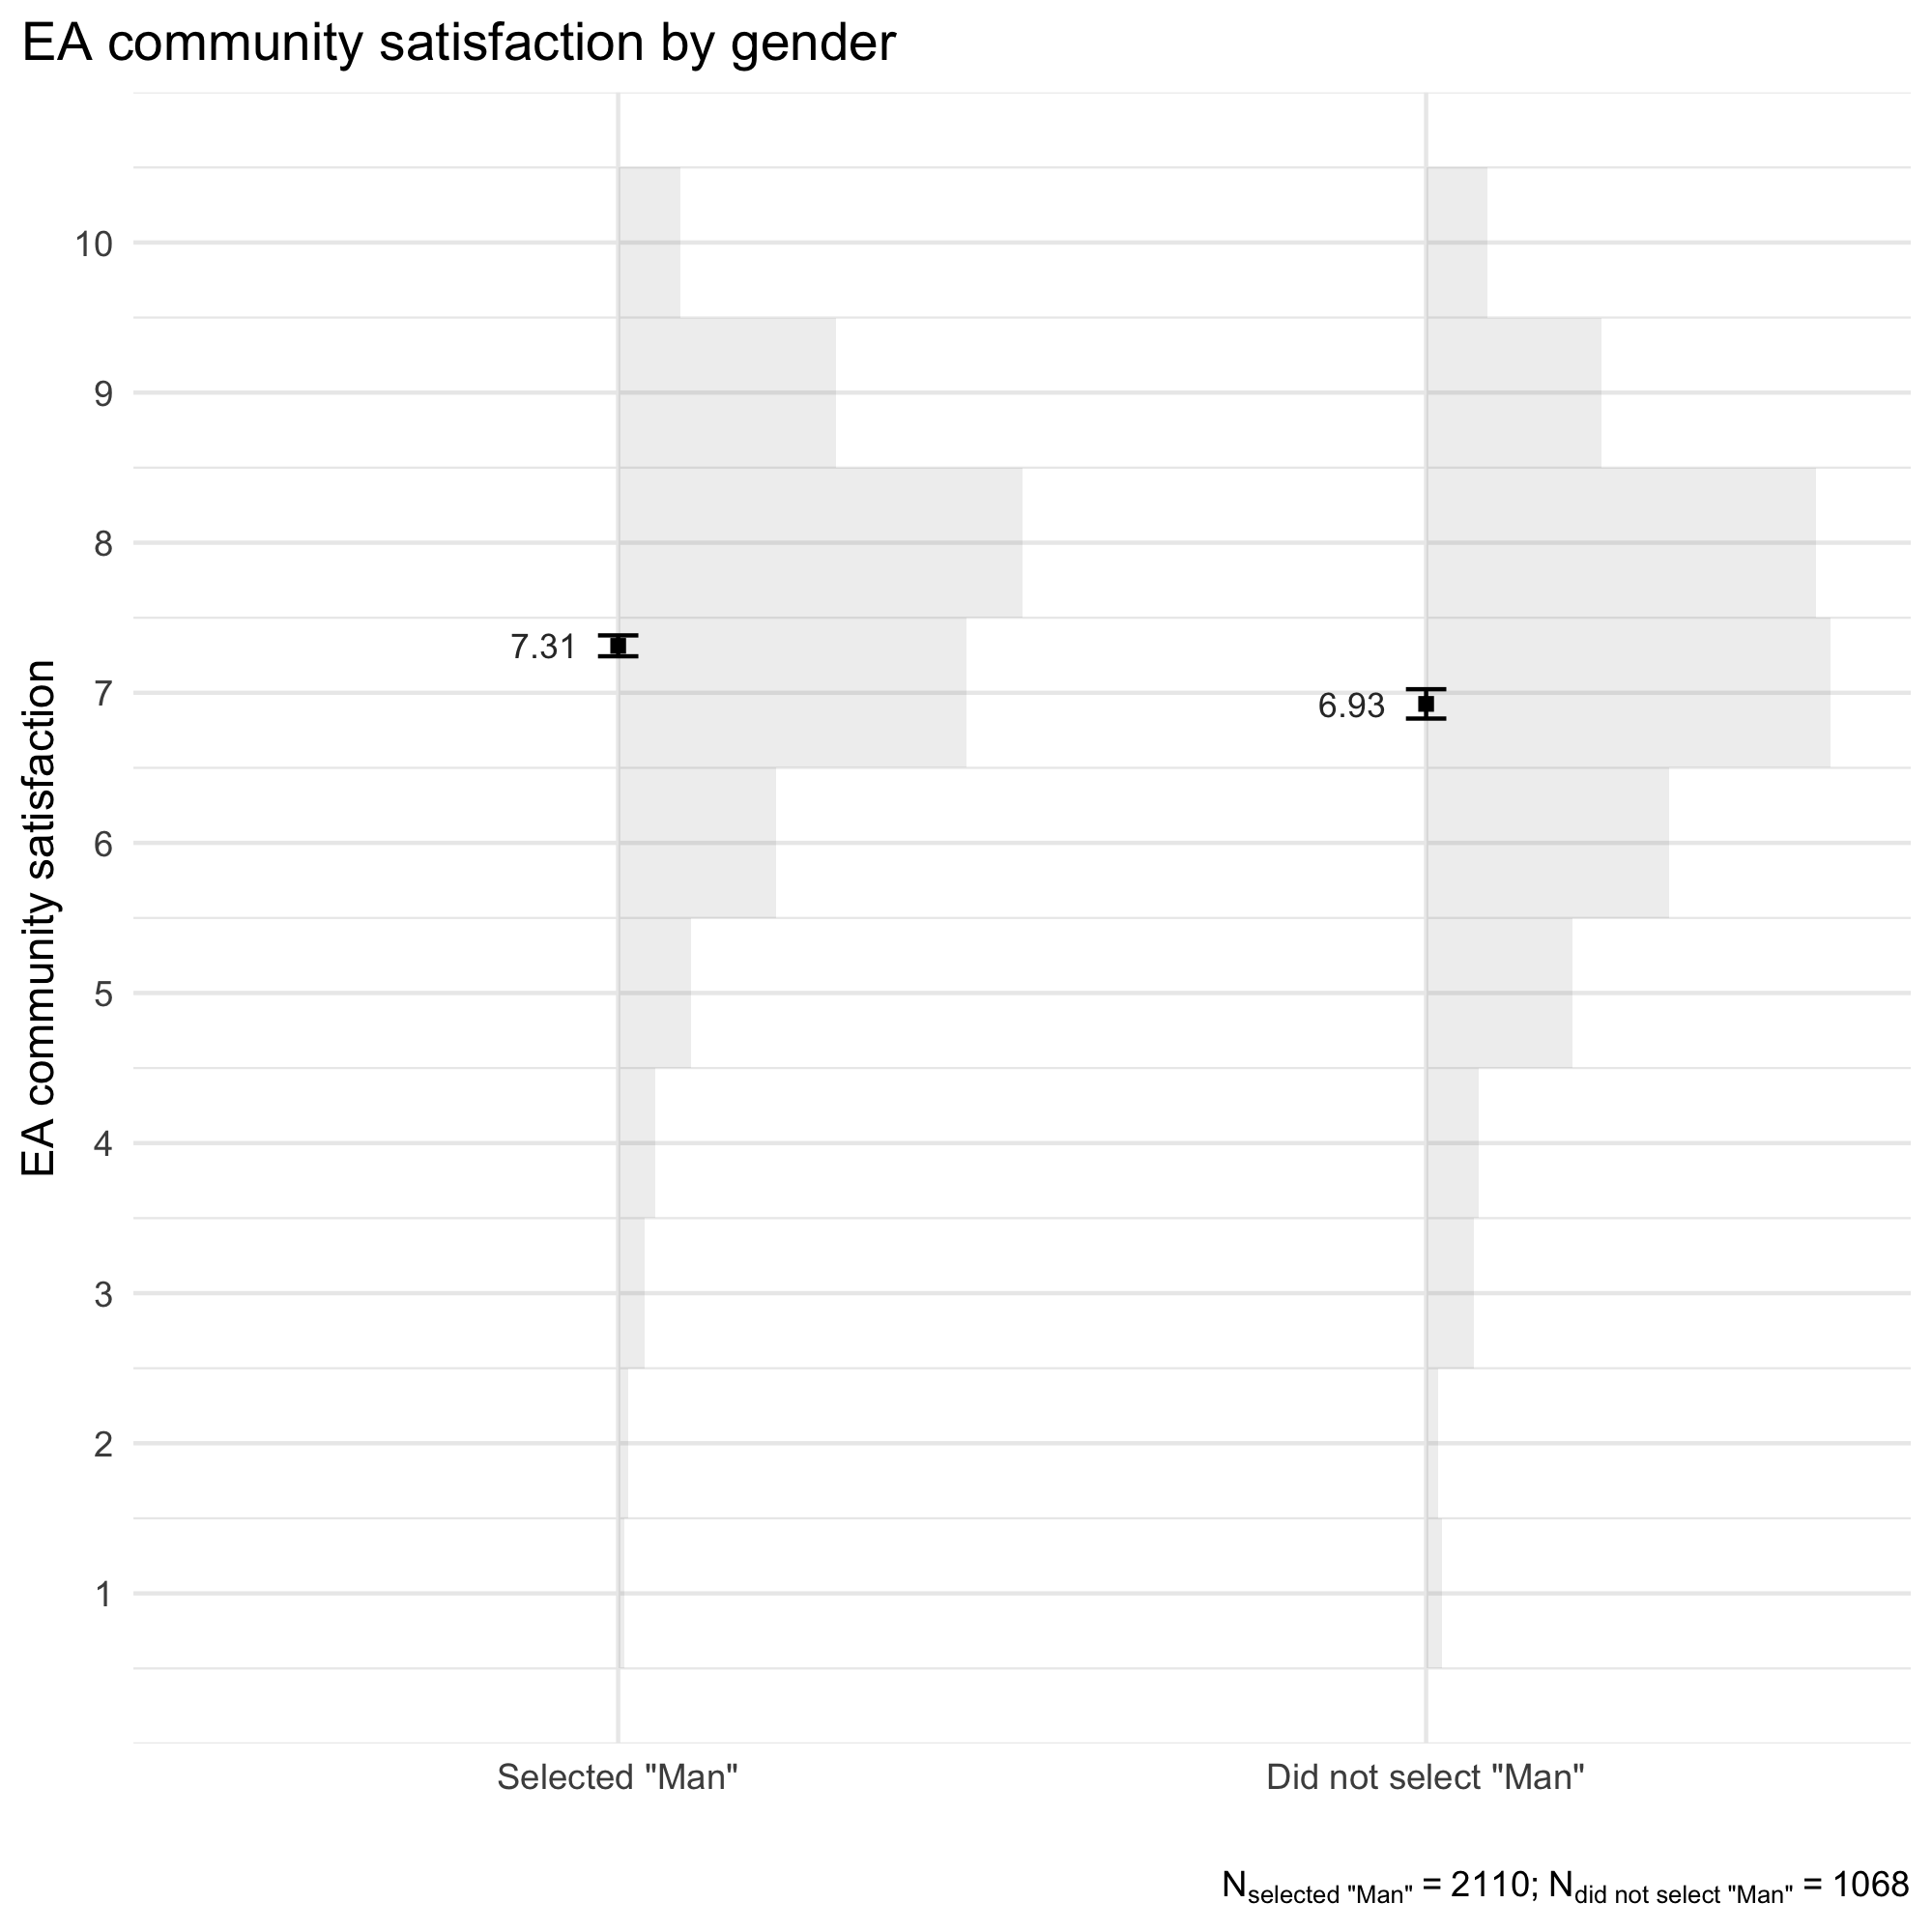
Respondents identifying as a man were, on average, more satisfied with the EA community (M = 7.31, SD = 1.58) than respondents not identifying as a man (M = 6.93, SD = 1.72)–a difference of 0.38[1].
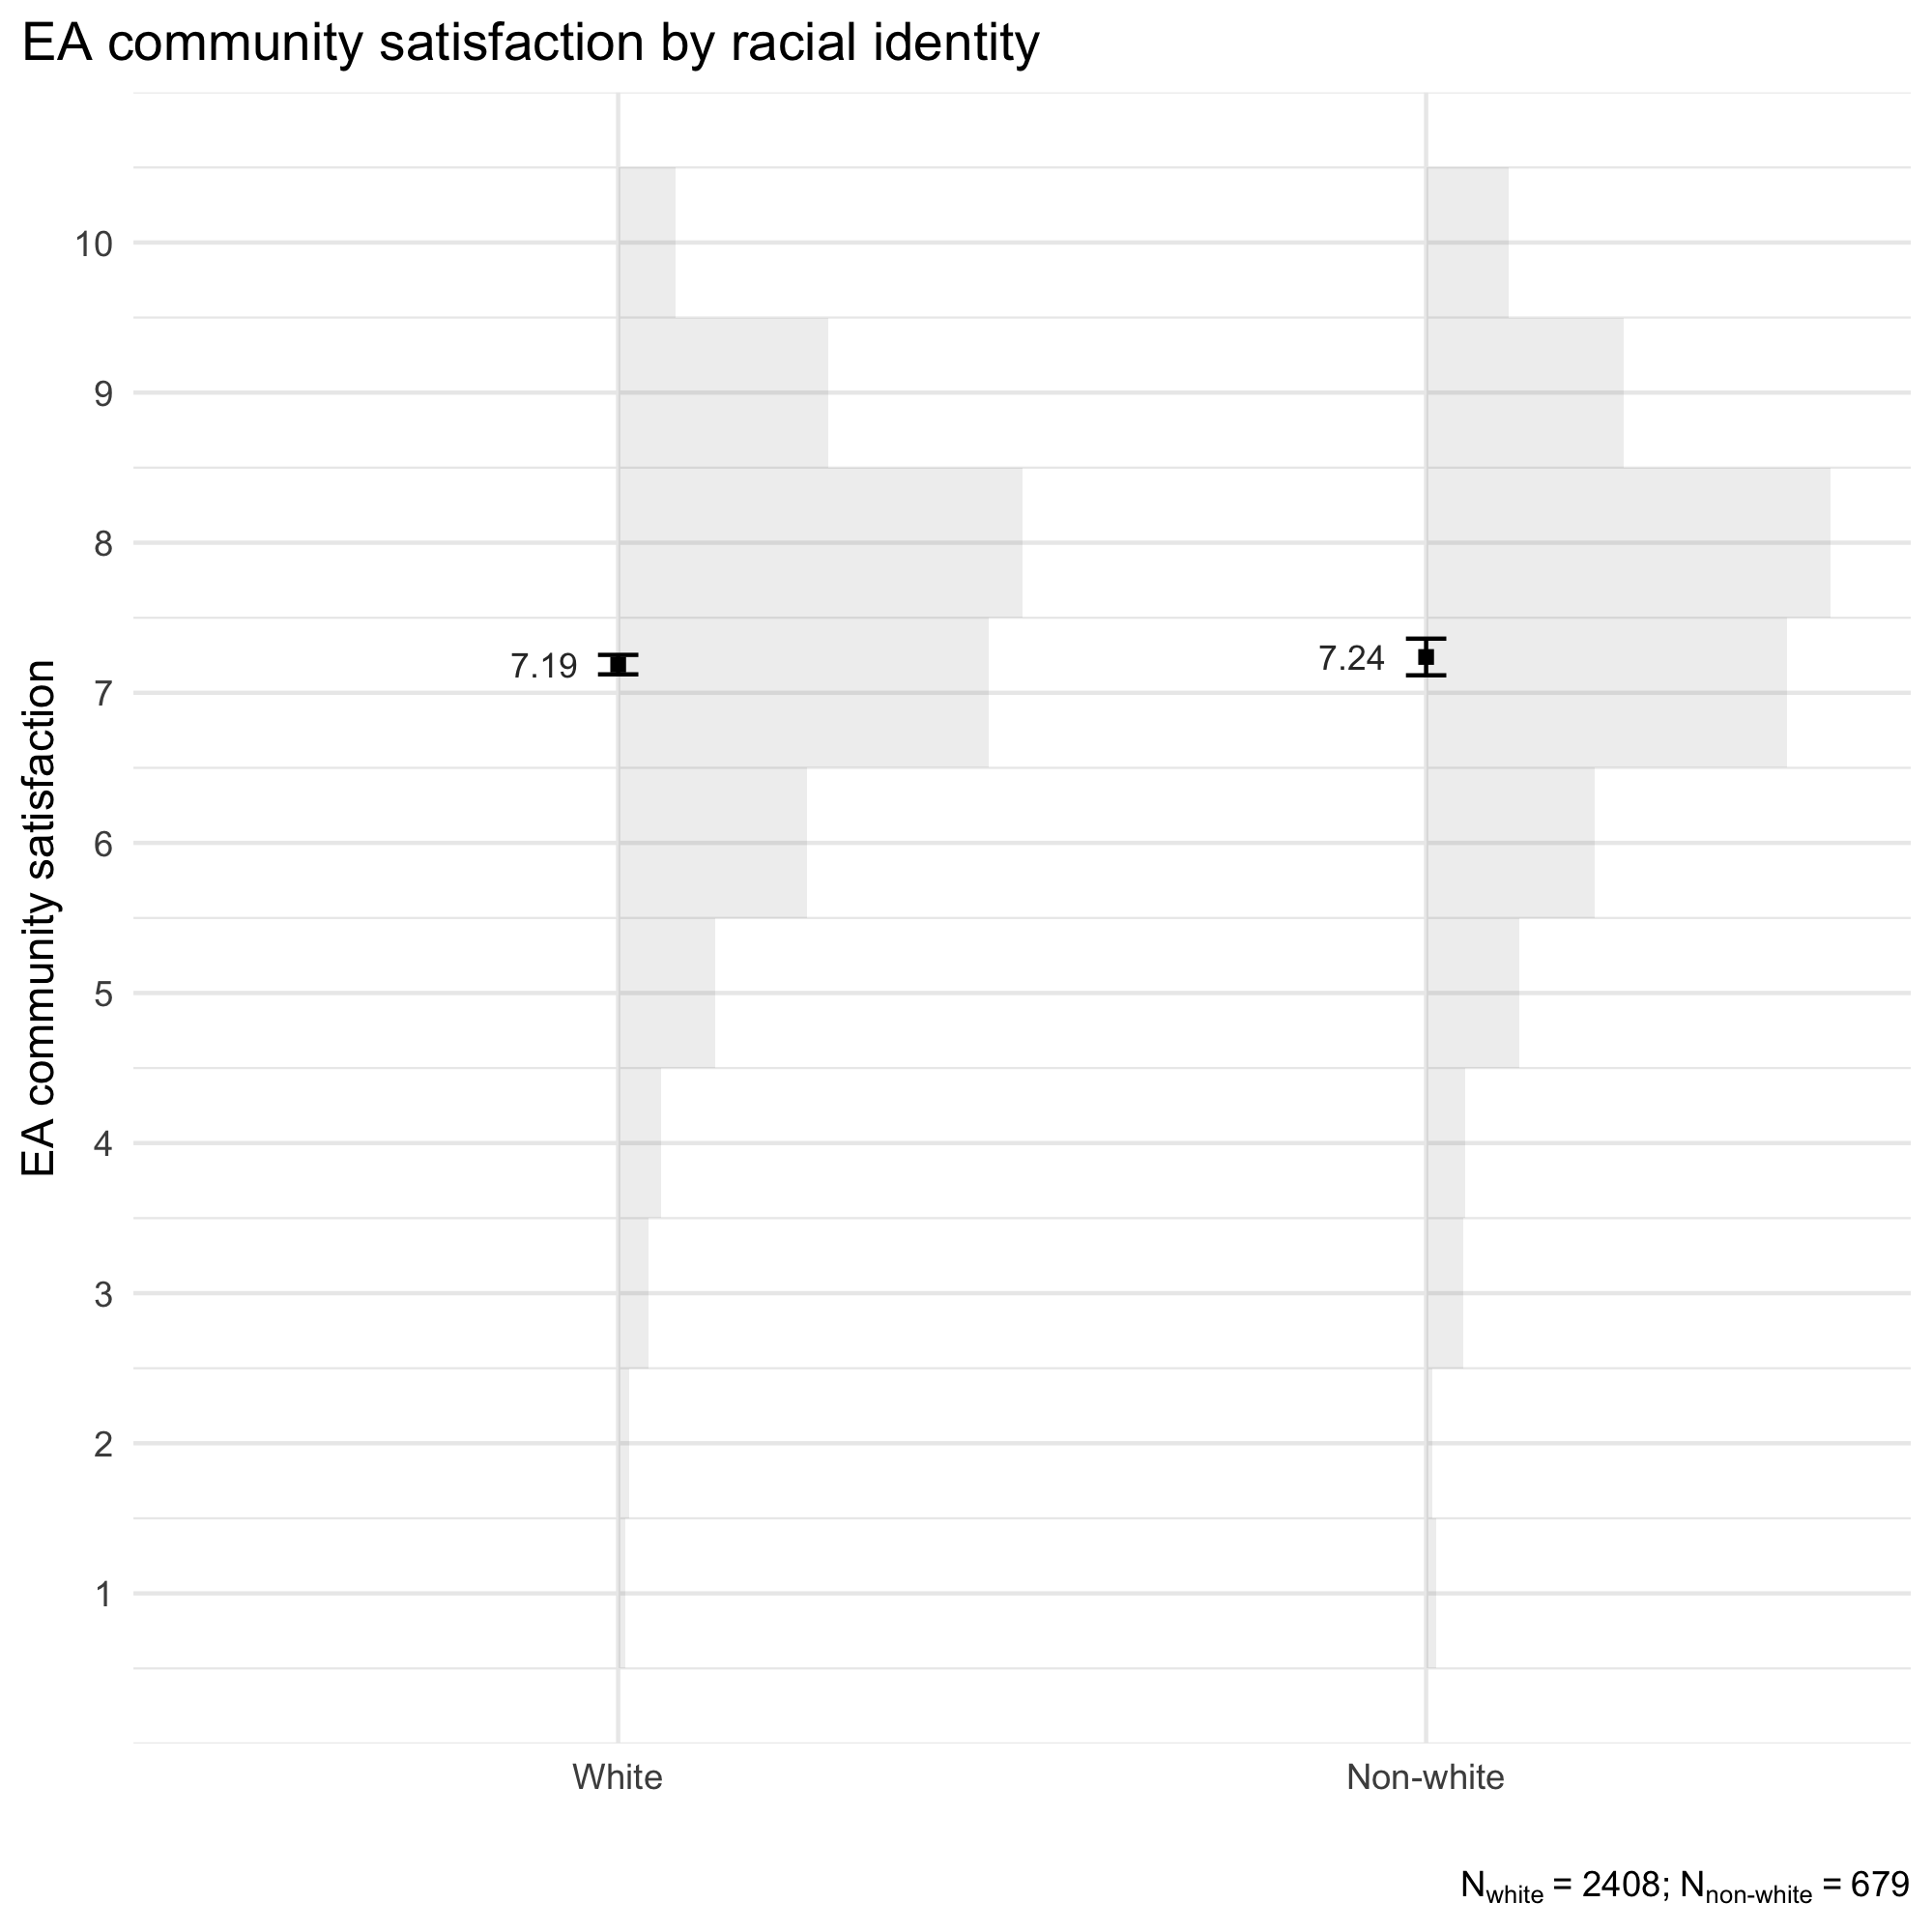
We did not observe a significant difference in EA community satisfaction between respondents identifying as white (M = 7.19, SD = 1.61) compared to non-white (M = 7.24, SD = 1.66).
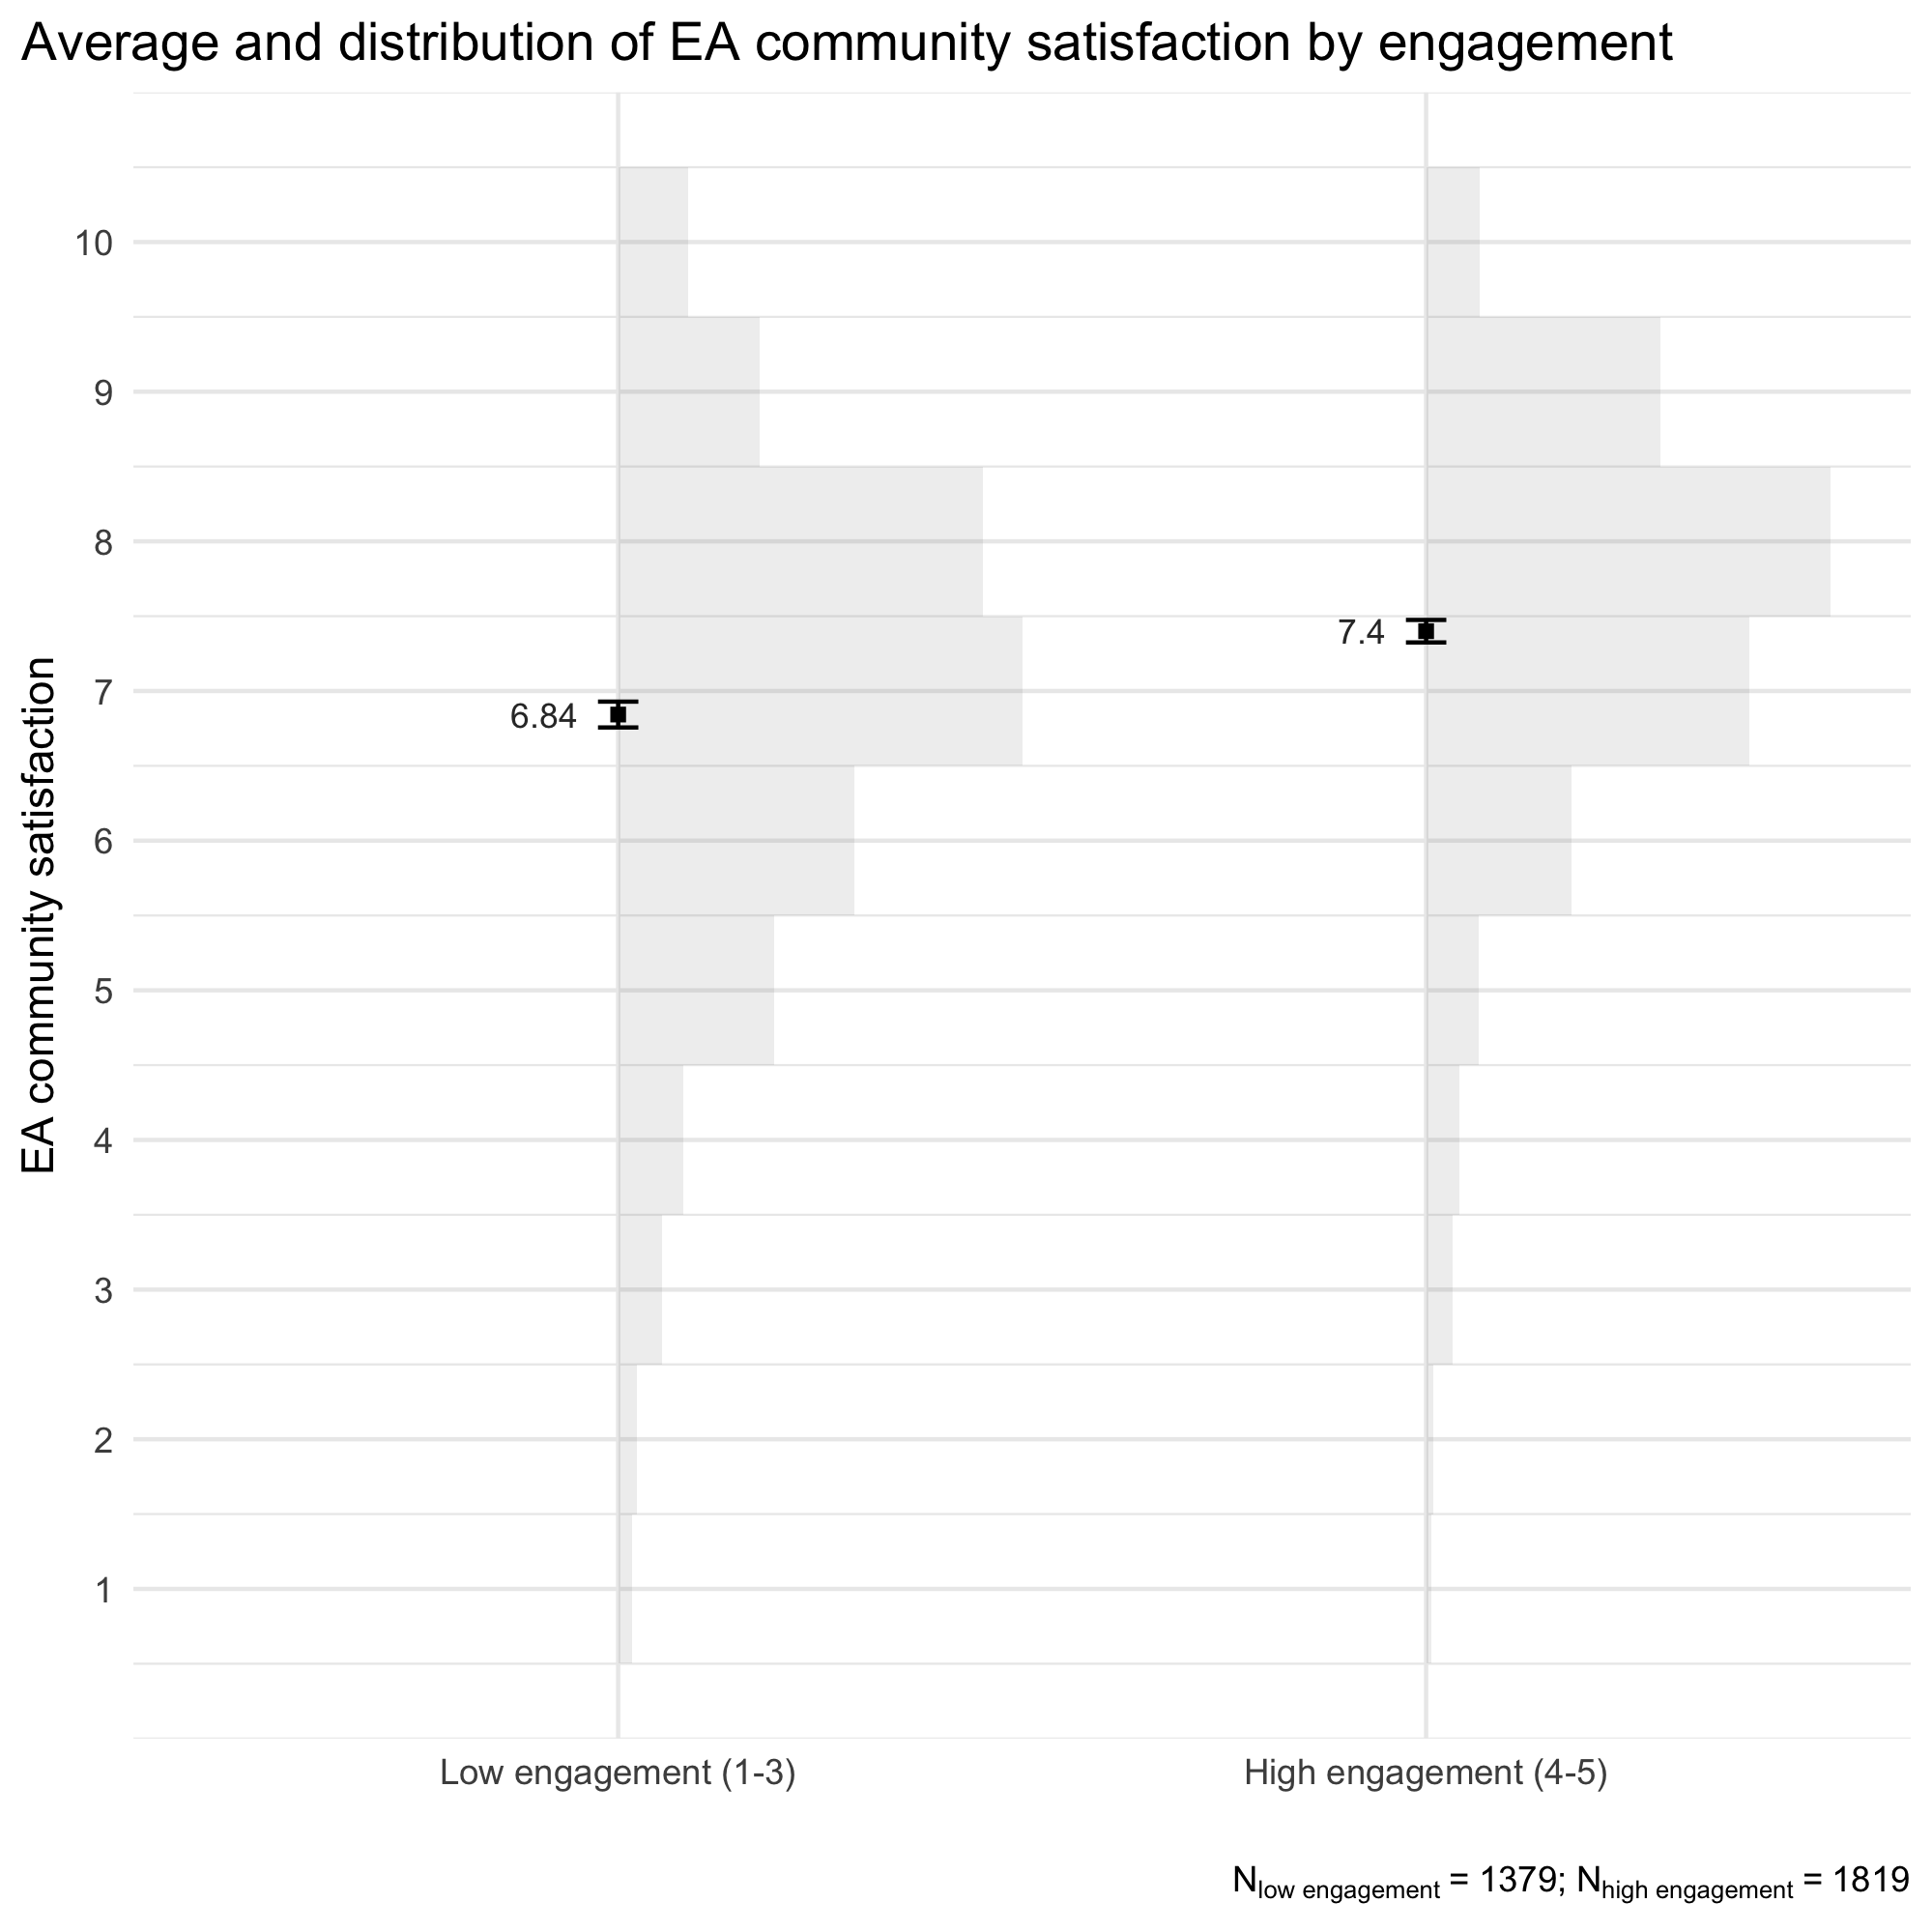
Not unexpectedly, more engaged respondents reported being more satisfied with the EA community (M = 7.40, SD = 1.54) than less engaged respondents (M = 6.84, SD = 1.75)–an average difference of 0.56.
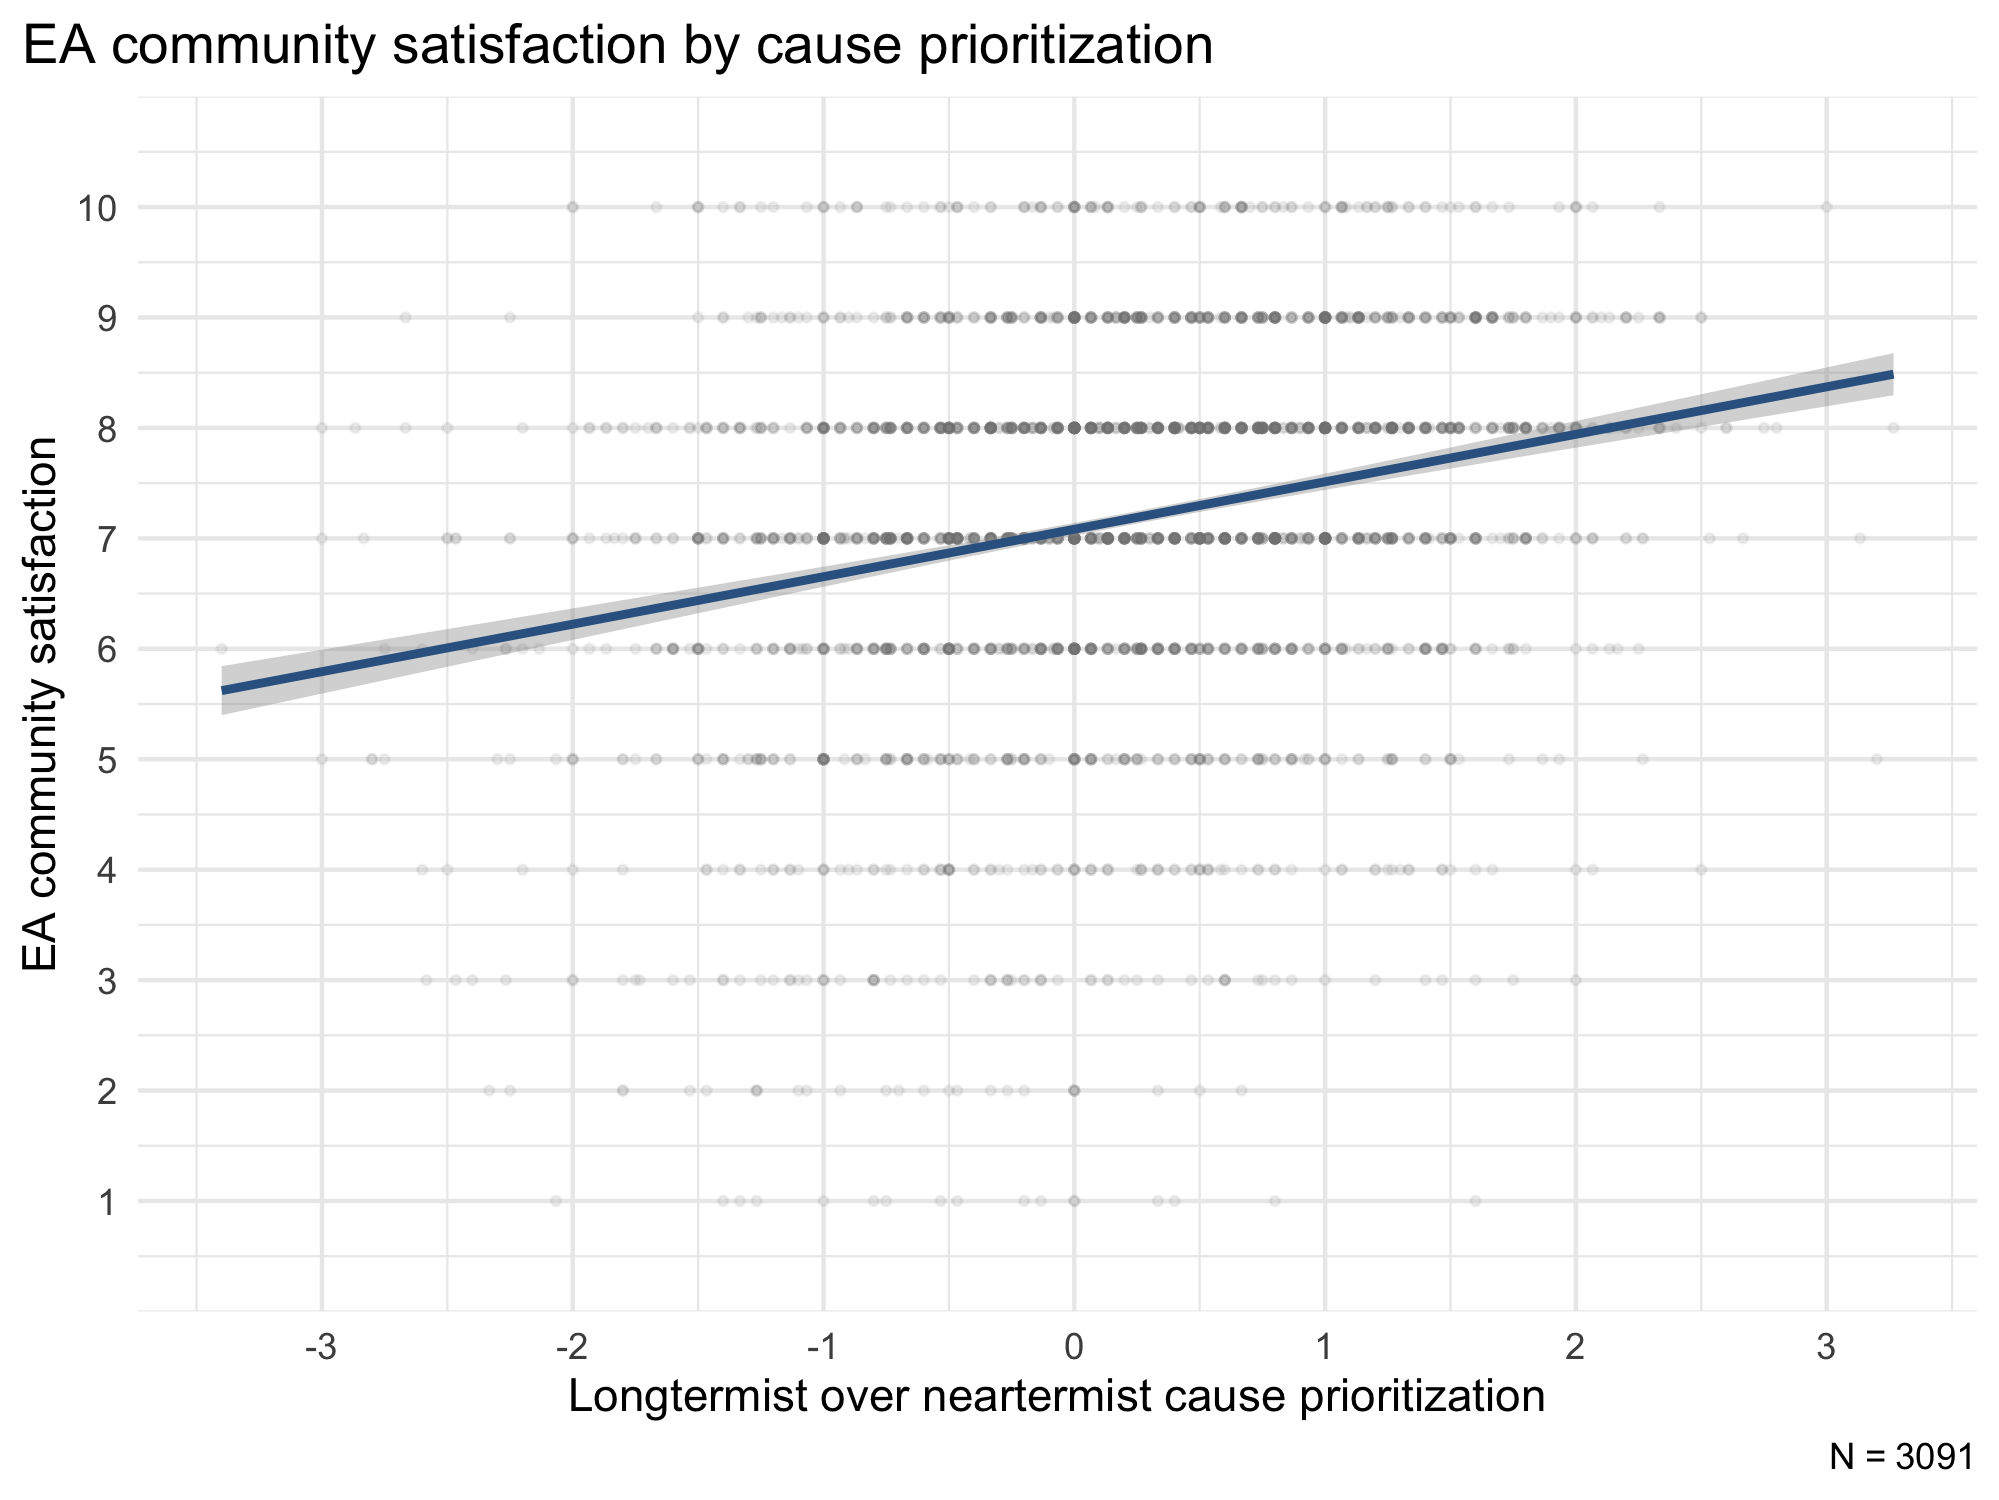
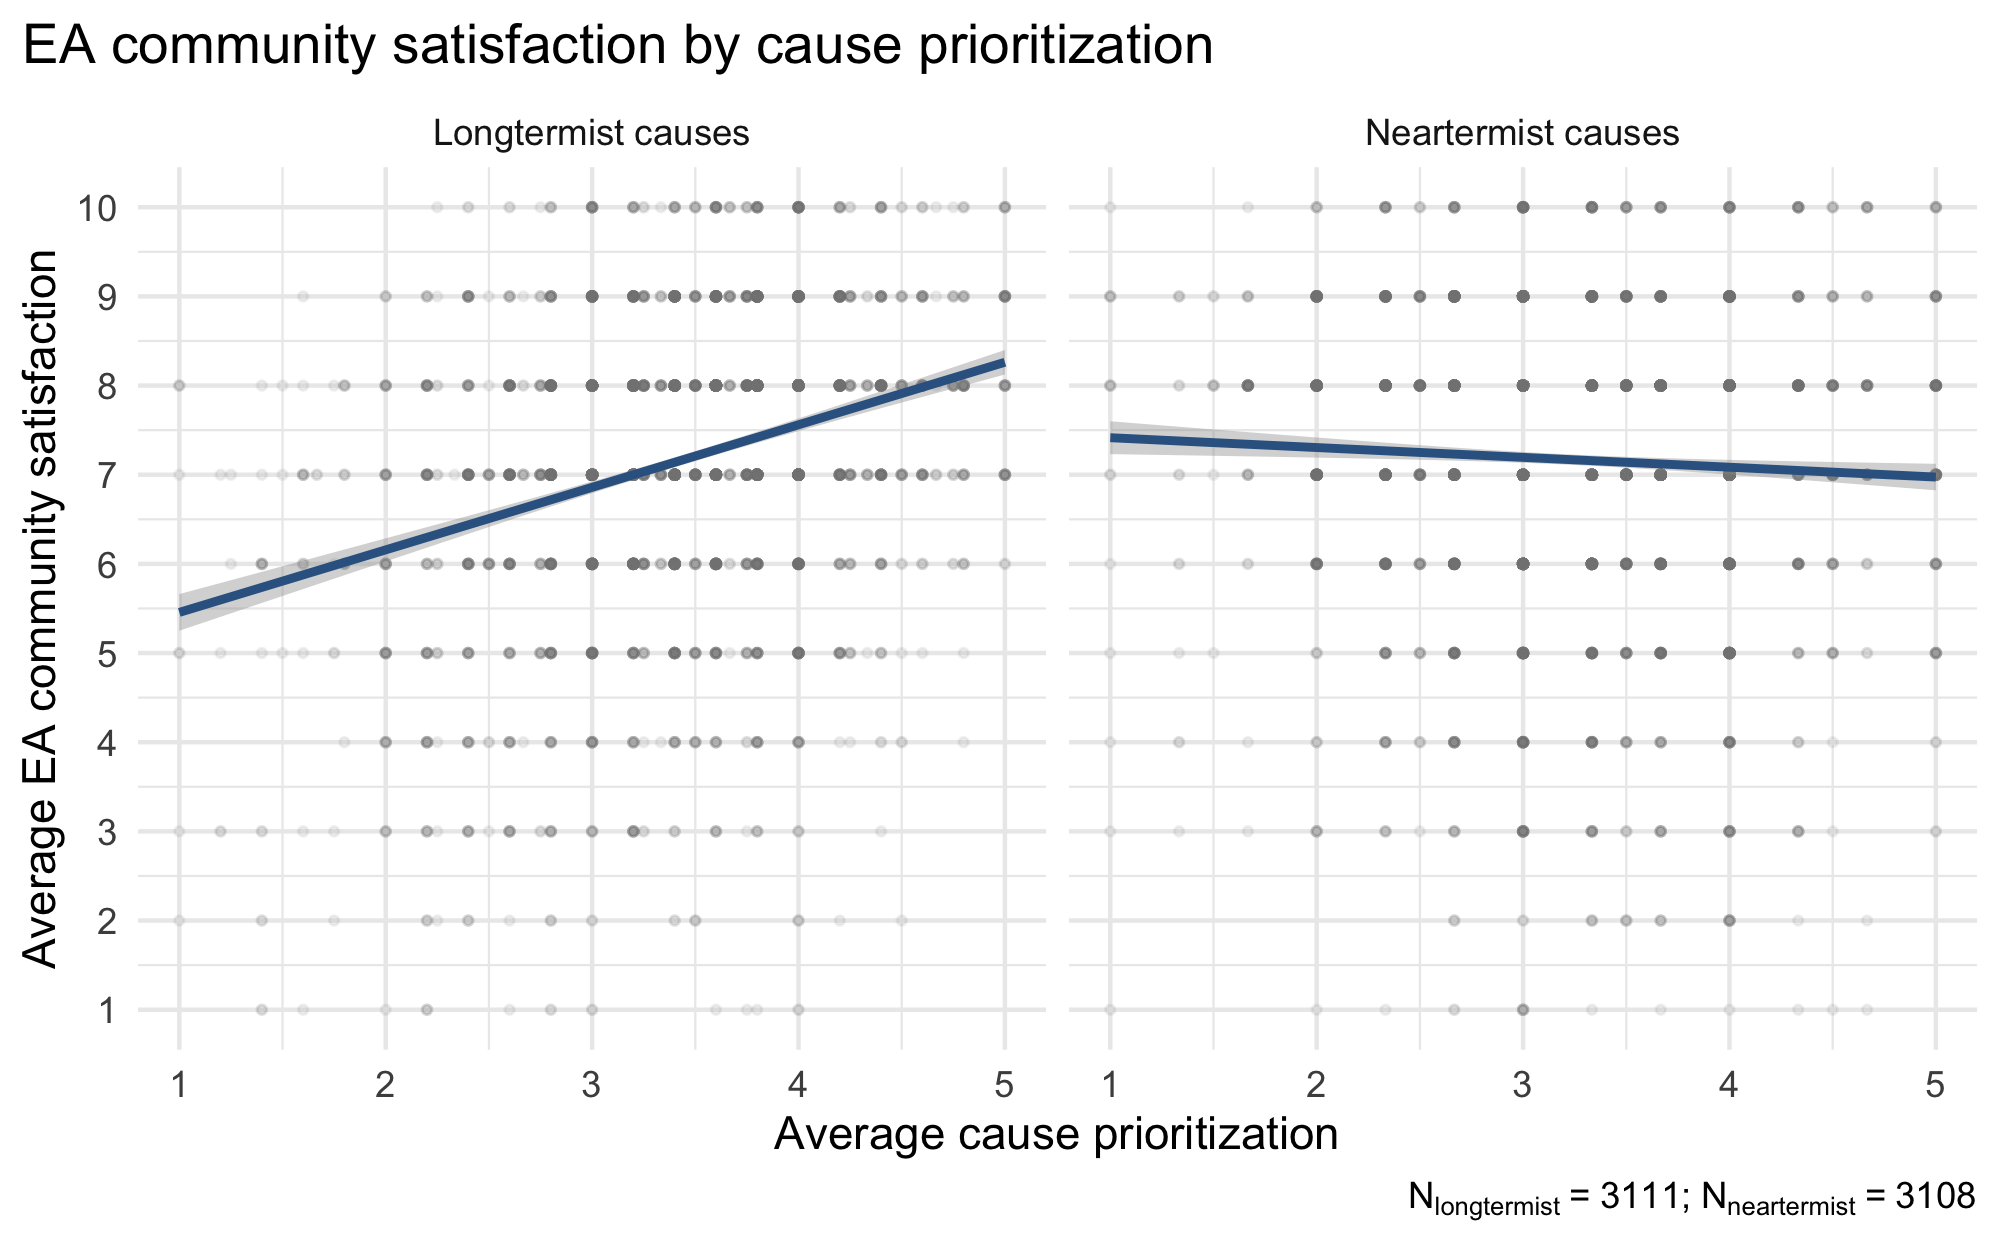
We also looked at the relationship between EA community satisfaction and the extent to which the respondent prioritized longtermist causes over neartermist causes. Respondents indicated on a 1-5 scale the extent to which various causes should be prioritized. We calculated an average cause priority score of longtermist causes (biosecurity and pandemic preparedness, nuclear security, reducing risks from artificial intelligence, existential risk (other than AI, biosecurity, or nuclear security), and other longtermism) and subtracted the average cause priority score of neartermist causes (global poverty/global health, mental health, other neartermism). This means that higher scores on this measure indicate a greater prioritization of longtermist causes over neartermist causes.[2]
We find a positive relationship between this measure and EA community satisfaction. Respondents who prioritize longtermism causes to a greater extent report higher satisfaction with the community (r = .25, 95% CI [.21 - .28]).
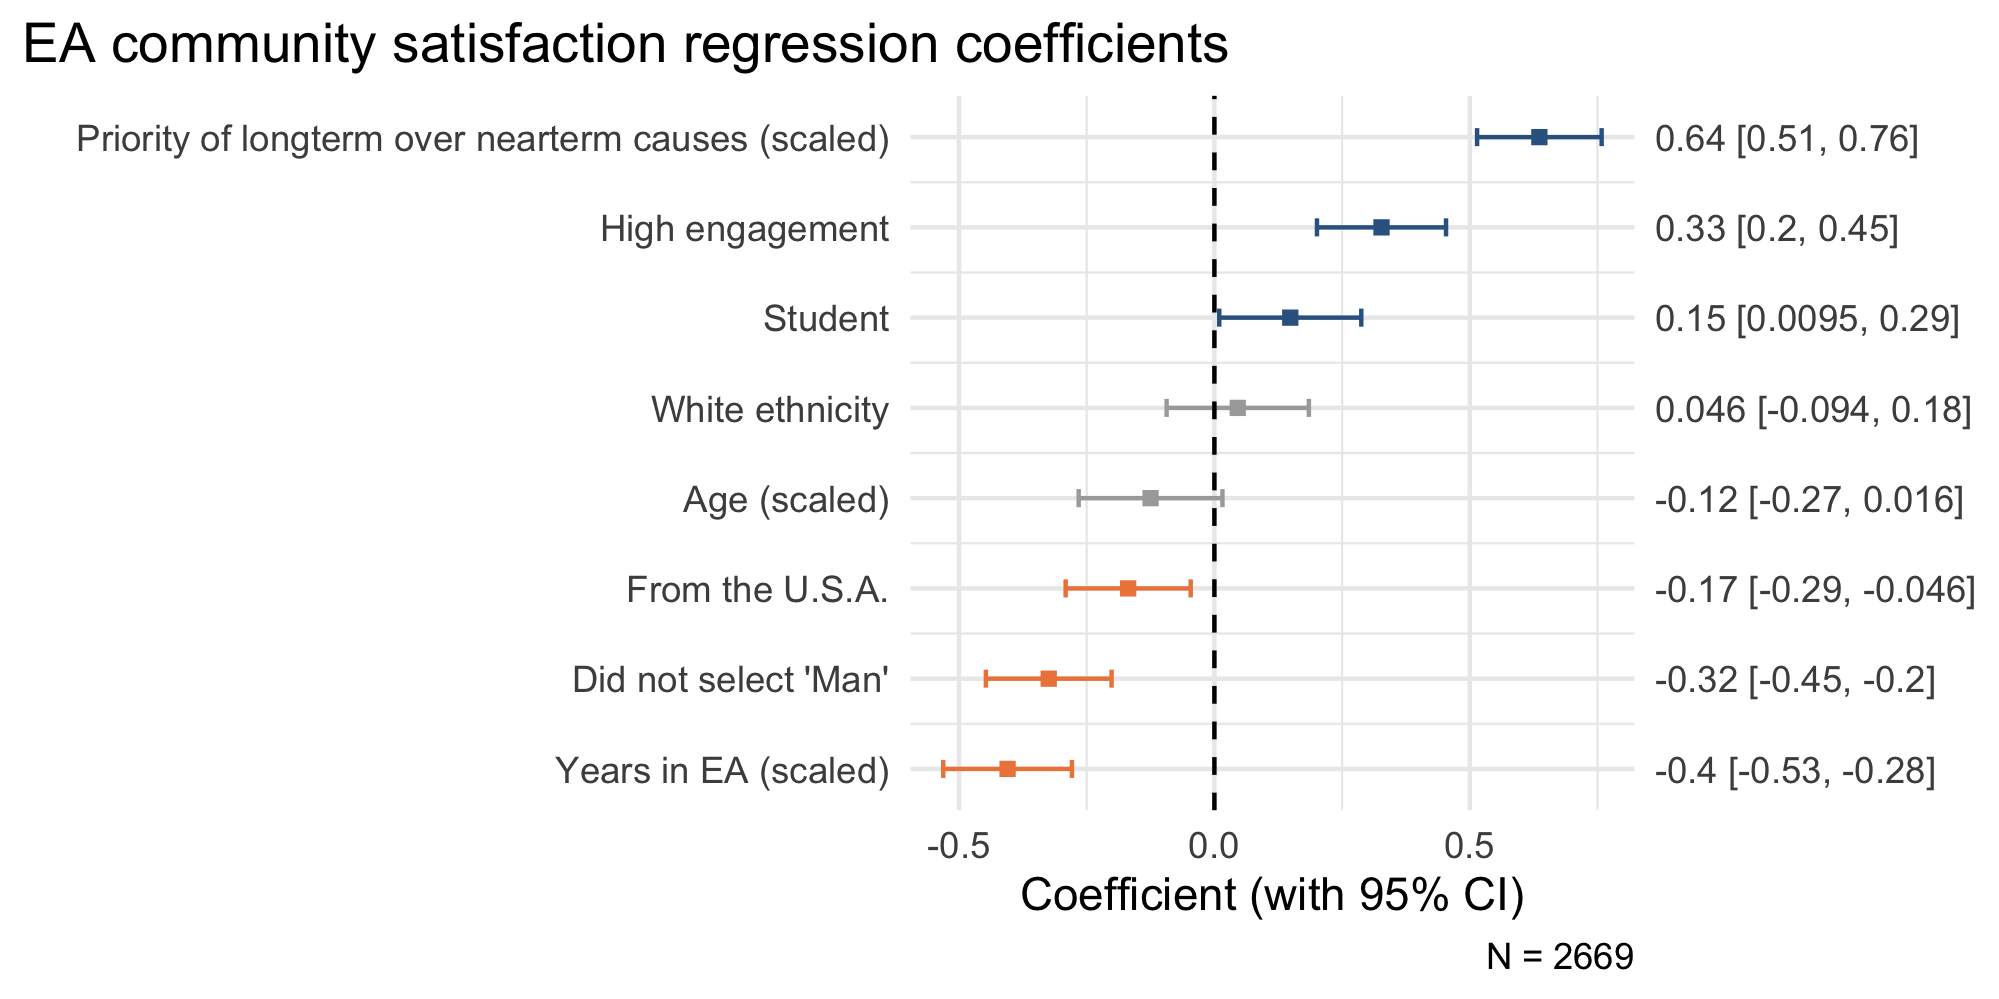
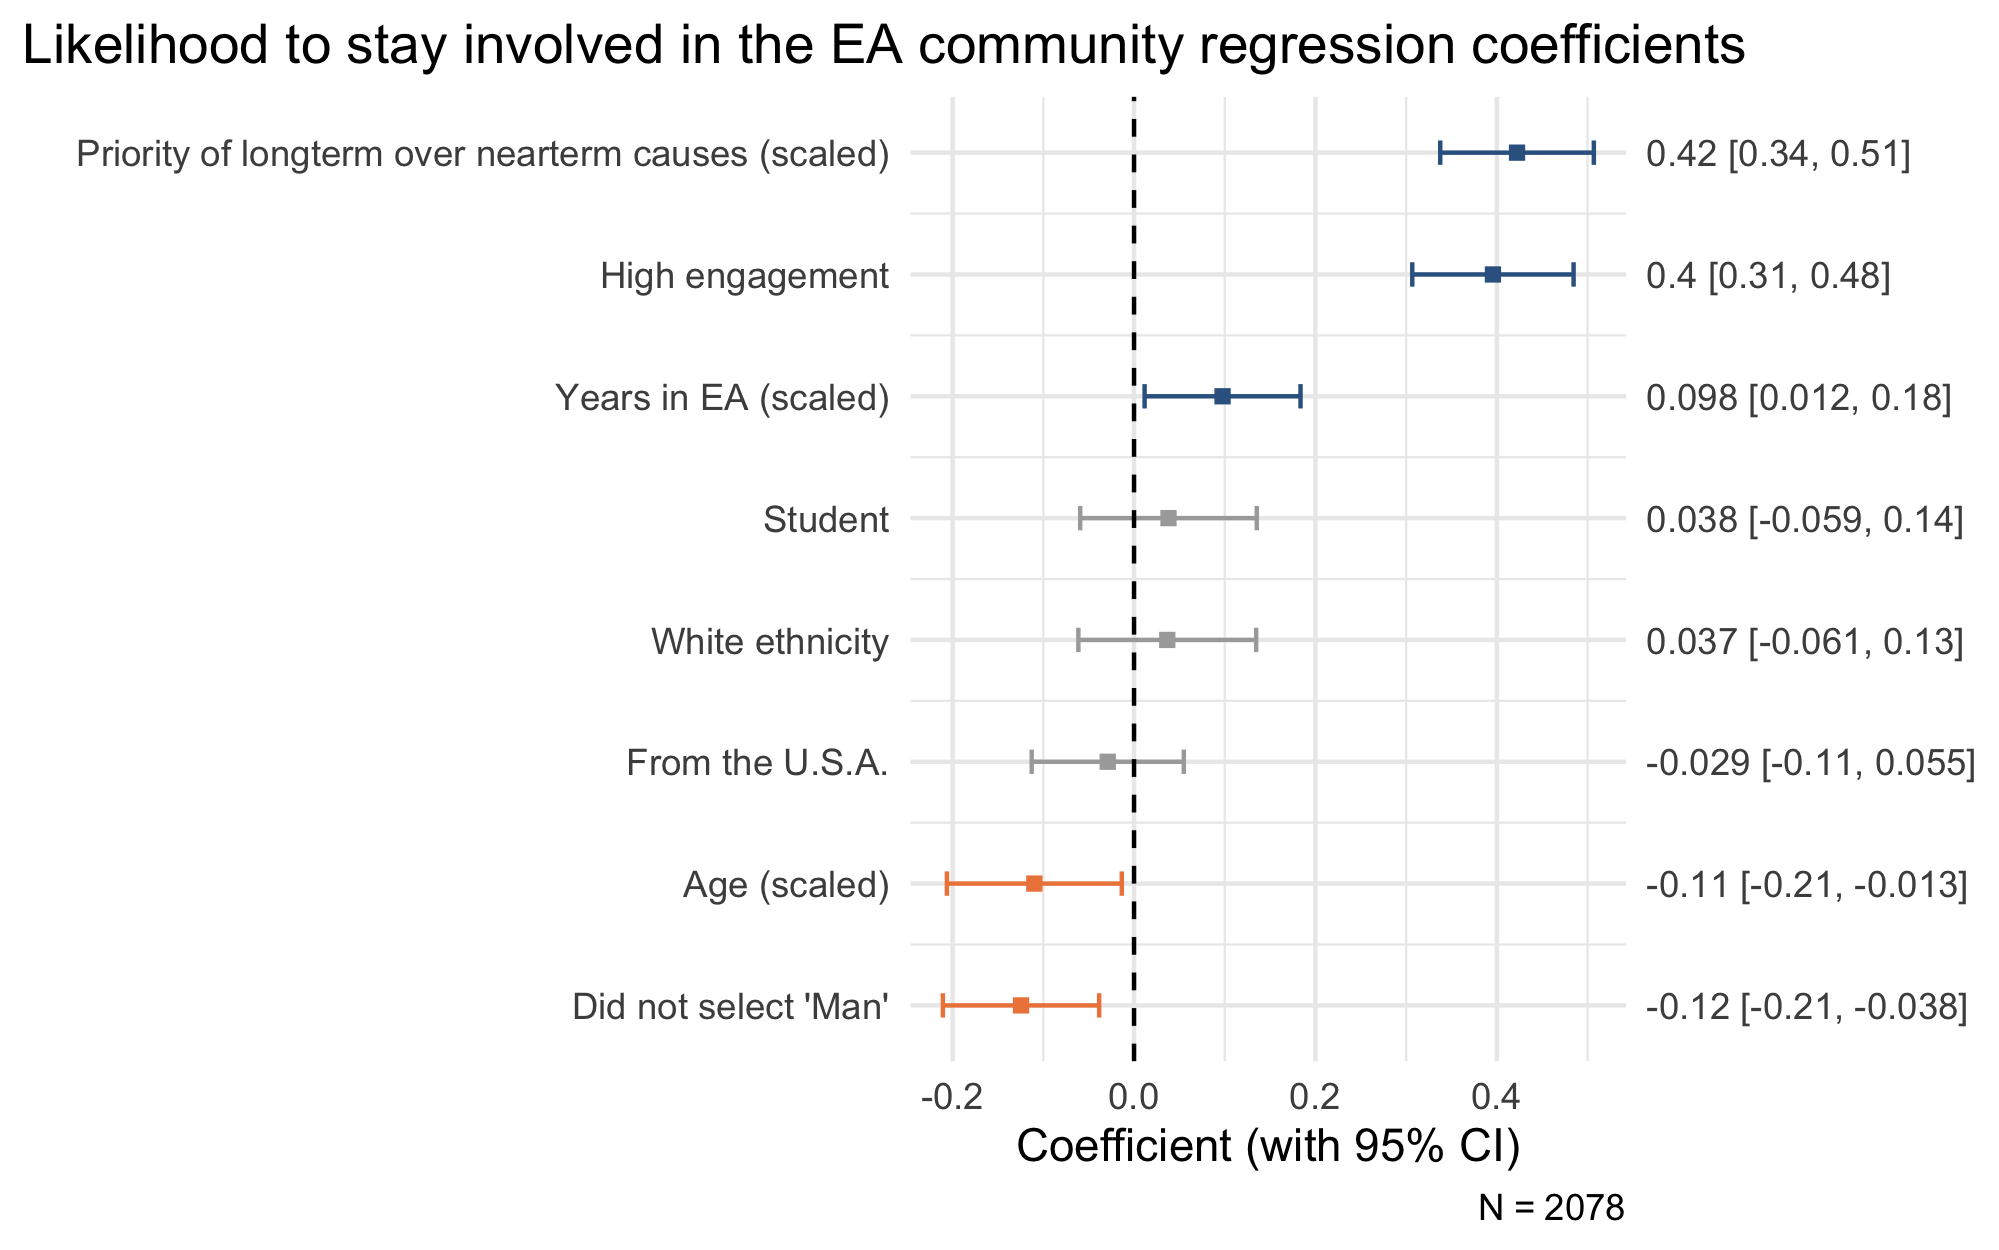
In addition to the individual analyses presented earlier, we also conducted a multiple regression to see whether some of the previously reported differences also hold when all factors, including other relevant factors, are included.[3] It could be the case that some of the group differences are confounded by other factors. For example, more engaged respondents are also more likely to see longtermist causes as having a higher priority, so the relationship between endorsing longtermist causes and satisfaction may be driven by engagement instead. We also included several other factors not previously mentioned as additional control variables. Note that the continuous predictors in this model (e.g., age) are standardized and scaled so they are comparable to the binary predictors (e.g., engagement; see Gelman, 2007).
The regression results below show that all previously mentioned group differences are also significant when controlling for the additional variables.
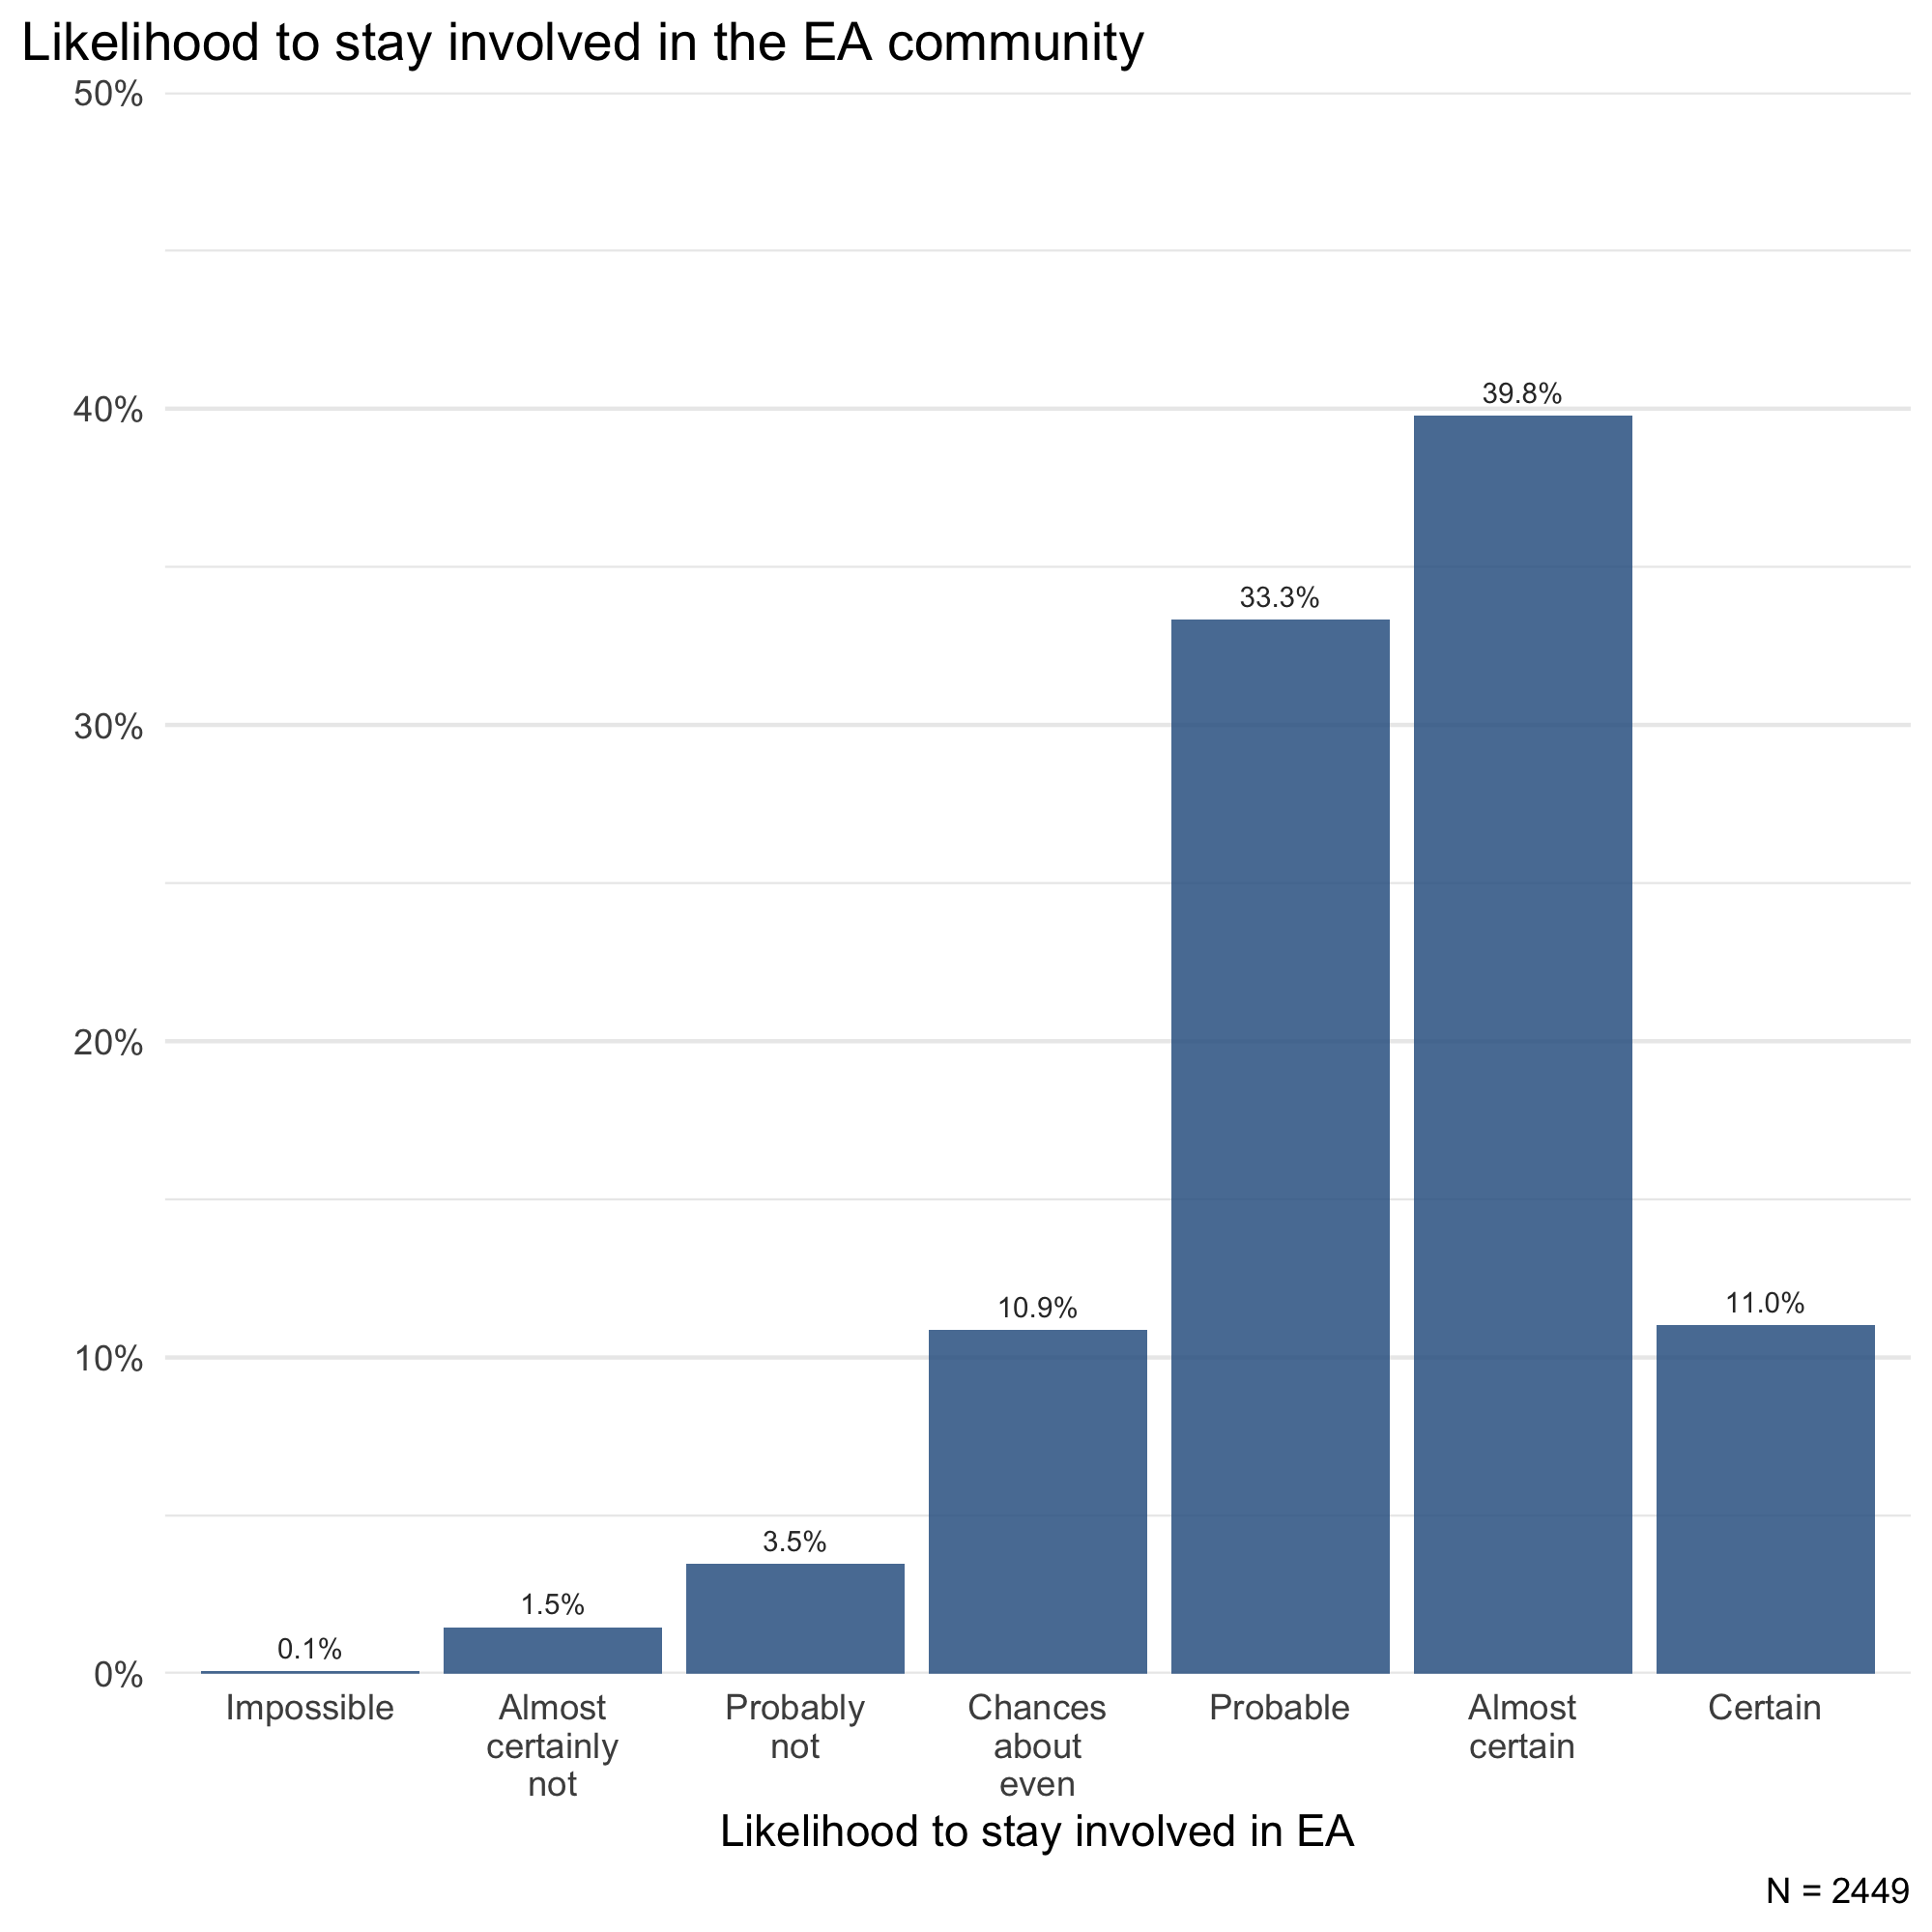
The majority of respondents indicated they are likely to still be involved in the EA community in three years’ time (84.1%). Some respondents (10.9%) indicated chances were about even to still be involved. Only a small minority (5.1%) indicated they would likely not be involved anymore.
Naturally, we might expect these figures to be too optimistic, in that people who are less likely to remain in EA may be less likely to take the EA Survey. Nevertheless, they may still serve as something of an early warning system of concerns in the community.
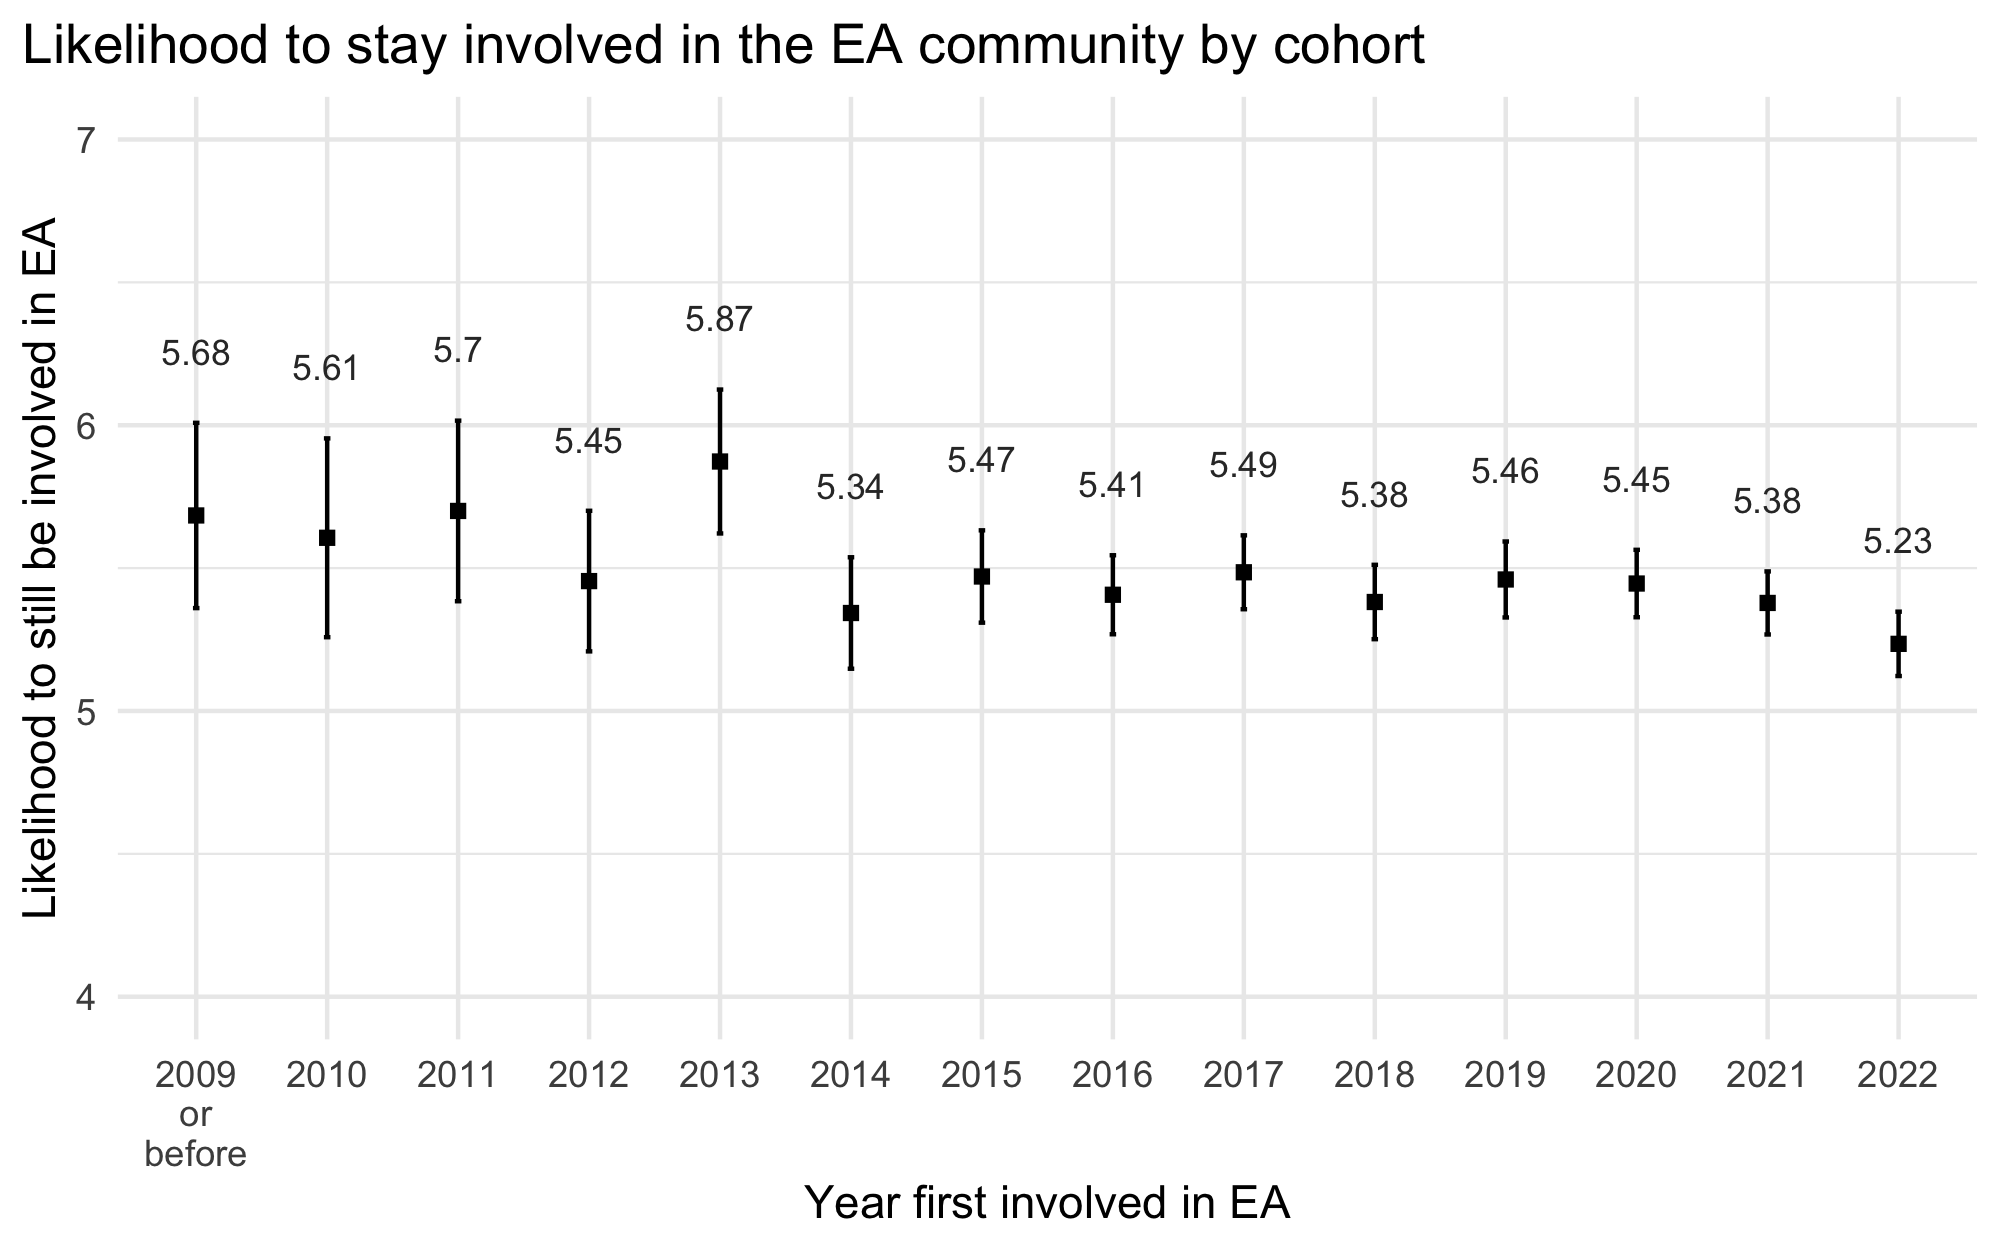
Earlier cohorts seem more likely to stay in the EA community than the newest cohort (those who joined in 2022).
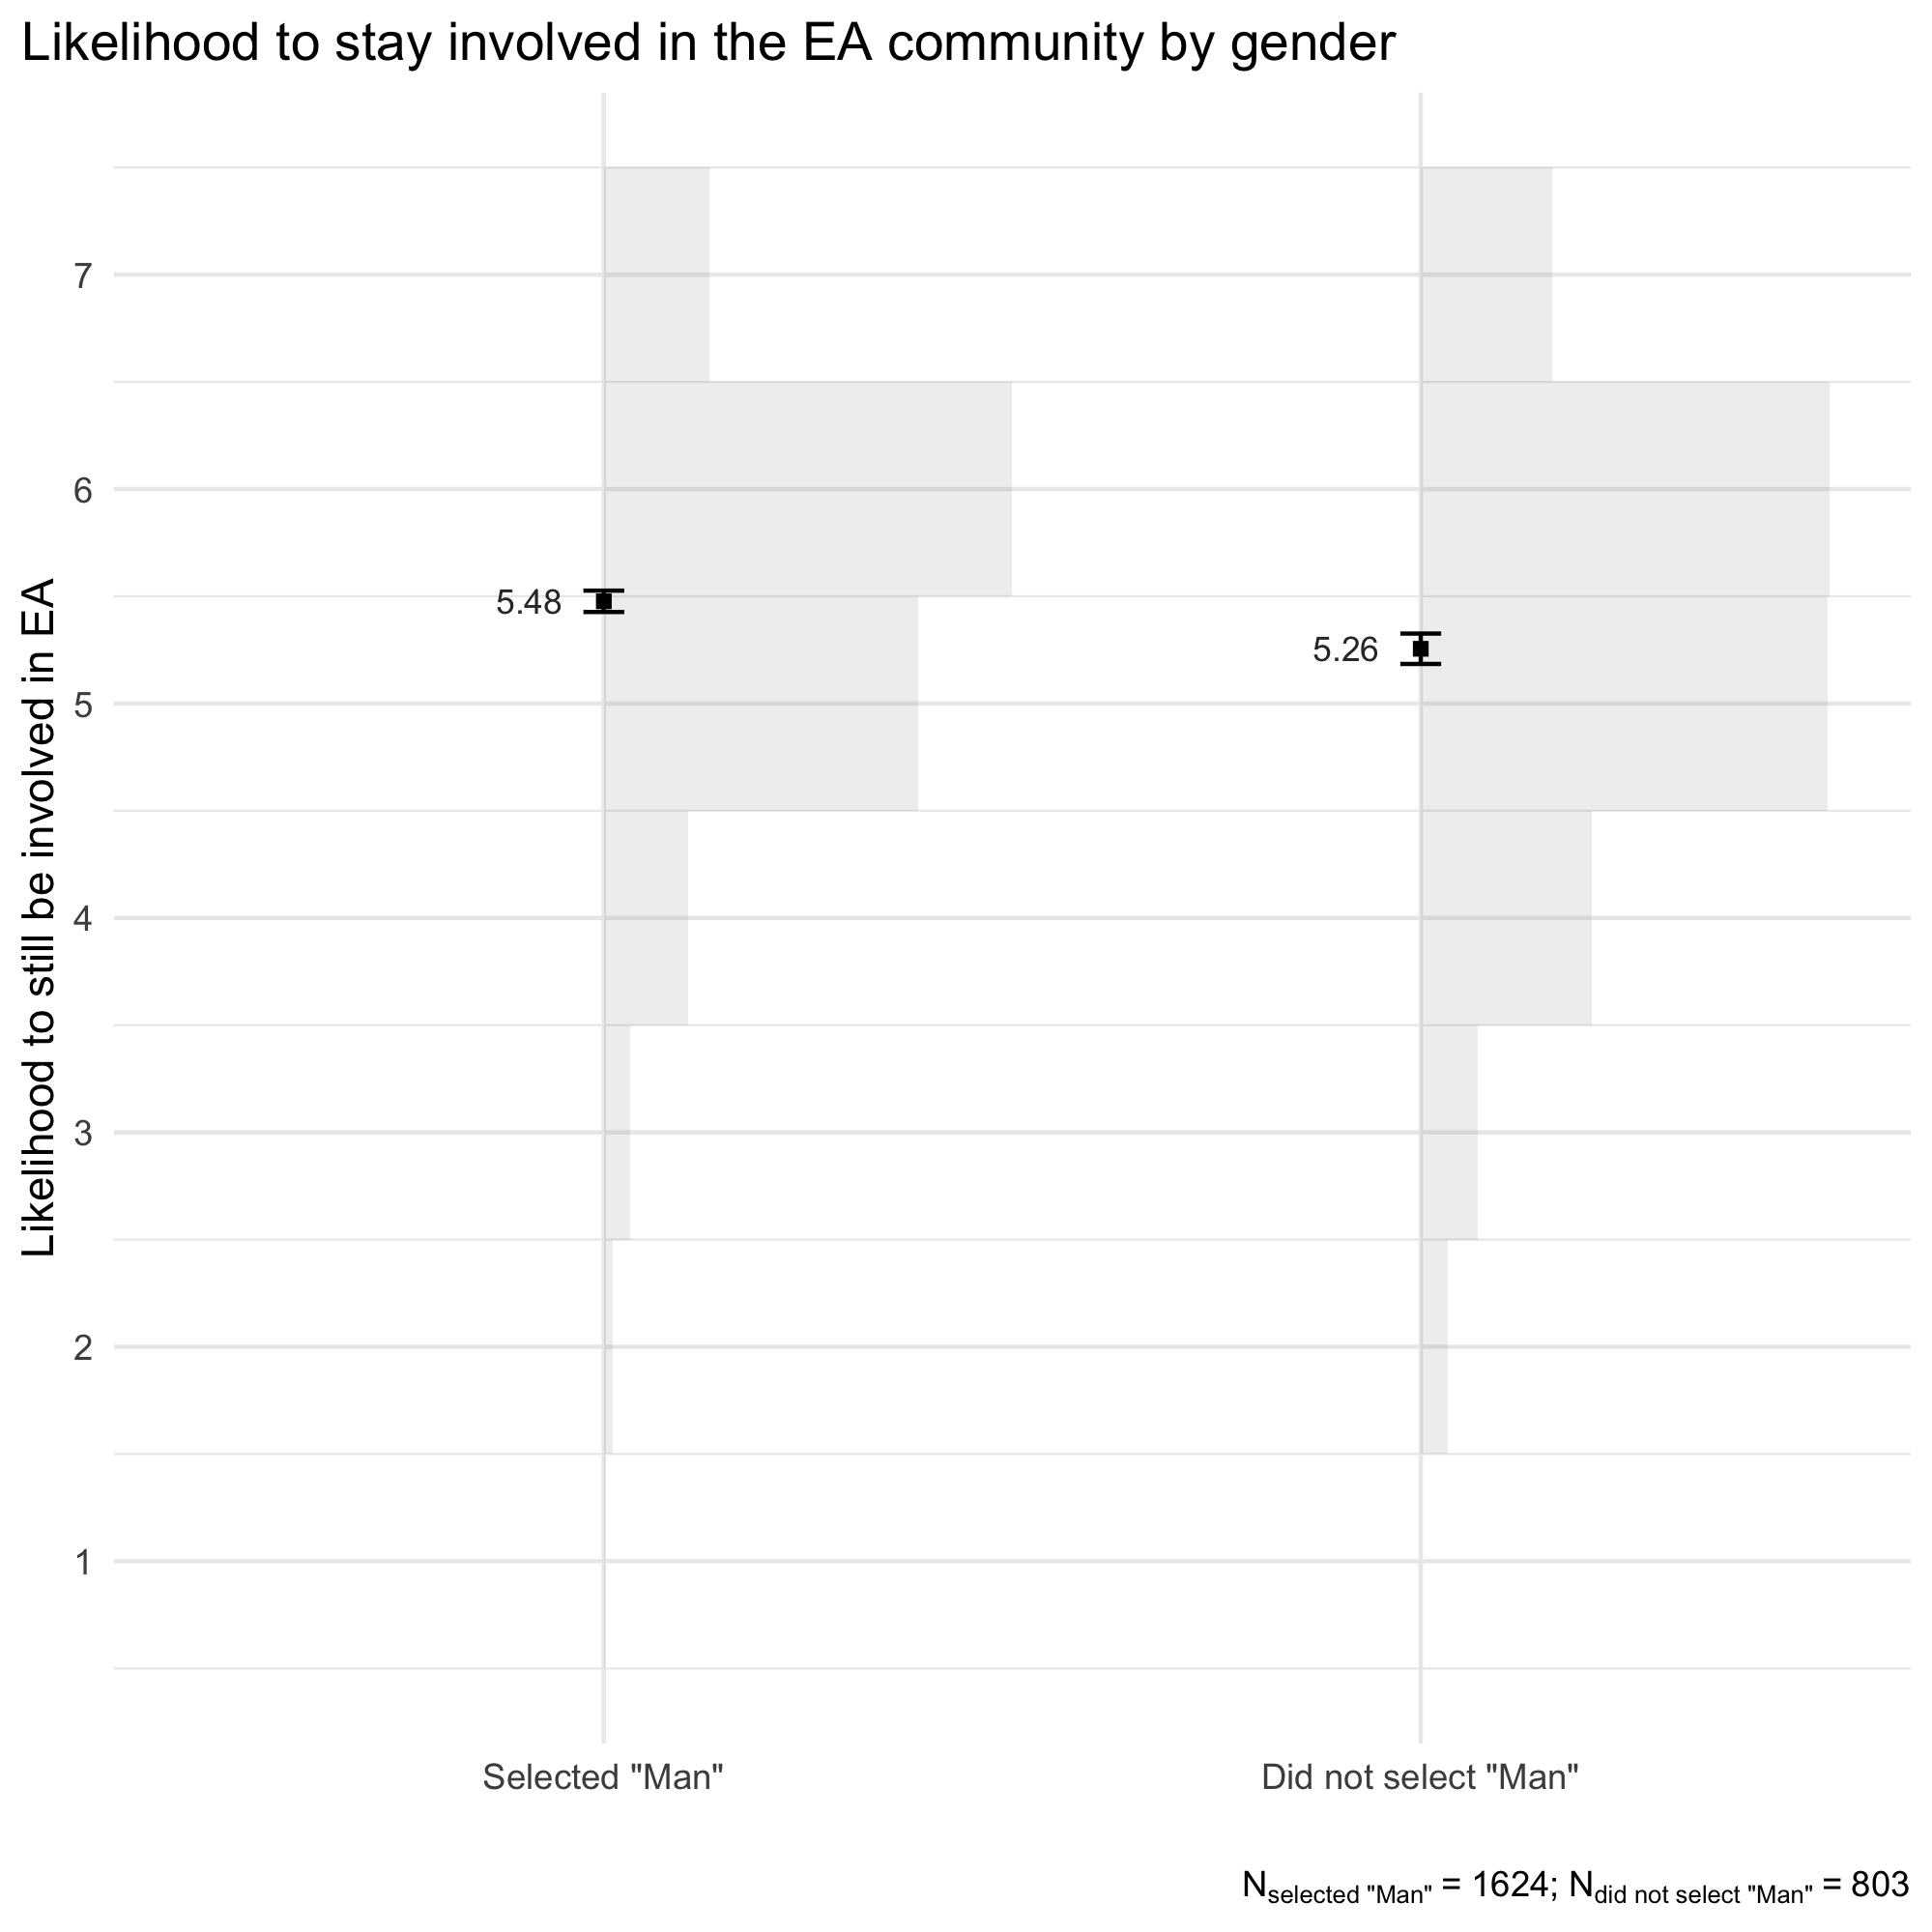
Respondents identifying as a man report being likely to remain involved in the EA community (M = 5.48, SD = 0.98) than respondents who did not indicate identifying as a man (M = 5.26, SD = 1.12)–a difference of 0.22.
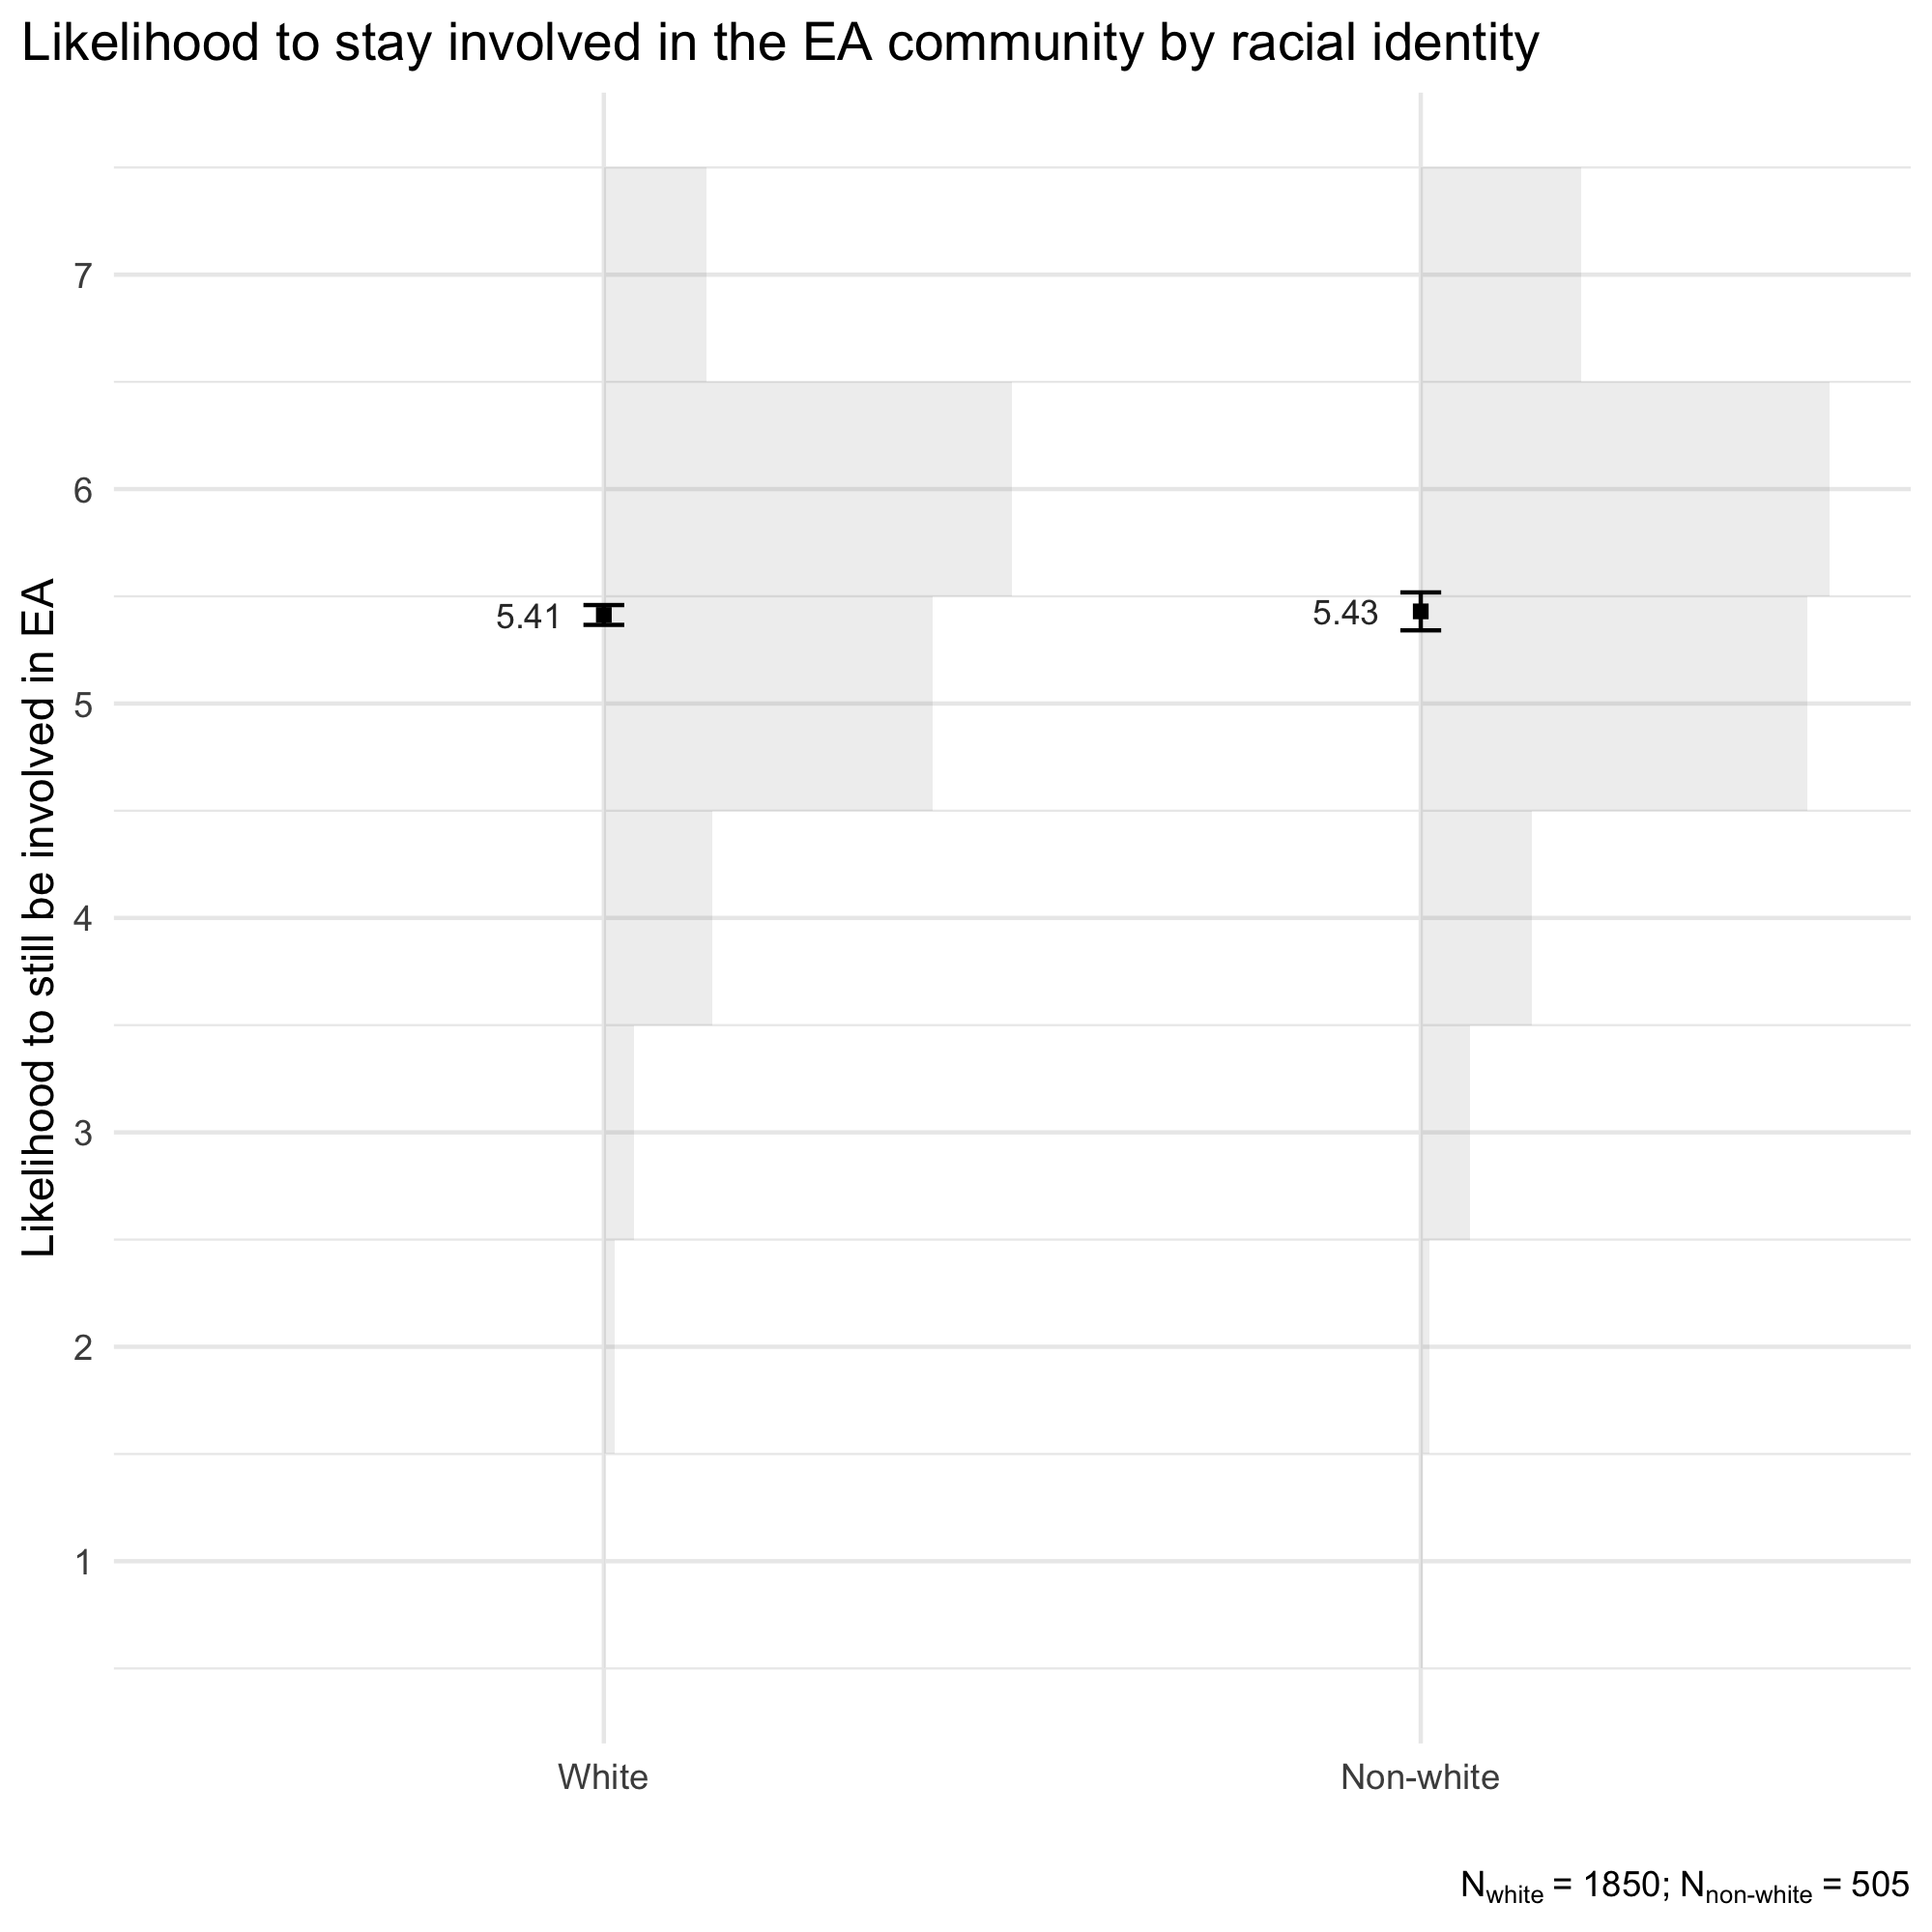
No significant difference was found between respondents identifying as white (M = 5.41, SD = 1.00) compared to respondents not identifying as white (M = 5.43, SD = 1.06).
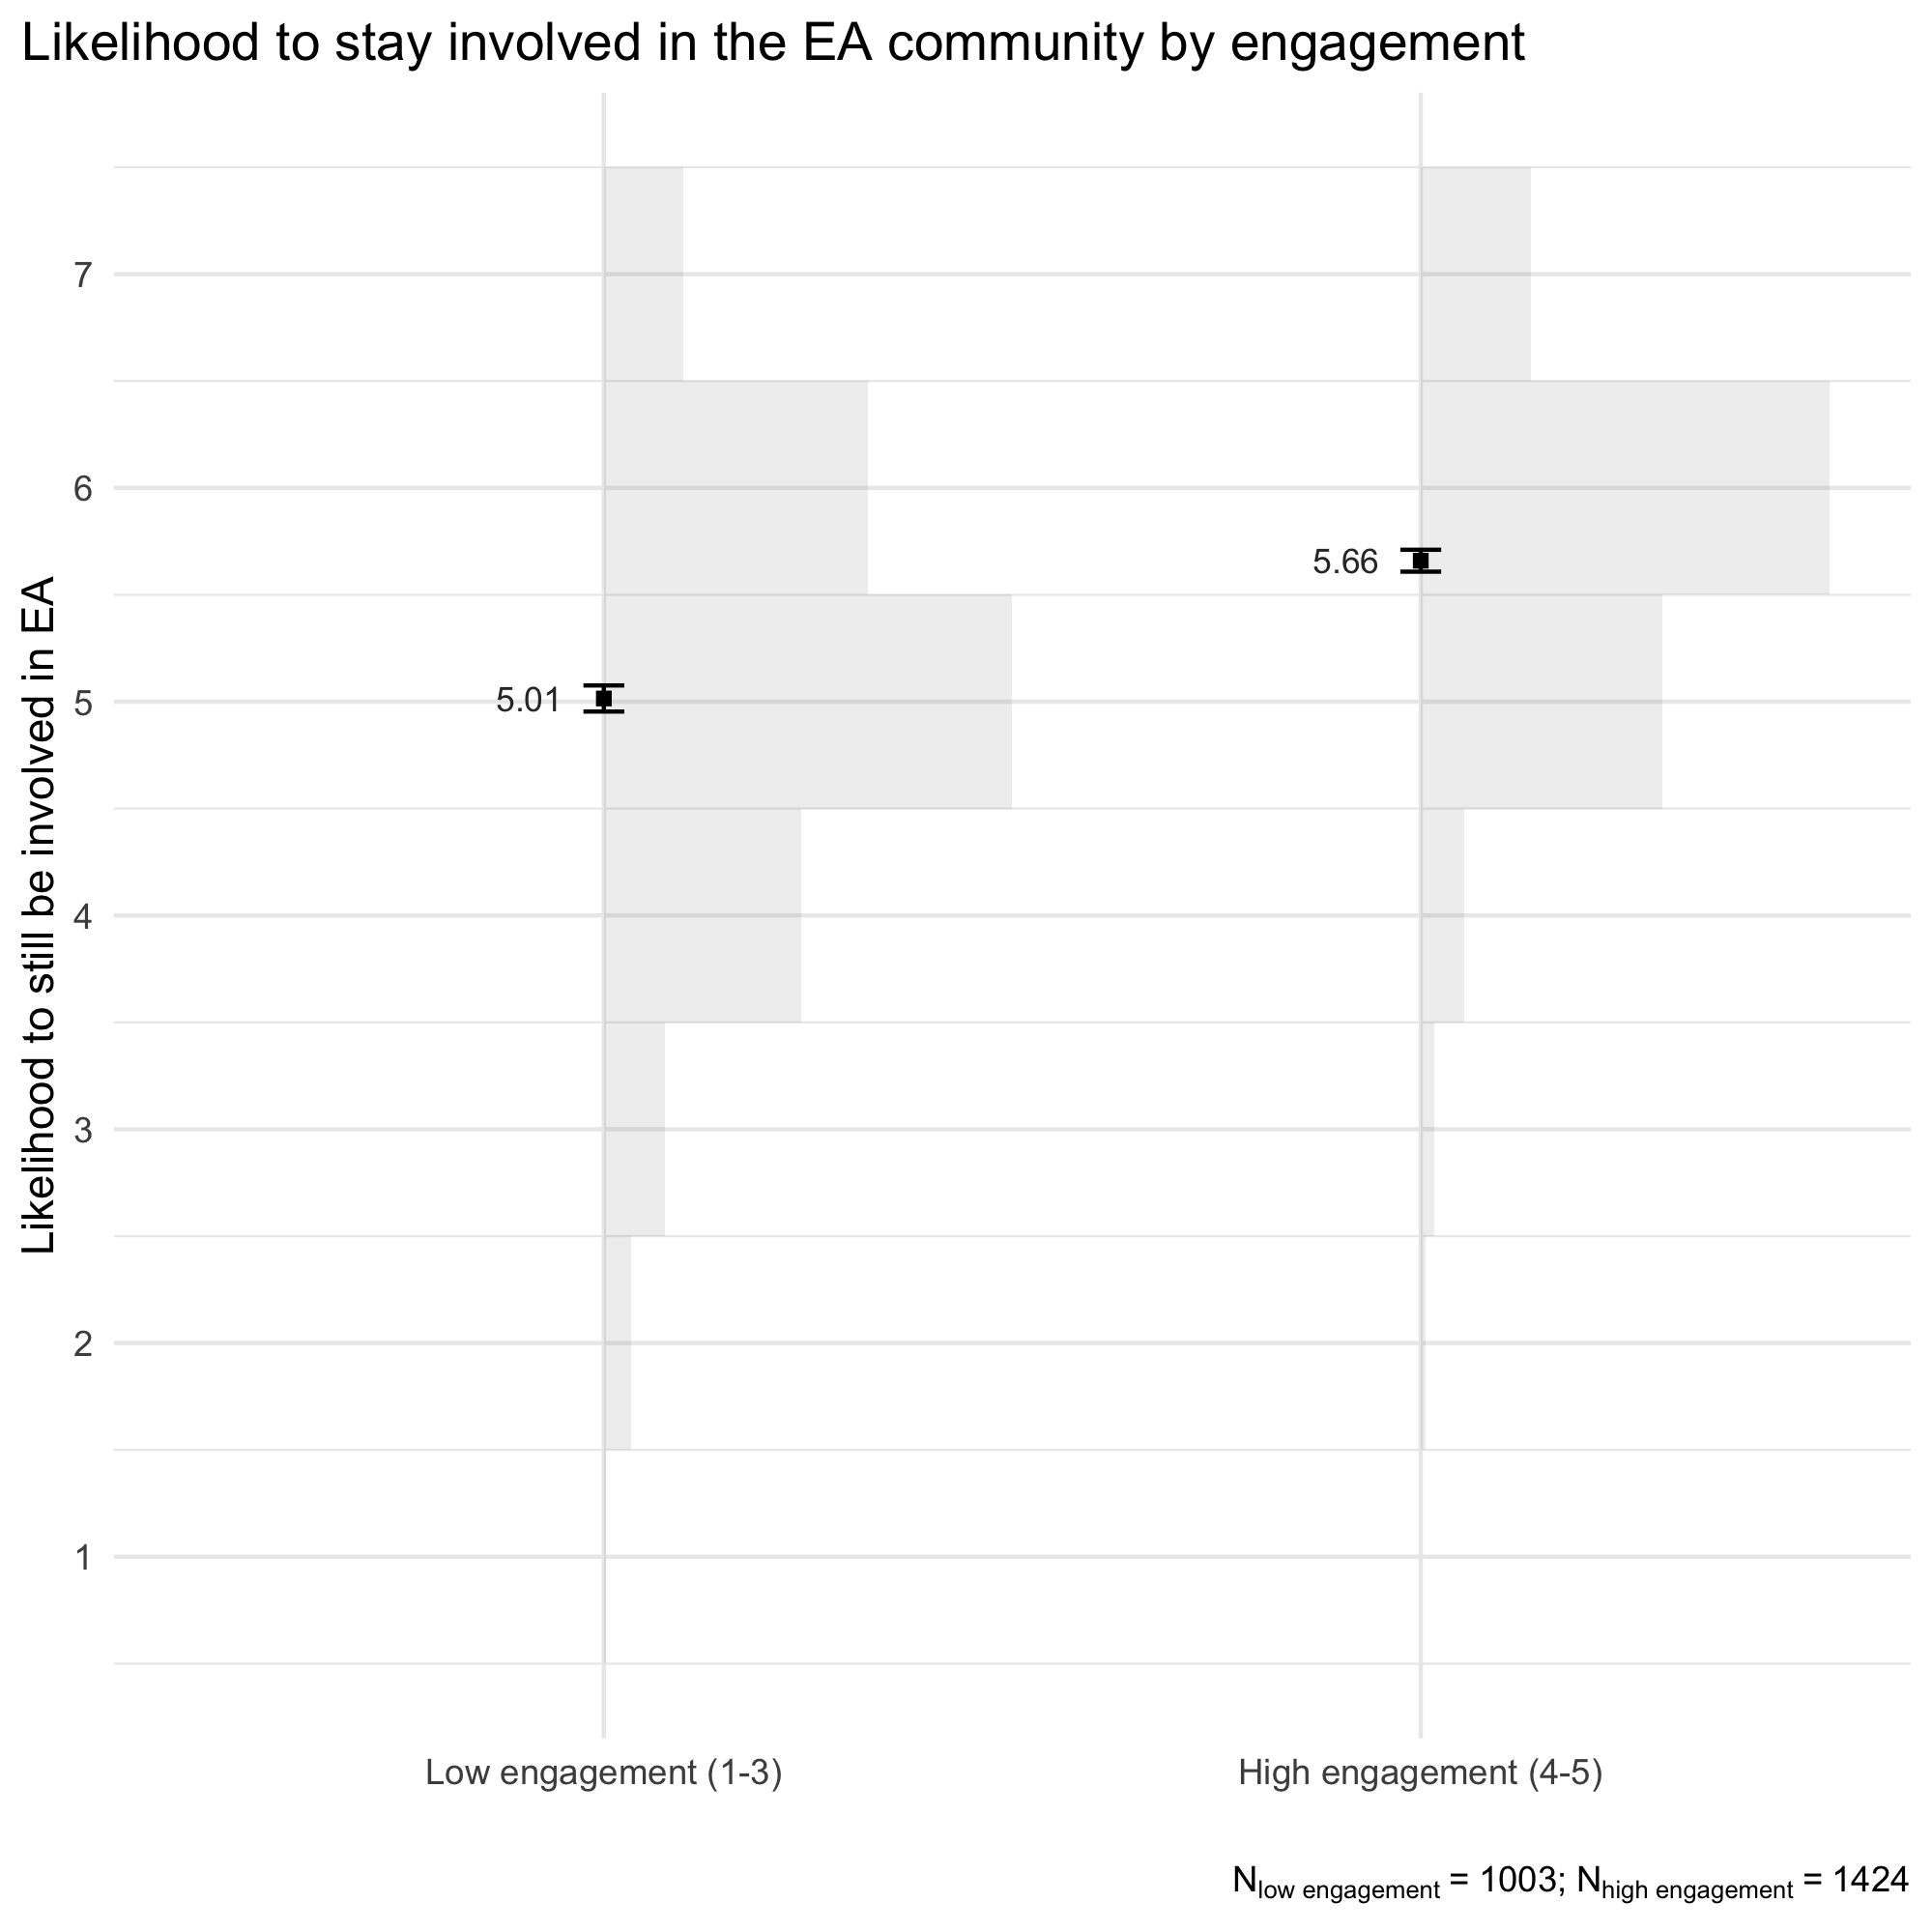
More engaged respondents reported being more likely to stay involved in the EA community (M = 5.66, SD = 0.88) than less engaged respondents (M = 5.01, 1.12). The difference was quite sizable, with an average difference of 0.64 on a 7-point scale.
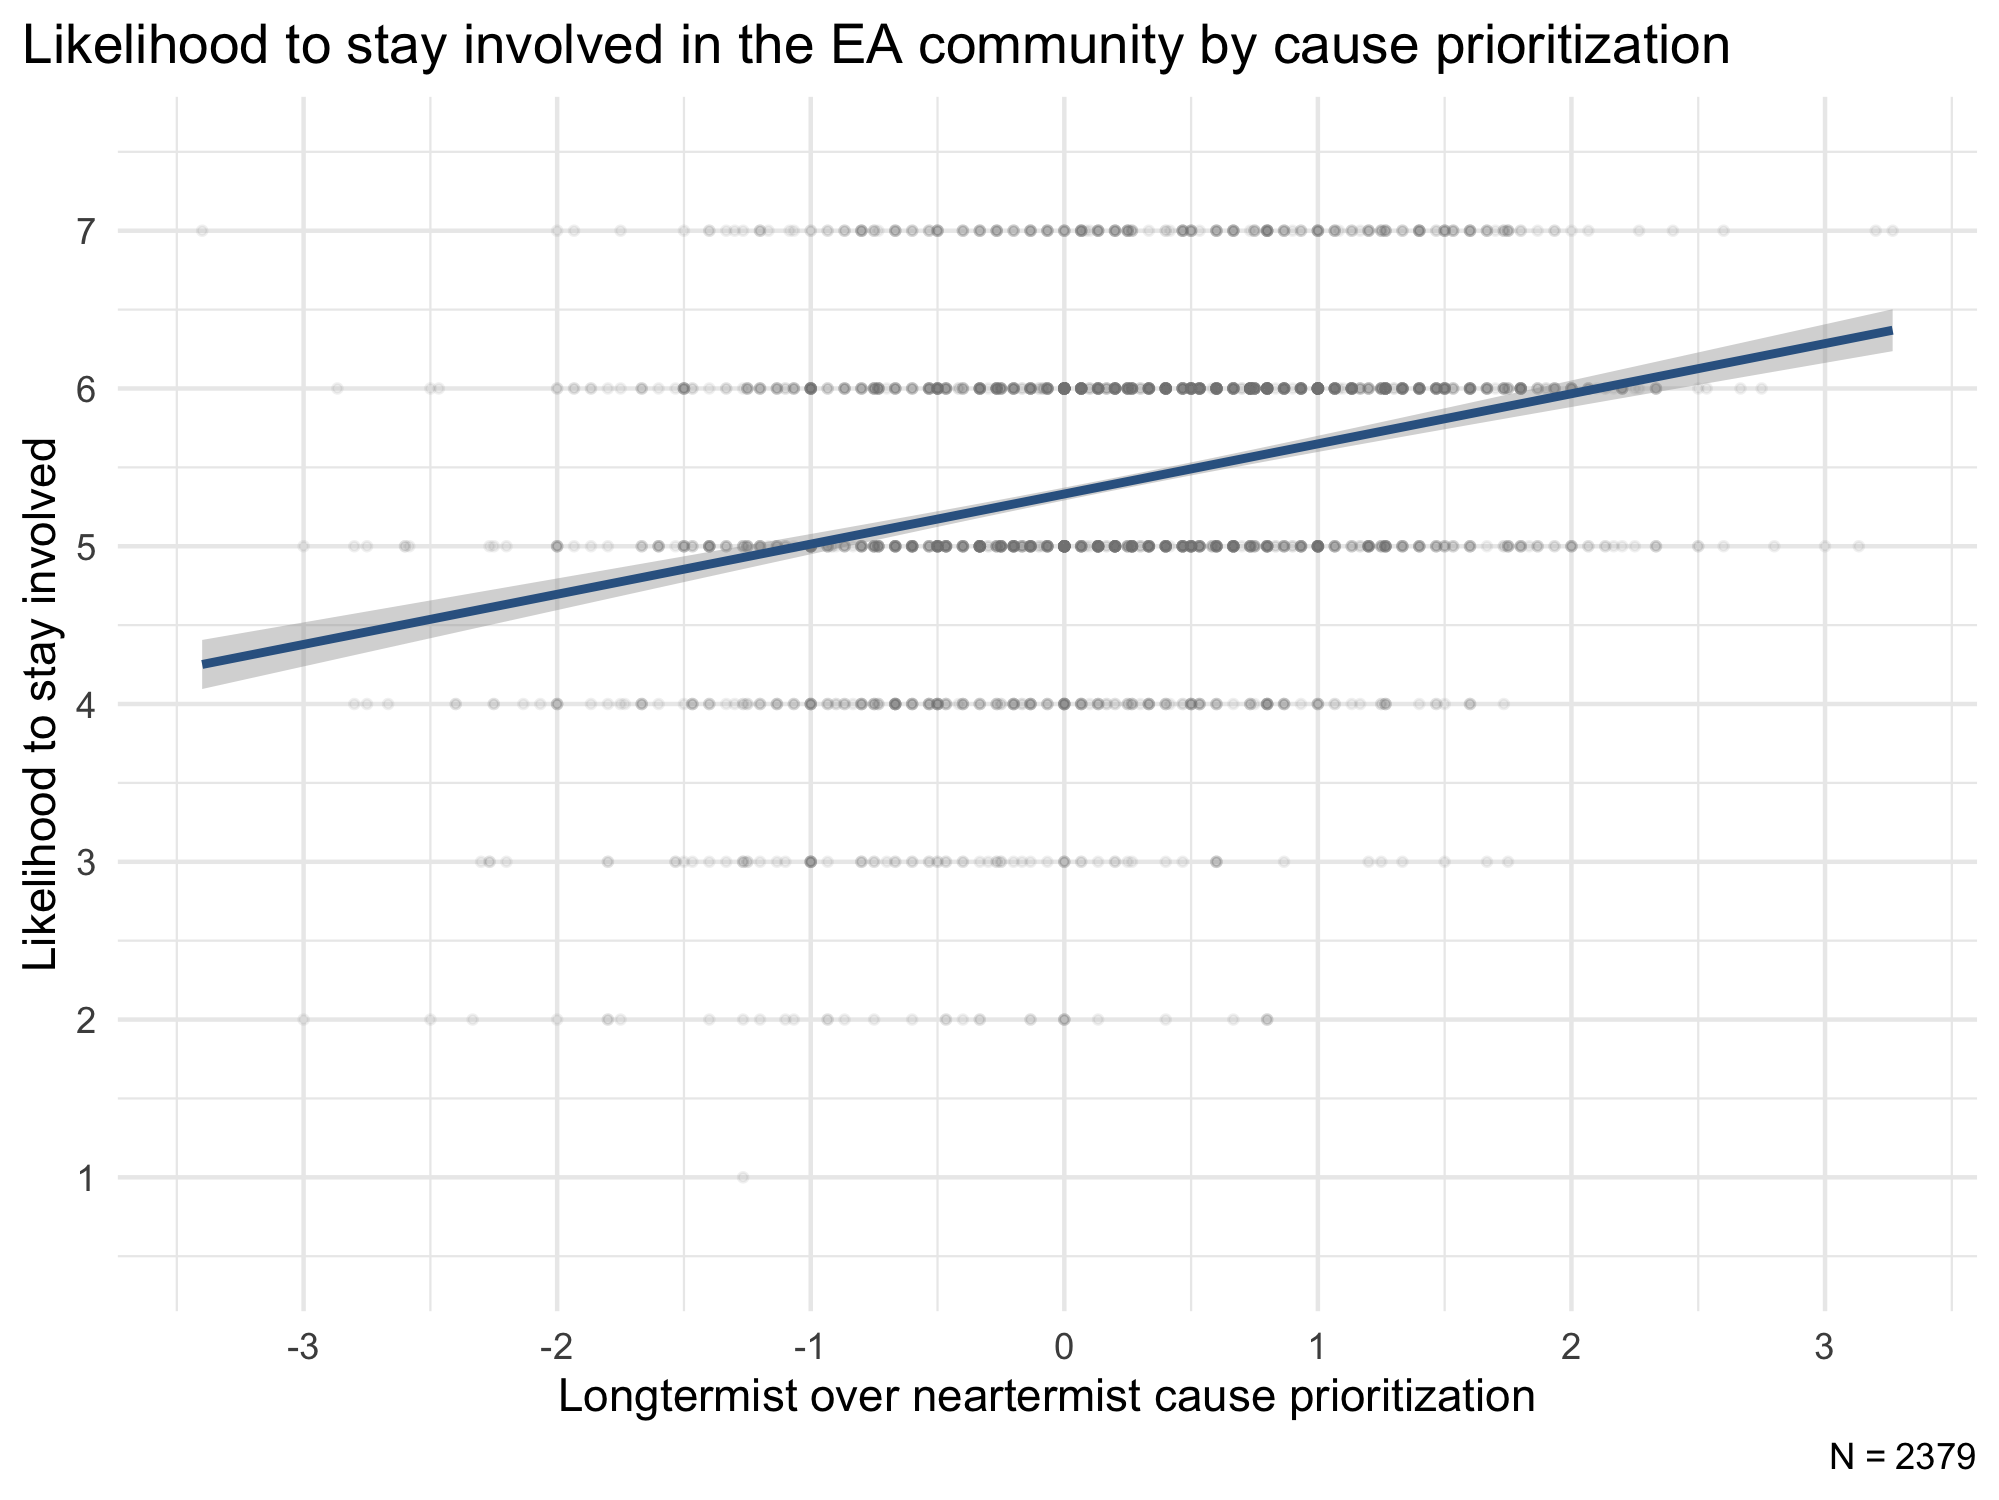
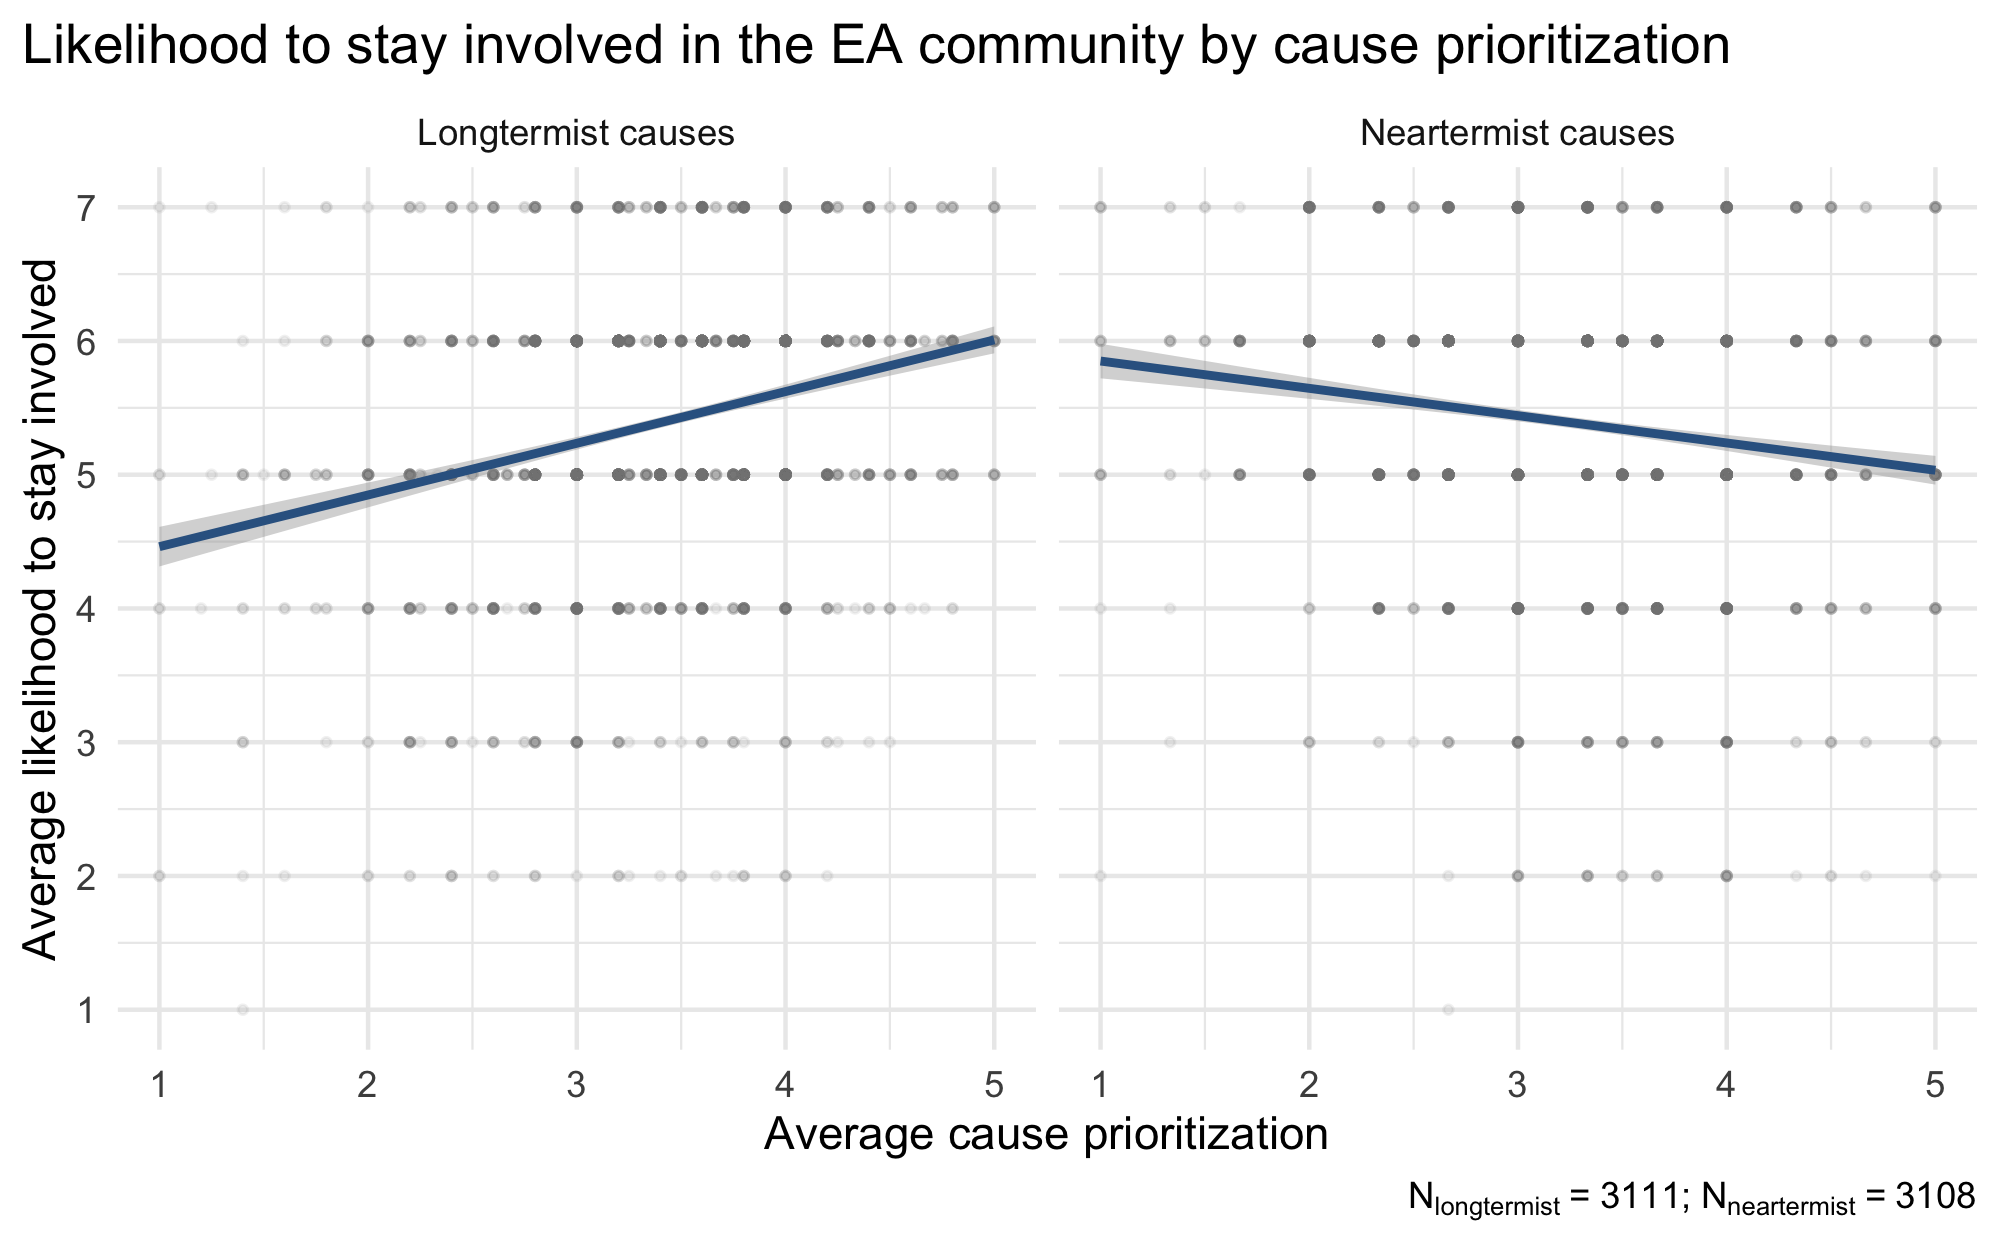
The degree to which respondents endorsed various cause prioritizations was also found to be related to their reported likelihood of staying involved in the EA community. Using our measure of prioritizing longtermist causes over neartermist causes, we again find a positive relationship indicating that respondents who prioritize longtermist causes to a greater extent report being more likely to stay with the community (r = .29, 95% CI [.26 - .33]).
The previously reported differences also remained significantly related to reported likelihood of staying in the EA community in a linear multiple regression that included previously mentioned factors and additional control variables.
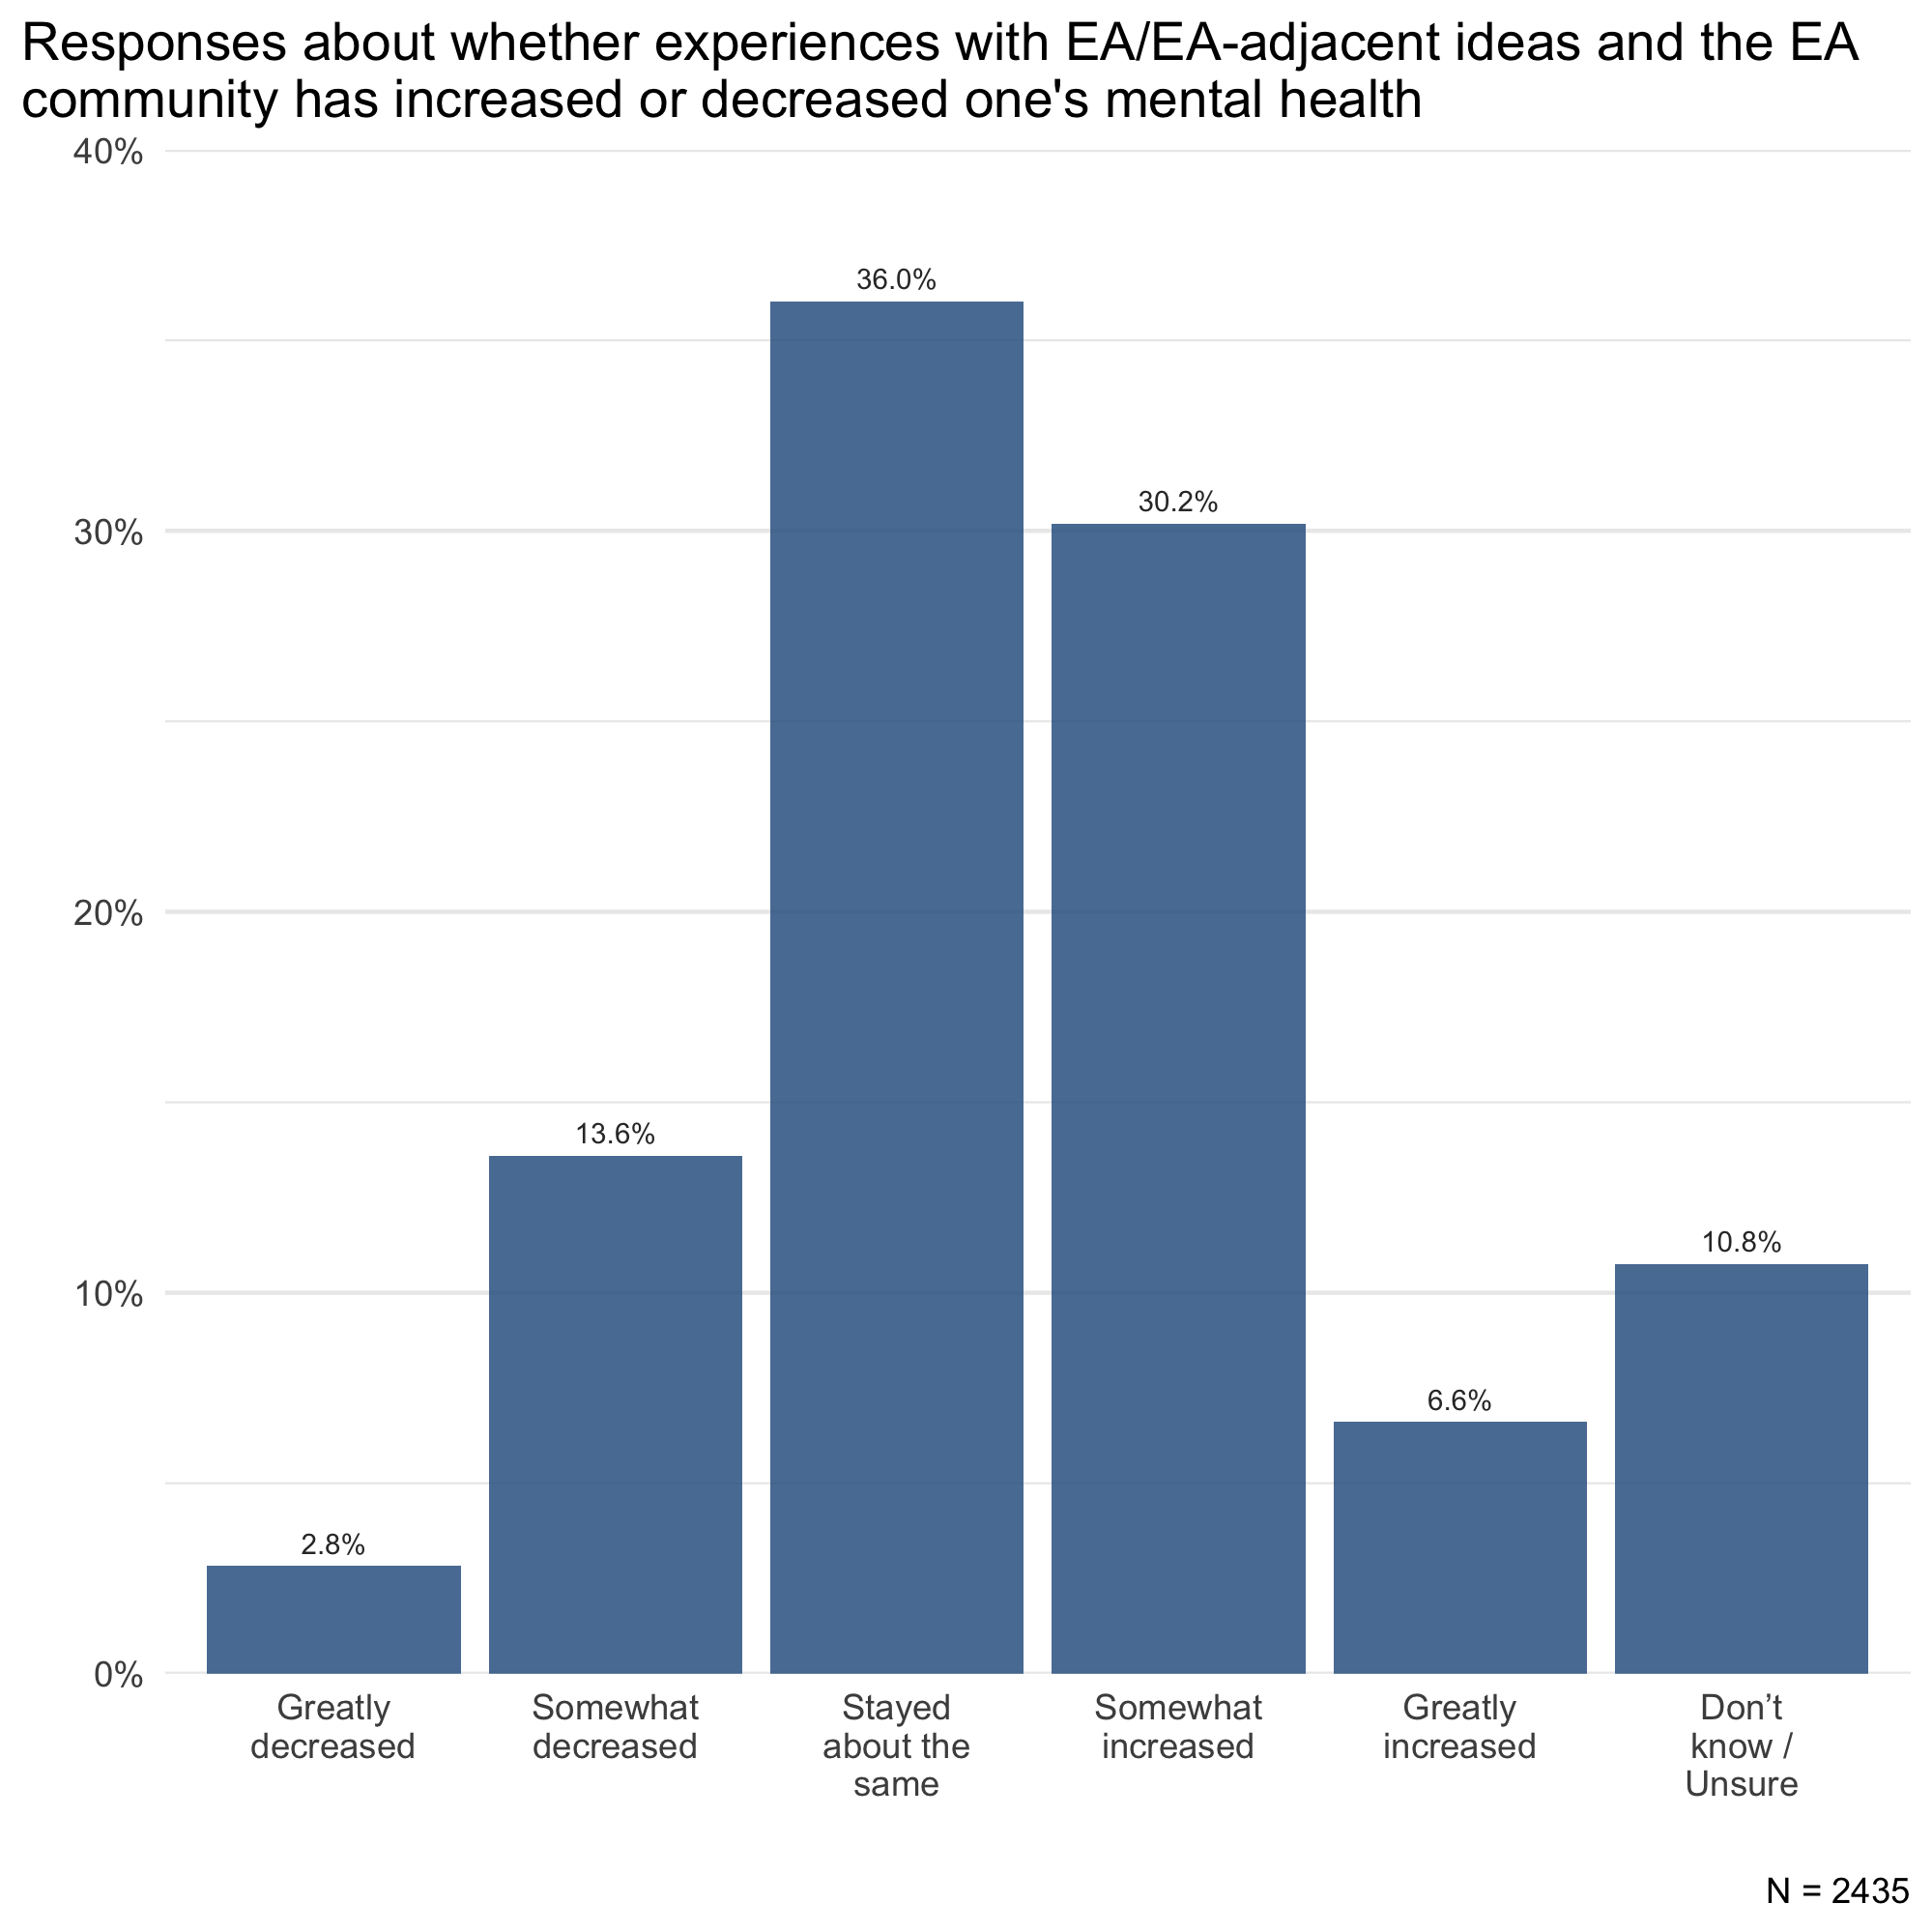
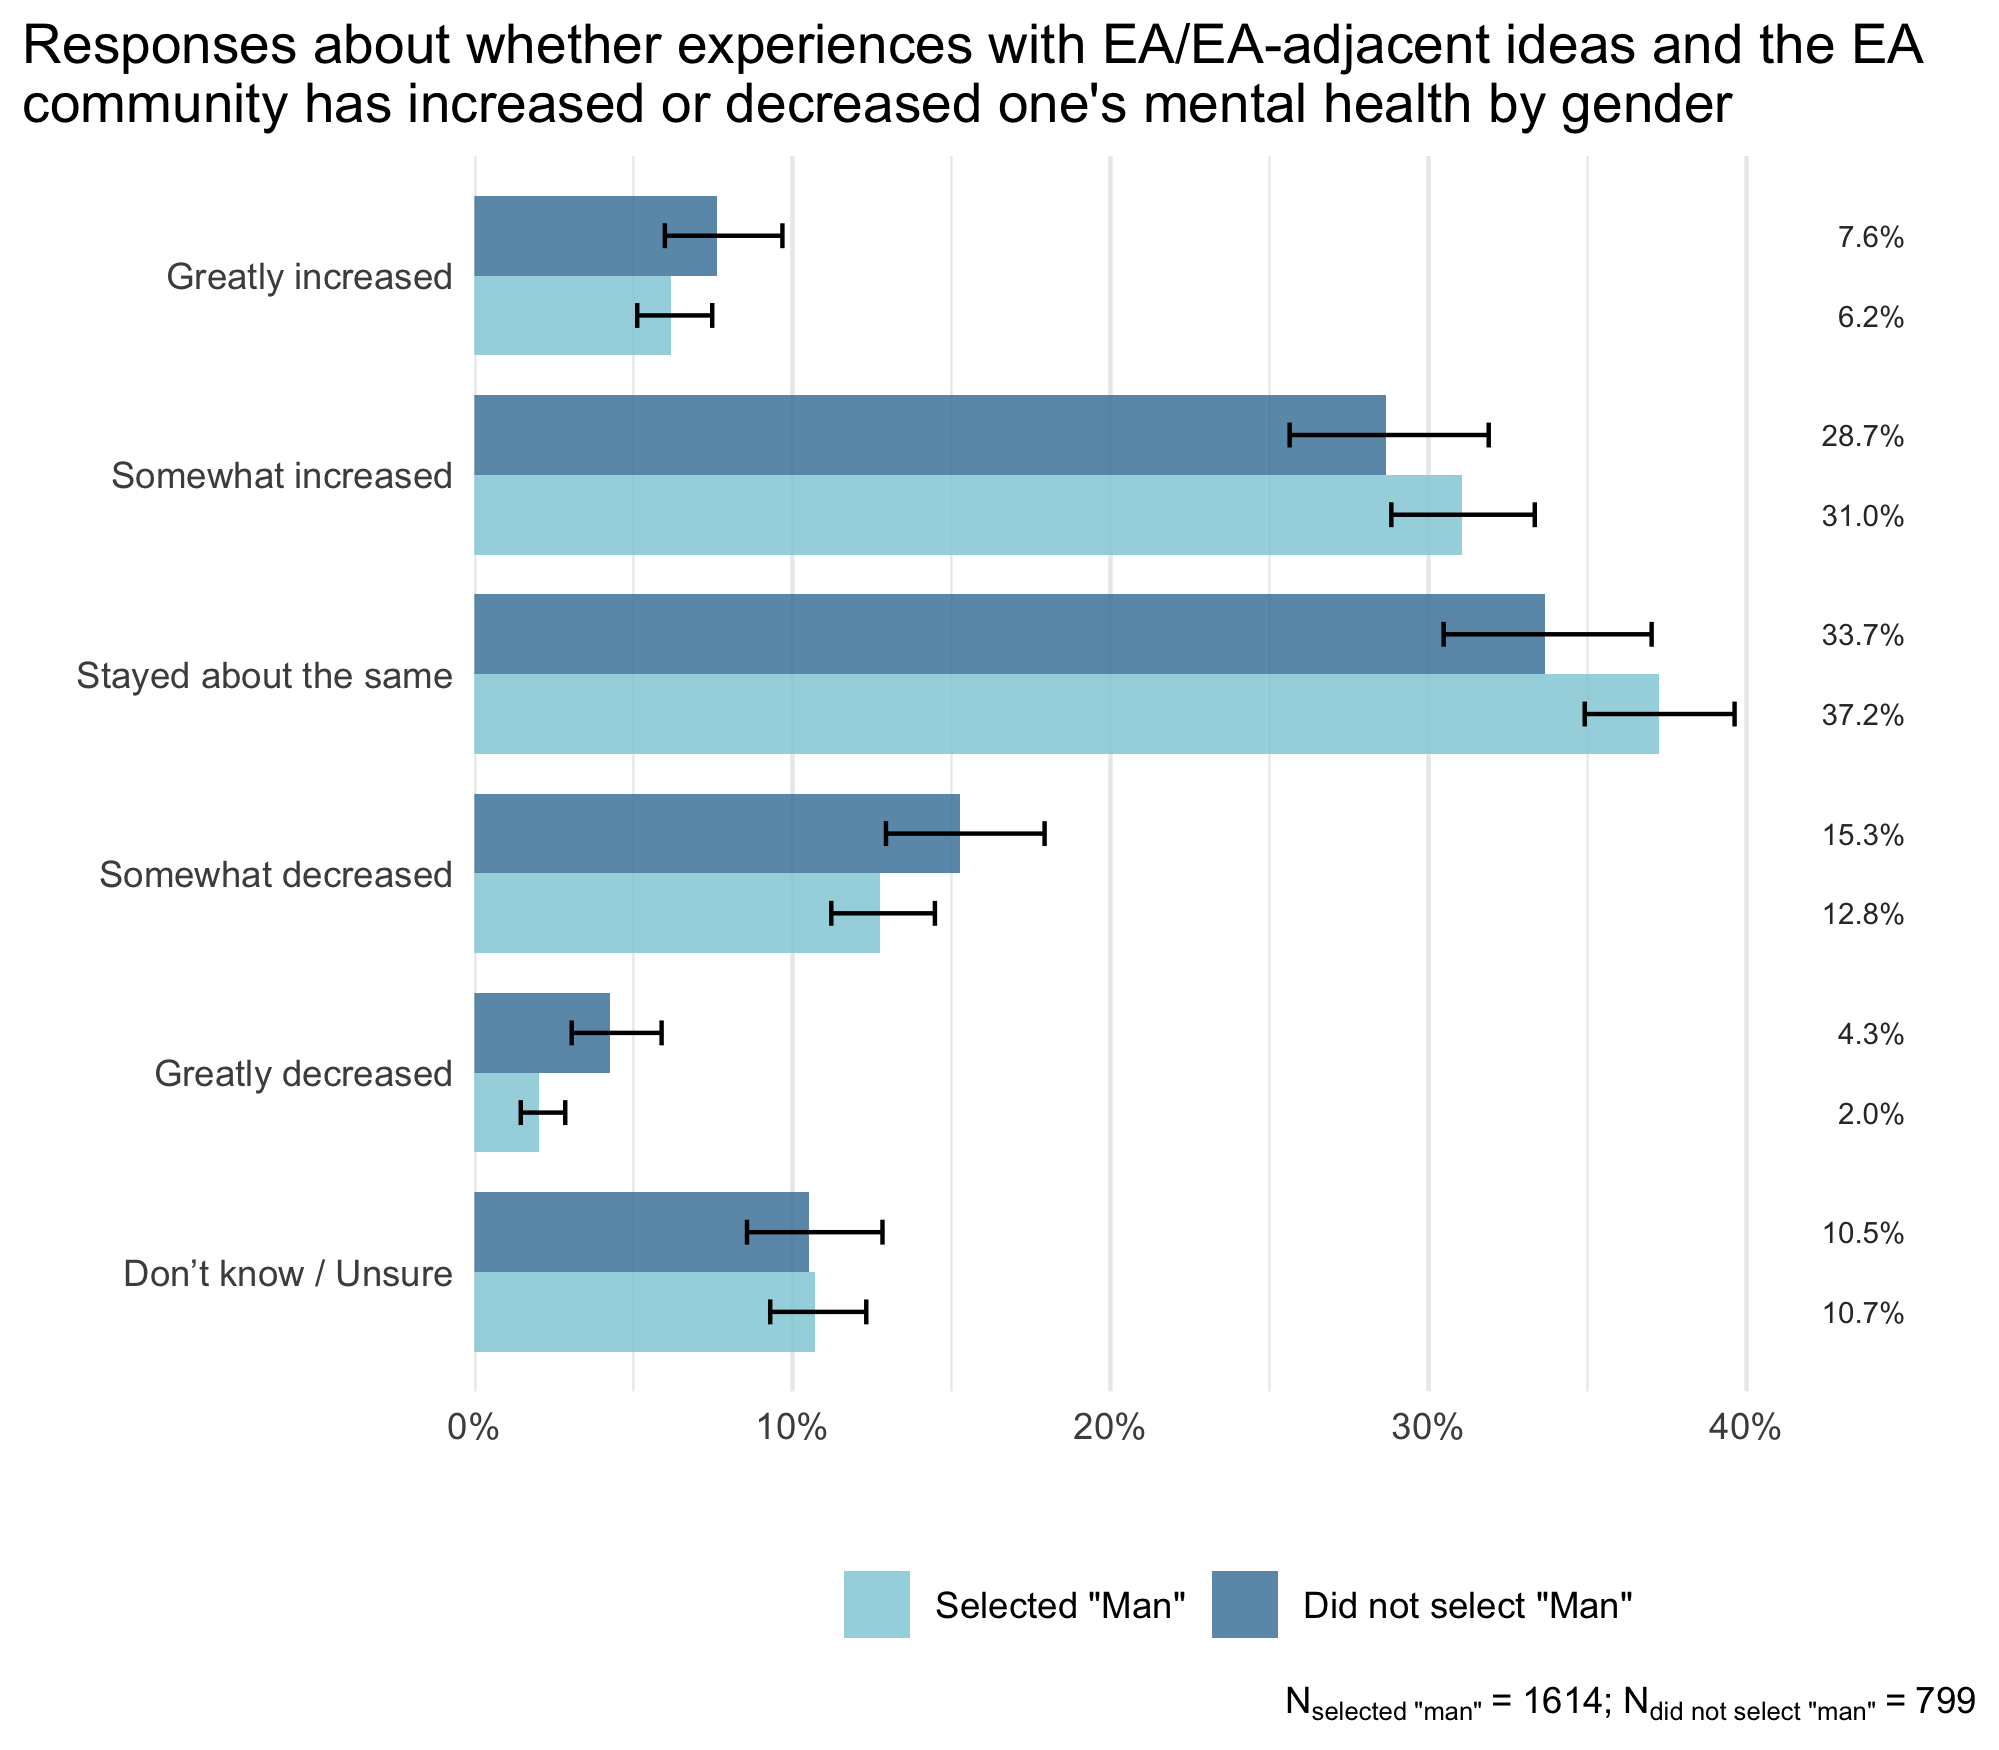
We asked respondents whether experiences with EA/EA-adjacent ideas and the EA community had increased or decreased their mental health. Respondents mostly indicated that their experiences had increased their mental health (36.8%) or that it had remained about the same (36.0%). A smaller group indicated their mental health had somewhat decreased (13.6%) or even greatly decreased (2.8%).
We mainly found no gender differences for the different response options, although we did find that respondents who identified as a man were slightly less likely to report that their mental health had greatly decreased compared to respondents not identifying as a man.
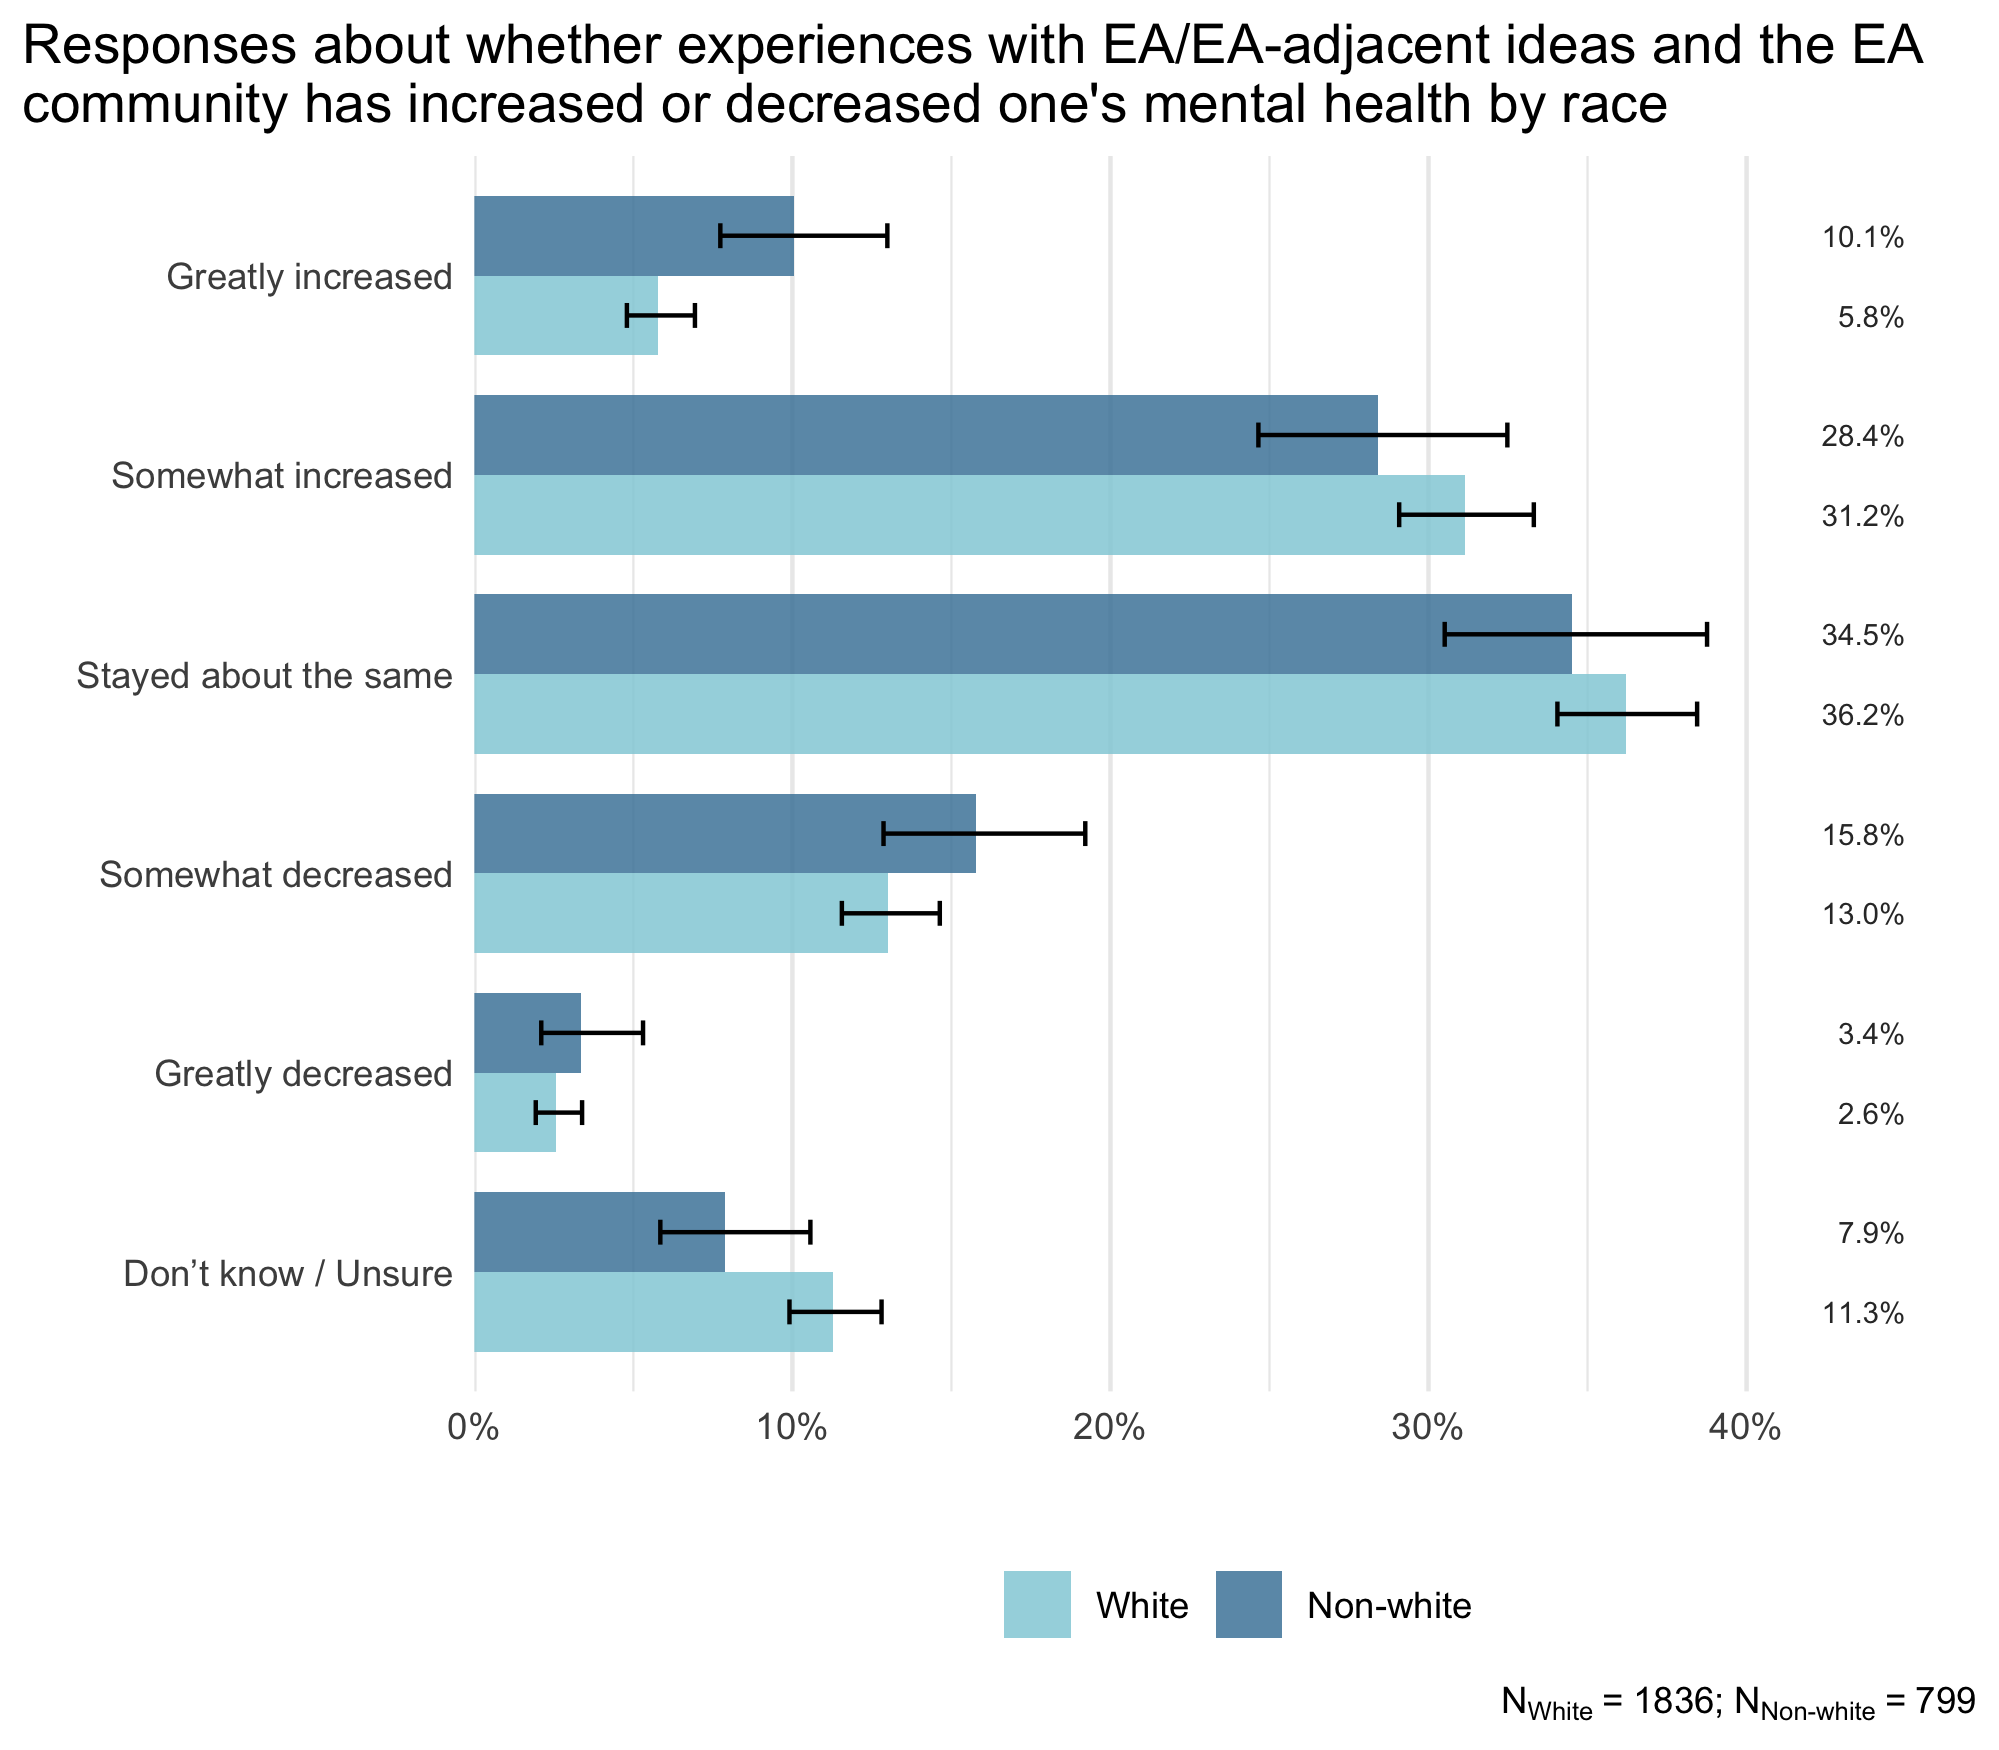
Respondents identifying as white were slightly more likely to report that they don’t know or are unsure about whether experiences with EA had increased or decreased their mental health while respondents not identifying as white were slightly more likely to indicate that their mental health had greatly increased.
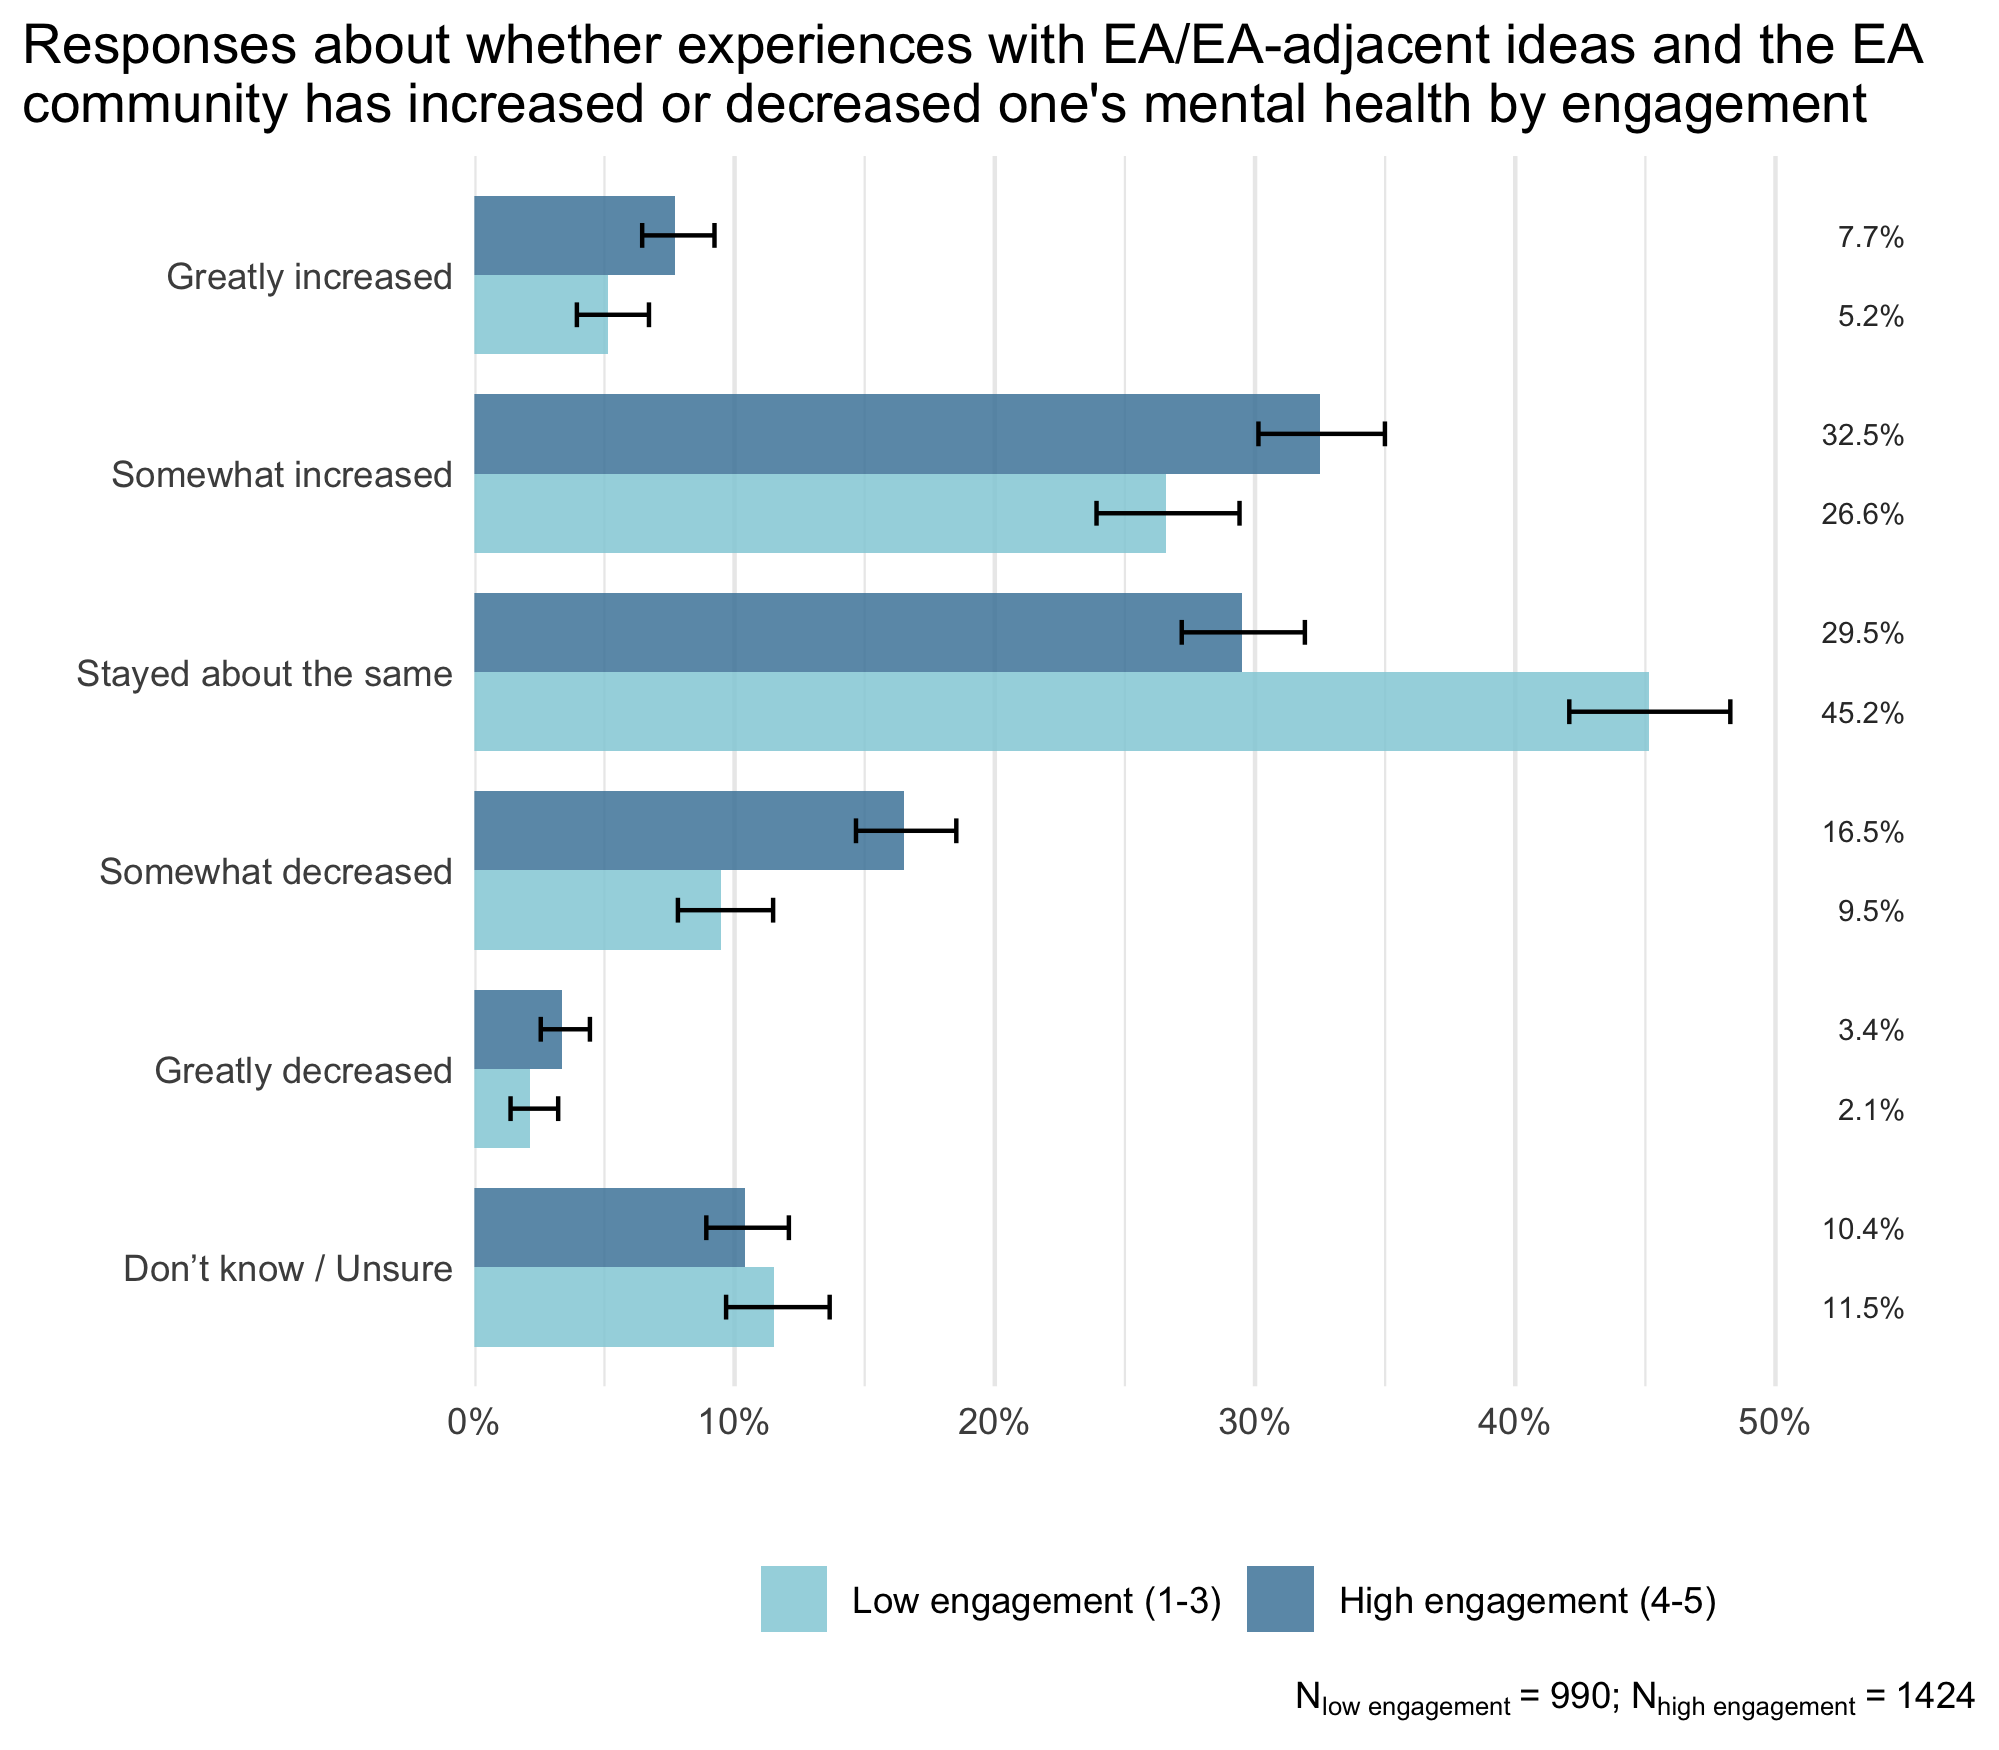
Respondents who were higher in EA engagement were more likely to report both that their mental health had increased or that it had decreased as a result of EA, whereas those lower in engagement were much more likely to report that it had stayed the same.
These plots examine the effect of support for longtermist/neartermist causes separately, rather than using a combined longtermist-minus-neartermist score. While using a single combined score is simpler, as we have discussed before, looking at the effects of the two measures separately is advantageous, since these may have different relationships to the outcome variables of interest, rather than simply being mirror images of each other.
This research is a project of Rethink Priorities. This post was written by Willem Sleegers and David Moss. We would also like to thank Peter Wildeford, Jamie Elsey, Adam Papineau, and David Rhys Bernard for comments.
If you like our work, please consider subscribing to our newsletter. You can see more of our work here.
This group difference and other group differences on EA community satisfaction and likelihood to stay involved in the EA community were analyzed using linear regression as well as ordinal regression. Both types of models produced consistent results.
We also conducted an analysis looking at the prioritization of longtermist and neartermist causes separately (without subtracting the averages). The figures of this analysis can be found in the Appendix.
In addition to gender, racial identity, engagement, and priority of longterm over nearterm causes, we also included age, student status (student/not a student), years in EA, and whether the respondent is from the U.S., similar to the model presented in the previous community information post from 2020. Note that career description was not included because it was not assessed this year.


I appreciate the work you put into this survey and report. I would like to see the breakdown of "non-white" racial identities – I would expect that answers would skew differently based on different racial identities.
I understand there might not be enough data points for each racial identity, but that might just be a sign that we need to work harder at retaining certain people (and encouraging them to fill out surveys!)
Thanks for your question Jessica.
There are no significant differences between the racial categories (unsurprising given the small sample sizes).
Thanks for sharing these data. The y-axes aren't shown so it's difficult to compare these plots, but I think it's interesting that the distribution of community satisfaction for Black or African American people in the EA community seems to stand out in comparison to other groups.
The small sample size definitely makes drawing conclusions difficult (maybe apart from showing that EA skews very white for a movement focused on big global issues!)
Hi Jessica,
Just to clarify the plot a bit: The y-axis is the racial category and in addition to showing each category and their average + 95% CI, I also added histograms to show the underlying distribution of values. This is helpful for assessing whether the average is actually a good summary of the data (not to actually figure out the distribution in and of itself). In this case, it shows that the distribution of community satisfaction for Black or African American people in the EA community looks a bit unusual, with more observations on the lower and higher end. However, the total sample size for this category is only 34. This is quite low so I wouldn't be surprised if the distribution will end up looking differently if the sample size was greater.