Comments
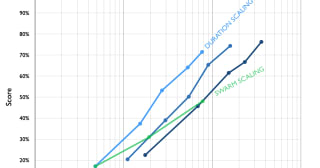
Just how powerful are large swarms of AI agents? And how do their powers scale as more and more agents are added to the swarm?
We’ve seen two large and extremely capable swarms from OpenAI in the last few months:
* 1,200 agents were being evaluated separately, but found a way to illicitly set up a message board and coordinate as a swarm. In order to cheat on their tests, they developed advanced techniques to prevent their actions being logged by OpenAI and 700 of them launched...


What if the dot (representing where we are) was further to the left? In that case, it's not so clear that we want to speed through and incur the increased risk.
The idea is that by speeding through you increase risk initially, but the total risk is lower - i.e. smaller area under the grey curve here:
I think this probably breaks down if the peak is high enough though (here I'm thinking of AGI x-risk). Aschenbrenner gives the example of:
And argues that
I'm not sure if this applies if there is some possibility of "pulling the curve sideways" to flatten it - i.e. increase the fraction of resources spent on safety whilst keeping consumption (or growth) constant. This seems to be what those concerned with x-risk are doing for the most part (rather than trying to slow down growth).
That graph represents the comparison of increased growth (gray line) to some baseline (black).
Instead, I'm talking about the case where the dot is at the far left side of the graph: we're currently at a low level of risk, and continuing at the baseline growth rate means 'climbing the risk mountain' before we get to the other side with lower risk. If the peak is very high (relative to the dot), then it's not clear that continued (or accelerated) growth is optimal; stagnation might be better.