In this post, I compared forecasts from Ajeya Cotra and from forecasters in the Existential Risk Persuasion Tournament (XPT) relating to some of the inputs to Cotra’s biological anchors model.
Here, I give my personal take on which of those forecasts seem more plausible.
Note that:
- I’m only considering the inputs to the bio anchors model which we have XPT forecasts for. This notably excludes the 2020 training requirements distribution, which is a very important driver of model outputs.
- My take is based on considering the explicit arguments that Cotra and the XPT forecasters gave, rather than on independent research.
- My take is subjective.
- I’ve been working with the Forecasting Research Institute (who ran the XPT) since November 2022, and this is a potential source of bias.
- I’m publishing this post in a personal capacity and it hasn’t gone through FRI’s review process.
- I originally wrote this early in 2023. I've tried to update it as new information came out, but I likely haven't done a comprehensive job of this.
To recap, here are the relevant forecasts:
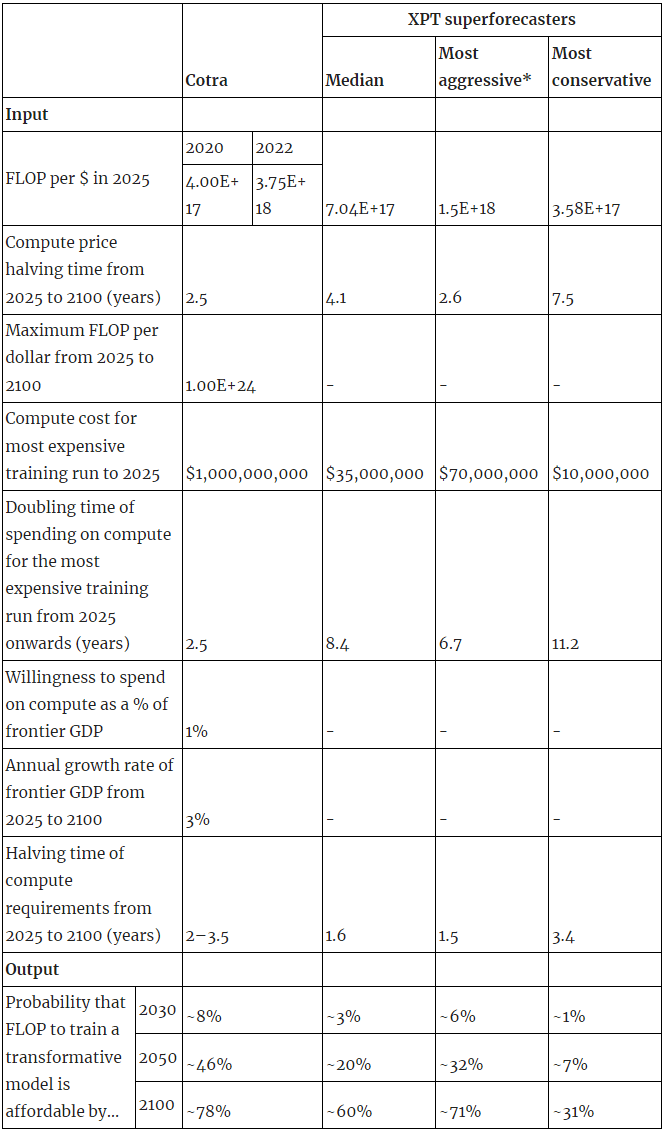
See workings here and here.
*The 'most aggressive' and 'most conservative' forecasts can be considered equivalent to 90% confidence intervals for the median estimate.
Hardware
- For FLOP/$ in 2025, I think both Cotra and the XPGT forecasters are wrong, but Cotra will prove more right.
- Epoch’s current estimate of highest GPU price-performance is 4.2e18 FLOP per $.
- They also find a trend in GPU price-performance of 0.1 OOM/year for state of the art GPUs. So I’ll extrapolate 4.2e18 to 5.97E+18.
- For compute price halving time to 2100, I think it depends how likely you think it is that novel technologies like optical computing will reduce compute prices in future.
- This is the main argument Cotra puts forward for expecting such low prices.
- It’s an argument made in XPT too, but less weight is put on it.
- Counterarguments given in XPT: fundamental physical limits, progress getting harder, rare materials capping how much prices can drop, catastrophe/extinction, optimisation shifting to memory architectures.
- Cotra mentions some but not all of these (she doesn’t mention rare materials or memory architectures).
- Cotra flags that she thinks after 2040 her forecasts on this are pretty unreliable.
- But, because of how wrong their 2024 and 2030 forecasts seem to be, I’m not inclined to put much weight on XPT forecasts here either.
- I’ll go with the most aggressive XPT figure, which is close to Cotra’s.
- I don’t have an inside view on the likelihood of novel technologies causing further price drops.
- Note that the disagreement about compute price halving times drives a lot of the difference in model output.
Willingness to spend
- On the most expensive training run by 2025, I think Cotra is a bit too aggressive and XPT forecasters are much too conservative.
- In 2022, Cotra updated downwards a bit on the likelihood of a $1bn training run by 2025.
- There isn’t much time left for Cotra to be right.
- Cotra was predicting $20m by the end of 2020, and $80m by the end of 2021.
- GPT-3 was $4.6m in 2020. If you buy that unreleased proprietary models are likely to be 2-8x more expensive than public ones (which Cotra argues), that XPT forecasters missed this consideration, and that GPT-3 isn’t proprietary and/or unreleased (flagging because I’m unsure what Cotra actually means by proprietary/unreleased), then this could be consistent with Cotra’s forecasts.
- Epoch estimates that GPT-4 cost $50m to train at some point in 2022.
- Again, this could be in line with Cotra’s predictions.
- More importantly, GPT-4 costs make XPT forecasters look quite wrong already - their 2024 prediction was surpassed in 2022. This is especially striking in the context of:
- XPT forecasters making their predictions three years after Cotra made hers.
- The possibility that at a given time unreleased models might be 2-8x more expensive than the most expensive released model.
- It seems to me that both Cotra and XPT forecasters will probably end up wrong, but that XPT forecasters will be much more wrong.
- I’ll somewhat arbitrarily pick halfway between Cotra’s conservative estimate ($300m) and her $1bn forecast for my best guess - so $650m.
- On the doubling time of spending on compute, I lean towards Cotra over XPT.
- I feel a bit confused about how Cotra gets her 2.5 year doubling time, but I think it rests on:
- Assuming $1bn in 2025 and the incentive of building a transformative model.
- Getting a doubling time from 2025-2040 of 2 years, by estimating how much companies would be willing to spend on a project overall, and then ratios of overall spending to spending on compute for final training runs.
- Then assuming that growth slows down, hitting a cap at 1% of GDP and eventually syncing up with the GDP growth rates of the largest national economy, which Cotra estimates at 3%.
- My main reaction to this is that there are lots of assumptions here and therefore many ways that it could turn out wrong.
- I feel disagreement on some specific points, though I’m not sure how much of Cotra’s 2.5 year doubling time is based on these things:
- $1bn in 2025 seems too high (see above).
- There being a transparent incentive of building a transformative model seems like an upper bound, not a median estimate to me.
- Using Manhattan/Apollo projects as anchors for 2100 also seems like an upper bound to me:
- It’s possible that we’d get a huge countrywide effort like this, but also possible that governments don’t get involved in this way.
- For a company to spend 1% of GDP you’d need loads of concentration of wealth - which might happen, or might not.
- I agree that it seems unlikely to be higher than that - but my median guess would be lower.
- But, because of how wrong their 2024 and 2030 forecasts seem to be, I’m inclined to basically ignore XPT forecasts here.
- I’ll extend Cotra’s doubling time a bit, because I have a few arguments for slower doubling times, to 3 years.
- Note that the disagreement about spending on compute doubling times drives a lot of the difference in model output (it’s the single biggest driver of difference among the inputs we have XPT forecasts for).
Algorithmic progress
- I think comparability here is low ish.
- XPT forecasters were asked by what factor training efficiency on ImageNet classification would improve by 2024 and 2030. Extrapolating this to a halving time for the compute required for TAI which holds till 2100 seems like a bit of a stretch.
- That said, Cotra is substantially basing her forecasts on past trends on specific benchmarks, so I still think the XPT forecasts should be viewed as somewhat indicative.
- One of the reviewers of our post on these results (Daniel Kokotajlo) pointed out that this 2022 Erdil and Besiroglu paper shows that efficiency has been improving faster than the 2020 Hernandez and Brown paper Cotra based her forecasts on suggest - halving every 9 months, as opposed to every 13-16 months. That’s a decrease in halving time by around 30%.
- Cotra further bumps up the 13-16 month estimate from Hernandez and Brown, arguing that progress on narrow tasks which can be directly optimized for is likely to be faster than TAI progress.
- Kokotajlo offered an argument in the other direction: estimating algorithmic improvements using quantitative improvements on existing benchmarks only fails to take into account qualitative improvements where whole new capabilities emerge.
- Without having looked into it, I expect the magnitude of the effect from Cotra’s argument to be bigger than the effect from Kokotajlo’s argument - but it still makes me want to bump down Cotra’s forecasts a bit.
- My best guess is to bump Cotra’s forecasts down by 35%, which gives me a halving time of 1.3-2.3 years, depending on the anchor.
My best guess
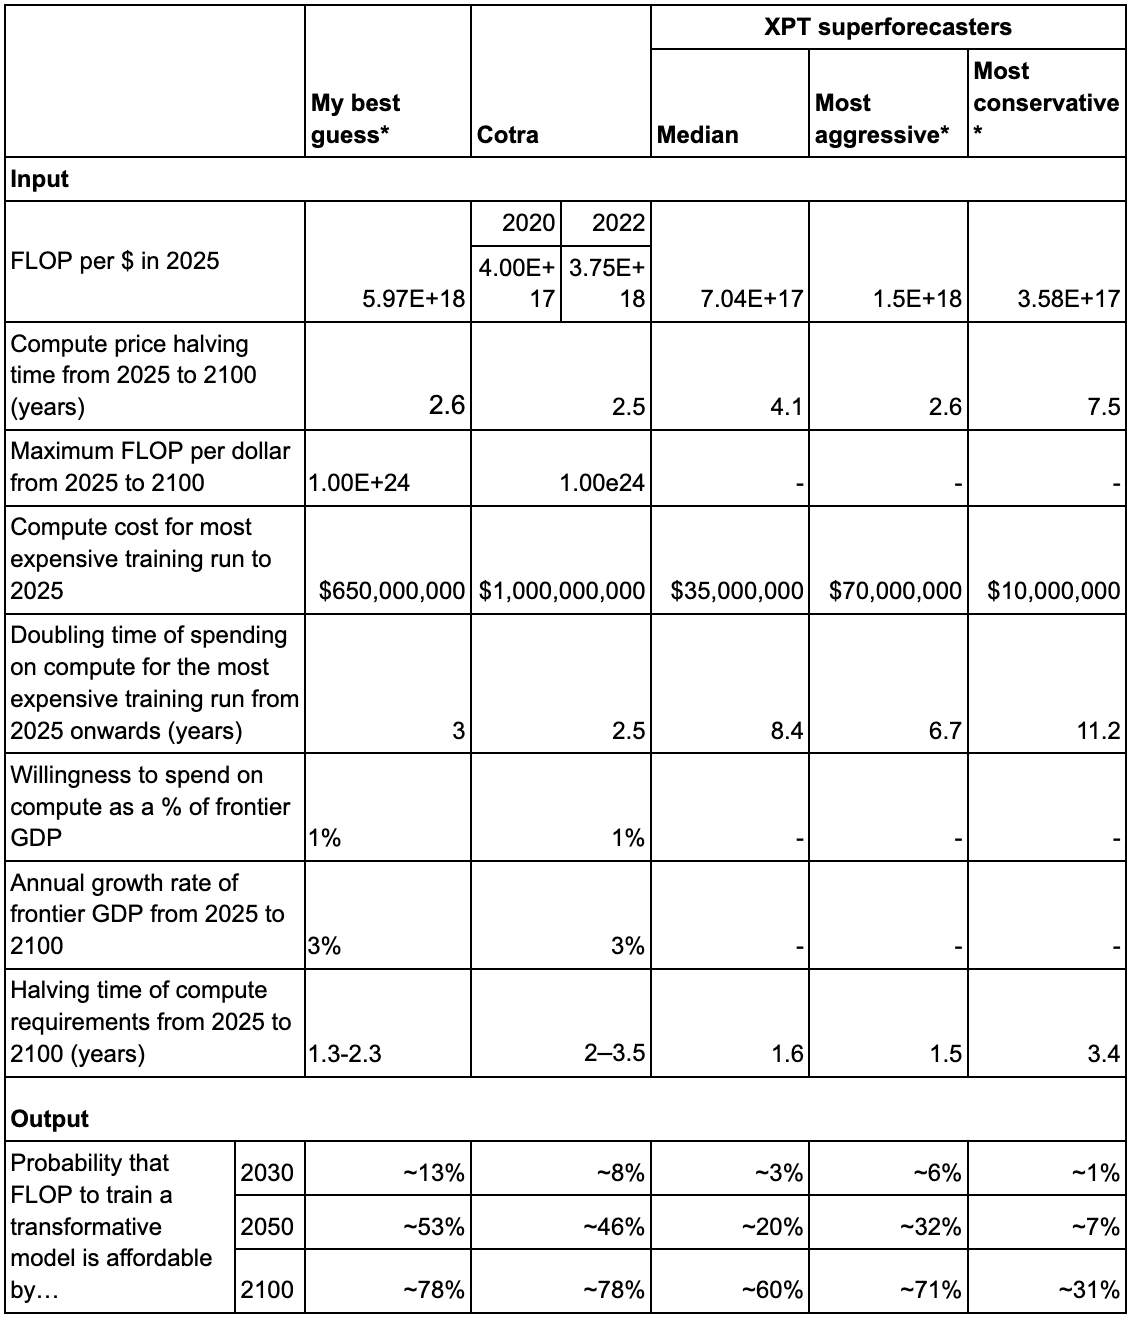
* See workings here.
Where this leaves me
- I expect that sometimes the XPT forecasts will be closer to the truth, and sometimes Cotra’s will be.
- Specifically, I expect Cotra to be more right on:
- FLOP per $ in 2025
- Compute price halving time from 2025 to 2100
- Compute cost for most expensive training run to 2025
- Doubling time of spending on compute for the most expensive training run to 2025 (years)
- And XPT forecasters to be more right on:
- Halving time of compute requirements from 2025 to 2100 (years)
- The net effect of my best guess inputs is an output that’s slightly more aggressive than Cotra’s original model output.
- I don’t think I can conclude from this ‘53% by 2050 is roughly my TAI timeline’, for a few reasons:
- I haven’t considered all of the inputs to Cotra’s model, most notably the 2020 training computation requirements distribution. Without forming a view on that, I can’t really say that ~53% represents my overall view.
- I feel pretty uncertain about this sort of modeling in general. It feels very sensitive to assumptions and inputs. If it were really hard to get the model to put any significant probability on TAI this century, I’d take that as an update (similarly with the model making TAI soon look very very likely). But for most middling values I’m not personally inclined to base too much on them.


Sorry to bang on about this again and again, but it's important to repeat for the benefit of those who don't know: The training computation requirements distribution is by far the biggest cruxy input to the whole thing; it's the input that matters most to the bottom line and is most subjective. If you hold fixed everything else Ajeya inputs, but change this distribution to something I think is reasonable, you get something like 2030 as the median (!!!) Meanwhile if you change the distribution to be even more extreme than Ajeya picked, you can push timelines arbitrarily far into the future.
Investigating this variable seems to have been beyond scope for the XPT forecasters, so this whole exercise is IMO merely that -- a nice exercise, to practice for the real deal, which is when you think about the compute requirements distribution.
Don't apologise, think it's a helpful point!
I agree that the training computation requirements distribution is more subjective and matters more to the eventual output.
I also want to note that while on your view of the compute reqs distribution, the hardware/spending/algorithmic progress inputs are a rounding error, this isn't true for other views of the compute reqs distribution. E.g. for anyone who does agree with Ajeya on the compute reqs distribution, the XPT hardware/spending/algorithmic progress inputs shift median timelines from ~2050 to ~2090, which is quite consequential. (See here)
For someone like me, who hasn't thought about the compute reqs distribution properly, I basically agree that this is just an exercise (and in isolation doesn't show me much about what my timelines should be). But for those who have thought about it, the XPT inputs could either not matter at all (e.g. for you), or matter a lot (e.g. for someone with Ajeya's compute reqs distribution).
It's the crux between you and Ajeya, because you're relatively more in agreement on the other numbers. But I think that adopting the xpt numbers on these other variables would slow down your own timelines notably, because of the almost complete lack of increase in spending.
That said, if the forecasters agreed with your compute requirements, they would probably also forecast higher spending.
The XPT forecasters are so in the dark about compute spending that I just pretend they gave more reasonable numbers. I'm honestly baffled how they could be so bad. The most aggressive of them thinks that in 2025 the most expensive training run will be $70M, and that it'll take 6+ years to double thereafter, so that in 2032 we'll have reached $140M training run spending... do these people have any idea how much GPT-4 cost in 2022?!?!? Did they not hear about the investments Microsoft has been making in OpenAI? And remember that's what the most aggressive among them thought! The conservatives seem to be living in an alternate reality where GPT-3 proved that scaling doesn't work and an AI winter set in in 2020.
UPDATE: Apparently I was wrong in the numbers here, I was extrapolating from Rose's table in the OP but I interpreted "to" as "in" and also the doubling time extrapolation was Rose's interpolation rather than what the forecasters said. The 95% most aggressive forecaster prediction for most expensive training run in 2030 was actually $250M, not $140M. My apologies! Thanks to Josh Rosenberg for pointing this out to me.
(To be clear, I think my frustration with the XPT forecasters was still basically correct, if a bit overblown; $250M is still too low and the 50th percentile forecaster thought 2030's most expensive run would only be $100M, which is not that far off from the most expensive run that had already happened at the time of the forecast being made.)
Perhaps this should be a top-level comment.
Remember these predictions were made in summer 2022, before ChatGPT, before the big Microsoft investment and before any serious info about GPT-4. They're still low, but not ridiculous.
Fair, but still: In 2019 Microsoft invested a billion dollars in OpenAI, roughly half of which was compute: Microsoft invests billions more dollars in OpenAI, extends partnership | TechCrunch
And then GPT-3 happened, and was widely regarded to be a huge success and proof that scaling is a good idea etc.
So the amount of compute-spending that the most aggressive forecasters think could be spent on a single training run in 2032... is about 25% as much compute-spending as Microsoft gave OpenAI starting in 2019, before GPT-3 and before the scaling hypothesis. The most aggressive forecasters.
Do you have a write-up of your beliefs that lead you to 2030 as your median?
No, alas. However I do have this short summary doc I wrote back in 2021: The Master Argument for <10-year Timelines - Google Docs
And this sequence of posts making narrower points: AI Timelines - LessWrong
Also, if you do various searches on LW and Astral Codex Ten looking for comments I've made, you might see some useful ones maybe.