Fair enough! My guess is that when the trend breaks it will be because things have gone super-exponential rather than sub-exponential (some discussion here) but yeah, I agree that this could happen!
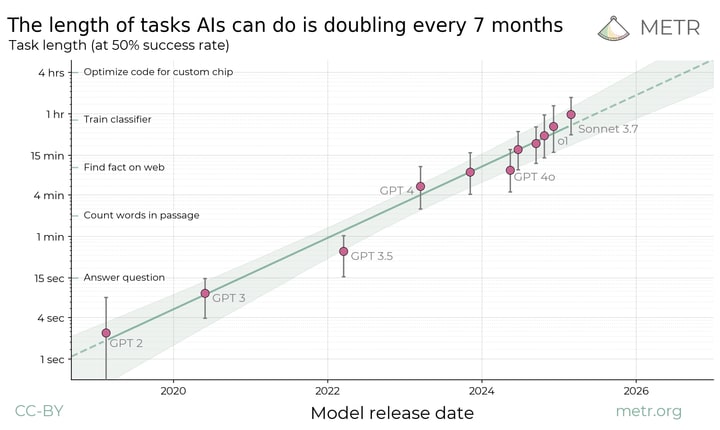
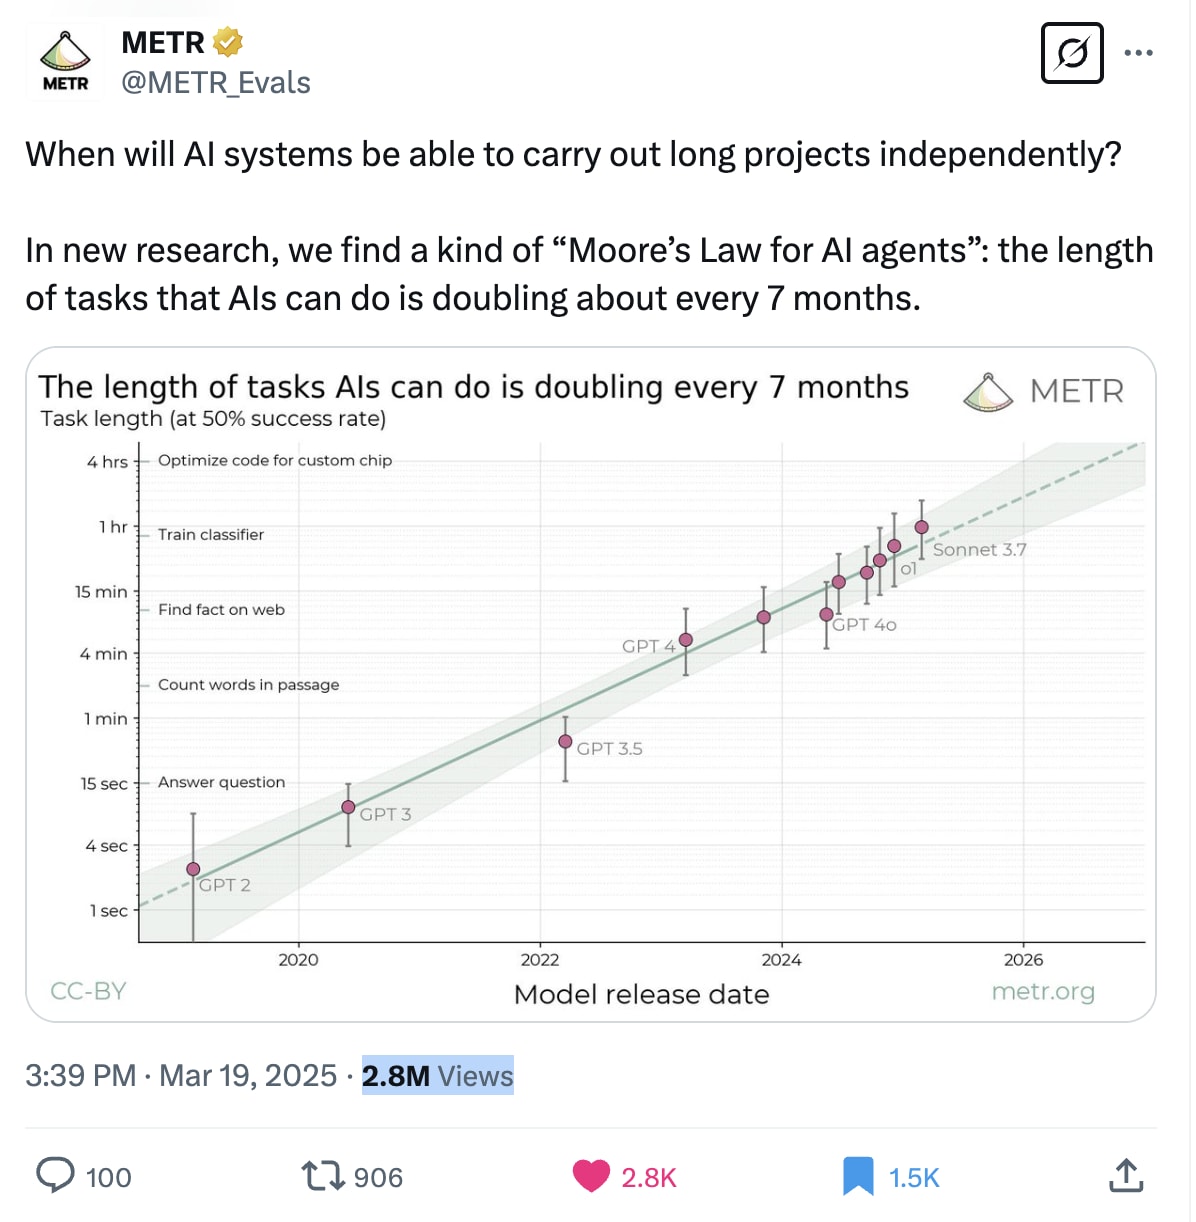
Summary: We propose measuring AI performance in terms of the length of tasks AI agents can complete. We show that this metric has been consistently exponentially increasing over the past 6 years, with a doubling time of around 7 months. Extrapolating this trend predicts that, in under a decade, we will see AI agents that can independently complete a large fraction of software tasks that currently take humans days or weeks.
The length of tasks (measured by how long they take human professionals) that generalist frontier model agents can complete autonomously with 50% reliability has been doubling approximately every 7 months for the last 6 years. The shaded region represents 95% CI calculated by hierarchical bootstrap over task families, tasks, and task attempts.
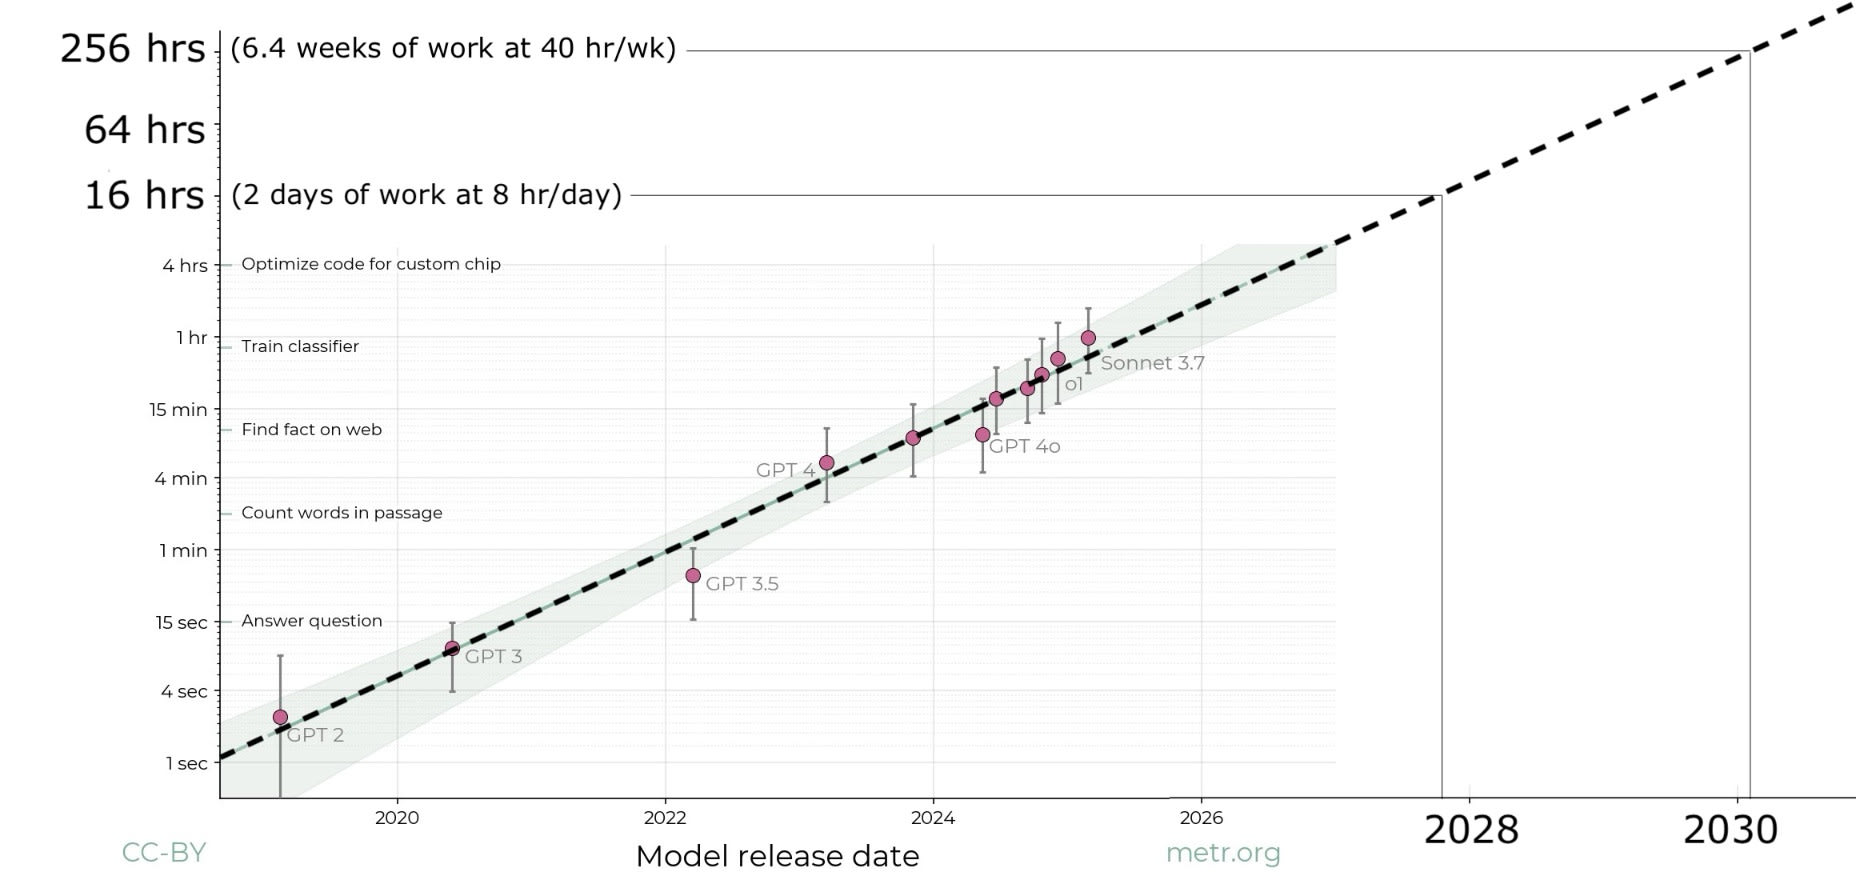
On the one hand, this seems like not much (shouldn’t AGIs be able to hit ‘escape velocity’ and operate autonomously forever?), but on the other, being able to do a month’s worth of work coherently would surely get us close to recursive self-improvement.
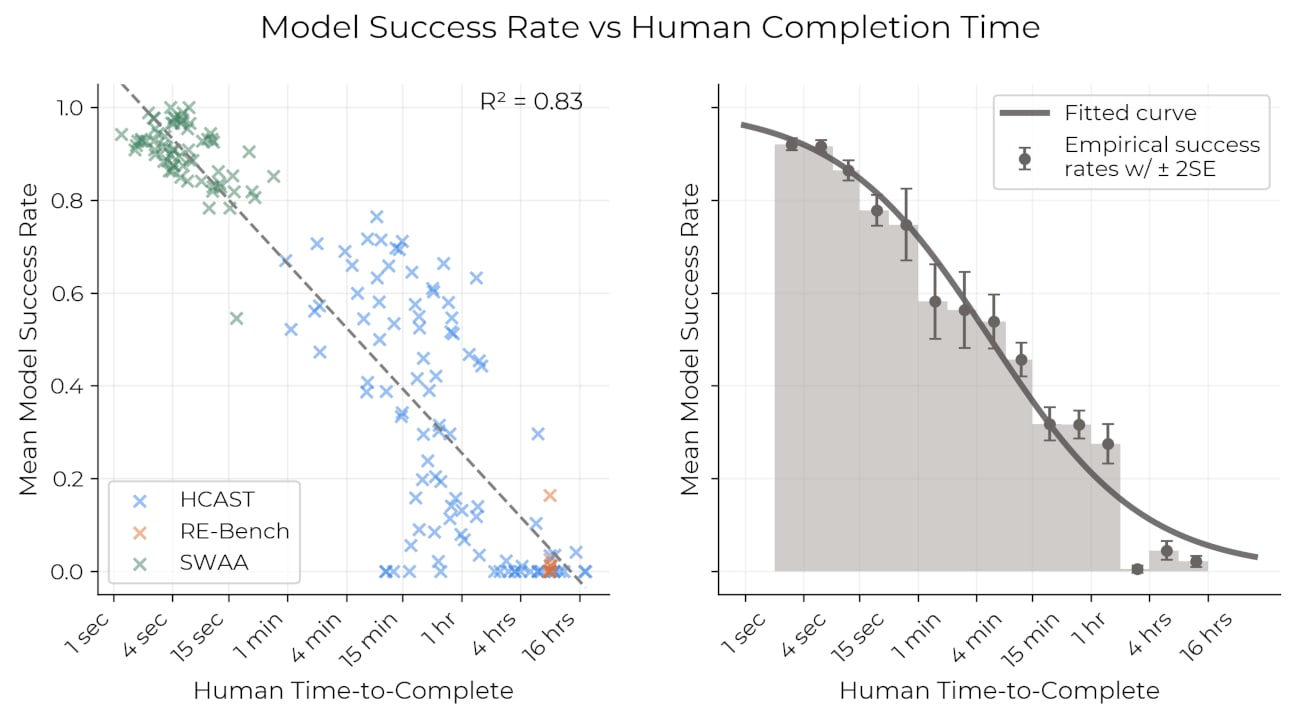
Remember that this is graphing the length of task that the AI can do with an over 50% success rate. The length of task that an AI can do reliably is much shorter than what is shown here (you can look at figure 4 in the paper): for an 80% success rate it's 30 seconds to a minute.
Being able to do a months work of work at a 50% success rate would be very useful and productivity boosting, of course, but it would really be close to recursive self improvement? I don't think so. I feel that some part of complex projects needs reliable code, and that will always be a bottleneck.
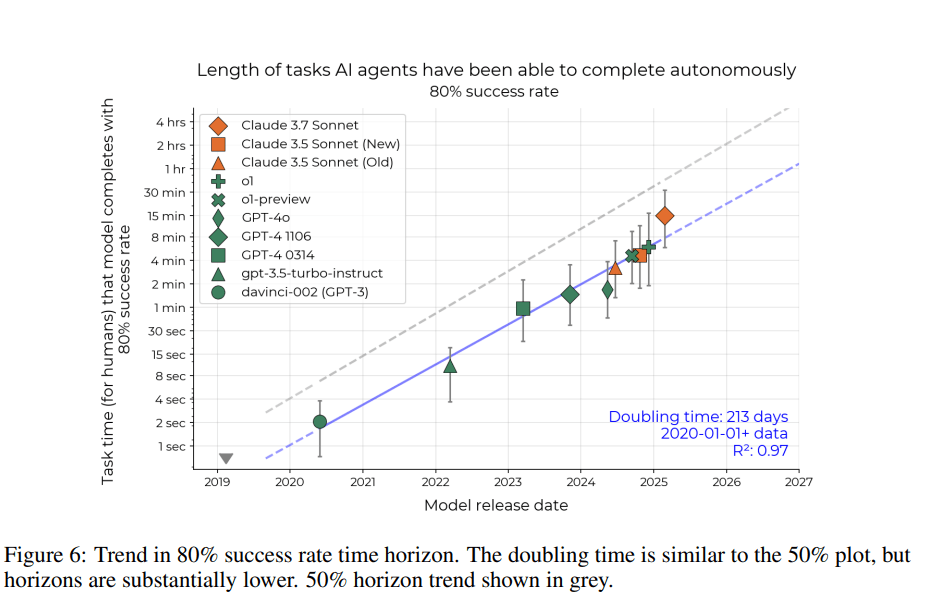
Figure four averages across all models. I think figure six is more illuminating:
Basically, the 80% threshold is ~2 doublings behind the 50% threshold, or ~1 year. An extra year isn't nothing! But you're still not getting to 10+ year timelines.
The more task lengths the 80% threshold has to run through before it gets to task length we'd regard as AGI complete though, the more different the tasks at the end of the sequence are from the beginning, and therefore the more likely it is that the doubling trend will break down somewhere along the length of the sequence. That seems to me like the main significance of titotal's point, not the time gained if we just assume the current 80% doubling trend will continue right to the end of the line. Plausibly 30 seconds to minute long tasks are more different from weeks long tasks than 15 minute tasks are.
Fair enough! My guess is that when the trend breaks it will be because things have gone super-exponential rather than sub-exponential (some discussion here) but yeah, I agree that this could happen!
Just so people know what you're referring to, this is Figure 4:
Ben West noted in the blog post that
We think these results help resolve the apparent contradiction between superhuman performance on many benchmarks and the common empirical observations that models do not seem to be robustly helpful in automating parts of people’s day-to-day work: the best current models—such as Claude 3.7 Sonnet—are capable of some tasks that take even expert humans hours, but can only reliably complete tasks of up to a few minutes long.
This is probably the most important single piece of evidence about AGI timelines right now. Well done! I think the trend should be superexponential, e.g. each doubling takes 10% less calendar time on average. Eli Lifland and I did some calculations yesterday suggesting that this would get to AGI in 2028. Will do more serious investigation soon.
Why do I expect the trend to be superexponential? Well, it seems like it sorta has to go superexponential eventually. Imagine: We've got to AIs that can with ~100% reliability do tasks that take professional humans 10 years. But somehow they can't do tasks that take professional humans 160 years? And it's going to take 4 more doublings to get there? And these 4 doublings are going to take 2 more years to occur? No, at some point you "jump all the way" to AGI, i.e. AI systems that can do any length of task as well as professional humans -- 10 years, 100 years, 1000 years, etc.
Also, zooming in mechanistically on what's going on, insofar as an AI system can do tasks below length X but not above length X, it's gotta be for some reason -- some skill that the AI lacks, which isn't important for tasks below length X but which tends to be crucial for tasks above length X. But there are only a finite number of skills that humans have that AIs lack, and if we were to plot them on a horizon-length graph (where the x-axis is log of horizon length, and each skill is plotted on the x-axis where it starts being important, such that it's not important to have for tasks less than that length) the distribution of skills by horizon length would presumably taper off, with tons of skills necessary for pretty short tasks, a decent amount necessary for medium tasks (but not short), and a long thin tail of skills that are necessary for long tasks (but not medium), a tail that eventually goes to 0, probably around a few years on the x-axis. So assuming AIs learn skills at a constant rate, we should see acceleration rather than a constant exponential. There just aren't that many skills you need to operate for 10 days that you don't also need to operate for 1 day, compared to how many skills you need to operate for 1 hour that you don't also need to operate for 6 minutes.
There are two other factors worth mentioning which aren't part of the above: One, the projected slowdown in capability advances that'll come as compute and data scaling falters due to becoming too expensive. And two, pointing in the other direction, the projected speedup in capability advances that'll come as AI systems start substantially accelerating AI R&D.
Is the point when models hit a length of time on the x-axis of the graph meant to represent the point where models can do all tasks of that length that a normal knowledge worker could perform on a computer? The vast majority of knowledge worker tasks of that length? At least one task of that length? Some particular important subset of tasks of that length?
I don't quite get what that means. Do they really take exactly the same amount of time on all tasks for which they have the same success rate? Sorry, maybe I am being annoying here and this is all well-explained in the linked post. But I am trying to figure out how much this is creating the illusion that progress on it means a model will be able to handle all tasks that it takes normal human workers about that amount of time to do, when it really means something quite different.
Thanks for the question David! I expect that I can't summarize this more simply than the paper does; particularly: section 4 goes into more detail on what the horizon means and section 8.1 discusses some limitations of this approach.
Section 4 is completely over my head I have to confess.
Edit: But the abstract gives me what I wanted to know :) : "To quantify the capabilities of AI systems in terms of human capabilities, we propose a new metric: 50%-task-completion time horizon. This is the time humans typically take to complete tasks that AI models can complete with 50% success rate"
Fascinating trend, AI's ability to handle long, complex tasks is accelerating fast. A decade from now, automation could reshape entire industries, especially in software development. Curious to see how this scales beyond coding into other professional fields!
Note: I am not a malaria expert. This is my best-faith attempt at answering a question that was bothering me, but this field is a large and complex field, and I’ve almost certainly misunderstood something somewhere along the way.
Summary
While the world made incredible progress in reducing malaria cases from 2000 to 2015, the past 10 years have seen malaria cases stop declining and start rising. I investigated potential reasons behind this increase through reading the existing literature and looking at publicly available data, and I identified three key factors explaining the rise:
1. Population Growth: Africa's population has increased by approximately 75% since 2000. This alone explains most of the increase in absolute case numbers, while cases per capita have remained relatively flat since 2015.
2. Stagnant Funding: After rapid growth starting in 2000, funding for malaria prevention plateaued around 2010.
3. Insecticide Resistance: Mosquitoes have become increasingly resistant to the insecticides used in bednets over the past 20 years. This has made older models of bednets less effective, although they still have some effect. Newer models of bednets developed in response to insecticide resistance are more effective but still not widely deployed.
I very crudely estimate that without any of these factors, there would be 55% fewer malaria cases in the world than what we see today. I think all three of these factors are roughly equally important in explaining the difference.
Alternative explanations like removal of PFAS, climate change, or invasive mosquito species don't appear to be major contributors.
Overall this investigation made me more convinced that bednets are an effective global health intervention.
Introduction
In 2015, malaria rates were down, and EAs were celebrating. Giving What We Can posted this incredible gif showing the decrease in malaria cases across Africa since 2000:
Giving What We Can said that
> The reduction in malaria has be
Cross-posted from my blog.
Contrary to my carefully crafted brand as a weak nerd, I go to a local CrossFit gym a few times a week. Every year, the gym raises funds for a scholarship for teens from lower-income families to attend their summer camp program. I don’t know how many Crossfit-interested low-income teens there are in my small town, but I’ll guess there are perhaps 2 of them who would benefit from the scholarship. After all, CrossFit is pretty niche, and the town is small.
Helping youngsters get swole in the Pacific Northwest is not exactly as cost-effective as preventing malaria in Malawi. But I notice I feel drawn to supporting the scholarship anyway. Every time it pops in my head I think, “My money could fully solve this problem”. The camp only costs a few hundred dollars per kid and if there are just 2 kids who need support, I could give $500 and there would no longer be teenagers in my town who want to go to a CrossFit summer camp but can’t. Thanks to me, the hero, this problem would be entirely solved. 100%.
That is not how most nonprofit work feels to me.
You are only ever making small dents in important problems
I want to work on big problems. Global poverty. Malaria. Everyone not suddenly dying. But if I’m honest, what I really want is to solve those problems. Me, personally, solve them. This is a continued source of frustration and sadness because I absolutely cannot solve those problems.
Consider what else my $500 CrossFit scholarship might do:
* I want to save lives, and USAID suddenly stops giving $7 billion a year to PEPFAR. So I give $500 to the Rapid Response Fund. My donation solves 0.000001% of the problem and I feel like I have failed.
* I want to solve climate change, and getting to net zero will require stopping or removing emissions of 1,500 billion tons of carbon dioxide. I give $500 to a policy nonprofit that reduces emissions, in expectation, by 50 tons. My donation solves 0.000000003% of the problem and I feel like I have f
> How the dismal science can help us end the dismal treatment of farm animals
By Martin Gould
----------------------------------------
Note: This post was crossposted from the Open Philanthropy Farm Animal Welfare Research Newsletter by the Forum team, with the author's permission. The author may not see or respond to comments on this post.
----------------------------------------
This year we’ll be sharing a few notes from my colleagues on their areas of expertise. The first is from Martin. I’ll be back next month. - Lewis
In 2024, Denmark announced plans to introduce the world’s first carbon tax on cow, sheep, and pig farming. Climate advocates celebrated, but animal advocates should be much more cautious. When Denmark’s Aarhus municipality tested a similar tax in 2022, beef purchases dropped by 40% while demand for chicken and pork increased.
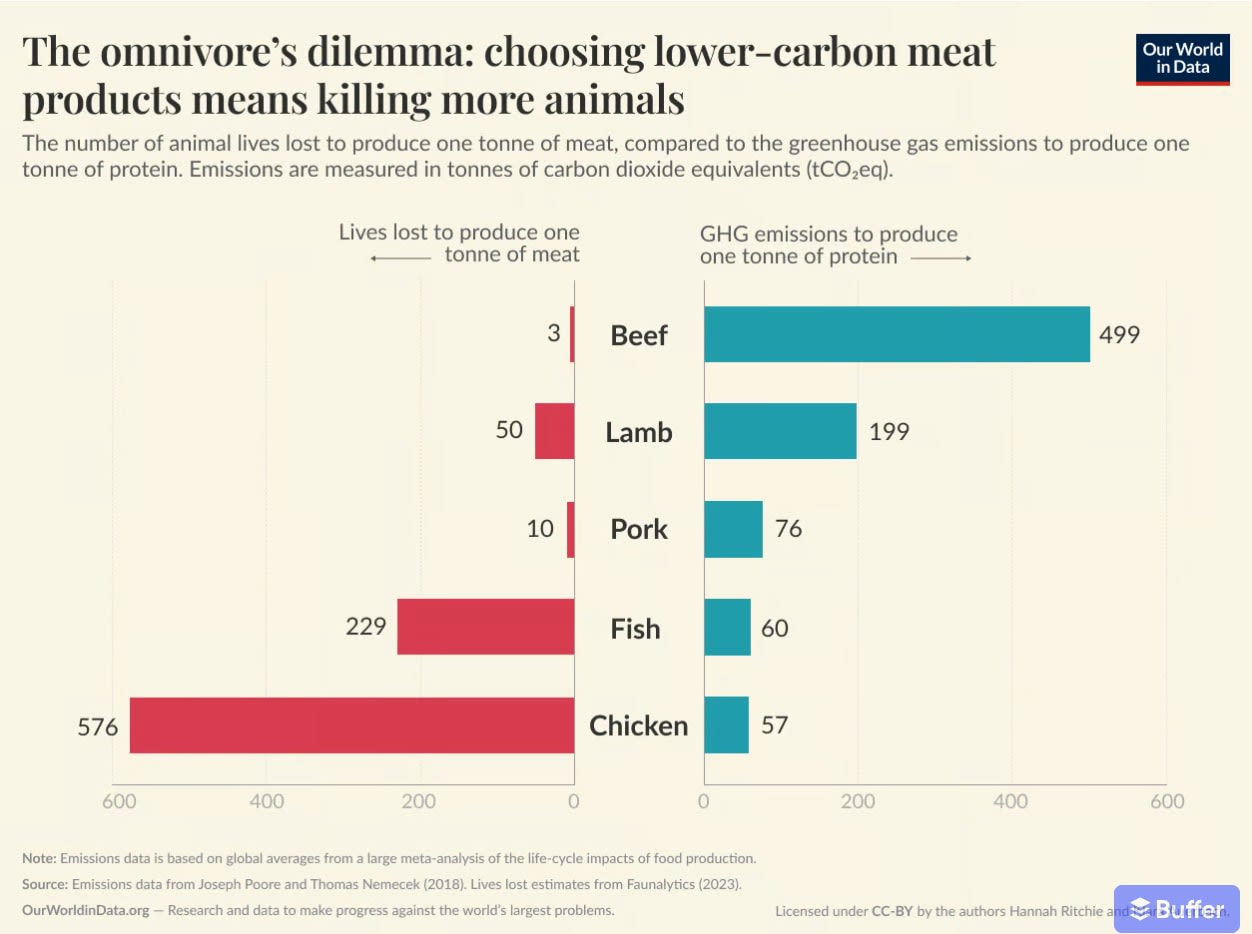
Beef is the most emissions-intensive meat, so carbon taxes hit it hardest — and Denmark’s policies don’t even cover chicken or fish. When the price of beef rises, consumers mostly shift to other meats like chicken. And replacing beef with chicken means more animals suffer in worse conditions — about 190 chickens are needed to match the meat from one cow, and chickens are raised in much worse conditions.
It may be possible to design carbon taxes which avoid this outcome; a recent paper argues that a broad carbon tax would reduce all meat production (although it omits impacts on egg or dairy production). But with cows ten times more emissions-intensive than chicken per kilogram of meat, other governments may follow Denmark’s lead — focusing taxes on the highest emitters while ignoring the welfare implications.
Beef is easily the most emissions-intensive meat, but also requires the fewest animals for a given amount. The graph shows climate emissions per tonne of meat on the right-hand side, and the number of animals needed to produce a kilogram of meat on the left. The fish “lives lost” number varies significantly by

Fair enough! My guess is that when the trend breaks it will be because things have gone super-exponential rather than sub-exponential (some discussion here) but yeah, I agree that this could happen!