I wish this were true, but I'm deeply skeptical, and would expect to hear more people in the ABM community excited about this if a real shift was occurring.
I´m wondering if the ABMs or more specifically Populus have already proven their capabilities. Do you know some examples? This probably depends on how recently Populus has been developed. I couldn´t find anything on a quick search, do you know anything about that?
Agreed. Not found anything mindblowing as of yet but it doesn't mean it doesn't exist. Im new to the non-theory side of this space. I'm wondering about this too and have probably done similar searches. It's quite hard to find isn't it.
I think i'm just going to build my own model on the O*NET dataset and have a look. See if it scales with compute.
On the soft side of this, Maria (del Rio Chanona) just moved to google deepmind (doing what im not sure) and the recent clients of Epistemix include Harvard, RAND and Deloitte (again, doing what i'm not sure).
I'm interested in Macrocosm too and will reach out to regarding my own model ideas and the extent of capabilities. Truly, I honestly don't know. I think the person to speak to in terms of proven vs near term future capabilities is Doyne Farmer but I haven't reached out to him directly.
Calculating the probability that an event causing extreme suffering occurs is, by itself, not a particularly high-impact thing to do. Using this probability alone to inform policy decisions that could potentially result in a reduction of this suffering is better. However, better still than considering risk size and the probability of occurrence alone is a prediction capable of producing a robust policy.
The purpose of this article is both to explain what is meant by a robust policy and to provide a gentle introduction to models explicitly capable of reducing risk by doing so: complex systems. My next article will be a technical piece on exactly how to do so.
As far as I'm aware, given my limited knowledge of population ethics, the significance of a given risk is notoriously difficult to quantify. This will not be the focus of this article. This article will focus on changes caused to the labour market as a result of frontier AI model release. This is both already happening and predicted to increase in significance [1],[2], [3]. It is a growing risk.
As is always the case in creating, be it music, scientific research or opinion pieces on the importance of complexity economics, the last thing you read before you start writing is always someone with the same idea you've had doing it better. In this instance, for those more familiar complexity economics and with more time on their hands, I point you toward chapter 24 of The Economy as an Evolving Complex System IV: Beyond Efficiency: Labor-Market Resilience in an Age of AI and Net Zero.
Basics of Mathematical Modelling
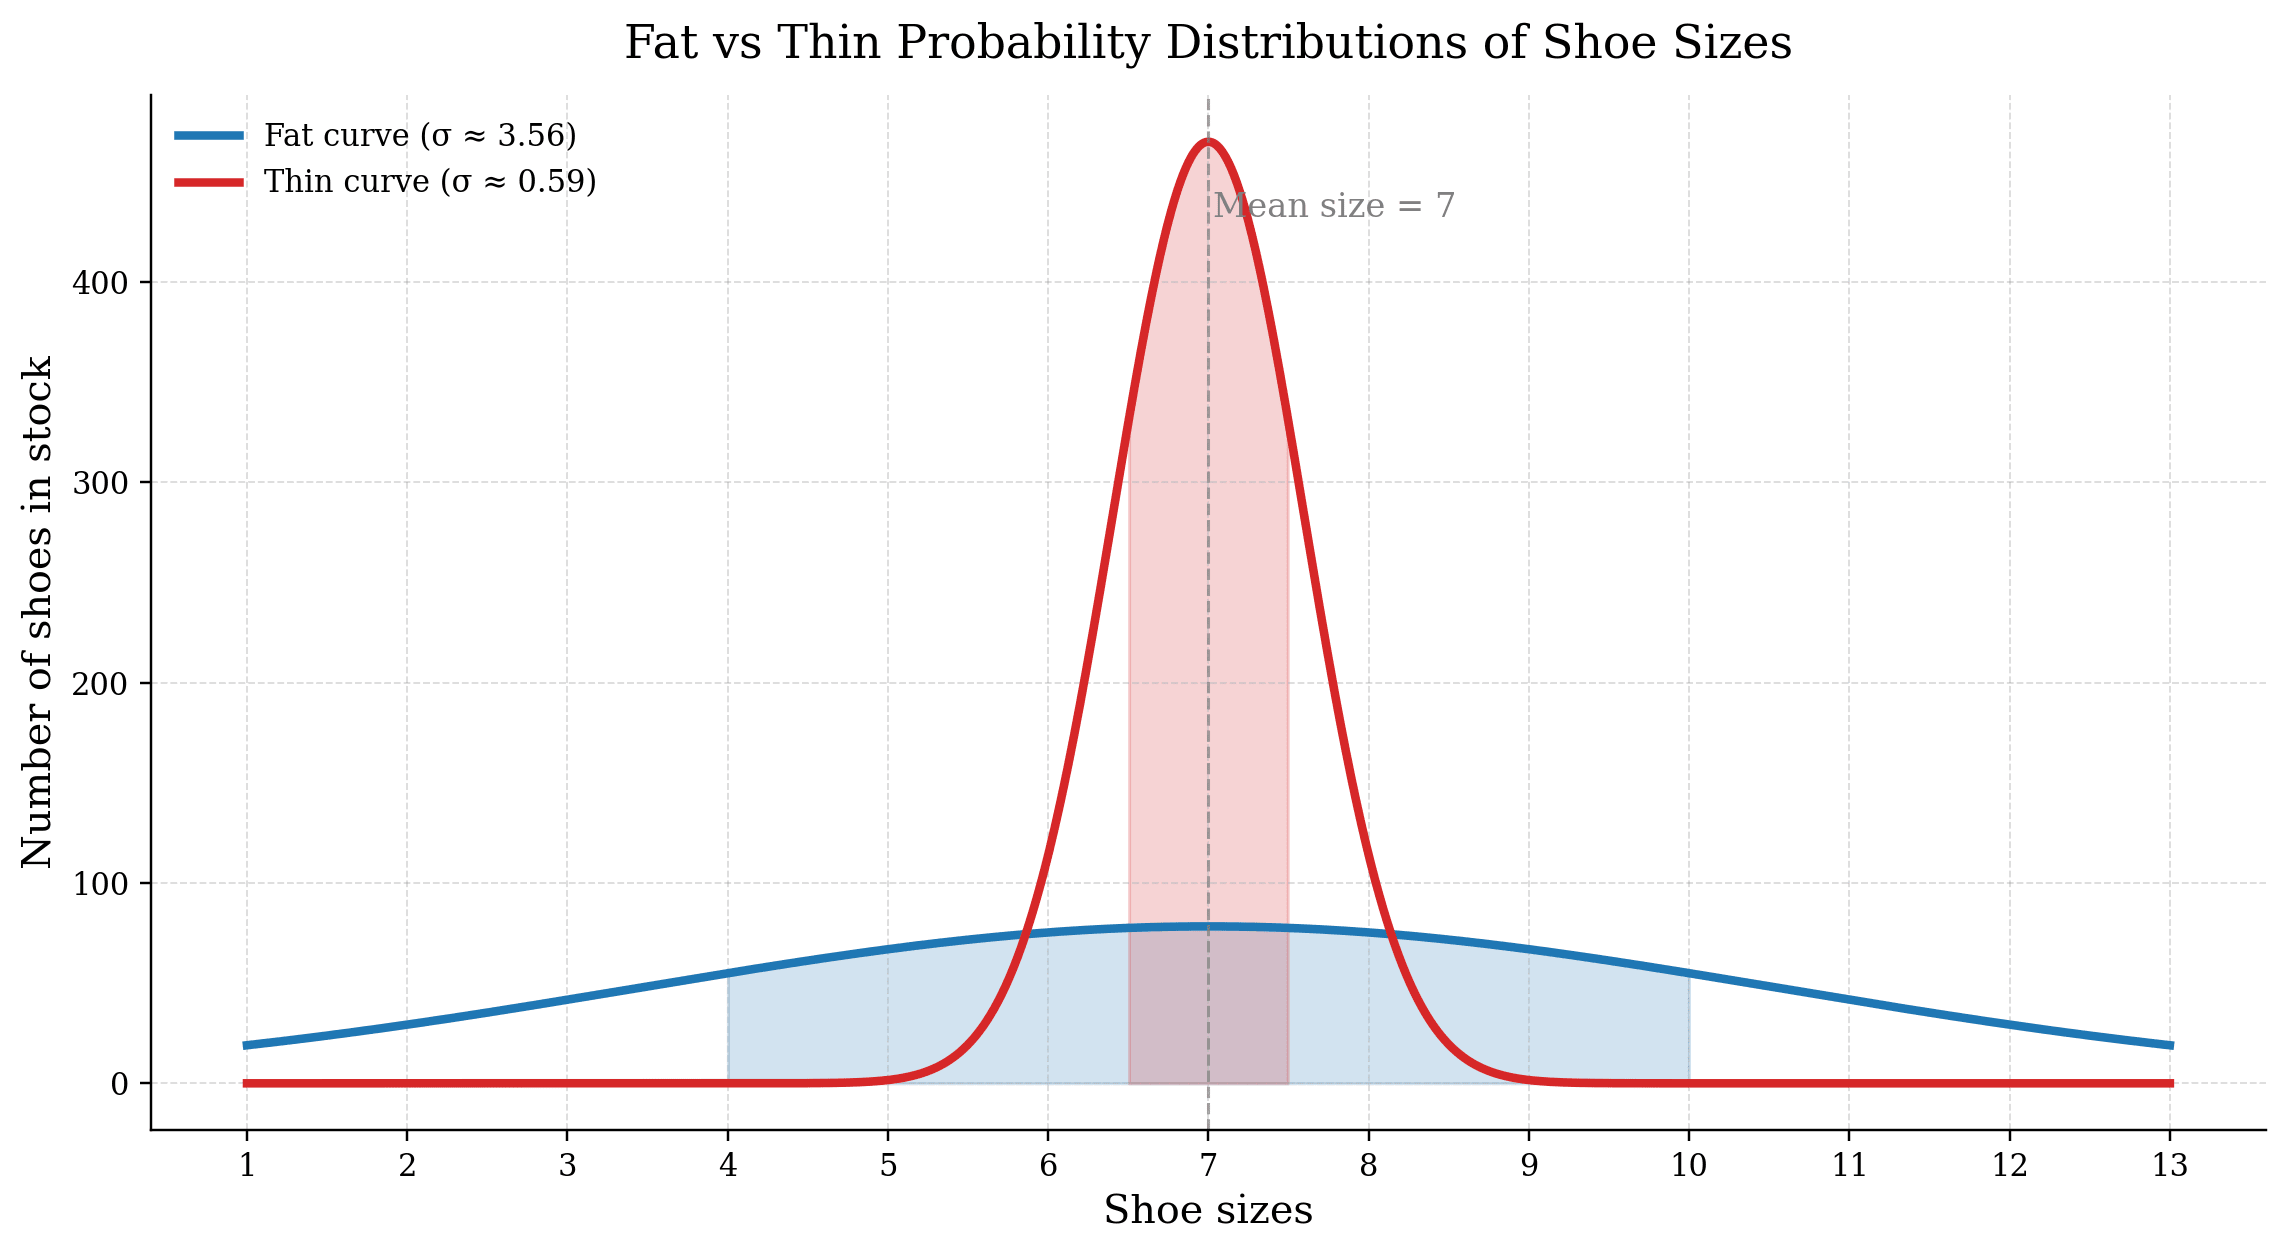
For those still reading, let me begin (sort of) simply. The probability an event occurs is typically modelled using a probability distribution containing parameters. Stay with me, I promise it's not too bad. A probability distribution describes how probability is assigned to the possible values of a random variable. This is far easier illustrated through an example: sizes of feet follow a probability distribution called a bell curve. Most people somewhere in the middle, with equally few people with tiny or very large feet. When drawn as a single continous line, this creates a bell shape. Here, a foot is the random variable. A parameter is a number that impacts the shape of this bell-shaped probability distribution, for example, how fat or thin the distribution of foot-size is. In other words, if a shoe shop is stocking shoes, what number impacts how many shoes they should buy in each size? Are 60% of customers between a size 4 and 10 shoe (fat)? Or are 60% of customers a size 7 (thin)? The answer to this would be captured in a parameter called standard deviation, σ. SeeFigure 1below.
Figure 1: A quick plot of these shoe-size distributions that I made using ChatGPT-5.3-Codex. For the blue curve, 60% of values lie between sizes 4 and 10, whereas for the red curve, 60% lie between sizes 6.5 and 7.5. The difference between the equations for the red and blue curves is captured by the standard deviation parameter, σ. Aside from this value, the equations, and in turn the shapes of the bells, would be identical.
But why am I telling you this and what is robustness?
To answer this, let us consider a slightly more relevant example. Suppose you are choosing between two policies, A and B, each equally easy to implement and each forecasted to reduce flood damage to a village by 50%. The predicted impact of each policy can be described by a probability distribution. Each of these distributions will contain parameters that policymakers modelling the policy choose to best reflect reality.
Now let us imagine that Policy A’s distribution contains a parameter that, if changed even slightly, results in a complete swing in model output, such that it predicts only a 0.5% decrease in flood damage. In contrast, Policy B, under the same parameter tweak, changes only slightly, still predicting a 49% decrease in flood damage. We call the extent to which a distribution is affected by changes in its parameters its robustness. Clearly, for a policymaker using these models to inform a real-world action, distributional robustness matters.
So, how do we design more robust policies?
Designing Robust Policy using Network Science
A company I have recently become aware of, Epistemix, have created an algorithm perhaps capable of predicting the robustness of a policy; a tool called Populus. In their words: "Populus builds a faithful replica of the people you need to understand: a market, your members, a workforce, or a whole country. Every modeled person sits in a household and a real place, with the correlations intact. Add any credible data source, bring in your own, and run a decision forward to see what drives the outcomes. The person who owns the decision can question the answer, change the assumptions and run it again. Test the move before you make it." Scary.
In my opinion, with the right data and computional resources, both of which are now available in 2026, this and similar tools could inform very high impact, robust policy not just in the future, but today. It should also be said, similarly with frontier AI models, whether this tool is beneficial or not for society is in no small part dependent on what the intentions are of those with access to it.
I'd like to now focus on what, in some ways, is the main point of this article: the data that may make Populus (and similar) models so impactful; the so-called intact correlations they mention. To discuss what this data is and why I believe it is so important, I want to introduce a mathematical object called a network.
The best introduction to a network is Albert-László Barabási's big think Youtube video. However, in the interest of time. I have also included my own description below.
Barabasi on networks. Big Think 2023.
My own description, adapted from my Master's thesis laypersons summary.
It is 2026 and we exist in an interconnected world. Amazingly, the mathematics underlying this connectivity is strikingly similar across a diverse range of systems, from molecular biology to computer science and beyond. When we describe such systems in terms of the connections between their constituent elements, regardless of whether they are molecules or social media accounts, we refer to them as networks. These networks can have very different and often complex structures. However, almost magically, many exhibit properties that can be captured and compared using the exact same mathematical equations. Such equations can offer insight into questions ranging from how biological interactions shape genetic evolution to forecasting labour-displacement due to frontier AI model release. --[Predicting Network Growth in Finite-Sized Networks].
So, I believe what Epistemix are refering to when they talk about these so-called intact correlations are these connections between people and things. To a network scientist, these are refered to as edges.
These networks of connections can be used to model labour-market dynamics [1], [3] . Typically (or perhaps more publically anyway), this is done by multidiscinplinary applied mathemeticians called complexity economists or network scientists who work at universities. This year, I wrote my masters thesis on theoretical network science at Imperial College London under associate proffessor Tim Evans, co-director of the Centre for Complexity Science. Another prominent figure in complex systems research is Proffessor Doyne Farmer, Director of the Complexity Economics programme at the Institute for New Economic Thinking (INET). Recently, Farmer was interviewed by the Guardian in a piece entitled: Economics has failed on the climate crisis.This complexity scientist has a mind-blowing plan to fix that. Farmer says a super-simulator of the global economy would accelerate the transition to a green, clean world.
For me, the takeaway quote from the piece is his stunning claim on the global financial crash in 2008. That “If in 2006 the US central bank had the model we could build now, they would have said:"Wow, this is really going to be a disaster; we’ve got to act now and save the world a lot of pain’.” I would highly recommend the article. For what its worth, I'd conjecture the probability he's right is non-negligible. Build the model, please don't use it for surveillance capitalism, predictive policing or election interference. I believe, no doubt alongside more known mathematical frameworks such as supervised machine learning, Epistemix's algorithm is a smaller-scale (yet presumably powerful) version of this conjectured super-simulator.
In short, to reiterate, the reasons these models are so powerful is that they encode the connections between things in the model and for forecasting complicated things like an economy transitioning to life with intelligent machines, these connections matter. This is the case regardless of if these connections are encoding anything from online or in-person friendships,a job market or animals in a food web. In creating synthetic versions of these networks capable of describing the real-world, we can experiment with the parameters determining their behaviour and understand which policies are and aren't robust.
Benefits of Complexity Economics
On top of this, for labour displacement forecasting anyway, another great thing about these networks is that, compared to convenvential economic models, they are better at predicting and in turn designing systems more resilient to unprecedented change [3] . One such unprecedented change could be the overnight introduction of a new frontier AI model capable of causing mass job displacement. As an aside, for those interested in reading more on this, I would recommend reading the work of Dr Maria del rio Chanona.
I will now introduce a particular type of network model called Agent-Based-Models (ABMs).
Put by Epistemix; "Most of the time, the future does resemble the past, and these [statistical, non ABM-forecasting] techniques are sufficient. But the most important decisions are made at inflection points beyond which the future is unknowable, and must be invented." The idea here is that, in creating a sophisticated enough system model, one can created a sandboxed version of reality where you can alter parameters directly and record the consequences. This is the goal of Populus. As an aside, in modelling language, a parameter that can be altered by a user of the model is called a hyperparameter.
As put in the aforementioned chapter 24, in the context of labour-market modelling:
"Emerging macro-level behavior (e.g., unemployment and vacancy rates (del Rio-Chanona etal. 2021) or wage inflation (Fagiolo, Dosi, and Gabriele 2004) from micro-level interactions of heterogeneous agents (employees, jobseekers, consumers, firms; see Neugart and Richiardi 2018). [ABMs] can model feedback loops, where agent behavior impacts labor-market outcomes, and where labor-market outcomes, inturn, impact agent behavior (Farmer and Foley 2009; Pangalloet al. 2024). Such models can help us better understand two-way causality, a phenomenon that is hard to tackle in causal modeling. The growing availability of data allows for increasingly better calibration of ABMs (Pangallo and del Rio-Chanona2026), expanding the possibilities of their validation and their relevance for real-world complex systems."
More simply put. this time by Farmer and Axtell, ABM modelling has “come of age.” So, in an age where AI safety risk is considered existential, and in no small part due to its predicted unprecedented impact on labour-markets, perhaps, given investment and well-intentioned policy frameworks, this has come just in time.
Conclusion
ABM-based complex systems models have come of age. For the EA and forecasting communities, I believe these models offer significant promise. It is also worth reiterating, however, that these models can and likely will be used to cause suffering. They can and likely will be used for surveillance capitalism, predictive policing and election interference, in turn making those who do so incredibly wealthy. The moral cost of one of these models falling into wrong hands is a very real consideration. Here, care must be taken. Nevertheless, for those who are well-intentioned, I think significant promise lies in their use. Finally, as I will touch on in my next article, the largest bottleneck for these models is data. This data will feel invasive, and it will not be cheap. However, this data exists and, if used with good intention, can help create models capable of reducing suffering on a large scale.
My Next Article
For those interested, my next article will be on exactly how I would build one such model to forecast labour displacement as a result of the release of frontier AI models. My background is in theoretical network science, natural language processing (NLP), and quantifying uncertainty in transformer architectures. Interestingly, given perhaps the non-linearity of both the labour market and a neural network, and the fact that both can be modelled by an object called a directed acyclic graph (DAG), which is a member of the network family, there is a good deal of overlap in technique. Mech interpretebility researchers interesting in pivoting to forecasting perhaps take note.
Edit: The match seems to now be over - the funds were expended in around 35 minutes. But many of these charities are great and should be supported regardless!
***
On October 22nd starting at 10:00am Pacific Time, Every.org is matching donations to select animal welfare organizations at a 2:1 rate, up to $2,000 per donor per nonprofit (so if you give up to $2,000, they will contribute up to $4,000 and the nonprofit will get up to $6,000). The first donation a donor makes to each el...
Crossposted to Less Wrong
‘Like most of life’s dangers, the dangers of artificial intelligence are not easily identified from the armchair.’
J Dmitri Gallow
Epistemic status
I’m not an expert in this field, and herein I make some sweeping generalisations educated guesses about the overall...


I wish this were true, but I'm deeply skeptical, and would expect to hear more people in the ABM community excited about this if a real shift was occurring.
Fair enough, im pretty new to this space.
Out of curiousity, who are the main voices in this community?
What do you think? I'm intellectually curious and not wedded to the idea this space will have a big explosion in capability.