On the topic of the Amish, I found this article "Assortative Mating, Class, and Caste". In the article, Henry Harpending and Gregory Cochran argue that the Amish are undergoing selection pressure for increased "Amishness" which is essentially truncation selection. The Amish have a practice known as "Rumspringa" in which Amish young adults get to experience the outside world, and some fraction of Amish youths choose to leave the Amish community and join the outside world every generation. The defection rate among the Amish has been decreasing over time. The defection rate in recent years has been around 10-15%, but was around 18-24% in the past. Because of this, your assertion that decreasing religiosity will outpace high fundamentalist population growth seems questionable.
From the article:
The Amish marry within their faith. Although they accept converts, there are very few, so there is almost no inward gene flow. They descend almost entirely from about 200 18th century founders. On the other hand, there is considerable outward gene flow, since a significant fraction of Amish youth do not choose to adopt the Amish way of life. In recent years, something like 10-15% of young Amish leave the community In the past, the defection rate seems to have been higher, more like 18-24%. Defection is up to the individual – there are no exterior barriers against Amish who want to participate in modern society. Since the Amish have very high birth rates ( > 6 children per family), their numbers have increased very rapidly, even though there is a substantial defection rate. There were about 5,000 descendants of the original 200 by 1920, and today [2013] there are about 280,000 Amish.
Regarding the implications of future demographics for Effective Altruism/Longtermism, Robin Hanson wrote this article "The Insular Fertile Future". Robin Hanson talks about ways modern values could be preserved in light of these demographic shifts. One possible strategy to preserve modern values could be to encourage the creation of new subcultures that inherit most of their cultural elements from the dominant culture, but also have high fertility and the adaptive characteristics that insular, religious subcultures with high fertility have.
Also worth reading is Anatoly Karlin's article series on the Age of Malthusian Industrialism, particularly the article "Breeders' Revenge". Karlin argues that a reverse of the demographic transition and a "breeder transition" where there is a resurgence of high fertility due to selection for "breeders" is a mathematical inevitability. Karlin also talks about how France has a fertility rate that is roughly 1.5x that of Germany, which Karlin argues may be the result of France having an earlier demographic transition than other countries, and therefore has had more time for selection for "breeders" to take place.
I think your comment does a really good job of illustrating the difficulty in determining which groups and circumstances are selecting on what traits, as the two examples of unusually strong selection on fertility that you bring up are the Amish and the French, which have been on opposite ends of fertility behavior. It's not impossible that both of these groups are selecting more strongly on fertility than everyone else, but it is somewhat counterintuitive.
I agree that the Amish are selecting on something, but that something isn't necessarily a preference to have more children. The paper you linked also lists "affinity for work, perseverance, low status competition, respect for authority, conscientiousness, and community orientation" as other characteristics that may be being selected for among the Amish. If the Amish are being selected for ~conformity and community orientation rather than desire to have more kids irrespective of circumstances, then if the circumstances change at the community level (for example, if it becomes more difficult to purchase farmland, as is already happening to the community in Lancaster County, or if the Amish stop being exempt from the requirement that children need to stay in school until they are 16, which some people are pushing for) then the Amish fertility rate could decline further than it already has.
The French case seems somewhat more compelling: because of contraception and norms around family sizes, the people who had larger families in France would be people who intrinsically valued larger families, and so selection would in the direction of higher fertility preferences more directly, rather than high fertility being a result of conforming to local norms. That being said, two centuries of selection in the direction of people who want kids more than average hasn't been enough to bring French fertility above replacement, merely to above average for Europe.
On the topic of comparing French and German fertility- so far as I can tell, Karlin isn't making any attempt to control for Muslim fertility as a component of the French total? There are probably some ultra-conservative French catholics bumping up the total, but insular French-Muslim communities by themselves could explain the French case in roughly the same way as the Amish.
Also, FWIW, the lower rates of Amish defection over time might not necessarily reflect genetic changes (although that's also possible.) The larger external secular society might just be getting more chaotic and repulsive over time.
I don't think Hanson has any terribly useful suggestions for solving the secular fertility crisis, to be frank. The founding myth of our present-day secular elites is of course the holy crusade against the Nazis, which means that any serious national discussion about raising birthrates (let alone ensuring eugenic fertility) will get crushed by Lebensborn comparisons and other thought-terminating clichés.
Oh, good idea. Reverse image searching resulted in me finding the same version claiming that it's 2007 data. So that's maybe partially reflecting differences in how people responded to the financial crisis in particular?
Decided to find some TFR data from Eurostat and recreate this map for some more recent years. The France-Germany gap has been decreasing in visual saliency: 2014 is still pretty visible but but 2019 is less so (though there is still some aggregate TFR difference between France and Germany). Data doesn't go far enough back for me to be able to check the original map but it doesn't seem particularly implausible.
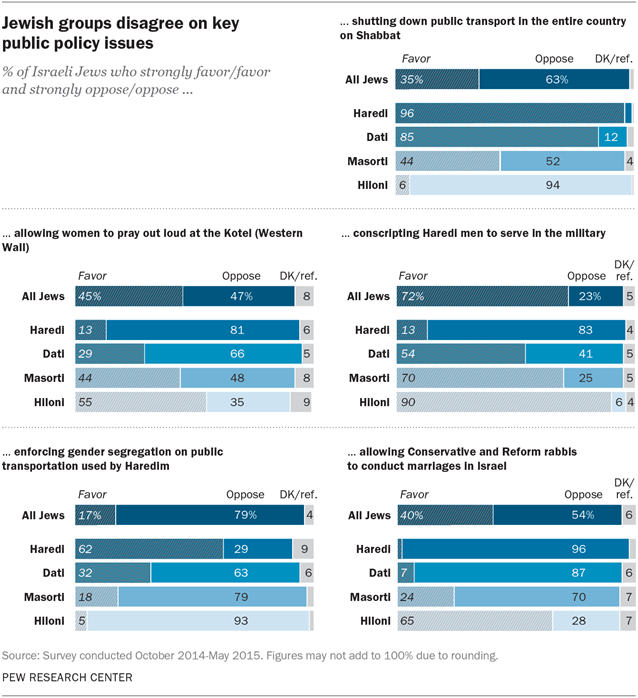
You say "While there is a clear relationship between religiosity and the role of religion in public life, views on other political issues are less determined by religion." I wasn't sure that this was borne out by the cites. I can't access the Foreign Policy piece, but the Pew survey seemed to suggest quite strong political differences between haredim and others. This was in part confirmed by the chart that you cited but also other charts. Kaufman argues that Jerusalem has become politically extreme due to ultra-orthodox dominance - examples I recall were adverts with women being taken down and cars being stoned on the saturdays.
Thanks for the feedback! "Prioritization of religious law" and "opinion on halakha" fall under the set of things that that I was trying to point at with the phrase "role of religion in public life".
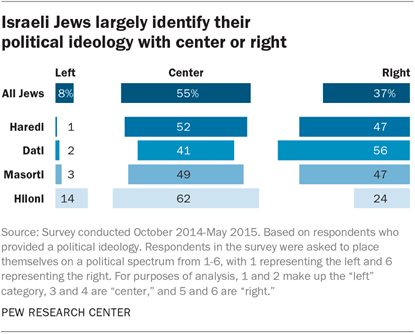
The relationship between those questions and religiosity is clear and monotonic, while on other issues the relationship is more complicated. The Haredi have views that are approximately the same as the Masorti in terms of Arab expulsion and political identification, and are less right-wing than the Dati. Though there's still some division by religiosity in terms of identification with the left / center / right, it's much less intense than, for example, the difference in views on transportation on Shabbat.
I rephrased the sentence to "While there is an extremely strong relationship between religiosity and views on the role of religion in public life, opinions on other political issues are less starkly divided by religiosity, though there are still some divisions." and added in this graph of political identification to make that clearer.
Hi Isabel, another exception group would be Latin Mass attending traditionalist Catholics, especially followers of the Society of St. Pius X. Their stronghold in the United States is in St. Marys, Kansas, which more than double the birth rate of the state of Kansas.
you're right that St. Mary's has an exceptionally high birth rates, but they are both very small (pop ~2600) and as of recently not growing (2015: 2664 -> 2020: 2652). (Kansas Department of Health) which makes me suspect that they're experiencing some retention issues.
more broadly, this article suggests that while there's a fairly large number of attendees (~150,000) of Latin Mass in the United States, I expect that the Pope's recent restrictions on Latin Masses discussed in that article will hurt their popularity + growth.
This is a crosspost from the new Animal Welfare Alignment Newsletter by Anima International. You can subscribe on Substack if you are interested in following these efforts. Audio reading also available on Substack.
The goals of this post are to:
1. Raise a question I see as crucially important to the goal of aligning AI to animal welfare...
Hello! I'm Justin Portela. I got hired by GWWC to make YouTube videos after AI in Context did such a kickass job.
My channel is using that same cinematic, high-production value beauty to talk about everything in the EA universe that isn't AI.
...
This is a linkpost for Request for Proposals: Research and Applied Work on Digital Minds.
I'm glad to announce a request for proposals for research and applied work on digital minds at Longview Ph...
Thanks to Leopold Aschenbrenner, Max Daniel and Will MacAskill for feedback on this post, and for the Forethought Foundation for providing research support during the creation of this post.
Introduction
This piece is a retrospective on "Shall the Religious Inherit the Earth", a book by Eric Kaufmann published in 2010 which goes into one possible way that the future might go based on past demographic trends: in societies in which it is common for some couples to choose to have small families, there is a substantial gap between the fertility rates of the most religious, and everyone else. The book focuses especially on the growth of fundamentalist religious groups. In some cases, like the Amish, these groups have a near total rejection of modern technology. The book makes a number of predictions, some of which should have materialized by now, while others are still decades out. I will evaluate the claims about the specific high fertility religious groups the author brings up, as well as discussing overall global trends in religion and fertility. Future posts will delve further into arguments for why fertility rates matter and what influences them.
TL;DR
Book focuses on high growth rates of various religious groups, but for the most part they are experiencing substantial fertility decline in parallel with more secular groups, as well as secularization
While the Muslim share of Europe will grow, it is likely that it will not grow fast enough to prevent population decline in the medium-term future (i.e. by 2050) without substantial further migration
Of the groups discussed in the book, the only substantial exceptions in terms of declining fertility are:
Though future growth may be difficult to maintain as farmland is growing less affordable for them, and farming is associated with higher fertility within these groups
Though there are signs of increasing acceptance of the usage of technology and of higher labor force participation rates among both men and women, this has not had a clear impact on fertility or retention
Much of the uncertainty about the future global share of the religious stems from uncertainty about the future religiosity of sub-Saharan Africa, and whether the current ongoing fertility decline in Africa will continue at the current pace, accelerate, or slow down
Religious people have higher fertility rates than non-religious people, and within a religion, fundamentalist groups have higher fertility rates than moderate groups
Religions, especially more fundamentalist groups, have sufficiently high retention rates that this fertility difference leads to the growth of fundamentalism
These two claims combine to lead to the central conclusion of the book, which is that religious people will increase as a share of the global population going forward.
While the titular conclusion is about the earth, the examples the book poses are mostly about within country, region, or religion changes, looking at the higher fertility rate of:
Some Christian groups within the United States
More religious Muslims within the Middle East
Muslims and remaining committed Christians within Europe
Haredi Jews within Judaism
I broadly agree with the claim regarding higher religious fertility, but find the evidence for the second claim regarding retention to be much weaker and to often fail to hold. Given that, it is helpful to try to disaggregate the conclusion about global religious population dynamics into four parts:
Within a religion, fundamentalists growth will outpace moderates growth
Within a country/region, fundamentalist growth will outpace irreligious + moderate growth
Globally, religious growth will outpace irreligious growth
Globally, the population will continue to grow
I find the evidence for (1) to be fairly strong, especially for Christianity and Judaism: when atheism is acceptable, moderates often shift into irreligion and fundamentalism grows as a share of the religious population. Within Islam, due to more negative consequences for apostasy, especially within the Middle East, I expect moderation to come first.
The evidence for (2) is weaker, with the exception of Haredi Jews within Israel.
While (3) does not follow from the examples provided in the book and despite (2) mostly failing to hold, this does seem to be true at least in the medium term, due to dynamics between countries mostly not addressed in the book: the population decline of irreligious countries in East Asia and the population growth of Africa.
Which brings us to the fourth point. Fertility rates have declined nearly everywhere, for nearly everyone: religious groups have had their fertility rates fall in parallel with secular decline. Already, in many parts of the world the fertility advantage of the religious stems not from having exceptionally large families, but rather from the irreligious having small or no families. For example, much discourse has been made about the growth of Muslim populations in Europe, and it is true that that they are growing both in absolute terms and as a share of the population. However, this growth by itself, even with continued migration, is likely not sufficient to prevent Europe’s population from shrinking by mid-century, which I discuss in more detail later.
Basic relationship between religiosity and fertility
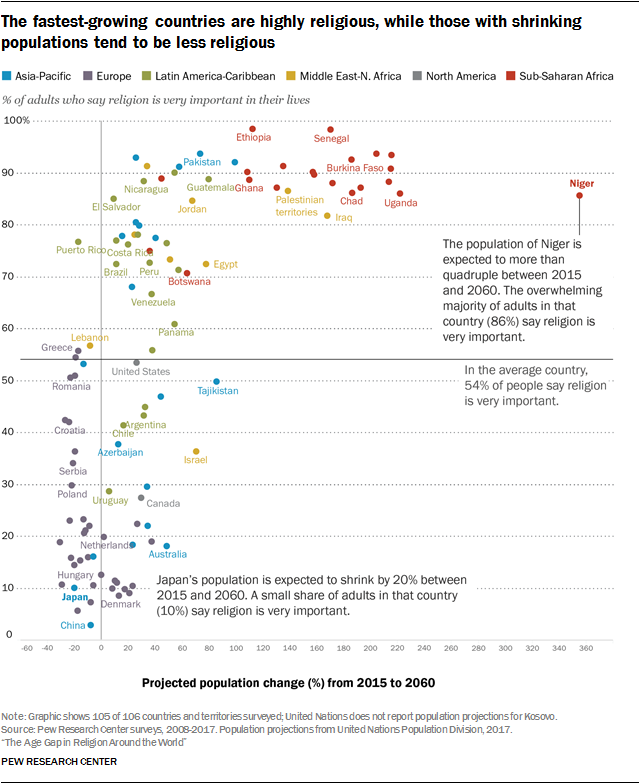
The relationship between religiosity and fertility is well documented and easily apparent. The below graphic if anything understates the relationship because a number of the low religiosity regions that are projected to exhibit growth will only do so due to migration. There are also within-country fertility gaps based on religiosity.
Figure: Countries with a lower share of respondents saying that religion is important in their lives are projected to grow less between 2015 and 2060. Source: Pew Research[1]
However, more religious people having more children doesn’t necessarily imply that the share of the world that is religious will grow. There is evidence that religious fertility has been higher than secular fertility in the United States and Europe for centuries, and yet the secular share of the population has been increasing during that time. There is growing evidence that secularization of France in the mid-to-late 1700’s drove the initial demographic transition, with families in more secular départements switching to having fewer children earlier than other regions. If a fertility advantage was sufficient to ensure that an idea grows, then secularism would have been doomed from the outset in France, but we can see that France today has a low rate of religiosity. Since the forces that contribute to secularization have been outpacing the fertility gap for centuries, this gives us reason to believe that they will continue to do so. [2][3]
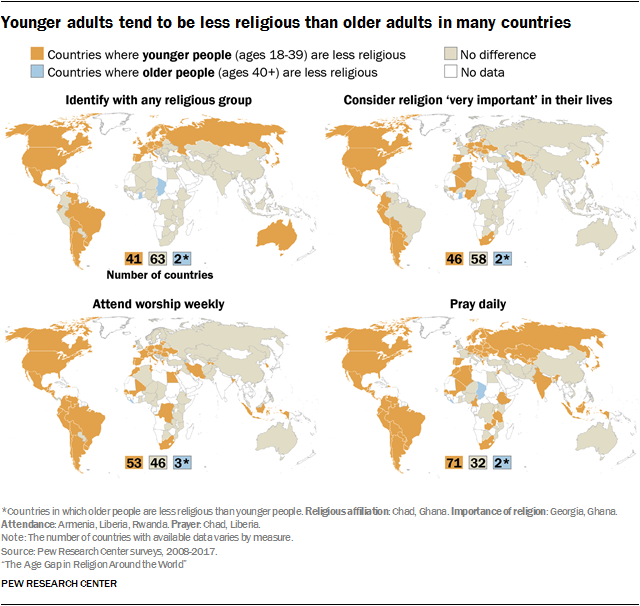
Despite a widespread fertility advantage to the more religious, we can see that the younger people are often less religious than older people on many metrics of religion, while the opposite is rare.
Figure: Younger adults (18-39) are less religious than older adults (40+) on multiple metrics of religiosity across the world. Source: Pew Research [1]
Figure: Younger adults (18-39) are less religious than older adults (40+) on multiple metrics of religiosity across the world [1]This provides another piece of evidence suggesting that higher religious fertility on its own is insufficient to guarantee a growing religious share of the population.
Note also that the relationship between fertility and religiosity is not absolute. For example, in Israel, while there is a strong relationship between religiosity and fertility for Jewish women, there is less of a relationship between fertility and religiosity among Muslim women. [4]
Why this matters for EAs/Longtermists
If your timelines for transformative AI are within the next decade or two, then birth rates now don’t matter: the people born today won't affect much before the world is radically changed, at which point the existence of new biological humans may not matter. But if your timelines are longer than that, or if you are skeptical about transformative AI or otherwise believe that the world won't yet be locked into a trajectory within the next couple of decades, birth rates become much more important. Children born today will be the young adults of tomorrow, and they will have an impact on the world that exists then. Insofar as EA is changing the world, it's worth noting that EA is quite young relative to the societies that it is a part of: in the 2020 EA survey, 82% of respondents were 34 or younger. [5]
More broadly, fertility matters for both economic growth and geopolitical power. Recent economic works argue that ideas are becoming harder to find and require ever growing numbers of researchers[6], that a world of shrinking populations might lead to technological stagnation[7], and that in some cases technological stagnation might contribute to existential risks[8].
Geopolitically, larger countries matter much more than smaller countries[9]: Luxembourg is much richer on a per capita basis than China, but the former is largely irrelevant to geopolitical concerns. The population of South Korea is about double that of North Korea, but the gap has been shrinking and recent birth cohorts in the North have been larger than in the South.
While immigration can offset some of the problems caused by below replacement birth rates, this won’t help if the whole world has below replacement fertility rates.
Future pieces (timeline: uncertain) will go into more depth about those and other arguments, why EAs (and everyone else) should care about fertility, the determinants of fertility more broadly, and what can be done about global fertility decline (the effectiveness of various types of subsidies, technological improvements that might make having children less costly, etc).
Christianity in the United States
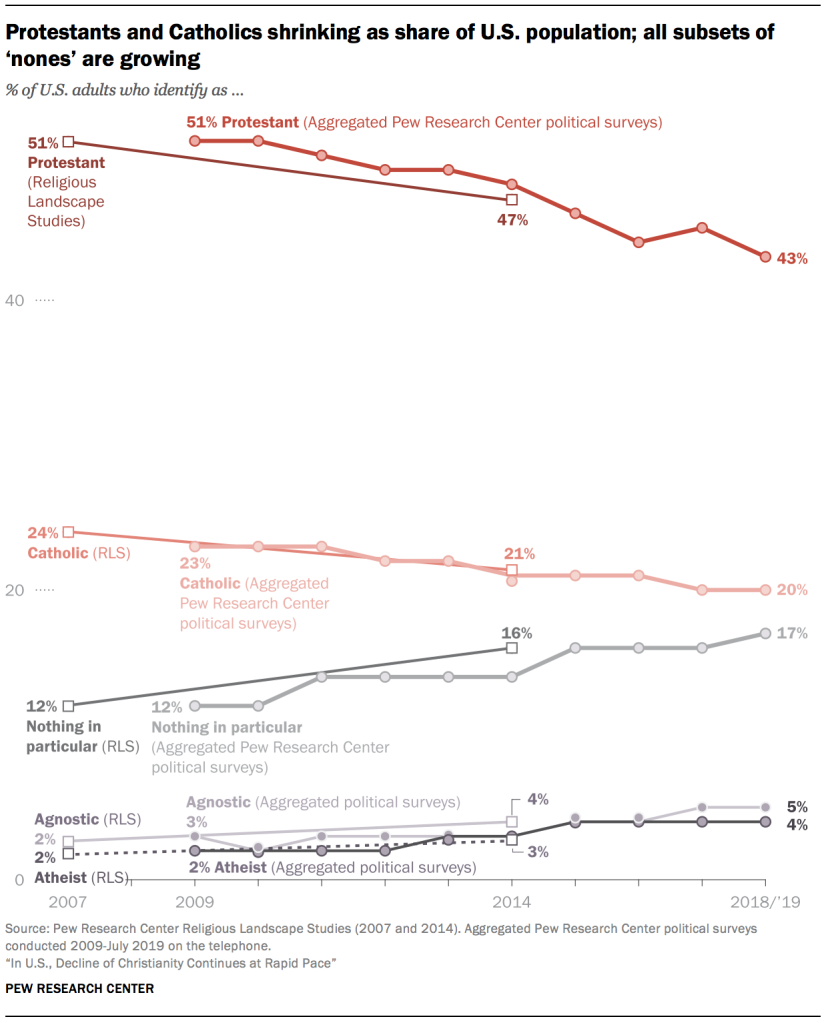
The book predicted that the existing fertility gap in the United States would result in a more religious country. In terms of headline numbers, this straightforwardly has not panned out.
Figure: Since 2007, the share of the US identifying as Catholic or Protestant has declined, and the share unaffiliated has increased. Source: Pew Research [10]
Growth in the US religiosity was supposed to come from the higher fertility and retention rates of four groups:
Evangelical Protestants
Quiverfull
Hispanic Catholic
Mormonism
Old Order Anabaptists (Amish, Hutterites, and Old Order Mennonites)
The first three of these groups have seen clear declines in both fertility and retention over the past decade. The last of has not yet experienced such a sharp decline, and I will address them in a later section.
Evangelical Protestants
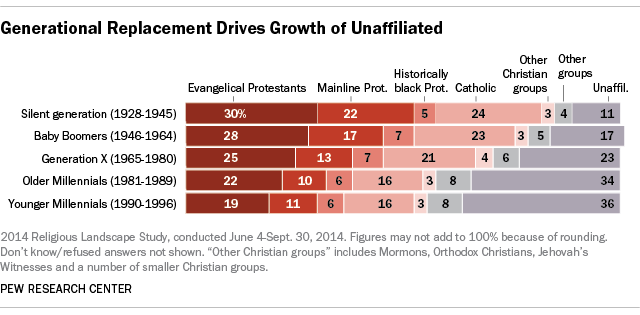
While the decline in the share of mainline Protestants has been steeper than the decline of Evangelicals, Evangelical Protestants are also clearly declining, especially among the young – the reverse of the pattern one would expect from a successful endogenous growth group.
Figure: More recent cohorts have higher rates of unaffiliation and lower rates of identifying as evangelical protestants, mainline protestants, or Catholics. Source: Pew Research [11]
The Quiverfull movement
This, by itself, doesn’t completely disprove the book's argument. These trends already existed, albeit more mutedly, at the time that the book was being written. The argument was that a committed religious core with high fertility would remain after the more loosely attached fell away, and this core would be the source of future growth.
The Quiverfull movement was pointed to as an example of such a committed core for Evangelical Protestants. Though Kaufmann acknowledged that the core of the movement only numbered the tens of thousands, he argues that that the movement would have broader reach by influencing the evangelical homeschooling community, which he claims numbers between 1-3 million.
A movement growing only endogenously and numbering in the tens of thousands in 2010 will have minimal impact on US religiosity in 2100: if the population of the rest of the US stayed constant and this group doubled every 18 years, this group would be less than 1% of the United States in 2100.
For this group to matter, it depends on the extent of its influence on the broader evangelical homeschooling community, and we can look at homeschooling statistics to estimate the growth of the movement. However, the statistics on homeschooling raise doubts about the claims of continuing rapid growth, though there was growth in the early 2000’s.
Between 2003 and 2007, the share of K-12 school students enrolled in homeschooling grew from 2.2% to 2.9%[12], and the share of parents who homeschooled out of a desire to provide religious or moral instruction increased from 72 to 83%[13]. However, while the share of students being homeschooled in 2016 was even higher at 3.3%[12], the share homeschooling to provide religious or moral instruction sharply declined to 66%[14]. Additionally, the 2016 NCES survey decoupled the questions on religious versus moral instruction, and which lets us see that only 51% of parents listed a desire to provide religious instruction as a factor at all, and only 16% listed it as the most important factor.[15] In 2019, the share of students being homeschooled had decreased to 2.8%, falling below the 2007 homeschooling share.[12] These are not the numbers one would associate with a rapidly growing group.
Not all who homeschool for religious reasons are in any way affiliated with or inspired by the “Quiverfull” movement, and there could be parents who don’t homeschooled who could be labeled as such, but the decline in both homeschooling share and percentage homeschooling for religious reasons is evidence pointing at no growth on one of the few metrics we have available to assess the growth of the movement.
There are also reasons to suspect that there are problems within the core Quiverfull community. For example, Doug Philips was a key figure in the movement, and was described in the book as “Quiverfull’s doyen” and his organization Vision Forum was described as “the star around which a lively subculture of churches, websites, conferences and publishing ventures orbits”.However, Doug Philips resigned from Vision Forum in 2013 after having an extramarital affair, after which Vision Forum was shut down.[16] A year later, Doug Philips was excommunicated from the church he founded following accusations of long running sexual harassment of his children’s nanny.[17] For a small group leaning on the charisma and leadership of a small number of key figures, such scandals are not a promising sign for the continued growth and cohesion of the group.
Hispanic Catholic fertility and retention
The forecast growth in Catholics was due to immigration from Latin America and the apparent comparatively high fertility of Hispanic Catholics. However, not only has the fertility of Hispanics in the United States declined below replacement, it was in some ways not as high as it appeared in the 90’s and 00’s. Over this period, the TFR of Hispanics fluctuated between 2.6 and 3, while completed cohort fertility turned out to be notably lower, between 2.2 and 2.6. [18]
Completed cohort fertility is the number of children that the average woman in a given birth year eventually wound up having. This number is only available with a long lag, since it cannot be known until a given cohort has finished having kids. In order to be more timely, TFR is typically used. This is usually a good approximation, but can be misleading when the average age of giving birth is changing or during periods of high migration due to migration-specific tempo effects. For more details about these calculations and why TFR was an underestimate in this case, see the appendix:
Figure: Completed Fertility Rates were eventually found to be much lower than TFR estimates due to migration affecting timing of births. Source: Parrado (2011) [18]
In addition to this lower growth, the white-Hispanic gap in unaffilation has shrunk, with less than 50% of Hispanic teens identifying as Catholic and almost a third identifying as unaffiliated. [19]
…
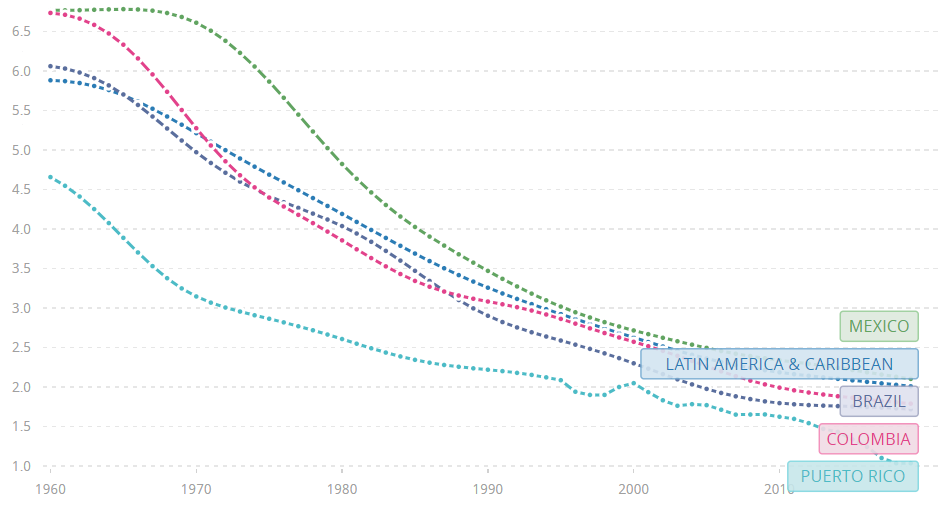
Future Hispanic immigration is growing less likely to bring this number up in the future, as the average TFR of Latin America has fallen below replacement. Mexico, the largest origin location, has a TFR that fell below replacement during COVID and was on the cusp of that before COVID. In Brazil, the largest country in South America, has been below replacement for over a decade. [20]
Puerto Rico, the second largest origin location, has a TFR hovering around 1 (while Puerto Ricans have US Citizenship, they are not usually counted in US Census aggregate statistics unless they have moved stateside). Due to emigration and low fertility, the population of Puerto Rico has been shrinking for almost two decades, and there are now twice as many people identifying as Puerto Rican within the 50 states as there are in Puerto Rico. [21]
Figure: TFR has declined substantially across Latin America and the Caribbean since 1960, with average TFR now below replacement. Source: World Bank [20]
The domestic and international Mormon decline
Mormons have also dramatically underperformed the projections cited in the book:
“Like all endogenous growth sects, Mormon social values are conservative and communitarian. Since 1830, they have averaged over 40 percent growth per decade, maintaining this pace in all five post-Second World War decades. Rodney Stark projects that at conservative growth rates of 30 percent per decade, there will be 63 million Mormons in 2080.”
According to their church's estimates, in 2010, the Mormons had a church membership of around 14.1 million, and this had only grown to 16.7 million by 2020, growing less than 20% in a decade and barely outpacing global population growth. Even more damningly for the thesis of continued endogenous growth, the number of new children in the Church had fallen dramatically: 121 thousand in 2010, to 65 thousand in 2020. Some of the decline was pandemic driven, but the number in 2019 was still lower than 2010, at 94 thousand. [22][23][24]
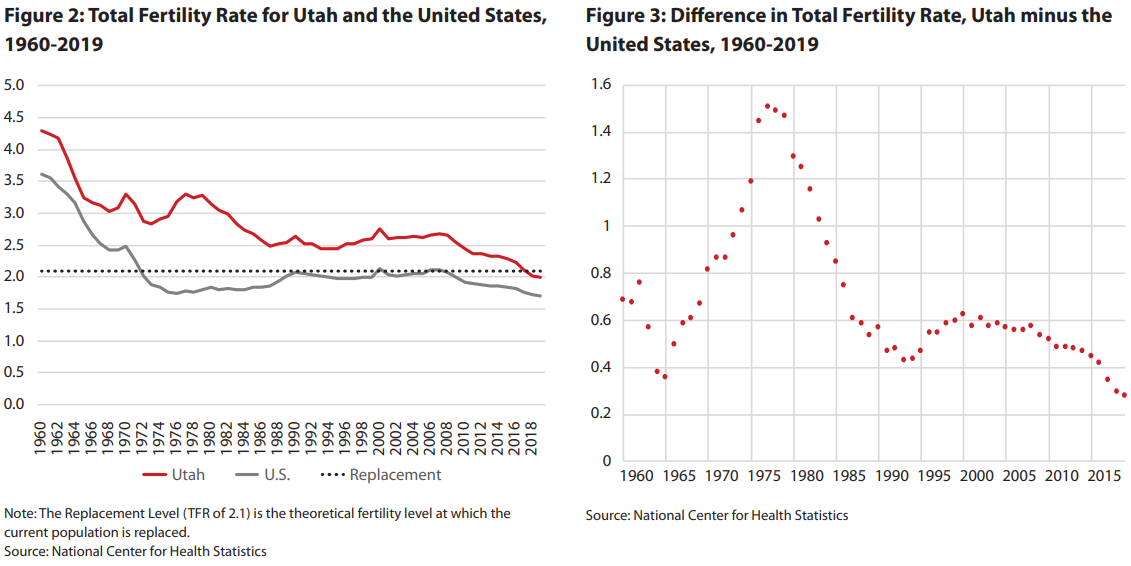
There is some evidence that the Mormon fertility rate within the United States is approaching replacement. Utah, which is about 2/3rds Mormon, had a TFR below replacement for the first time, and approaching closer to the US average than it has been in the past half century. [25]
Figure: The fertility rate in both Utah and the United States is declining, and the gap between Utah and national TFR is narrowing. Source: Gardner Policy Institute [25]
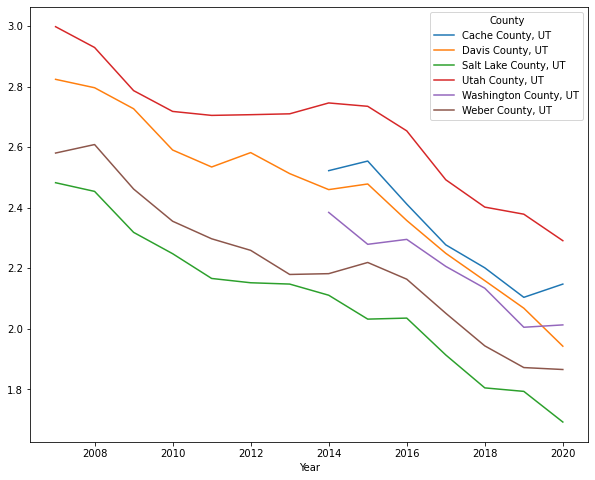
Within Utah, there is a clear correlation between % of a given county that was Mormon in 2010 and the fertility rate in the preceding and subsequent years. Utah County, at almost 90% Mormon, had both the highest Mormon share and the highest fertility rate of the counties we have TFRs for. The share Mormon of Cache County, Davis County, and Washington County was 82%, 75% and 68% respectively. The two counties with the lowest fertility rates were both about 60% Mormon.[26] While share Mormon affected the level, all of these counties experienced a parallel decline in fertility. By 2020, the TFR in Utah County had fallen below the TFR of Salt Lake County in 2010. [27]
Figure: TFR has fallen in parallel in Utah counties. Own visualization; data from: https://wonder.cdc.gov/
Islam
In the Middle East, North Africa + Asia
Islam, like all the other religious groups, hasn’t been spared from the decline in fertility. While Kaufmann acknowledges that there have been substantial declines in fertility rate in the Islamic world, his argument hinges on the fact that more religious Muslims have more children than less religious Muslims, and so the Middle East will eventually grow more religious by this mechanism.
However, as the author himself points out in the other chapters, higher fertility among the more religious is not unique to Islam. The fertility advance of the religious has existed in Christianity since as early as the 1700’s, as discussed earlier recent research suggests that secularization in France was the initial driver of France’s demographic transition. [2][3]
Looking at places that were predominantly Christian in the late 1700’s, it does not seem to be the case that two centuries of fertility advantage to the more religious have resulted in those places being less secular than they were at the start of the fertility transition. At least on the order of centuries, there is evidence that cultural change outpaces fertility differences.
…
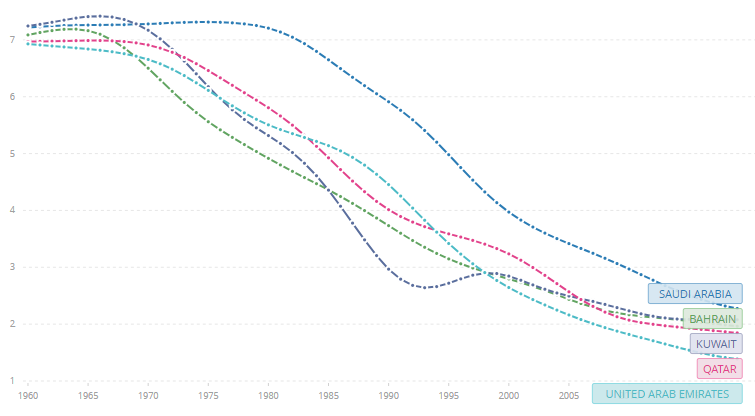
The overall fertility decline in the Middle East and North Africa has stalled somewhat in the past decade, though preliminary evidence suggests a recent drop due to COVID. But it has stalled at a lower level than many people realize, with an overall TFR below 3. All of the oil rich countries (Saudi Arabia, UAE, Kuwait, Qatar) have TFRs at or below replacement, which is especially noteworthy in the case of Saudi Arabia, as this suggests that even authoritarian regimes that severely curtail the rights and autonomy of women can not keep fertility rates from falling.
Figure: Middle Eastern countries with the highest GDPs per capita all have seen TFR decline to at or below replacement. Data from World Bank.[28]
Saudi Arabia has “guardianship” laws in which women have male legal guardians, usually their fathers until they marry and then their husbands after that. These laws severely restrict the actions women can take without approval of their guardians. Women could not work or visit doctors without approval from their guardians. Women did not have the right to drive until 2018, or the ability to apply for a passport and travel independently without approval of a male guardian until 2019.[29][30]
Despite these restrictions on women’s freedoms, and a ban on oral contraceptives starting in 1975 and restrictions that continued until 1996, fertility has fallen steadily in Saudi Arabia since the ban was introduced.[31][32]
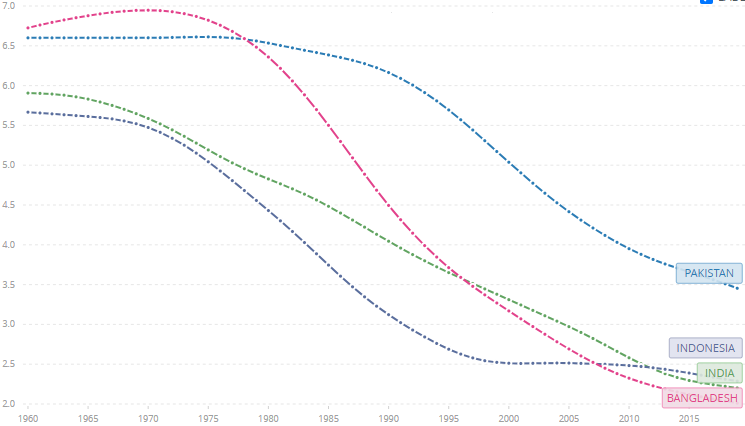
Globally, the four countries with the largest number of Muslims are Indonesia, Pakistan, India and Bangladesh. Of these four, Bangladesh was below replacement even before COVID, India dropped below replacement during COVID, and Indonesia is very close behind. [33][34][35]
Figure: Of the four countries with the largest Muslim populations, only Pakistan is still well above replacement. Source: World Bank [33]
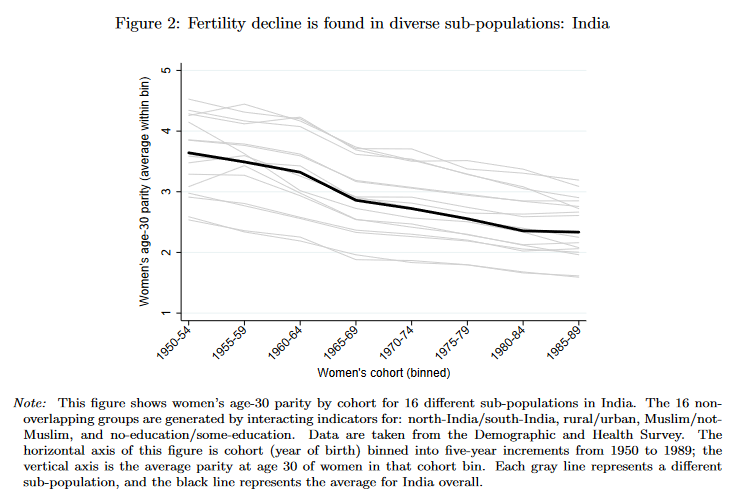
The Muslim population of India has a slightly higher fertility rate than the rest of the country and so may not be quite below replacement yet, but the fertility of Muslim populations within India has been falling in parallel with non-Muslim populations there. [36]
Figure: Total number of children had by age 30 in India has been falling in parallel in all permutations of North/South, rural/urban, Muslim/not, and no/some education. Source: Arenberg et al (2021) [36]
Evidence for secularization is less clear than the decline in fertility, but there are some statistics pointing in that direction: in the Middle East and North Africa, those who are 18-39 are 7 percentage points less likely to say that religion is very important in their lives, 11 percentage points less likely attend worship services weekly, and 12 percentage points less likely to pray every day than those who are older than 40, though this has not yet translated to being less likely to identify with a religion. [1]
In Europe
Again, there is somewhat limited information here. Most European countries, like the United States, don't directly collect data about religion. Additionally, the change of the Muslim population in Europe is still primarily being driven by migrant and refugee flows, with 60% of the growth in the Muslim population in Europe between 2010 and 2016 stemming from migration rather than natural increase. [37]
This makes it difficult to assess how large the families of the incoming population will be, because as was the case with Mexican immigrant fertility in the US, the short run TFR may be misleadingly high thanks to migration-specific tempo effects.
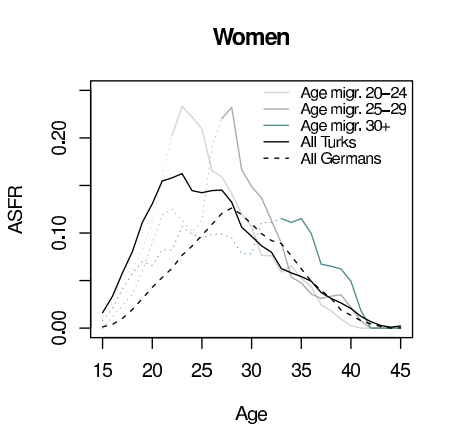
This sort of arrival effect is evident from the historical data on Turkish migrants to Germany. Again, regardless of age at migration, fertility peaks shortly after arrival. Some of this effect is due to married women reuniting with their husbands after time apart. [38]
Figure: Age-specific fertility rates are highest immediately after arrival, leading to temporarily elevated TFR that does not reflect expected completed cohort fertility. Source: Wolf (2014) [38]
If having recently migrated is a strong predictor of having a kid, and a significant fraction of the measured population has recently immigrated, then this will result in TFR estimates that are substantially below completed fertility. The women who migrated to Turkey in their early twenties will not have the same fertility rate in their late twenties and early thirties as those who migrated at those ages. [38]
That being said, it is fairly undeniable that the share of Europeans descended from the current Muslim population will continue to grow. This was true even before the influx of immigrants and refugees since 2010. However, at least prior to 2010, this was not driven by Muslim immigrants having objectively large families, but rather by the small families of everyone else.
In the period from 2005-2010, the Muslim TFR in Europe was barely above replacement at 2.2, compared to an average TFR of 1.5 for everyone else in Europe. It was even below replacement in Germany, Italy and Spain, though not as far below replacement as the non-Muslim population of those countries. An additional driver of growth is the age distribution. [39]
After additional migration in the 2010’s, the TFR of Muslims in Europe rose to 2.6, possibly in part due to the temporary arrival effect documented above. However, even with this influx and increased fertility, Pew projects that it would take continued migration at the heightened 2014-16 levels to avoid population decline in Europe by 2050. Migration at prior levels would be insufficient to avoid population decline. [37]
Addressing Africa and East Asia
The body of the book focused mostly on within country fertility dynamics. However, the most compelling evidence for religion inheriting the earth comes from between country dynamics. The decline in the share of the unaffiliated will come not from losing ground within countries, but rather that the countries which have large fractions of the unaffiliated will grow slower than the rest of the world.
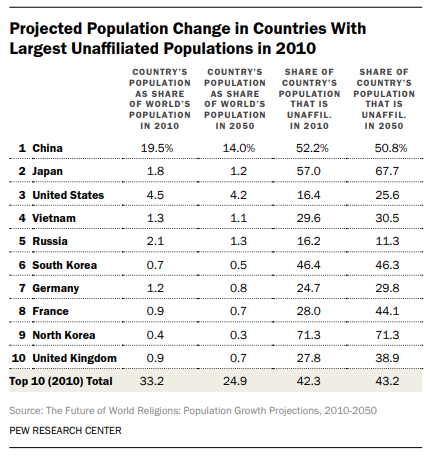
Pew Research projects that while the unaffiliated share will decline overall, the unaffiliated share of the population will slightly increase in the countries where it is currently most populous. I expect it to go up by more than Pew does. Note that the share unaffiliated in the United States was forecast to go up from 16% to 25% by 2050, but has already reached that, and as discussed earlier, the age distribution of the unaffiliated suggests that that percentage will continue going up in the medium term, with 36% of younger Millennials unaffiliated. [11]
Several of the countries on this list are East Asian countries which have substantially below replacement fertility. Rather than gaining ground within currently more secular countries, the main source of religious growth will be from population growth in sub-Saharan Africa. [40]
East Asia
The Asian countries listed in the earlier table of countries with the largest unaffiliated populations all have had below replacement fertility for at least the past decade, in some cases far below.
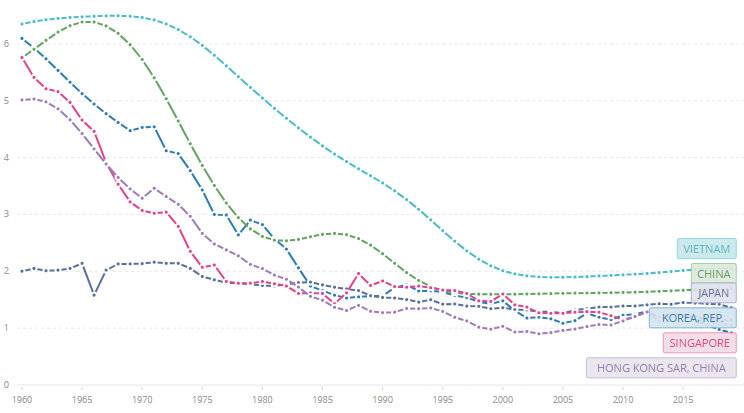
Figure: Vietnam, China, South Korea and Singapore all have seen steep drops in their TFR from the 1960s. Japan has persistently had a low TFR over this period. Source: World Bank [41]
South Korea’s TFR in particular had both a rapid drop and an astonishingly low bottom, with a TFR that started above 6 in 1960, fell below replacement in the 80’s, reached a TFR of .84 in 2020, and likely fell even further in 2021. South Korean government projections forecast that TFR will stay below 1 until 2031. [42][43]
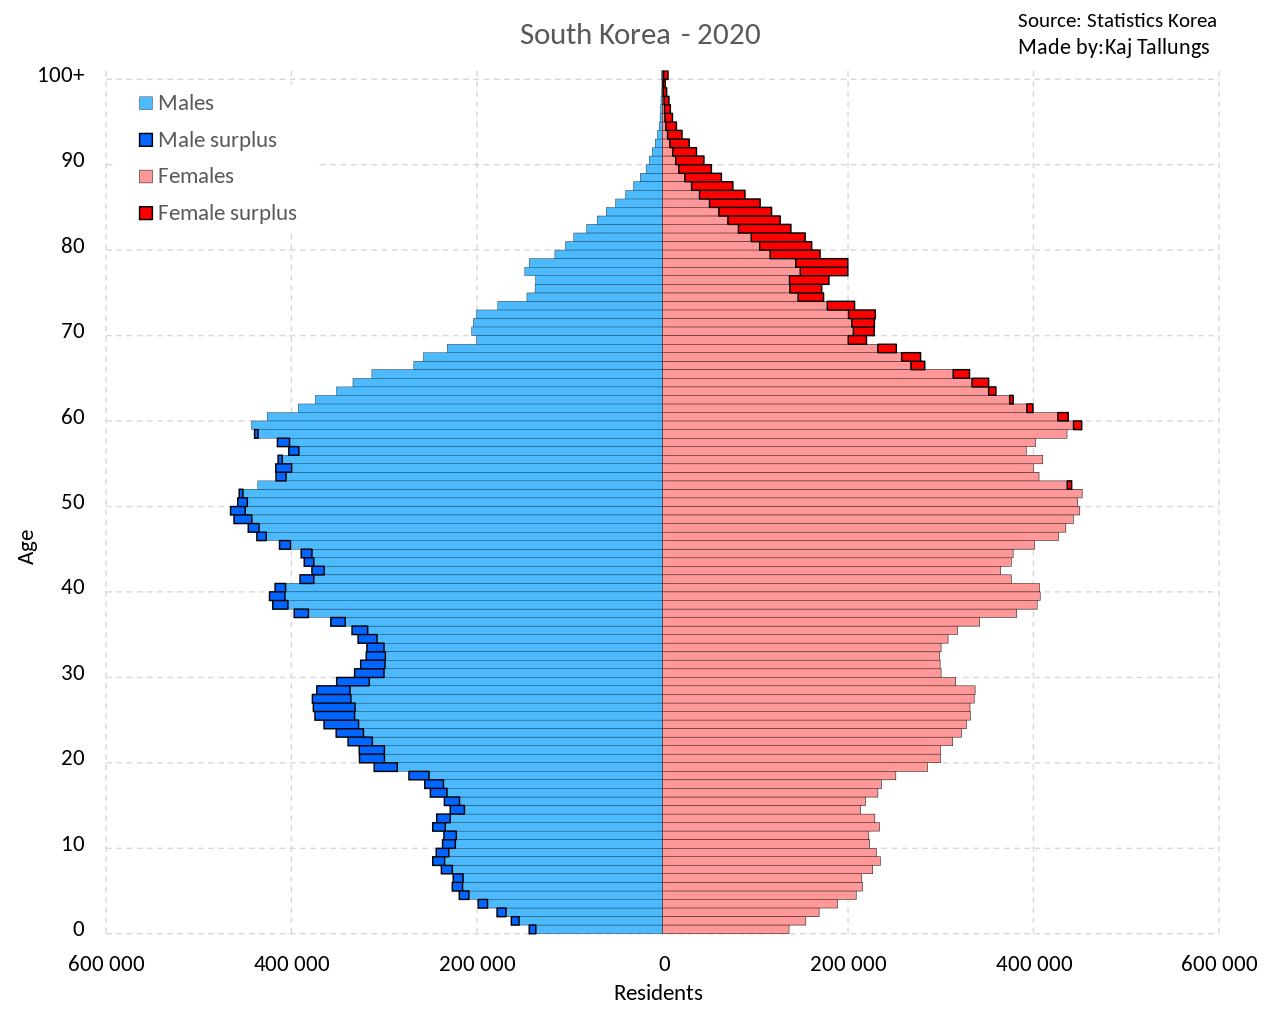
Figure: South Korea’s population pyramid shows the effects of several decades of below replacement fertility, with each cohort born in the past decade hitting a new low. Source: Wikipedia [44]
South Korea is also a great example of population momentum: while its TFR has been below replacement since the 80’s, South Korea only experienced its first population decline last year, and it could have likely made it another couple of years without population decline were it not for COVID. So even if a population is growing, this doesn’t necessarily mean that the demographic pyramid isn’t inverting.
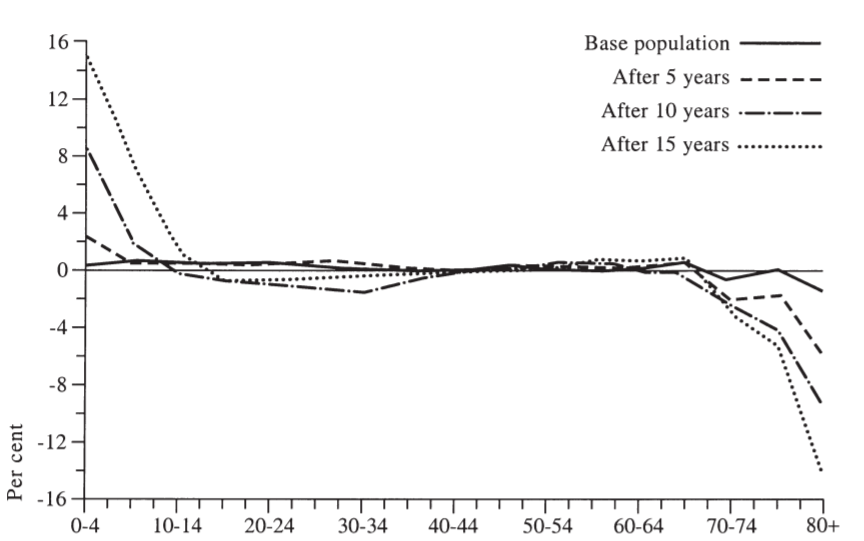
United Nations population forecasts have systematically overestimated future fertility and underestimated improvements in life expectancy. This difference is most stark in Europe, but can also be seen in global aggregates. [45]
Figure: Mean percentage error in European projected age structures, projections 1965 to 1990II. Share of population below 5 is repeatedly lower than estimates, immigration is underestimated and share of population >70 is repeatedly higher than estimated. Source: Keilman (2001) [45]
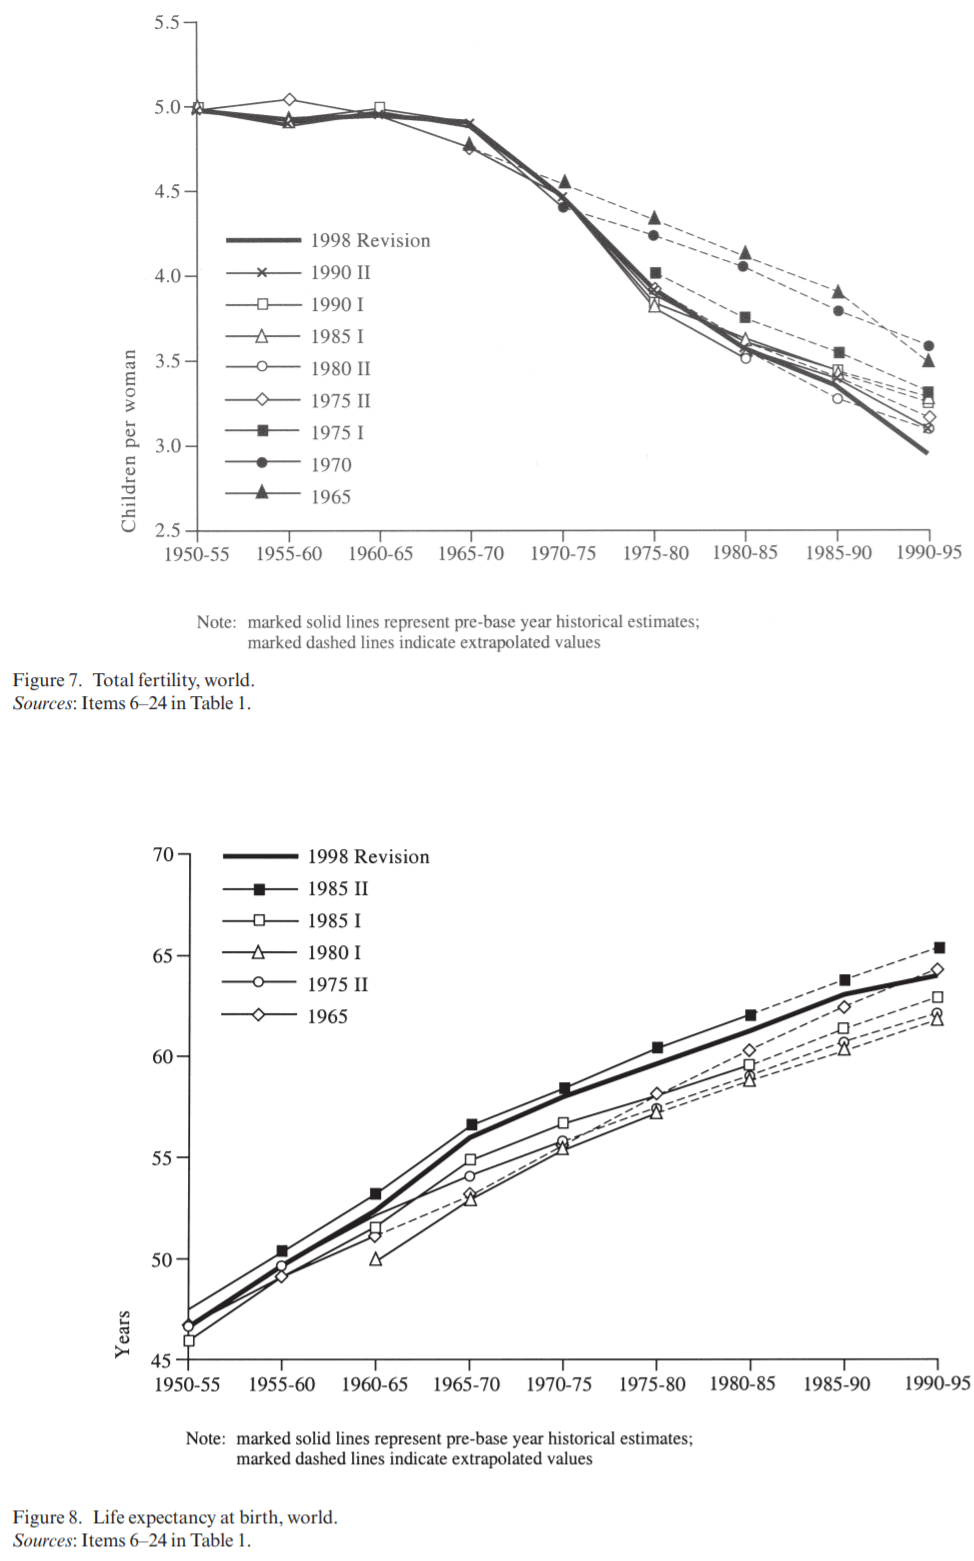
Figure: Fertility projections for 1990-95 all were higher than retrospective estimates, life expectancy projections were mostly lower than retrospective estimates. Source: Keilman (2001) [45]
Africa
For reasons unclear to me, the book did little to address sub-Saharan Africa. This seems an obvious inclusion: Africa has a large number of devout believers of each of Christianity and Islam, and is the continent with the most rapidly growing population, so most growth in both of those religions will come from population growth here.
This is the region that drives the most uncertainty about my future projections.
First, a brief overview, and then an argument for each side: why Africa might drive religious growth in the next century, and why it might follow the trend of everywhere else, with growth eventually falling below replacement.
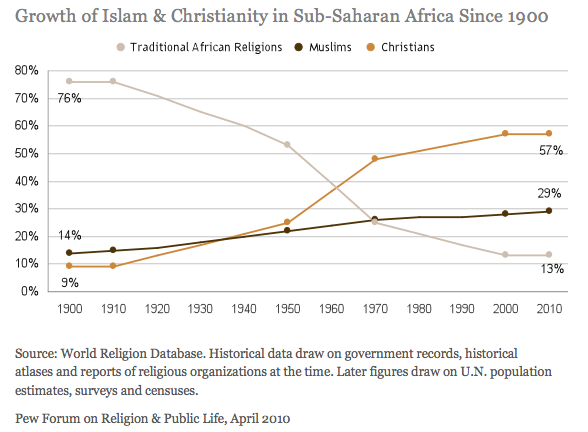
The majority of sub-Saharan Africa is Christian, with a large but growing Muslim minority, but this is a fairly recent development. Prior to 1950, the majority of the continent practiced traditional religions.[46]
Figure: Since 1900, adherents of traditional African religions have declined dramatically, while Christianity and to a lesser degree Islam gained adherents. Source: Pew Research [46]
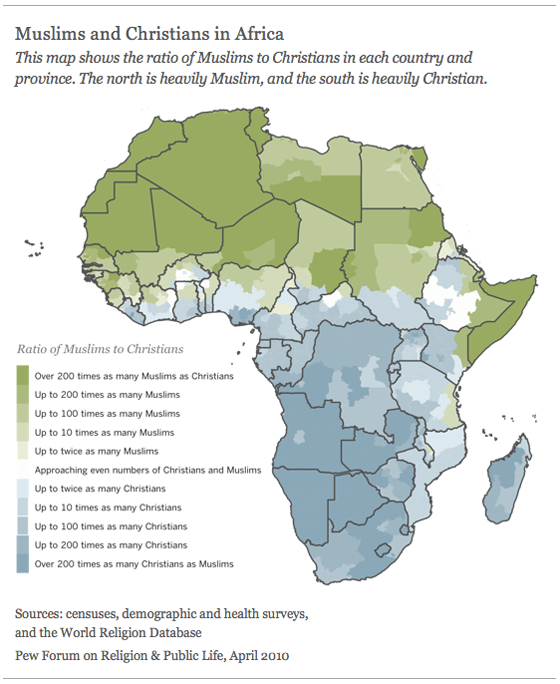
The below map shows the distribution of adherents of both Christianity and Islam.
Figure: In Africa, Islam is most prevalent in the north, while Christianity is most prevalent in the South. Source: Pew Research [46]
With the highest fertility and growth rates in the world, Africa is projected to grow substantially both in absolute terms and as a share of the world population in the coming decades. But exactly how much growth is unclear.
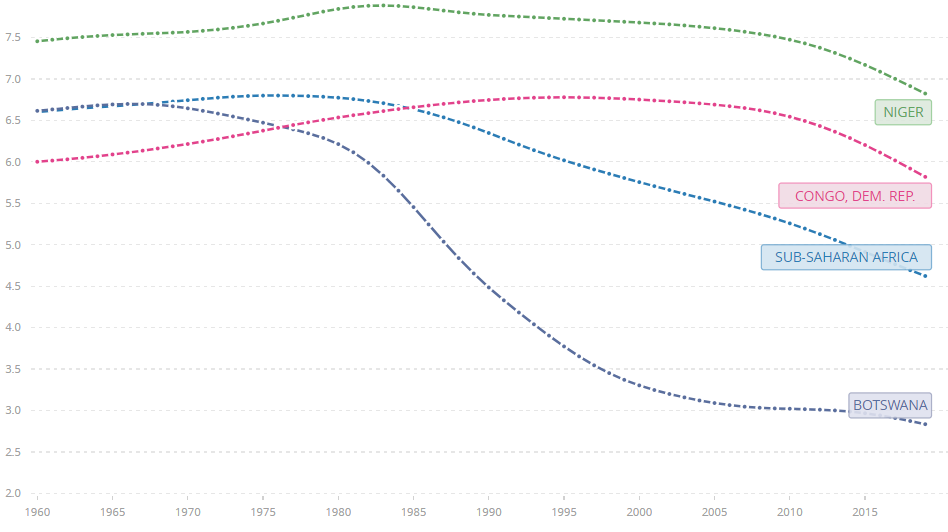
Sub-Saharan Africa is going through the fertility transition at a steady rate, though the decline started later and the rate is falling more slowly than other parts of the world, falling from an average TFR of 6.8 to 4.6 since 1980. Both Niger, the country in the world with the highest fertility rate, and the Democratic Republic of the Congo, which had persistently increasing fertility until the 90's, have seen declines in recent years. [47]
A decline doesn’t necessarily mean that fertility keeps falling to or below replacement. Sometimes there are pauses or reversals. Compared to the rest of Africa, Botswana had a relatively early and steep decline, but then stabilized and stayed around 3 for over a decade before continuing to decline again.
Figure: Sub-Saharan Africa as a whole has seen slow but steady fertility decline since 1980, though there is some internal variation. Source: World Bank [47]
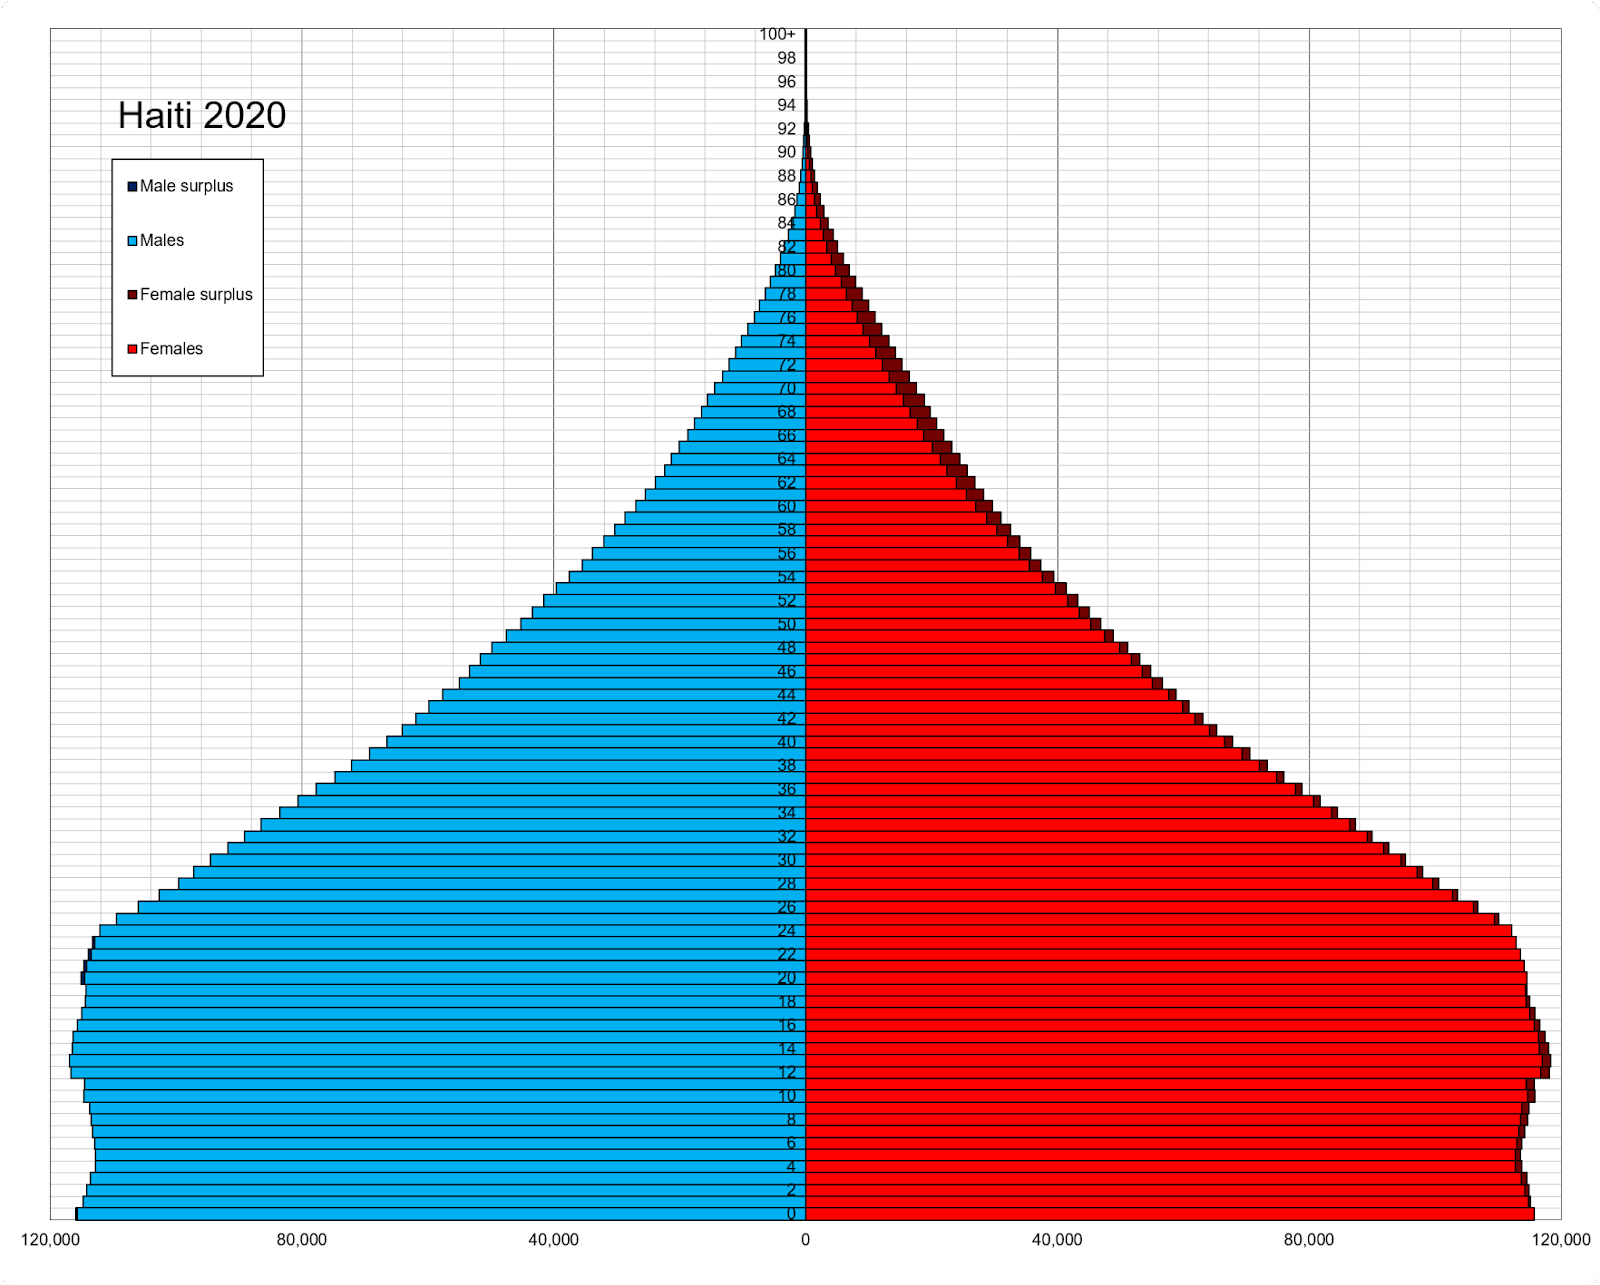
It is worth noting that some places have had abrupt fertility transitions after long periods of high and stable fertility, so the relative slowness of Africa’s transition doesn’t preclude a more rapidly declining population pyramid. Earlier, we saw the population pyramid of South Korea, which in no way resembled a pyramid. Haiti’s population pyramid is a very clean example of a transition from a traditional population pyramid to one with stable cohort sizes.
Figure: While the population of Haiti is still growing, the sizes of birth cohorts stabilized fairly abruptly. Yes, I know Haiti isn't in Africa but this pyramid is just such a clean transition from increasing to stable cohort sizes, I needed to work it in here somehow. Source: Wikipedia [48]
Note that somewhat counterintuitively, this population pyramid is associated with a TFR that has not yet dropped to replacement: the size of newly born cohorts is much larger than the average cohort size of the reproductive age population. Because the reproductive aged population is still increasing, we observe simultaneously falling TFR and flat cohort sizes.
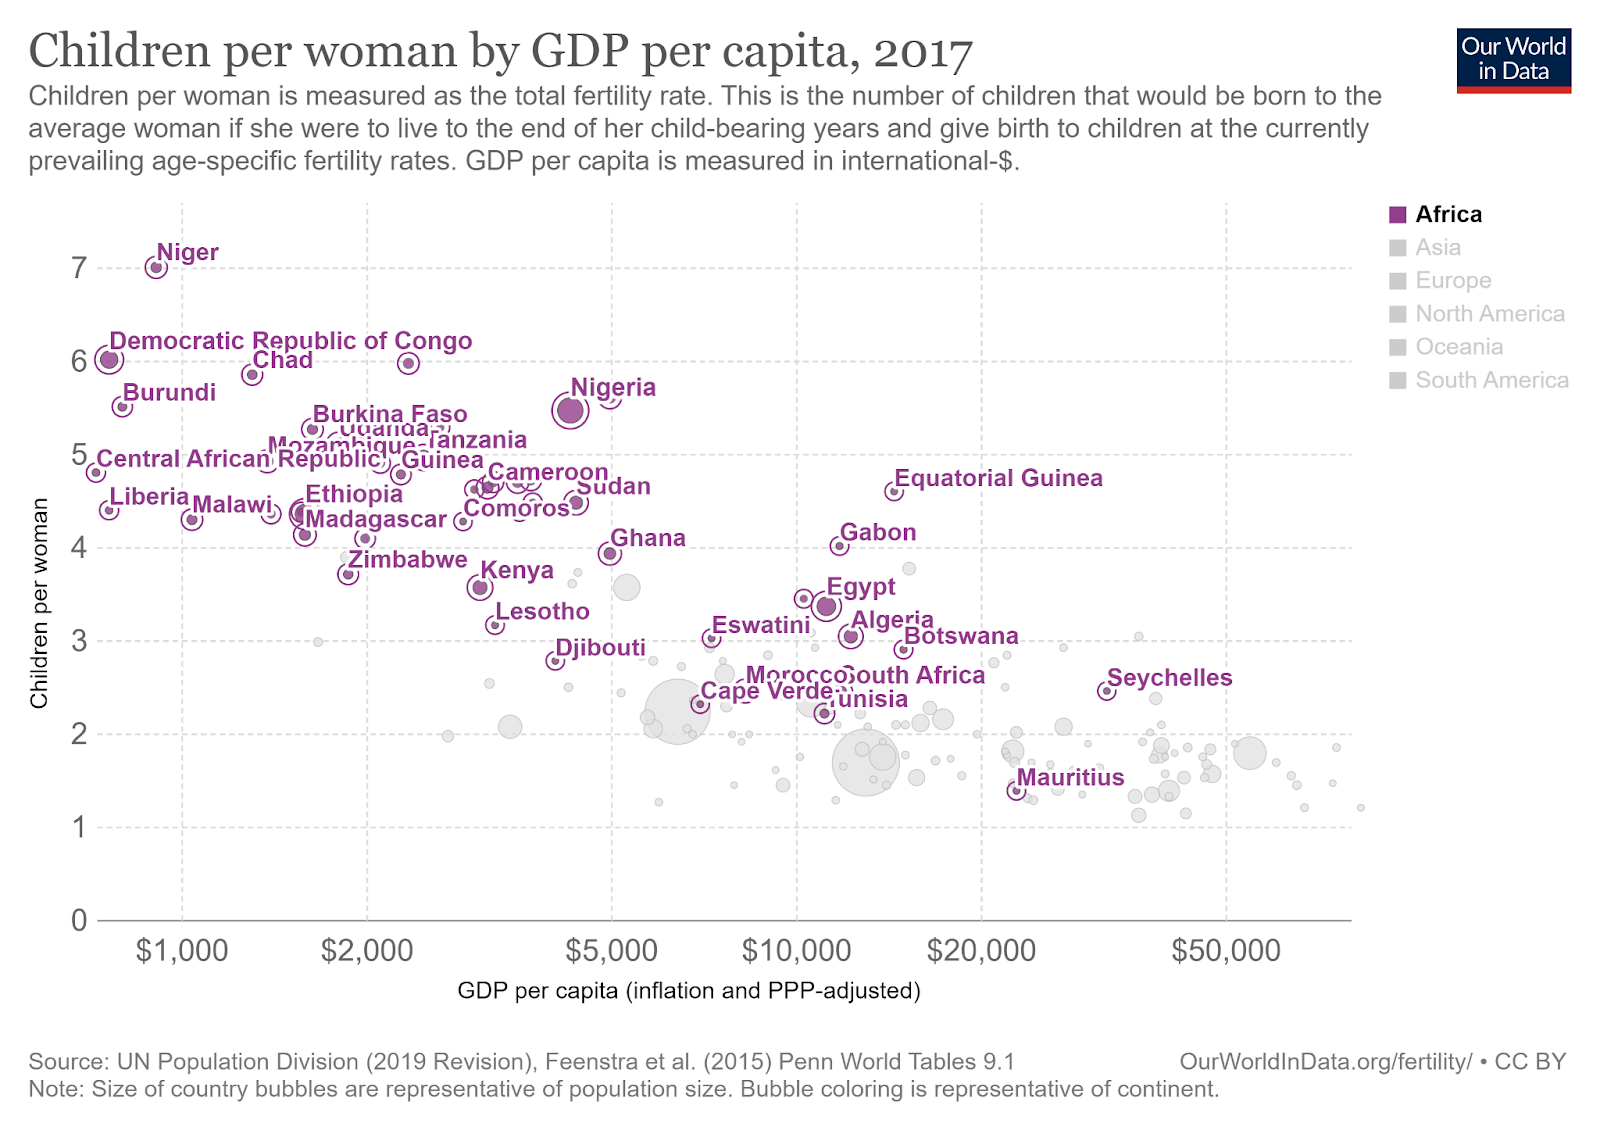
The usual relationship between fertility and income/education/development holds: within Africa, countries with higher GDPs per capita / more years of schooling / higher Development Index scores have fewer children. As Africa gets richer and more educated and more developed, the fertility rate will likely decline there as it has elsewhere. While some papers argue that sub-Saharan Africa is going through the fertility transition more slowly than Asia and South America, and has a higher level of fertility at given GDP per capita, they still find the usual relationship between these indicators and fertility. https://onlinelibrary.wiley.com/doi/full/10.1111/j.1728-4457.2016.00164.x
Figure: Within Africa, higher income is correlated with lower fertility, which is also the case internationally. Source: Our World in Data [49]
Insofar as there are outliers in the graph above, they can partially be explained by extreme levels of income inequality that result in much lower development than would typically be expected for a given level of GDP per capita. A clear case of this is Equatorial Guinea, one of the richest countries in Africa due to having substantial oil exports. Because of the uneven distribution of this wealth, Equatorial Guinea has a very low Human Development Index ranking, and has a much higher GDP per capita than most of its neighbors on the list, while having lower levels of education and life expectancy.[50]
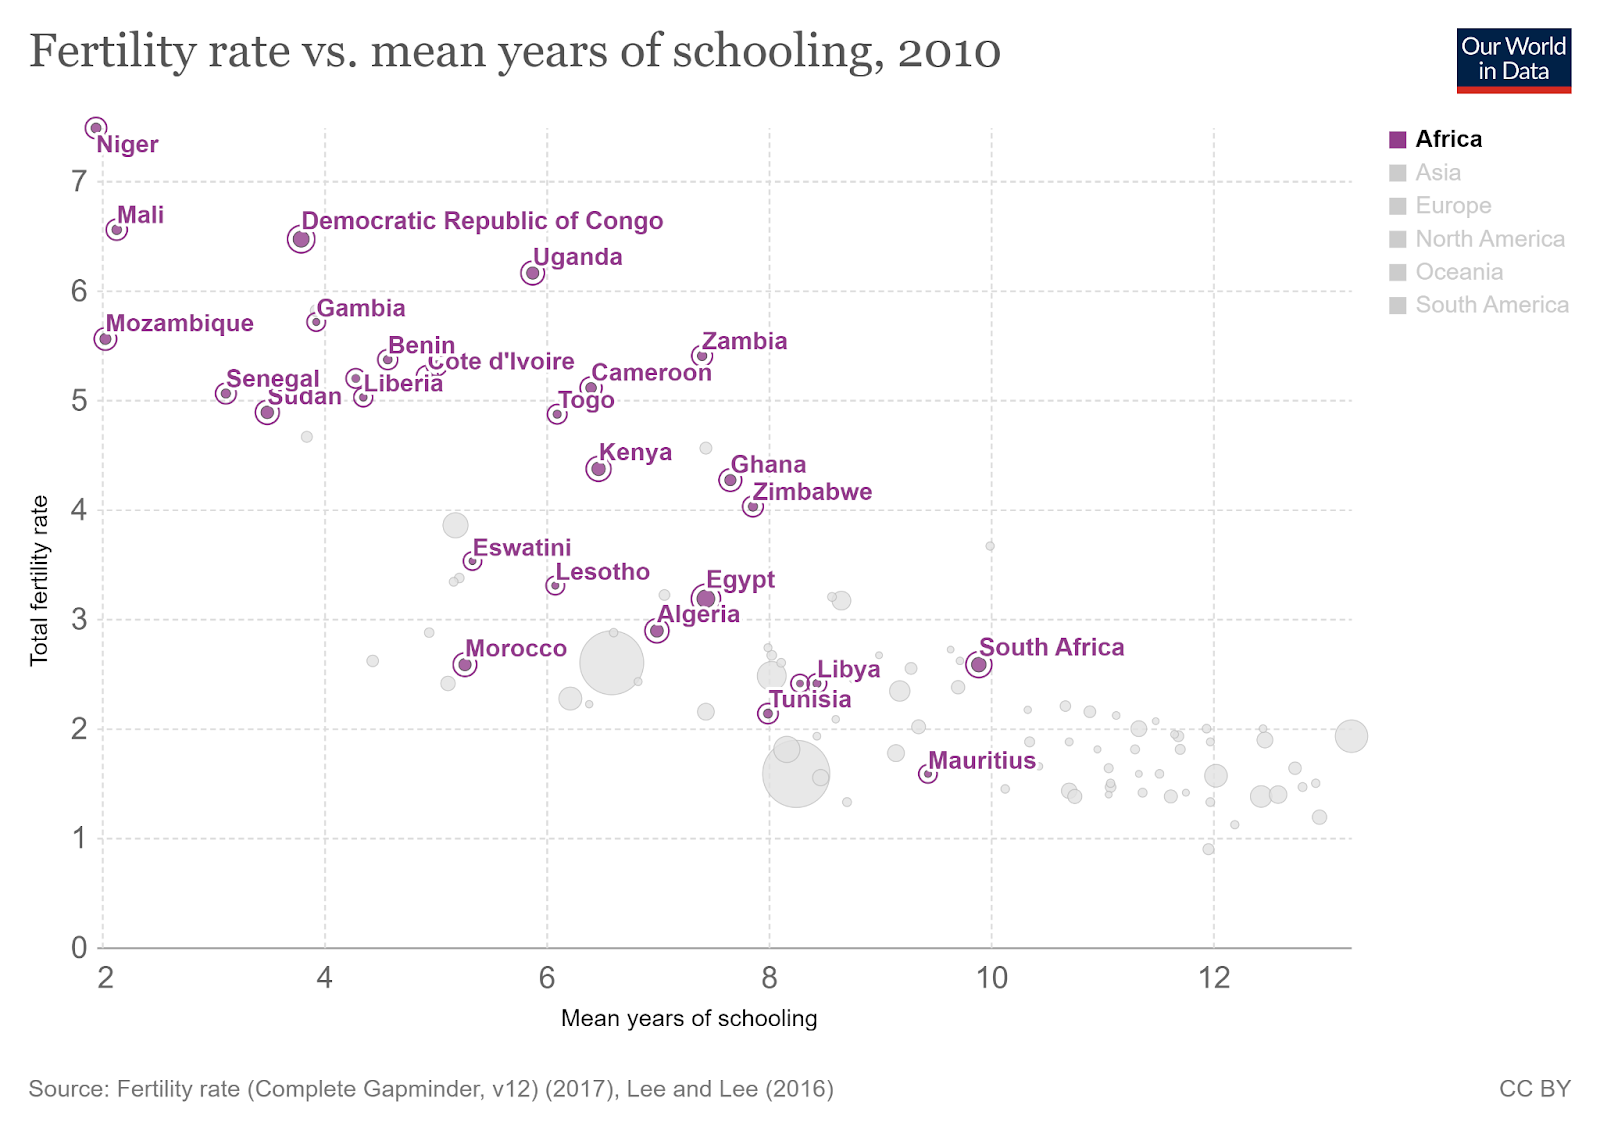
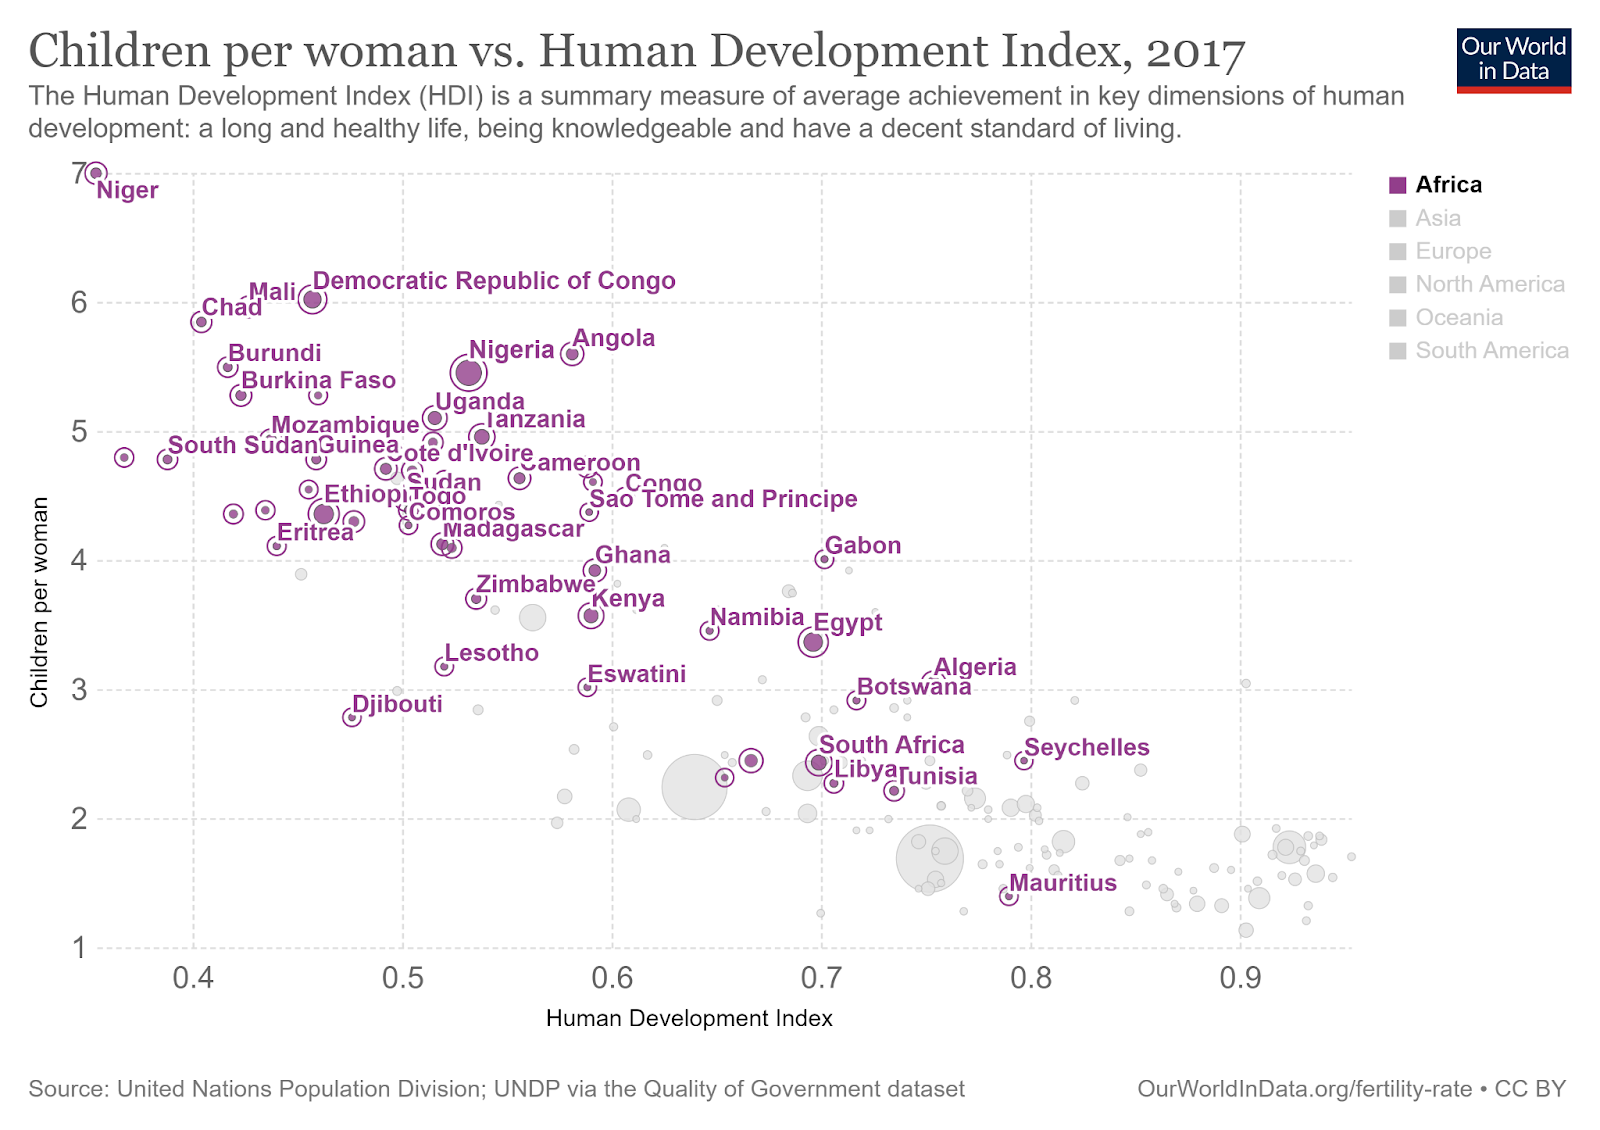
The reason for the correlation between higher income and lower fertility is still hotly debated: many things are correlated with higher GDP, and therefore with lower fertility. There is a similar relationship between fertility and mean years of schooling, and between fertility and the Human Development Index Rating, which incorporates GDP, years of education, and other measures.
Figure: Within Africa, higher mean years of schooling is correlated with lower fertility, which is also the case internationally. Source: Our World in Data[51]Figure: Within Africa, a higher score on the Human Development Index is correlated with lower fertility, which is also the case internationally. Source: Our World in Data [52]
While it may be useful to understand the exact mechanism, even without having it pinned down these metrics are likely to continue to be correlated and fertility will likely to continue to decline.
Even with a steeper decline in fertility, population momentum would still result in Africa's population will grow substantially over the coming decades. I feel very uncertain about how Africa will change global religiosity going forward: I think there is a strong case to be made that Africa is one of the places that will be the most different in a couple of decades compared to today.
Bucking the Trend
Of the groups brought up in the book, the two most compelling exceptions to the trend of declining fertility are Old Order Anabaptists and Haredi Jews.
Both of these groups are relatively small on a global scale: at under half a million members, the Old Order Anabaptists are less than 1/10000ths of the global population, and at near 2 million, Haredi Jews are about 1/2500th.
The Slower Anabaptist Decline
I look at three Old Order Anabaptist groups, the Amish, the Hutterites, and the Old Order Mennonites. All three of these groups eschew contact with broader society, reject the use of modern technology and have high fertility and retention rates. Fertility rates have declined over the past century, though estimates of precisely how much vary. Studies found fertility rates to be between 8-10 children a family at the beginning of the 20th century. There is evidence that members of some of these groups are now using contraception as well as engaging in other types of fertility control, and more recent estimates of fertility are around 5. [53][54][55][56]
Of these groups, the Amish are about 5-10 times as populous as the Hutterites and the Old Order Mennonites. The Hutterites are primarily located in Canada, while the other two groups have most of their members in the United States.
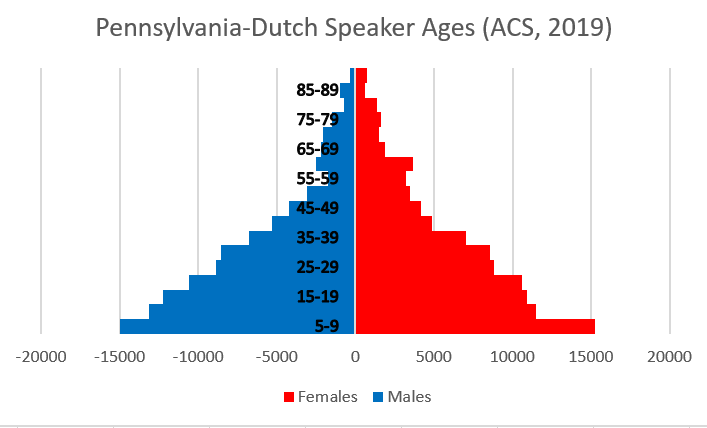
Most Amish and Old Order Mennonite groups speak Pennsylvania Dutch, though there are some Amish groups that speak a different dialect of German. In the United States, almost all speakers of Pennsylvania Dutch are Amish or Old Order Mennonites, though there are some car driving Mennonite groups that also speak it.
This makes it a useful proxy for group membership, as the American Community Survey asks a question on speaking a language other than English at home. Using responses to that question, it is possible to construct a population pyramid for individuals (aged 5+) who speak Pennsylvania Dutch.
Figure: Population pyramid of Pennsylvania-Dutch speakers shows growing cohort sizes. Own visualization; data from: IPUMS USA, University of Minnesota, www.ipums.org
Their population pyramid is actually a pyramid, as opposed to a Rorschach test!
While they have featured consistent growth over the past century, there is some reason to believe that they will not be able to keep up this growth going forward. Historically, the Amish have been farmers, but farmland that they can expand into is getting harder for them to find and afford. While data is sparse enough that it is not possible to establish a causal relationship, rather than a correlation, the subgroups of Amish that have the lowest rates of farming also have the lowest fertility rates and rates of retention. [56]
The need to expand outward is also evident looking at the growth of settlements. The Amish are organized by a group of households coming together to form a settlement, with most settlements having fewer than 30 households. The Amish expand primarily by forming new settlements, not by adding additional households to existing settlements. Settlements founded before 1980 have less than a quarter of the growth rate of settlements founded after 2000.[57]
As purchasing additional land for new settlements becomes more difficult, existing settlements will have to densify and the Amish will need to move into non-farming careers, a transition which has already started to occur. The coming decades will show whether the Amish can undergo such a disruption of their lifestyle without affecting growth rates, but my expectation is that their success at growth is reliant on their current lifestyle, and by the time they reach 1% of the US population, which is between 3-4 doublings of their population away, they will have some combination of lower fertility and retention.
Haredi Judaism
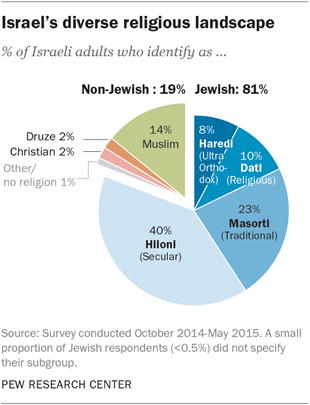
Finally, we move onto the Haredim (Ultra-Orthodox Jews). The majority of Haredim live in Israel, with a smaller community in the United States, and some communities in Western Europe and elsewhere. I will be focusing primarily on the characteristics of the community in Israel in this post, as this is the largest and best surveyed community.
Figure: Distribution of Israeli religious identifications in survey from 2014-2015. Haredi share has increased slightly since. Source: Pew Research [58]
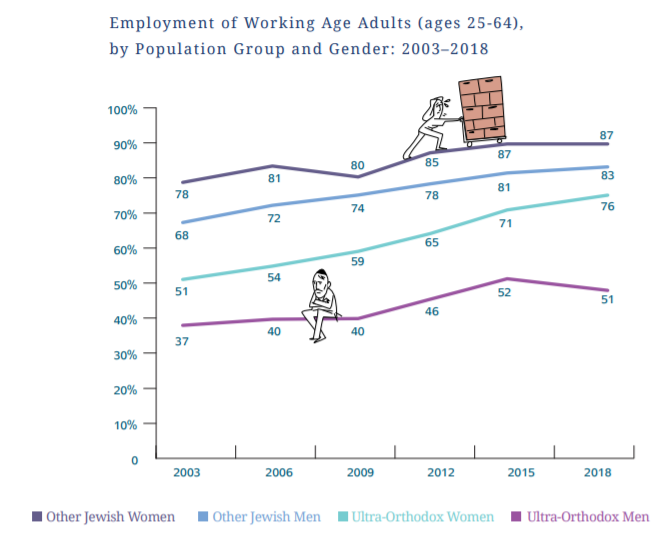
Besides the Amish and Hutterites, this is the group discussed in the book that most eschews modernity. However, the degree of separation between themselves and the society that they live in is much lower than that of the Amish, and in the past two decades, there has been substantial changes in participation in broader society. One such change is the increase in labor force participation, especially among Ultra-Orthodox women. [59]
Figure: Labor force participation rates have increased since 2003 for both Ultra-Orthodox and non-Ultra-Orthodox men and women. Source: Israel Democracy Institute [59]
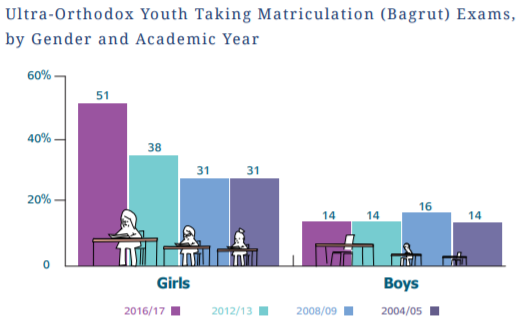
Other indicators, such as women completing matriculation exams and going on to university, have also gone up substantially in the past decade:
Figure: While the share of Ultra-Orthodox boys taking high school matriculation exams has been flat, there has been an increase in the share of Ultra-Orthodox girls taking them. Source: Israel Democracy Institute [59]
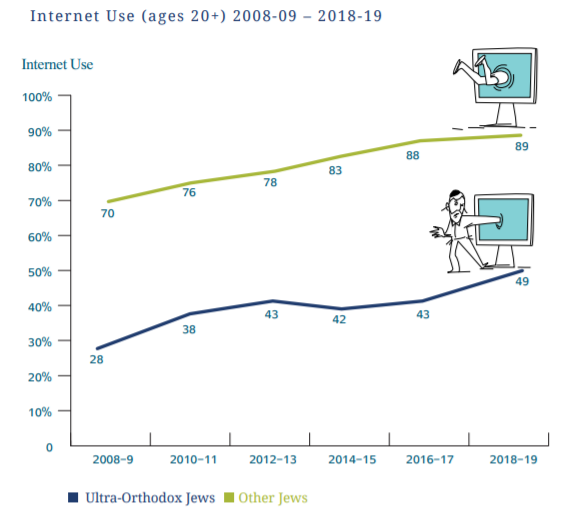
Overall, the Haredi are not as strenuously opposed to using technology as the Amish, though they still use less of it than the general population. Internet usage increased from 28% to 49% between 2008 and 2018, and the COVID pandemic led to an additional sharp increase in internet usage among the ultra-Orthodox, bringing the usage up to around 66%.[60] About 40% own cars, and nearly 60% of ultra-Orthodox men have drivers licenses. The rate of having a driver's license is much lower among ultra-Orthodox women, at 30%.
Figure: Internet use nearly doubled among the Ultra-Orthodox between 2008 and 2018. Source: Israel Democracy Institute [59]
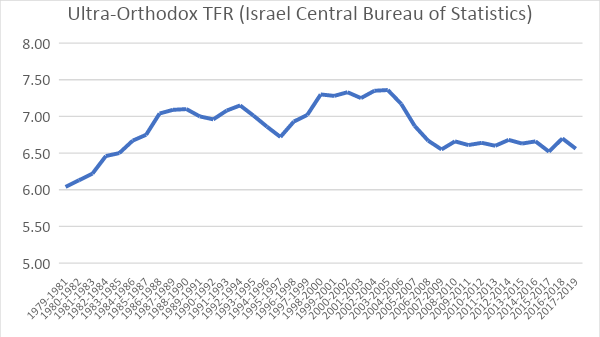
Despite these changes, the fertility rate has remained roughly stable. While down from the peak in early-to-mid 2000’s, TFR has remained flat for the past decade and is at the level it was in the mid-80’s.
Figure: Ultra-Orthodox has been steady at 6.5 for the past decade, and shows no clear trend over the past 40 years. Own visualization. Data from Israeli Central Bureau of Statistics.[61]
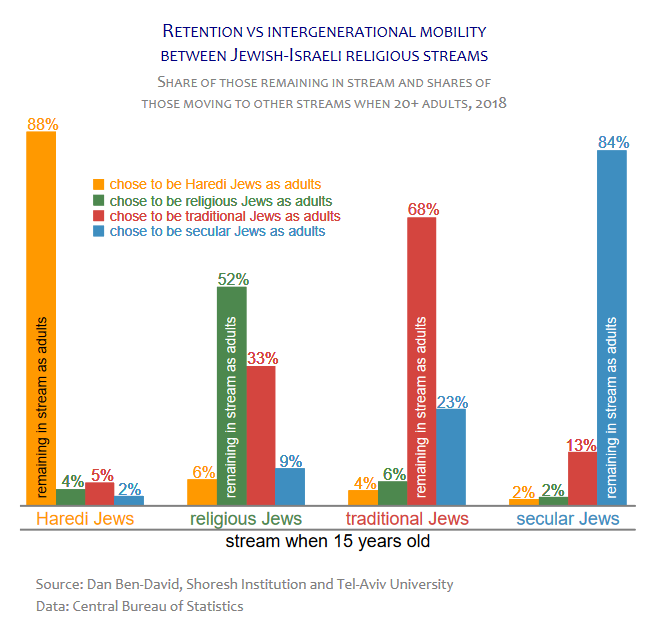
Haredi and secular (Hiloni) Jews both have higher rates of retention than religious (Dati) or traditional (Masorti) Jews. While more people switch into considering themselves secular Jews, this rate is insufficient to make up for the higher fertility rate of the Haredi.[62]
Figure: Religious and traditional Jews have lower rates of retention then the Haredi or secular Jews. Source: Shoresh Institution [62]
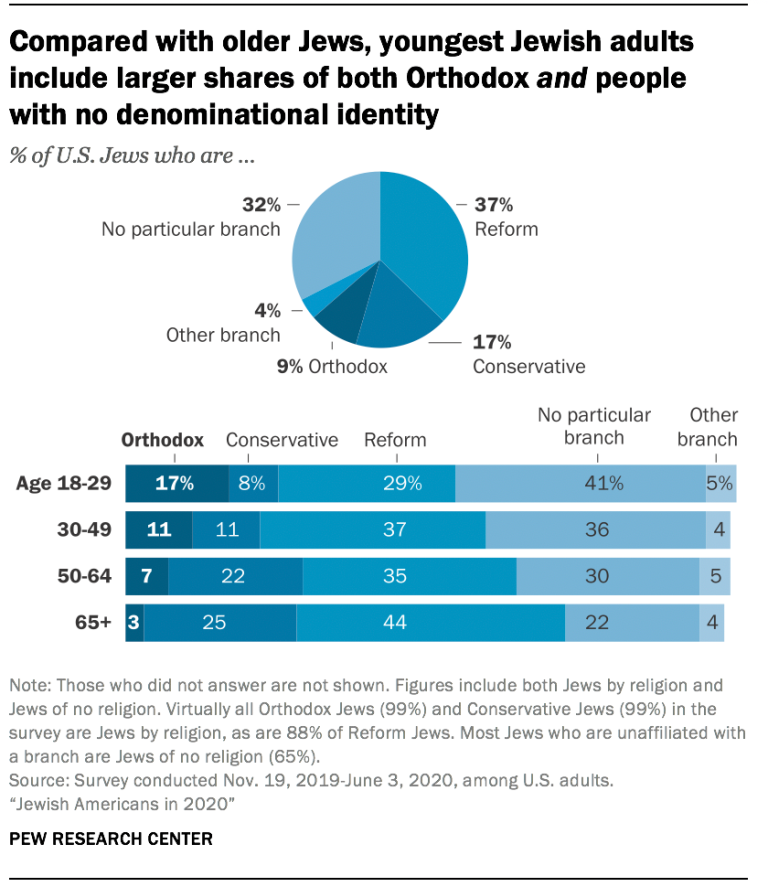
The American Jewish population also has a similar pattern, where the Orthodox and secular shares are lower for earlier generations and higher for later generations:
Figure: A smaller share of younger cohorts identify as Conservative or Reform, while a larger share identify as Orthodox or with no particular branch. Source: Pew Research Center [63]
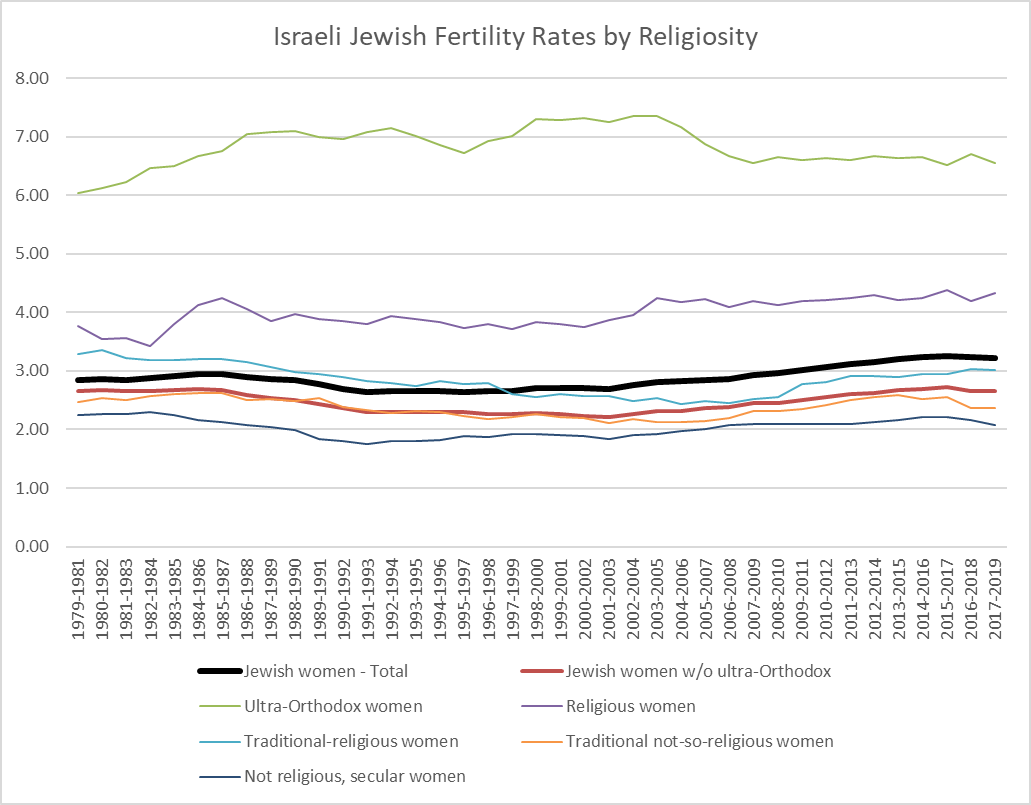
Note that while the Haredi have a much higher fertility rate than other subgroups, which brings up the average, Israeli Jews and Israel as a whole would still have a relatively high fertility rate even without including them in overall fertility estimates.
Figure: Jewish fertility in Israel increases by religiosity, but is still above replacement even when excluding the Ultra-Orthodox fertility rate. Own visualization. Data from Israeli Central Bureau of Statistics. [61]
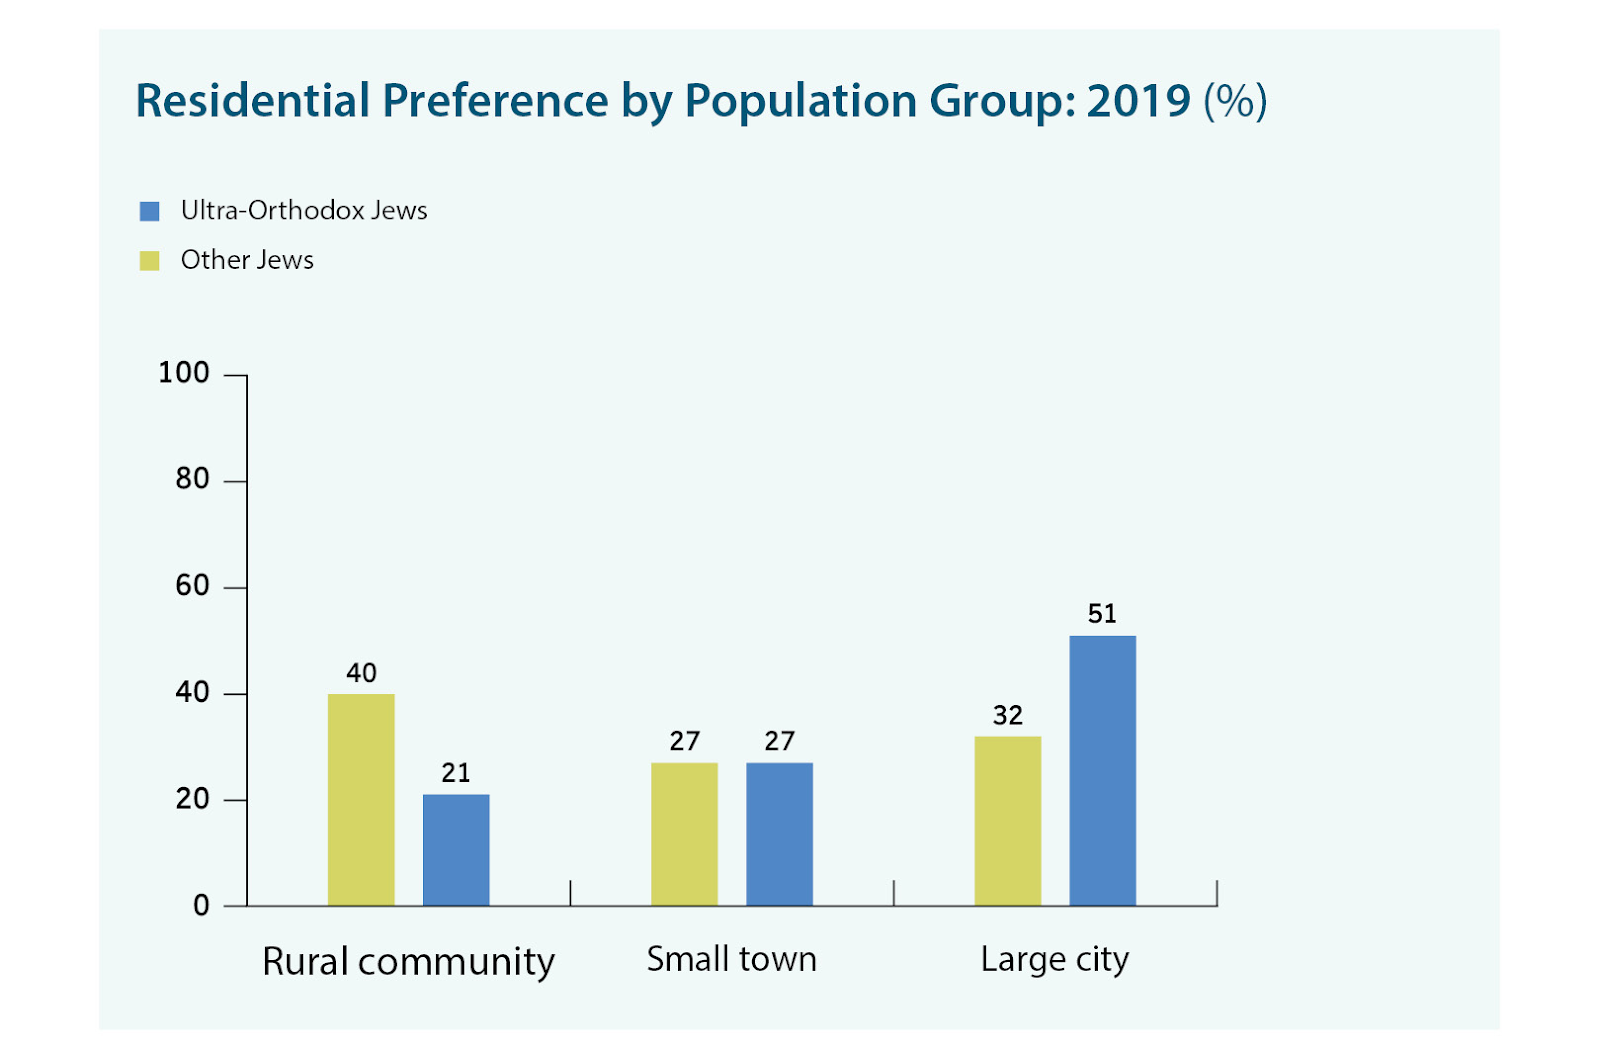
One way in which the Haredi have higher expansion potential than the Amish is that their lifestyle does not rely on maintaining a low density. In fact, in Israel, the majority of ultra-Orthodox prefer living in a large city to living in a small town or a rural community, and more respondents prefer living in an apartment building to living in a single family home. [64]
Figure: Ultra-Orthodox Jews in Israel have higher density residential preferences than other Jews. Source: Israel Democracy Institute. [64]
While the Haredi are growing in number in both the United States and in Israel, the impact of their growth is much larger in Israel since they are already a larger share of the population there. Though estimates of when they will constitute a majority differ, it seems clear that they will constitute a growing share of the population of Israel going forward, and will plausibly constitute a majority of the population of Israel sometime sometime in the next century.
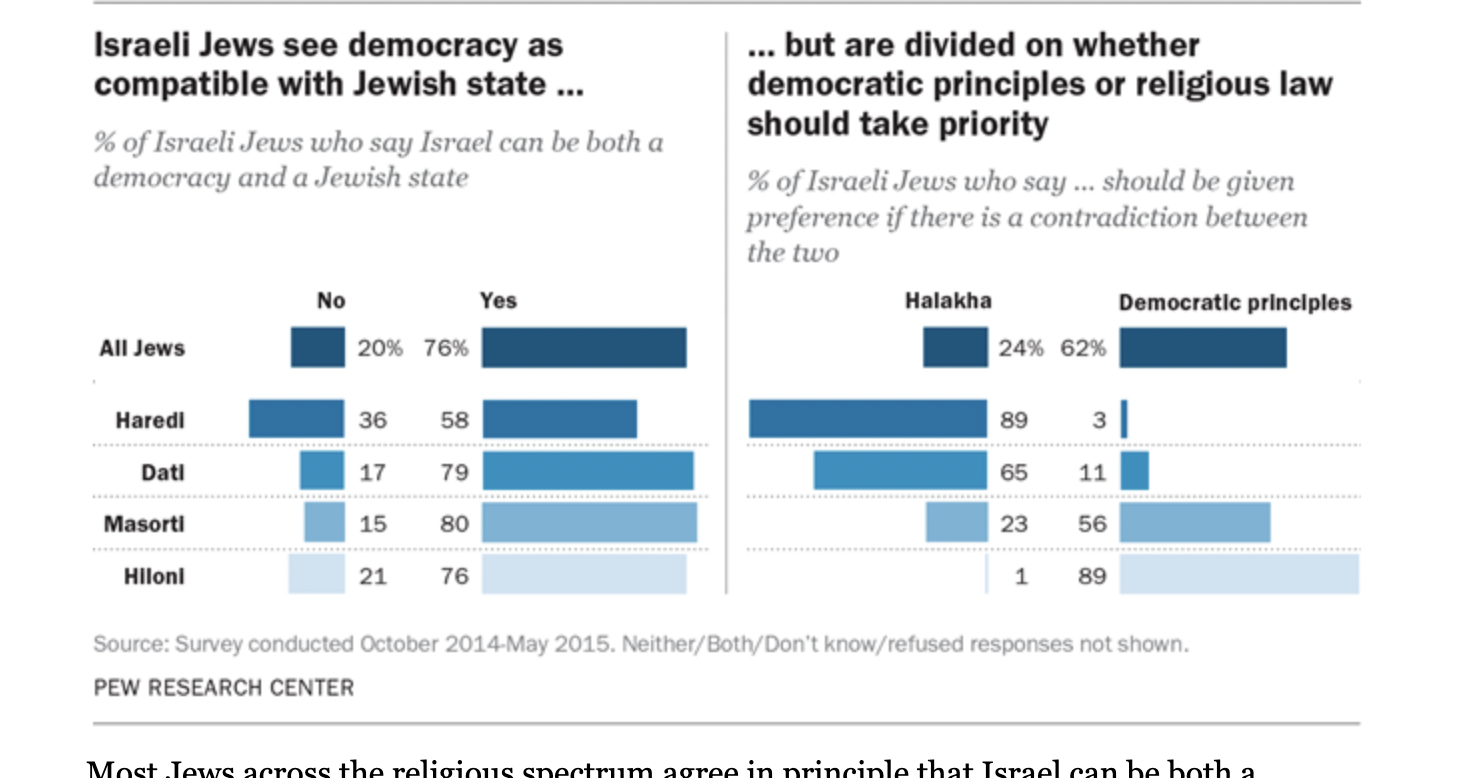
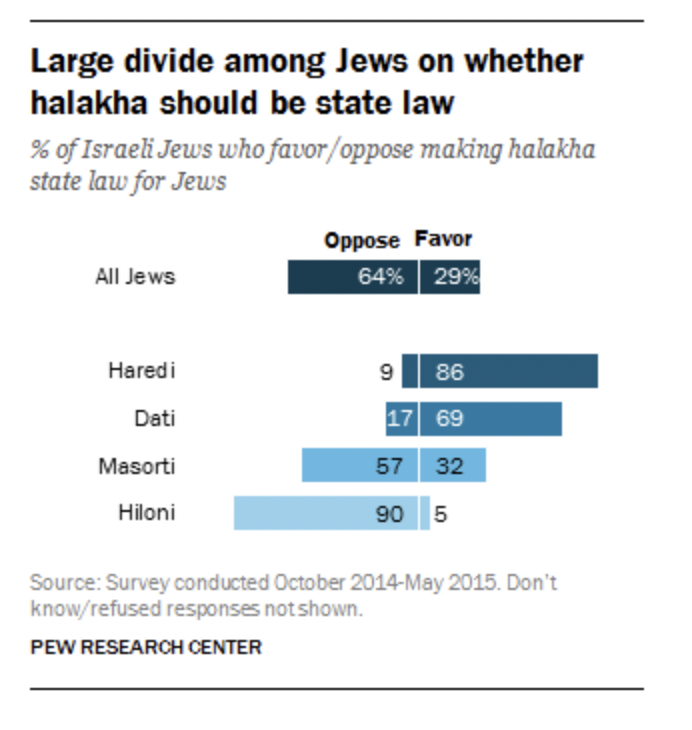
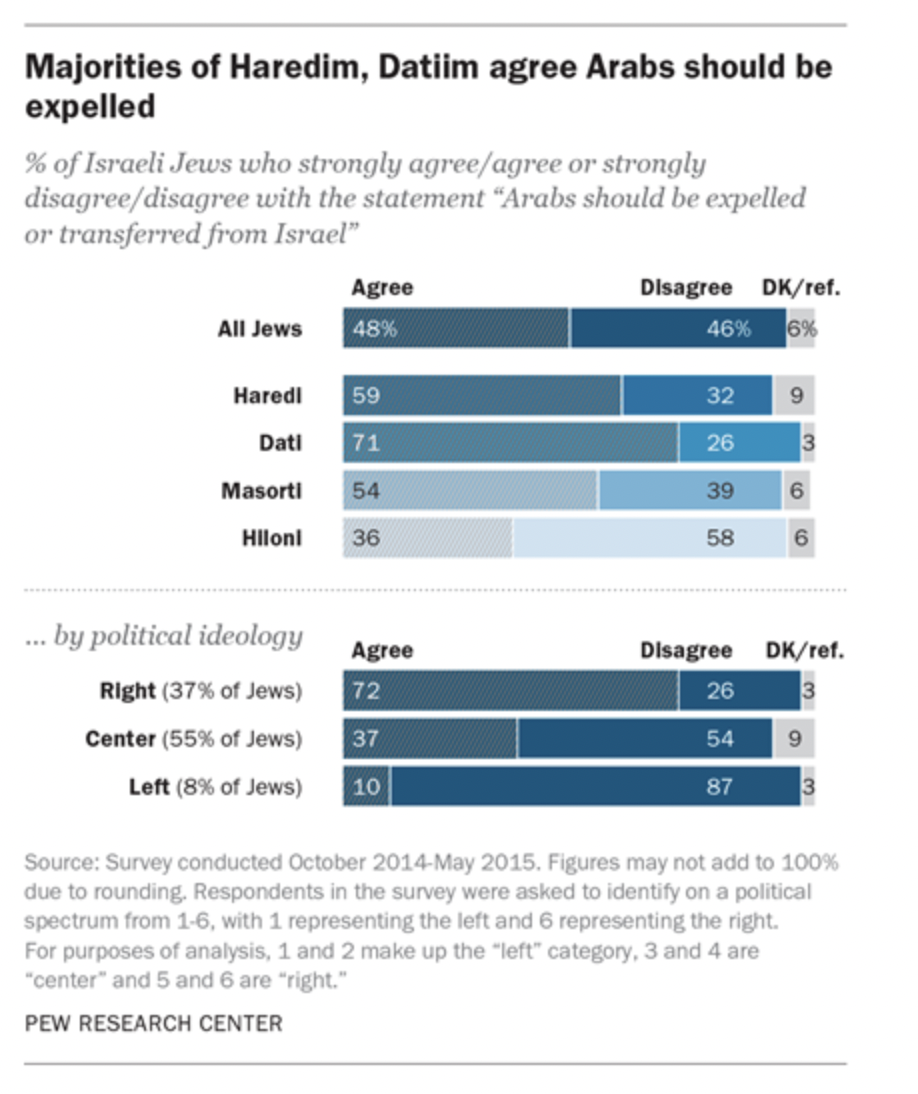
What this will mean for Israel is unclear. Recent trends in greater technological adaptation and labor force participation among the Haredi are relatively positive signs for the economic implications of future growth. Some argue that this will make Israel more right-wing, as the Haredi currently tend to vote for more right-wing Israeli parties, though this has not always been the case in Israel historically. While there is a clear relationship between religiosity and the role of religion in public life, views on other political issues are less determined by religion. [65][66]
Figure: Survey responses find clear relationship between religiosity and role of religion in public life in Israel. Source: Pew Research [66]Figure: Political ideology exhibits a less monotonic relationship with religiosity, but there are still political differences between groups. Source: Pew Research [66]
Mistaken predictions
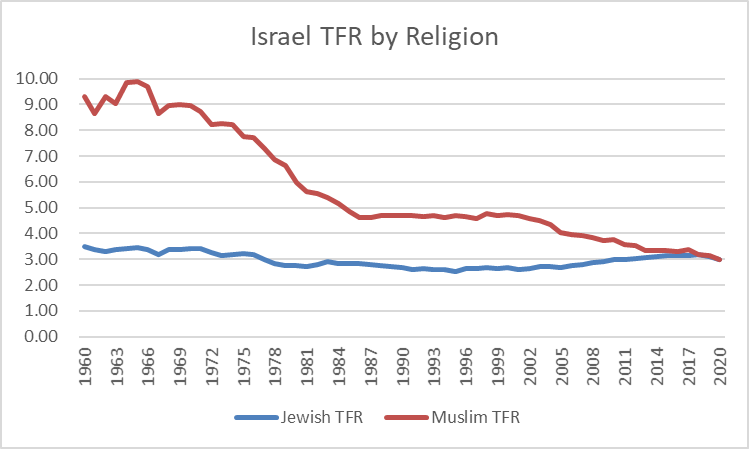
Demographic predictions have been wrong before. It was not that long ago that some in Israel worried about the high fertility of Muslims within Israel, forecasting that eventually Israel would no longer be a majority Jewish state.
These forecasts turned out to be mistaken, as the Muslim fertility rate eventually continued to fall, while the Jewish one rose slightly from its lowest point.
Figure: In Israel, Muslim TFR has fallen dramatically since 1960, while Jewish TFR has stayed stable and is now is higher than the Muslim TFR Own visualization. Data from Israeli Central Bureau of Statistics. [67]
Other Groups
These are the most significant groups mentioned in the book for which the evidence of both high fertility and high retention are able to be verified.
I am interested in finding out about other groups that are substantially bucking fertility trends. These groups do not need to be religious – in fact, I would be especially interested in seeing what a non-religious high fertility group would look like.
I’m interested primarily in groups whose existence and growth I can verify, which cashes out to some combination of the following characteristics located in countries which can be verified by checking fine grained official statistics or statistics collected by reputable groups, such as Pew Research Center:
Geographic concentration
Distinct language
Distinct religion
For small groups (100 thousand-1 million), I’m interested in a fertility rate that is at least double that of their broader society and also above 4. For groups larger than a million, a fertility rate that’s 50% higher than their broader society and also above 3 would be interesting.
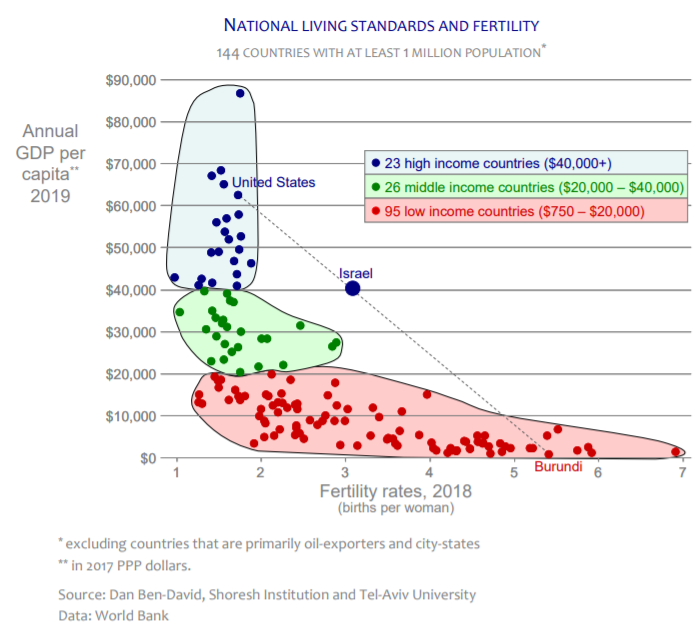
I’m also interested in hearing about countries that have unusual fertility patterns. I don’t think any country is as much of an outlier in this regard as Israel but I’d be interested in hearing arguments for it.
Figure: Israel is an outlier in terms of level of fertility considering its GDP per capita. Source: Shoresh Institution [62] Note: Graph excludes countries which are very small, city-states or primarily oil-exporters, and doesn't take log of GDP per capita which makes Israel more visibly an outlier than the last time this relationship came up.
Of the Christian groups in Europe that the book argued had high fertility rates and purported rapid expansion, Laestadian Lutheranism is the one that comes closest to meeting these criteria. I discuss this group further in the appendix.
Conclusion
With a small handful of exceptions that make up a tiny fraction of the global population, the trend seems clear: as countries have become wealthier and more educated and otherwise more developed, their fertility rates have fallen, and they will likely continue falling past the replacement rate. The gap between religious and secular fertility rates may continue to persist, but it seems likely that the rate of deconversion and other secularization will outpace or at least keep par with the higher fertility rate of the more religious, as has been the case in the United States and Europe for decades, and perhaps centuries.
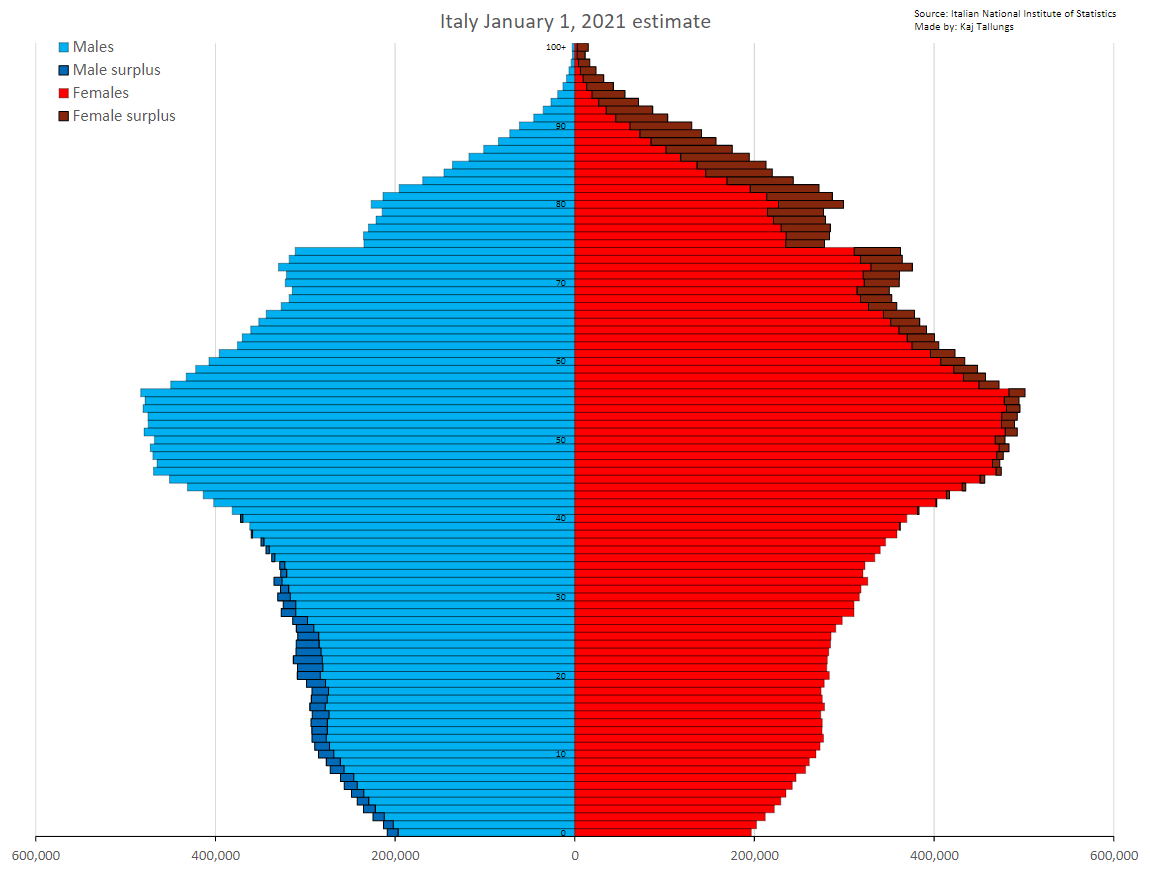
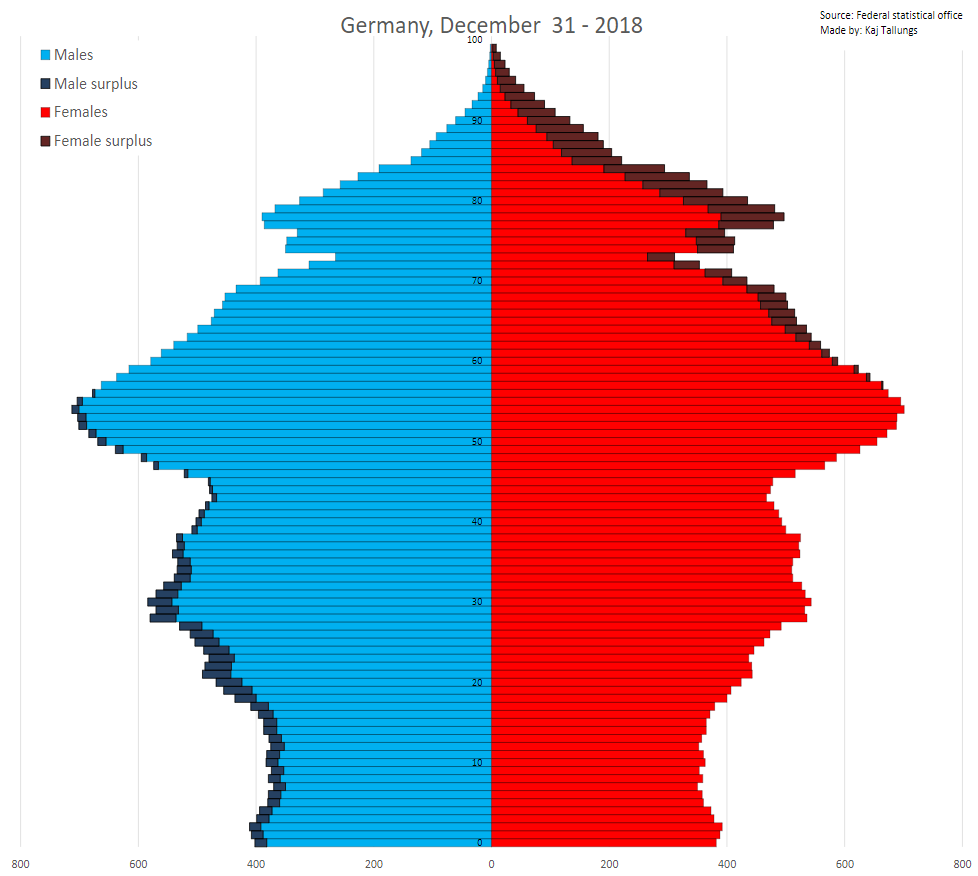
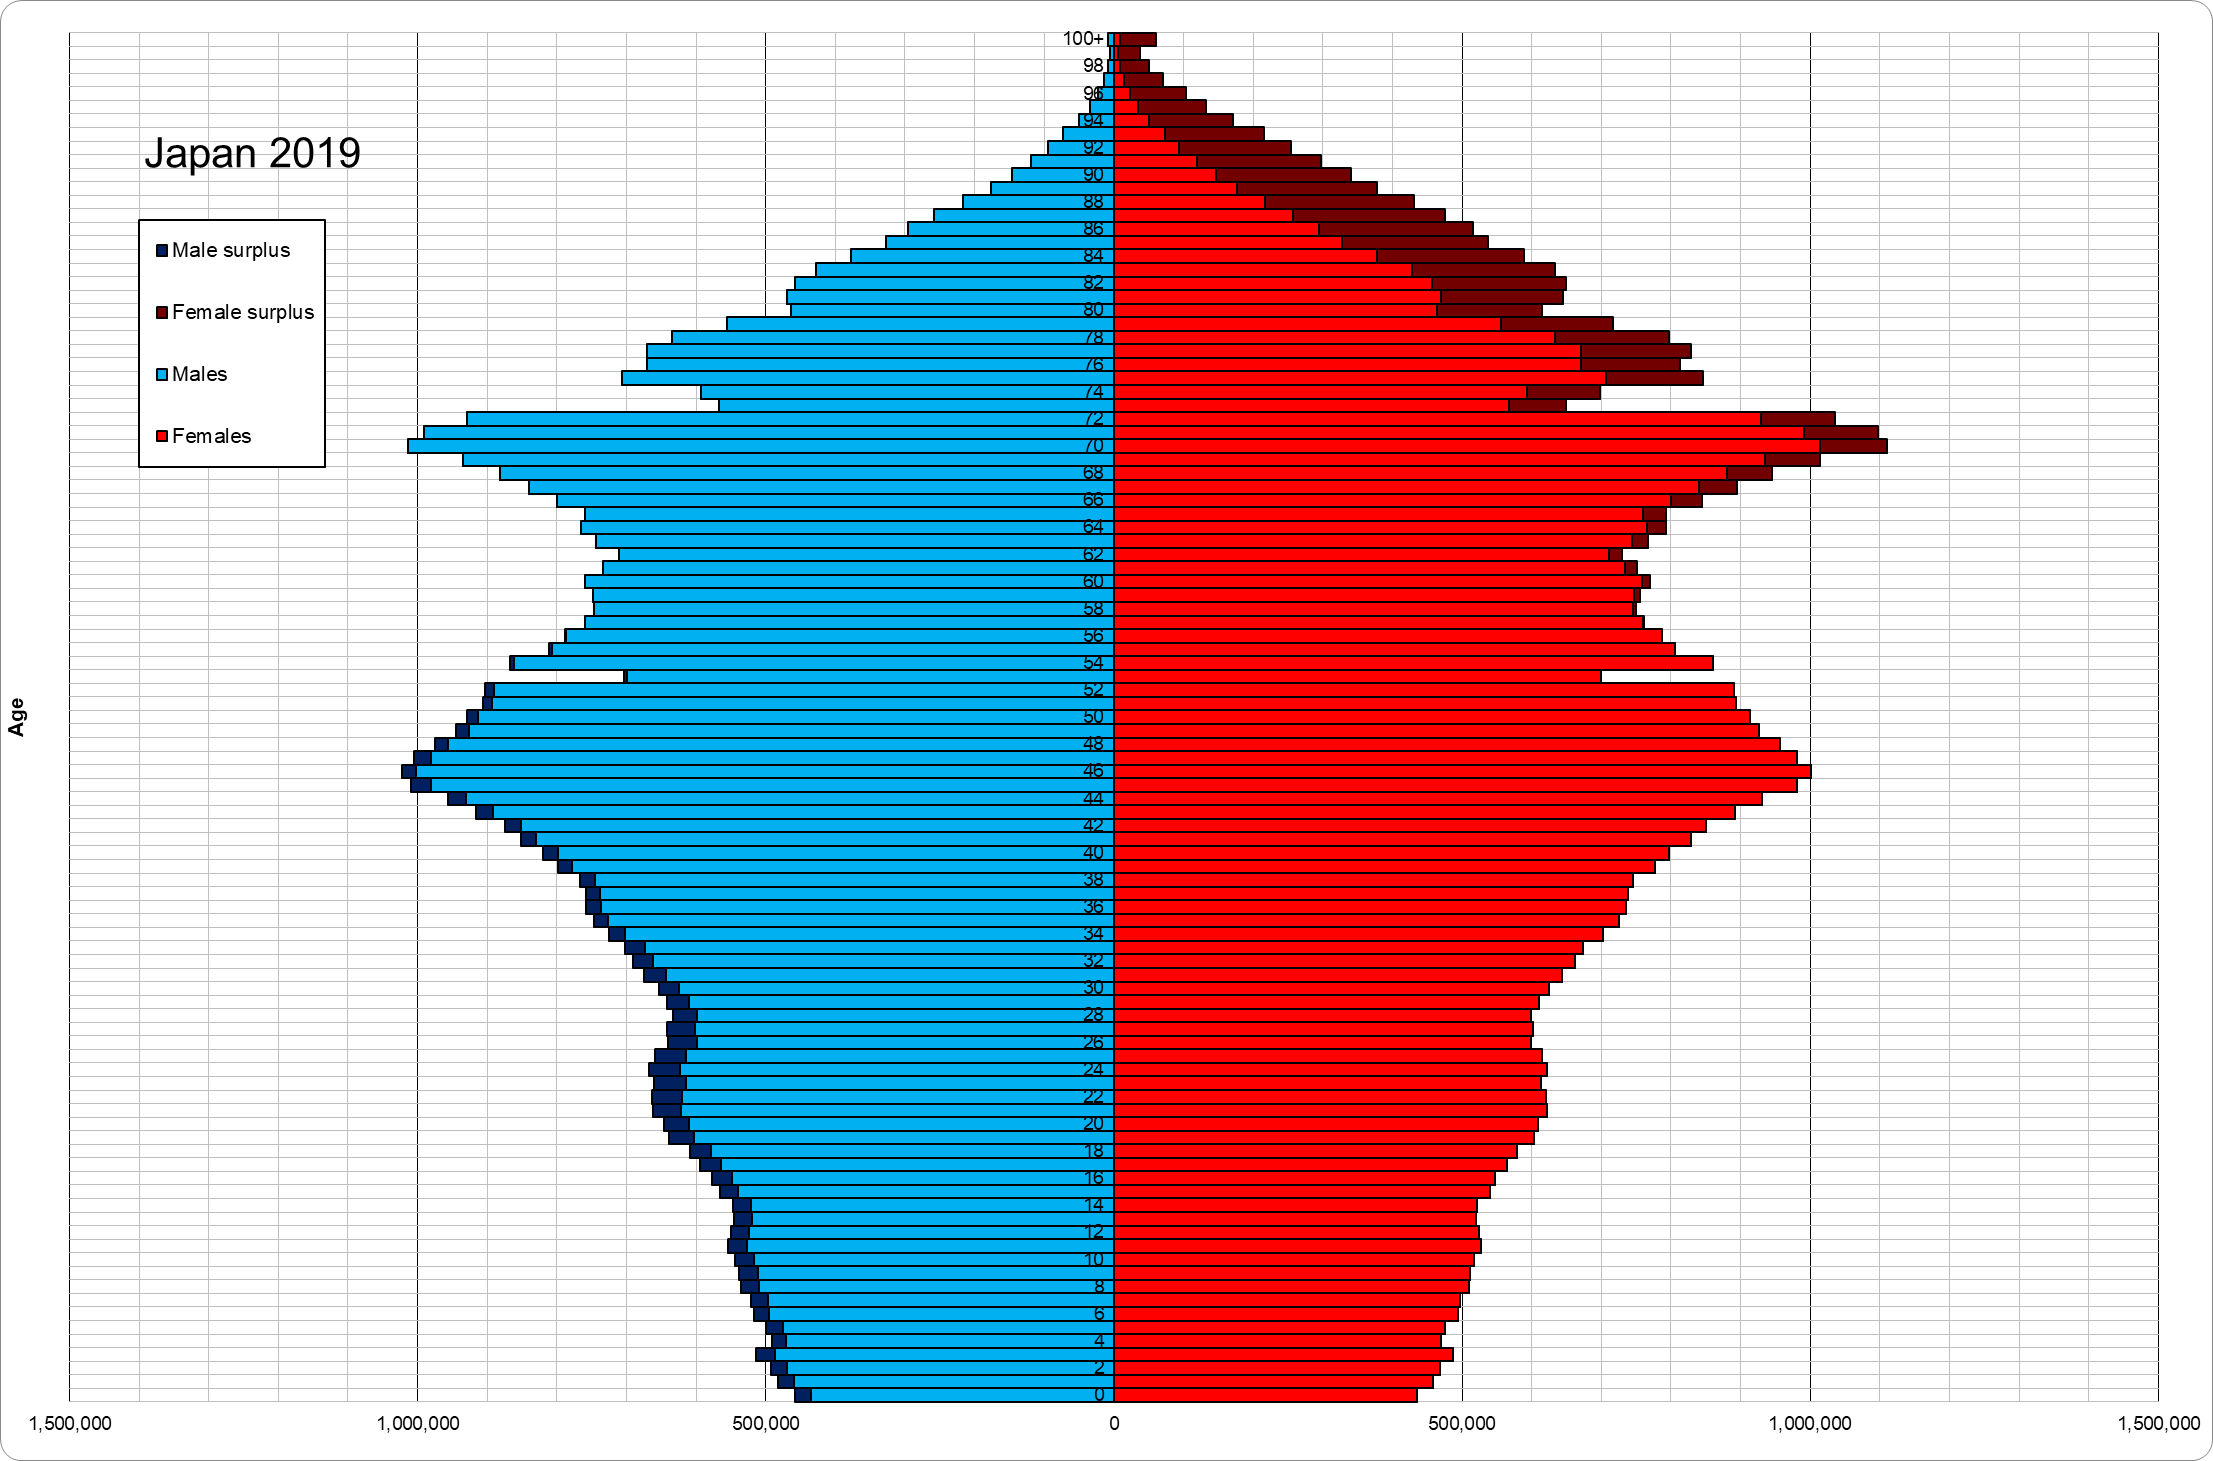
Rather, we need to worry about what will happen in a world where nearly every group falls below replacement, and we face a world of shrinking birth cohorts and inverted population pyramids. Japan, Italy and Germany are some of the earliest countries to have almost completely inverted pyramids below the age of 65. The median age in these countries is greater than 45 and rising rapidly.
Figure: Population pyramid of Japan, with most cohorts younger than 45 smaller than the next younger cohort. Source: Wikipedia[68]Figure: Population pyramid of Italy, with most cohorts younger than 55 smaller than the next younger cohort. Source: Wikipedia [69]Figure: Population pyramid of Germany. Though the largest cohorts are those between 45 and 60, Germany has avoided a complete inversion in part thanks to substantial immigration. Source: Wikipedia [70]
Japan, which has both the highest median age and the highest share of the population greater than 65, is going to be one of the earliest to deal with this challenge. Japan has already had to make substantial changes to retirement and immigration, and the old age dependency ratio is only going to rise in the coming decades. Companies have increased their mandatory retirement ages from 60 to 65 and then later to 70. Benefits have been cut for those aged 60 to 65 who are collecting a pension. Though Japan has historically had very low levels of immigration, skilled labor shortages have prompted the government to change policies in recent years, letting foreign workers renew visas indefinitely and bring families with them.[71][72]
The first countries to undergo this transition are all wealthy countries, which makes these types of changes easier to weather. They can still attract workers from poorer countries who are drawn by their higher wages. What happens once those countries also face inverted population pyramids, and on top of that lose their prime-aged workers to wealthier countries? Who will take care of those elderly?
If trends in secularization continue, the near universal secular fertility rate below replacement will not lead to a decrease in the share of the secular population for decades or perhaps centuries, as the rate of secularization will outpace the fertility advantage of the more religious. Instead, these trends raise the question: will no one inherit the earth?
Appendix
Measuring Fertility
When thinking about fertility, we might naturally start with counting the number of babies. But that number on its own often isn’t meaningful: we often would want to know the relationship between the number of babies and the number of people that might have potentially given birth to the baby. A crude estimate of fertility is the general fertility rate: the number of births per 1000 women of childbearing age, usually about 15-44. However, the likelihood of giving birth isn’t uniform on the interval from 15-44. Depending on the society, different parts of that age range will have varying likelihoods of giving birth.
One can calculate these likelihoods for different age buckets: these are age-specific fertility rates, often reported in births per 1000 women in a given age range. In the US, the ASFR for 30-34 year olds is about 100: about 10% of women in that age group get pregnant every year.
TFR, or total fertility rate, is the measure of fertility that I refer to most often in this piece. This is an estimate of how many kids a woman would have if she consecutively went through all of the age specific fertility rates. That is, TFR = 5*[asfr for 15-19 y/o] + 5*[asfr for 20-24 y/o] + 5*[asfr for 25-29 y/o] + 5*[asfr for 30-34 y/o] + 5*[asfr for 35-39 y/o] + 5*[asfr for 40-44 y/o]. And then divided by 1000 if ASFR was reported as a rate per 1000 women. TFR has a more direct relationship with ASFRs than the general fertility rate does, which also reflects the age distribution of the group whose births we are counting.
There are many possible age specific fertility rates that can result in a given TFR. For example, a TFR of 2 could be achieved if every year 10% of the women between 21 and 40 carried a pregnancy to term, and no one else at other ages did (20*.1 = 2), or if every year 20% of the women between 26 and 35 carried a pregnancy to term and no one else did (10*.2=2), or if every year 10% of the women between 26 and 35 carried a pregnancy to term, and 20% of women between 36 and 40 did (10*.1 + 5*.2 = 2).
In some cases, when we are talking about TFR, what we’d really like to know is the completed cohort fertility rate: how many children did the average woman wind up having. However, this number is only available at a substantial lag, after the women in a given cohort have finished having all of the children that they intend to have.
Oftentimes, TFR during peak childbirth years is a good proxy for completed cohort fertility. But during periods of times when the average age of childbirth is going up, it tends to be an underestimate, and during periods of time when the average age of childbirth is going down, it tends to be an underestimate. TFR also tends to perform poorly as an estimate of completed cohort fertility when there is a large amount of migration, which I cover in the next section.
Mismeasured Fertility due to Migration or Timing Changes
A combination of undercounting the relevant immigrant population and immigrants often having higher fertility immediately after moving to a destination country results can lead to inflated TFR estimates relative to completed cohort fertility. This phenomenon led to TFR exceeding completed cohort fertility of Mexican immigrant fertility in the United States in the 1990s and 2000s and Turkish fertility in Germany, as discussed in the body of this post.
Figure: Completed Fertility Rates were eventually found to be much lower than TFR estimates due to migration affecting timing of births. Source: Parrado (2011) [18]Figure: Age-specific fertility rates are highest immediately after arrival, leading to temporarily elevated TFR that does not reflect expected completed cohort fertility. Source: Wolf (2014) [38]
One statistic that can give a clue as to whether this sort of misestimation is happening is TFR_1. Calculated the same way as TFR in the previous section, except only counting first births. Intuitively, one would expect this number this number to be close to the share of the population that eventually has kids: perhaps each year 4% of people between 20-24 have their first kid in that age range, and likewise 4% of 25-29, 30-34, and 35-39 year olds have their first kid in each of those age ranges, and there are no other ages at which anyone has a first kid. This would result in a TFR_1 of 20*.04 = .8. 80% of a given cohort eventually has at least 1 kid.
But if for some reason something affected the timing of births, without necessarily affecting the quantum of births, we could see a phenomenon where TFR_1 is much greater than 1. Suppose everyone in the previous toy model decided to move having a child over 5 years earlier unless this would result in having a child under 20. This would result in a TFR_1 of 1.4 (15*.08 + 5*.04 - he rate of having a first child doubles between 20-34, but stays constant between 35-39). This would also substantially increase TFR for that year. But obviously people can’t continue having first kids at that rate! Within a couple of years, once everyone is done shifting births 5 years earlier, TFR_1 will return to .8 (.08*5+.04*10=.8). Similarly, if everyone shifted births back 5 years, TFR_1 would temporarily be very low while the transition was happening. Sometimes, timing shifts also result in different total number of births, but sometimes this does not affect that at all.
Similarly, if there is an undercounting of a given population group, but an accurate counting of births among this group, this could result in an overestimate of TFR_1 and TFR. In the most extreme example, suppose that the government only successfully counts members of a group when they show up in the hospital to give birth, and otherwise has no information on group size. Then in the case where we are counting births from 20-39, this would result in an estimated TFR of 20!
Figure: TFR_1 rates for foreign-born Mexican / Hispanic women exceeds unity. Source: Parrado (2011) [18]
Another study, this one more recent and from Switzerland, finds that while the TFR of foreign nationality women has consistently been higher than Swiss nationals, the completed fertility of these groups has the opposite relationship. In the Swiss case, most of the foreign women are from other European countries, and some of the difference is from different rates of naturalization, but the study helps demonstrate the difficulty of assessing fertility while the underlying populations are in flux and provides more observations of the migration-specific tempo effect in action.[73]
The book mentioned several Christian groups in Europe which had higher fertility rates than their surrounding societies, and so were rapidly expanding. Of the groups mentioned, the one with the best documentation that I could find were the Laestadian Lutherans in Finland. While Finland does not directly estimate fertility rates by religion, it is possible to make some inferences about potential high fertility groups by looking at local birth rates and population pyramids.
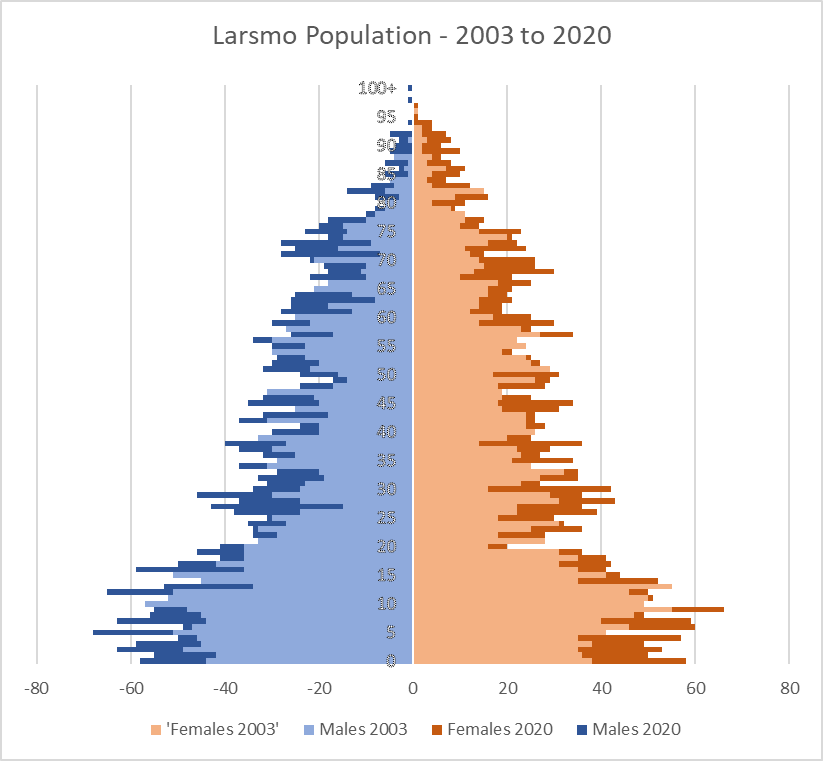
The town of Larsmö was one the book cited as having a high concentration of Laestadians and consequently a high fertility rate. The population pyramid of Larsmö, shown below, is that of a growing population. However, there’s a clear transition at adulthood on the pyramid both in 2002 to 2020, indicating that a substantial portion of the youth of the town leave at adulthood, perhaps to study at a university, and some fraction of them do not return. It is unclear whether this indicates that they leave the faith, as they could be moving into other towns, but none of the neighboring towns exhibit the same population pattern or have population pyramids that are as bottom heavy as Larsmö is. The TFR in the region the town is in, Ostrobothnia, has stayed well below replacement, at 1.66, though this is still higher than the Finnish average of 1.37.[75][76]
In Larsmö, the population growth between 2003 and 2020 implies a population doubling time of about 45 years, and birth rates in 2019 and in 2020 indicate a TFR between 3 and 3.5. This is a sharp decline from the TFR of 5.5 cited for Laestadians as a whole in the 1980s. Additionally, note that Larsmö has a population of only about 5,500 and there are only two other municipalities in Finland that are as youth heavy as Larsmo, with about 30% of their population below 15, and they are both also relatively small: Tyrnävä with a population of almost 7,000, and Liminka with a population of about 10,000. [75][76]
Contrast Larsmö, Tyrnävä and Liminka with Bnei Brak and Modi'in Illit, two cities in Israel which are predominantly Haredi. Brei Brak has a population of almost 200,000 and 47% of residents are 17 or younger. Modi'in Illit has a population of about 75,000 and 64% of residents are 17 or younger. [77]
While the numbers of Laestadian Lutherans are higher than just the population of those towns, their demographic impact thus far seems to be limited, and there is some evidence that their fertility rates are converging with the rest of Finland. This group appears to be growing, but more slowly and from a smaller base than the two groups I classify as more clear-cut exceptions to the trend.
Figure: Larsmo has a growing population with a population pyramid consistent with above replacement fertility, but suggests some attrition in adulthood Own visualization. Data from Statistics Finland [76]
Dutch Orthodox Calvinism
Another group cited in the book are the Dutch Orthodox Calvanists. As with Laestadianism, it is difficult to check the population statistics for this group directly, but we can look at the places within the Netherlands which the book lists as being predominantly Dutch Orthodox Calvanist: Urk in Flevoland and Staphorst in Overijssel.
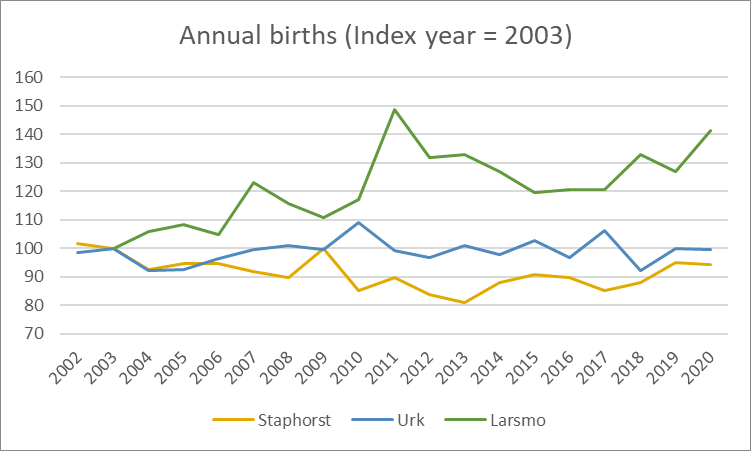
Unfortunately, the Netherlands Central Bureau of Statistics does not make it as easy as Statistics Finland does to obtain population pyramids for towns. However, we can check just raw birth numbers in each of these towns and see that the situation is not indicative of growth, compared Larsmo: births have been flat for the past 30 years (though births fell by about 15% for the Netherlands as a whole, so in this regard they are still outperforming the general population).
Figure: Annual births are gradually increasing in Larsmo, but flat in Staphorst and Urk Own visualization. Data from Statistics Finland and Netherlands Central Bureau of Statistics and Statistics Finland [76][78]
Of course, believers could be expanding via moving into neighboring towns. But there do not seem to be signs of growth on the national level. SGP, the Calvanist political party that received the majority of the vote in Urk and the plurality of the vote in Staphorst in the recent House of Representative elections, has consistently received only about 2% of the vote on the national level.[79]
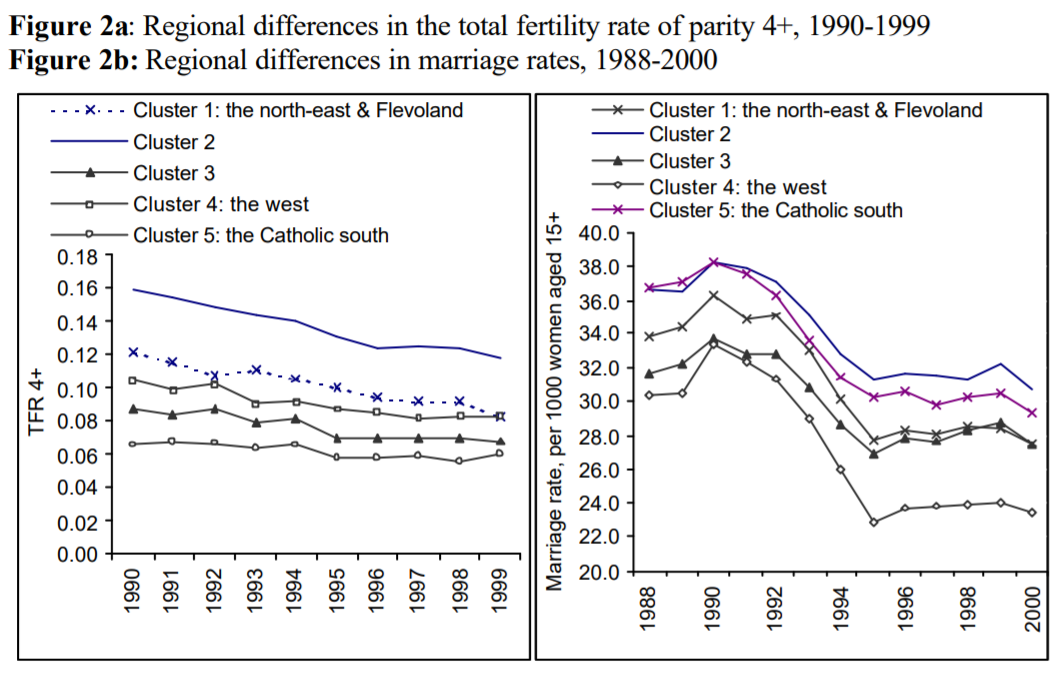
This is consistent with the below figure from an earlier paper on regional and religious differences in the Netherlands. While “Cluster 2”, which has the highest share of Orthodox Calvanists, had (and likely continues to have) a higher TFR, a higher rate of having 4 or more children, and a higher rate of marriage, these rate are converging to the rate in the rest of the country. [80]
Figure: Expected number of children with parity 4 or higher by region. Cluster 2 includes the Calvanist Orthodox “Bible Belt” of the Netherlands. Sobotka and Adiguzel (2002) [80]


On the topic of the Amish, I found this article "Assortative Mating, Class, and Caste". In the article, Henry Harpending and Gregory Cochran argue that the Amish are undergoing selection pressure for increased "Amishness" which is essentially truncation selection. The Amish have a practice known as "Rumspringa" in which Amish young adults get to experience the outside world, and some fraction of Amish youths choose to leave the Amish community and join the outside world every generation. The defection rate among the Amish has been decreasing over time. The defection rate in recent years has been around 10-15%, but was around 18-24% in the past. Because of this, your assertion that decreasing religiosity will outpace high fundamentalist population growth seems questionable.
From the article:
The Amish marry within their faith. Although they accept converts, there are very few, so there is almost no inward gene flow. They descend almost entirely from about 200 18th century founders. On the other hand, there is considerable outward gene flow, since a significant fraction of Amish youth do not choose to adopt the Amish way of life. In recent years, something like 10-15% of young Amish leave the community In the past, the defection rate seems to have been higher, more like 18-24%. Defection is up to the individual – there are no exterior barriers against Amish who want to participate in modern society.
Since the Amish have very high birth rates ( > 6 children per family), their numbers have increased very rapidly, even though there is a substantial defection rate. There were about 5,000 descendants of the original 200 by 1920, and today [2013] there are about 280,000 Amish.
Regarding the implications of future demographics for Effective Altruism/Longtermism, Robin Hanson wrote this article "The Insular Fertile Future". Robin Hanson talks about ways modern values could be preserved in light of these demographic shifts. One possible strategy to preserve modern values could be to encourage the creation of new subcultures that inherit most of their cultural elements from the dominant culture, but also have high fertility and the adaptive characteristics that insular, religious subcultures with high fertility have.
Also worth reading is Anatoly Karlin's article series on the Age of Malthusian Industrialism, particularly the article "Breeders' Revenge". Karlin argues that a reverse of the demographic transition and a "breeder transition" where there is a resurgence of high fertility due to selection for "breeders" is a mathematical inevitability. Karlin also talks about how France has a fertility rate that is roughly 1.5x that of Germany, which Karlin argues may be the result of France having an earlier demographic transition than other countries, and therefore has had more time for selection for "breeders" to take place.
I think your comment does a really good job of illustrating the difficulty in determining which groups and circumstances are selecting on what traits, as the two examples of unusually strong selection on fertility that you bring up are the Amish and the French, which have been on opposite ends of fertility behavior. It's not impossible that both of these groups are selecting more strongly on fertility than everyone else, but it is somewhat counterintuitive.
I agree that the Amish are selecting on something, but that something isn't necessarily a preference to have more children. The paper you linked also lists "affinity for work, perseverance, low status competition, respect for authority, conscientiousness, and community orientation" as other characteristics that may be being selected for among the Amish. If the Amish are being selected for ~conformity and community orientation rather than desire to have more kids irrespective of circumstances, then if the circumstances change at the community level (for example, if it becomes more difficult to purchase farmland, as is already happening to the community in Lancaster County, or if the Amish stop being exempt from the requirement that children need to stay in school until they are 16, which some people are pushing for) then the Amish fertility rate could decline further than it already has.
The French case seems somewhat more compelling: because of contraception and norms around family sizes, the people who had larger families in France would be people who intrinsically valued larger families, and so selection would in the direction of higher fertility preferences more directly, rather than high fertility being a result of conforming to local norms. That being said, two centuries of selection in the direction of people who want kids more than average hasn't been enough to bring French fertility above replacement, merely to above average for Europe.
Do you know which year the map from Breeder's Revenge that you linked is for? I don't see a year on it, but it shows more départements at above replacement than the paper that I've found on Recent Demographic Developments in France, which has a map for 2015. Note that the country-wide TFR of 1.96 shown below has declined a bit since then, reaching 1.86 by 2019, and 1.83 in 2020 and that non-immigrant TFR is even further below replacement. While I think it's plausible that TFR in France will start going up again in the near future, it's also quite plausible that it won't.
On the topic of comparing French and German fertility- so far as I can tell, Karlin isn't making any attempt to control for Muslim fertility as a component of the French total? There are probably some ultra-conservative French catholics bumping up the total, but insular French-Muslim communities by themselves could explain the French case in roughly the same way as the Amish.
Also, FWIW, the lower rates of Amish defection over time might not necessarily reflect genetic changes (although that's also possible.) The larger external secular society might just be getting more chaotic and repulsive over time.
I don't think Hanson has any terribly useful suggestions for solving the secular fertility crisis, to be frank. The founding myth of our present-day secular elites is of course the holy crusade against the Nazis, which means that any serious national discussion about raising birthrates (let alone ensuring eugenic fertility) will get crushed by Lebensborn comparisons and other thought-terminating clichés.
Not every country has a political myth about the fight against the Nazis. So one of them might eventually take up Hanson's suggestions.
I did a reverse image search on it, and I found a map that seems to have the same data for France and Germany that was posted in early 2014.
Oh, good idea. Reverse image searching resulted in me finding the same version claiming that it's 2007 data. So that's maybe partially reflecting differences in how people responded to the financial crisis in particular?
Decided to find some TFR data from Eurostat and recreate this map for some more recent years. The France-Germany gap has been decreasing in visual saliency: 2014 is still pretty visible but but 2019 is less so (though there is still some aggregate TFR difference between France and Germany). Data doesn't go far enough back for me to be able to check the original map but it doesn't seem particularly implausible.