A very important factor here is that you give chickens an expected moral weight more than twice that of humans.
This is not just because of your particular model, but is rather intrinsic to Muelhauser's estimate: 10% of being above 10 (and 100% of being positive) necessarily means a mean above 1. Together with his 80% chance that they're moral patients, this gives at least a 0.8 conversion factor.
...which seems extremely high. I don't know anybody who'd agree with this.
Fwiw, looks like rerunning the analysis with the relative bounds on chicken moral worth being a ten-billionth to a thousandth of a human, rather than a twenty thousandth to 10 humans, still outputs a mean cost-effectiveness ratio of CCCW to MIF of ~1.3.
So though it is a pretty significant factor, choosing different values there seems unlikely by themselves to directionally change the output.
I also don't think that the expected moral weight of more than twice that of a human is that intrinsic to Muehlhauser numbers. Seems like it is more like something of an artifact that comes from putting a log-normal distribution to that confidence interval.
But I also I think it is all somewhat beside the point that could really be at play:
It's unclear that one can compare the “near-termist, human-centric” worldview, to the “near-termist, animal-centric” worldview by just working to put them on the same metric, and then crunching the EV. And further, I don’t think subscribers to the “near-termist, human-centric” worldview will be swayed much (potentially at all) by analysis like that.
So idk and I am always confused by this but when I thought about this more a few years ago, I personally think the decision framework might be more along the lines of like: how much credence do I give to "near-term human-centric", and according to it how good is MIF. And how much credence do I give "near term animal-centric", and according to it centric how good is CCCW. And that is more how one gets at how one ought to allocate funds across them.
I also don't think that the expected moral weight of more than twice that of a human is that intrinsic to Muehlhauser numbers. Seems like it is more like something of an artifact that comes from putting a log-normal distribution to that confidence interval.
Note I used a loguniform distribution, not a lognormal (which would result in a mean of 1.50 k). In addition, normal, uniform, and logistic distributions would lead to 4.00.
It's unclear that one can compare the “near-termist, human-centric” worldview, to the “near-termist, animal-centric” worldview by just working to put them on the same metric, and then crunching the EV. And further, I don’t think subscribers to the “near-termist, human-centric” worldview will be swayed much (potentially at all) by analysis like that.
Assuming total hedonic utilitarianism (classical utilitarisnism) carries most of the weight amongst various possible moral theories, I would say one can compare the experiences of humans with those of non-human animals.
I discussed concerns about calculating expected moral weights at length here.
So idk and I am always confused by this but when I thought about this more a few years ago, I personally think the decision framework might be more along the lines of like: how much credence do I give to "near-term human-centric", and according to it how good is MIF. And how much credence do I give "near term animal-centric", and according to it centric how good is CCCW. And that is more how one gets at how one ought to allocate funds across them.
Implicitly assumed to represent the weighted mean of the moral weight distributions of the various theories of consciousness. These are, in turn, supposed to produce (summable) moral weight distributions in QALY/cQALY.
I think the ability to give credences to different views implies that they are somehow comparable with respect to an idealised truth, since the credence is sort of the probability of a view being true. I think about the moral weight as representing the knowledge about both "near-term human-centric" and "near term animal-centric" views. I think one cannot reasonably be confident that the latter has a very low credence, and therefore the 90th percentile of the moral weight distribution will tend to be close to 1, which implies a mean moral weight close to 1.
Yeah, I agree, dividing it by e.g. 1000 would only make a 10,000 ratio into 10.
I also don't think that the expected moral weight of more than twice that of a human is that intrinsic to Muelhauser numbers. Seems like it is more like something of an artifact that comes from putting a log-normal distribution to that confidence interval.
The particular value is a result of the log-uniform distribution, but any distribution conforming to Muelhauser's confidence interval will give a mean in this neighborhood (i.e. at most ~3 times smaller).
This is a good point, thanks. Note that I have fitted 6 types of distributions to Muehlhauser's guesses for various species here, and concluded that:
The mean moral weight is close to 1 for all the considered species, ranging from 0.5 to 5 excluding the lognormal and pareto distributions (for which it is even higher, but seemingly inaccurate).
I think a value close to 1 is not unreasonable. As described here, CE's Weighted Animal Welfare Index total welfare score and probability of feeling pain imply the conditions of laying hens in CC in -QALY/cyear is about 10 % of what my assumptions imply. 1 order of magnitude is not much considering the large uncertainty involved: the 95th percentile of the moral weight distribution I used is about 1 M times as large as the 5th percentile.
Moreover, I do not think we know enough about consciousness to confidently say that the moral cannot be larger than 1. As a result, for the reasons you mentioned, the mean moral weight will tend to be close to 1.
One modelling assumption that may be favouring corporate campaigns for chicken welfare over GiveWell's Maximum Impact Fund is that you're using an oldaverage cost-effectiveness estimate for CCCWs, but an up-to-date marginal cost-effectiveness estimate for the MIF based on their funding bar. The old average cost-effectiveness estimate could be a few times off or more. I'm not well-informed here; maybe Open Phil or my colleagues at Rethink Priorities would know better.
I think this would hardly change the ratio between the mean cost-effectiveness of CCCW and MIF by more than 1 OOM:
As I mentioned here (which was not visible, so I have moved it to the Discussion):
According to this comment, Saulius recently estimated that "in 2019-2020 chicken welfare reforms affected 65 years of chicken life per dollar spent".
I used a mean value of 45.6 cyear/$, which is 30 % lower. Therefore I would have obtained a higher cost-effectiveness if I had used Sauliu's more recent estimate.
As described here, OP's grants do not present a significant downwards trend. So, assuming OP's animal welfare bar has not moved much, the marginal cost-effectiveness of CCCW has arguably not moved much either.
Ok, thanks for explaining and making this more prominent.
Also, I just remembered Lewis Bollard wrote this comment in February 2021:
Our current very rough estimate is that our average $ spent on corporate campaigns and all supporting work (which is ~40% of our total animal grant-making) achieves the equivalent of ~7 animals spared a year of complete suffering. We use this a rough benchmark for BOTECs on new grants, and my best guess is this reflects roughly the range we should hope for the last pro-animal dollar.
I think 7 years of complete suffering spared is intended to be better than 7 years of life with the average suffering reduction of CCCW, though, so it's possible the estimates you use and Lewis's here are consistent, but I'm not sure, and it could still be a few times less cost-effective than your estimate.
You're reporting statistics (mean, quantiles) of the ratio of cost-effectiveness estimates, and not the ratio of the mean cost-effectiveness estimates, right? I think the ratio of the means is more informative, since we normally compare expected values per $ spent.
Assuming QALYs and cQALYs reflect similar circumstances and are normalized similarly (I think that's the intention), the most informative figures for me would just be the ratio of means assuming moral weight is 1, times a placeholder discount factor for moral weight. So something like "CCCW is 5,000m times as cost-effective as MIF, where m is the relative moral weight of chickens to humans times the relative probability of chicken consciousness to human consciousness." (Replace 5,000 with whatever number it turns out to be, but I'm guessing it's around that, based on your mean moral weight of 2.41.)
If you're including meat eater problem effects (and only considering chickens/poultry, and not other animals, farmed or wild), then I'd guess the ratio of means would look like f(x)=ax/(b+cx), where x is the relative moral weight times consciousness probability variable, and you could report the function and its constants, and plot its graph.
You're reporting statistics (mean, quantiles) of the ratio of cost-effectiveness estimates, and not the ratio of the mean cost-effectiveness estimates, right?
Yes, right.
I think the ratio of the means is more informative, since we normally compare expected values per $ spent.
That makes sense. I have updated the post such that I now analyse the ratio between the statistics of the cost-effectiveness distributions instead of the statistics of the ratio between the cost-effectiveness distributions.
Both the ratio between the mean cost-effectiveness of CCCW and MIF, and the mean ratio between the cost-effectiveness of CCCW and MIF are 12 k, so there were no changes in the conclusions.
Assuming QALYs and cQALYs reflect similar circumstances and are normalized similarly (Inthink that'sthe intention), the most informative figures for me would just be the ratio of means assuming moral weight is 1, times a placeholder discount factor for moral weight.
I think I had better use a concrete best guess for the expected moral weight, such that the expected conclusions are clearer. That being said, I agree that is quite informative, so I have added the following to the Discussion:
This ratio [between the mean cost-effectiveness of CCCW and MIF] is equal to the product between 4.78 k and the mean moral weight of chickens relative to humans if these are moral patients, which would have to be 2*10^-4 (= 1/(4.78 k)) for the ratio to be 1.
For this analysis, I have not accounted for the "meat eater problem effects" I analysed here.
Minor suggestion: in your title and summary, please just write out "10 k" as 10,000. No need to abbreviate when people may be unsure that it's actually 10,000 (given that it's such a large difference).
FWIW I re-ran the model with two changes - (a) Probability moral patients = 0.95 and (b) value of chicken compared to human ranging between 1/100,000 and 1/100. Here are the results:
Ratio between the cost-effectiveness of CCCW and MIF
Your results show the mean ratio between the cost-effectiveness of CCCW and MIF is roughly directly proportional to the 90th percentile of the moral weigh of chickens if these are moral patients. I selected a value which is 1 k (= 10/0.01) times as large as yours, so I got a ratio which is 1 k times as large.
I would be curious to understand why you assign a probability of only 10 % to chickens, given moral patienthood, having a moral weight larger than 0.01.
>I would be curious to understand why you assign a probability of only 10 % to chickens, given moral patienthood, having a moral weight larger than 0.01.
Sorry, not sure I understand, my intention was to apply probability of moral patienthood at 95%, not 10%.
In the Colab, I modelled the moral weight given moral patienthood based on the 10th and 90th percentiles, so I thought you had changed these.
In any case, I would also be curious to understand why you assign a probability of only 5 % to chickens, given moral patienthood, having a moral weight larger than 0.01. This is 2 k times as large as my 95th percentile.
You can read the post with the footnotes in the right format here. The bullets disappeared from the footnotes due to updates to the Forum, and the post cannot currently be edited.
Update on 22 March 2023: I have now fixed the footnotes in the post.
Corporate campaigns for chicken welfare are 10,000 times as effective as GiveWell's Maximum Impact Fund? — EA Forum
Corporate campaigns for chicken welfare are 10,000 times as effective as GiveWell's Maximum Impact Fund?
This is a crosspost from the new Animal Welfare Alignment Newsletter by Anima International. You can subscribe on Substack if you are interested in following these efforts. Audio reading also available on Substack.
The goals of this post are to:
1. Raise a question I see as crucially important to the goal of aligning AI to animal welfare...
“How long have you been v*g*n?”
This is one of the most common icebreakers at animal protection events. It’s a baseline assumption, and it mostly holds true: if you’re out advocating for animals not to be tortured or abused, realistically these days you are v**n, or close. And it makes for good conversation. It seems fairly safe to assume when you meet strangers.
But this assumption is hurting the movement in a way which we don’t always notice: someone new comes into the sp...
Summary
Back in November 2023 I posted here to launch Spiro and raise our first $198k. Two and a half years later this is an update and a fundraiser for the next step.
The short version: we've now reached over-5,900 people with TB preventive medicine, including over 3,000 children under five years old. Our early results have held up well an...
This analysis estimates the cost-effectiveness of corporate campaigns for chicken welfare (CCCW), and compares it with that of GiveWell's Maximum Impact Fund (MIF) (see Methodology).
The results were obtained with this Colab, and the key ones are summarised in the table below (for more, see Results). Comments about how to interpret them are welcome.
The ratio between the mean cost-effectiveness of CCCW and MIF is estimated to be 10 k (i.e. 10^4).
The specific value depends on very uncertain parameters, such as the ones defining the badness of the conditions of factory-farmed chickens relative to the goodness of fully healthy chicken life, and the moral weight of chickens relative to humans.
However, it appears to be robustly larger than 1 (see Discussion).
Result
Mean
Median
Improvement in the conditions of broilers (cQALY/cyear)
1.12
0.505
Improvement in the conditions of laying hens (cQALY/cyear)
1.41
0.807
Improvement in the conditions of chickens (cQALY/cyear)
1.37
0.783
Improvement in the conditions of broilers (%)
45.4
49.8
Improvement in the conditions of laying hens (%)
64.6
65.2
Improvement in the conditions of chickens (%)
62.8
63.4
Moral weight of chickens relative to humans (QALY/cQALY)
2.41
0.0179
Cost-effectiveness of CCCW for broilers (QALY/$)
62.9
0.0267
Cost-effectiveness of CCCW for laying hens (QALY/$)
203
0.653
Cost-effectiveness of CCCW (QALY/$)
151
0.491
Ratios between the cost-effectiveness statistics of CCCW and MIF
11.6 k
38.7
Acknowledgements
Thanks to Cynthia Schuck-Paim, Kieran Greig, Lewis Bollard, and Saulius Simcikas.
Introduction
About 2 year ago Stephen Clare and Aidan Goth (S&A) published an analysis comparing the cost-effectiveness of The Humane League[1] (THL) and Against Malaria Foundation (AMF). The analysis presented here has the same motivation of better allocating resources between different causes (namely, animal welfare and global health and development). In addition, it relies on data from the Welfare Footprint Project (WFP; overviewed here) to model more accurately the relative improvement in the conditions of broilers and laying hens[2].
Methodology
The ratios between the cost-effectiveness statistics of CCCW and MIF were calculated via determining the respective cost-effectiveness distributions via a Monte Carlo simulation in this Colab. All distributions were assumed to be independent, and their parameters were estimated from quantiles as explained here.
The methodology to determine the cost-effectiveness of CCCW and MIF, and assess room for more funding are presented below.
Cost-effectiveness of corporate campaigns for chicken welfare
The cost-effectiveness of CCCW was based on its cage-free campaigns, and determined from the product between:
The cost of improving the conditions of chickens[3] (cyear/$).
The improvement in the conditions of chickens[4] (cQALY/cyear).
The moral weight of chickens relative to humans[5] (QALY/cQALY).
Cost of improving the conditions of chickens
The cost of improving the conditions of chickens was supposed to follow a lognormal distribution with 5th and 95th percentiles in cyear/$ equal to:
For broilers, 0.2 and 90.
For laying hens, 12 and 160.
For both combined, 9.6 and 120.
These are the lower and upper bound of the 90 % subjective confidence interval estimated for the cost-effectiveness of "broiler and cage-free campaigns" in this analysis from Saulius Simcikas[6]. Potential concerns with those estimates are discussed here.
Improvement in the conditions of chickens
The improvement in the conditions of chickens were calculated assuming weights of:
12 % for changing broilers from a conventional scenario (CS) to a reformed scenario[7] (RS).
88 % for changing laying hens from conventional cages (CC) to cage-free aviaries[8] (CFA).
The fractions above were computed with the Guesstimate model of Saulius' analysis, and are the ratios between the chicken years affected by campaigns for:
Numerator: either broilers or laying hens.
Denominator: broilers and laying hens.
The conditions of chickens were determined from the ratio between:
The sum of the products between the time experiencing and utility of each type of pain[9]:
The time experiencing each type of pain was calculated based on data from the WFP.
The time experiencing each type of pain was defined as a lognormal distribution with 5th and 95th percentiles in h equal to the lower and upper bound of the 90 % confidence interval presented in this page[12] (see this):
For excruciating pain:
For CS, 8.830/3600 and 51.57/3600.
For RS, 2.100/3600 and 9.06/3600.
For disabling pain:
For CS, 33.01 and 67.53.
For RS, 6.20 and 28.32.
For hurtful pain:
For CS, 195.08 and 472.12.
For RS, 125.46 and 385.94.
For annoying pain:
For CS, 212.82 and 436.52.
For RS, 188.66 and 489.96.
Laying hens' time experiencing each type of pain
The time experiencing each type of pain was defined as follows:
Hurtful pain for a lognormal distribution with 5th and 95th percentiles equal to 20 % and 50 % of the time spent awake during this phase.
Annoying pain for the rest of the duration of the phase.
For CFA, neutral utility.
For the laying phase, a lognormal distribution with 2.5th and 97.5th percentiles in h equal to the lower and upper bound of the 95 % confidence interval presented in this page of the WFP[12]:
For excrutiating pain:
For CC, 0.03 and 0.07.
For CFA, 0.02 and 0.06.
For disabling pain:
For CC, 354.1 and 508.8.
For CFA, 100.2 and 211.9.
For hurtful pain:
For CC, 3,265 and 4,844.
For CFA, 991 and 2,492.
For annoying pain:
For CC, 5,615 and 7,827.
For CFA, 1,197 and 2,956.
Negative utility of each type of pain
The negative utility of each type of pain in pQALY/pyear was set to a lognormal distribution with 5th and 95th percentiles equal to[16]:
For excruciating pain: 100 and 10 k.
For disabling pain: 1 and 100.
For hurtful pain: 0.1 and 10.
For annoying pain: 0.01 and 1.
Moral weight of chickens relative to humans
The moral weight of chickens relative to humans was determined from the product between:
A loguniform distribution whose 10th and 90th percentiles in QALY/cQALY were set to 5*10^-5 and 10. These are the lower and upper bounds of the "80 % prediction interval" guessed by Luke Muehlhauser here for the moral weight of chickens relative to humans conditional on the former being moral patients[17] (see "Moral weights of various species").
The distribution for the moral weight of poultry might depend on the theory of consciousness. The above product is implicitly assumed to represent the weighted mean of the moral weight distributions of the various theories of consciousness. These are, in turn, supposed to produce (summable) moral weight distributions in QALY/cQALY.
A comparison between the implications of the above and those of the Weighted Animal Welfare Index of Charity Entrepeneurship is avaible here. Potential concerns about calculating expected moral weights are discussed here.
Cost-effectiveness of GiveWell's Maximum Impact Fund
The cost-effectiveness of MIF was determined from the product between:
The funding bar of MIF as a multiple of the cost-effectiveness of GiveDirectly[18], which was set to 10 in agreement with GiveWell's best guess for its near term cost-effectiveness bar[19].
The cost-effectiveness of GiveDirectly, which was estimated from the ratio between:
The cost-benefit ratio of GiveDirectly, which was set to a lognormal distribution with 2.5th and 97.5th percentiles equal to 130.56 $ and 1,185.44 $ per doubling of consumption. These quantiles were estimated here by Sam Nolan.
Defining the 1st and 3rd factors as constants underesimates the uncertainty of the cost-effectiveness of MIF. However, the major driver for the uncertainty of the ratio between the cost-effectiveness of CCCW and MIF is the cost-effectiveness of CCCW.
Room for more funding of corporate campaigns for chicken welfare
OP's grants in the focus areas broiler chicken welfare and cage-free reforms were analysed to better understand whether CCCW have room for more funding. The 80 grants regarding these areas are in tab “Grants” of this Sheet[21]. The grant amounts were adjusted for inflation based on data from in2013dollars (see tab “Inflation”), and are expressed in 2020-$.
A linear regression of the annual amount granted on year was determined with this Colab.
Results
The results for the cost-effectiveness are presented below for a Monte Carlo simulation with 10 M samples. I encourage the readers to make a copy of the Colab model, and select their preferred parameters (e.g. those which define the moral weight). The model is fully commented (the inputs section is at the top), and could be run in 30 s for 10 M samples.
Cost-effectiveness of corporate campaigns for chicken welfare
Cost of improving the conditions of chickens (cyear/$)
Campaigns
Mean
Standard deviation
5th percentile
Median
95th percentile
Broilers
23.8
126
0.200
4.24
90.1
Hens
59.8
55.3
12.0
43.8
160
Both
45.6
40.8
9.60
33.9
120
Conditions of broilers (-cQALY/cyear)
Type
Mean
Standard deviation
5th percentile
Median
95th percentile
CS
2.21
3.89
0.252
1.20
7.16
RS
1.09
1.97
0.124
0.591
3.53
Conditions of laying hens (-cQALY/cyear)
Type
Mean
Standard deviation
5th percentile
Median
95th percentile
CC
2.19
3.55
0.280
1.25
6.87
CFA
0.779
1.31
0.0956
0.435
2.48
Improvement in the conditions of chickens (cQALY/cyear)
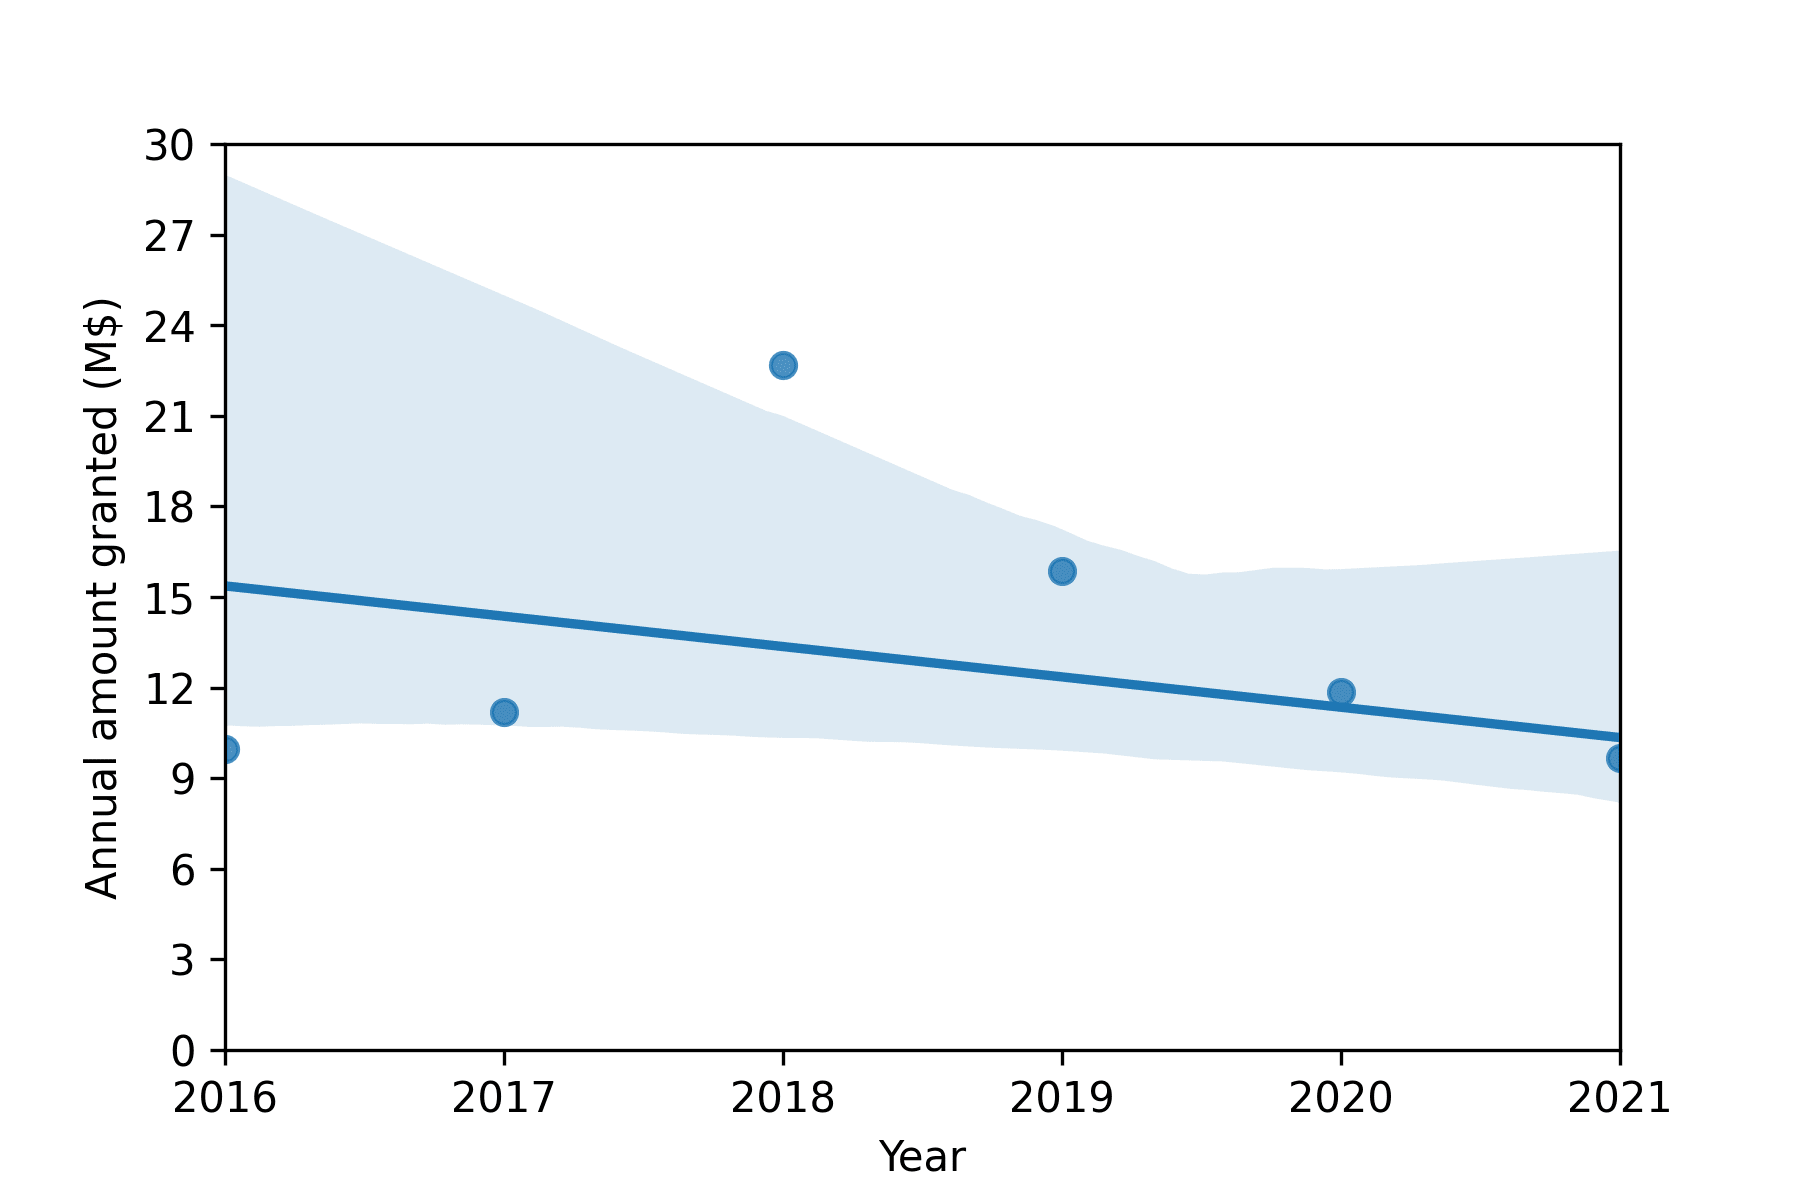
Linear regression of the annual amount granted by OP to CCCW on year (2016-2021). The shaded region represents the 90 % confidence interval.
Discussion
Improvement in the conditions of chickens
To find good heuristics for the mean relative improvement in the conditions of broilers and laying hens, these can be compared to the relative reduction in the median time experiencing each type of pain. According to the WFP:
For broilers (whose conditions improved by 45.4 %):
For excruciating pain, 81.5 % (from 30.20 s to 5.58 s).
For disabling pain, 65.7 % (from 50.27 h to 17.26 h).
For hurtful pain, 23.4 % (from 333.60 h to 255.70 h).
For annoying pain, -4.51 % (from 324.67 h to 339.31 h).
For laying hens (whose conditions improved by 64.6 %):
For excruciating pain, 20 % (from 0.05 h to 0.04 h).
For disabling pain, 63.8 % (from 431.41 h to 156.04 h).
For hurtful pain, 57.0 % (from 4,054.47 h to 1,741.92 h).
For annoying pain, 69.1 % (from 6,721.17 h to 2,076.79 h).
Consequently, for the negative utility of each type of pain defined at the end of this section:
The relative reduction in the median time broilers experience disabling pain (65.7 %) is a decent heuristic for the mean relative improvement in broilers' conditions (45.4 %).
The relative reduction in the median time broilers experience disabling, hurtful, or annoying pain (63.8 %, 57.0 %, or 69.1 %) are good heuristics for the mean relative improvement in hens' conditions (64.6 %).
Moral weight of chickens relative to humans
The mean moral weight of chickens relative to humans of 2 QALY/cQALY may appear too high. Nevertheless:
Based on this analysis, using other distributions for the moral weight of chickens relative to humans conditional of the former being moral patients would lead to a higher mean.
The 90th percentile of the moral weight of chickens relative to humans of 8 QALY/cQALY (= 0.8*10) implies the mean is larger than 0.8 QALY/cQALY[23] (= (1 - 0.9)*8).
In other words, for the mean moral weight of chickens relative to humans to be much smaller than 1, one has to be very confident that it cannot exceed 1. For example, for a mean of 0.01, one would have to assign a probability smaller than 1 % (= 1/0.01) to the moral weight being larger than 1. However, this is arguably hard to defend given the current incomplete understanding of consciousness.
Cost-effectiveness of CCCW
It is worth noting that:
The mean cost-effectiveness of CCCW is of the order of 10^2 QALY/$, which means 0.01 $ leads to the equivalent of 1 year of fully healthy human life.
The mean cost-effectiveness of improving the conditions of laying hens is similar to the 200 QALY/$ estimated by Michael Dickens here for cage-free campaigns (see results).
The mean cost-effectiveness of CCCW for laying hens is 3 (= 204/64.4) times as large as that of broilers.
Ratio between the mean cost-effectiveness of corporate campaigns for chicken welfare and GiveWell's Maximum Impact Fund
The ratio between the mean cost-effectiveness of CCCW and MIF is 10 k. This is similar to the value of 20 k (= 204.698/0.00970468) of the ratio between the mean direct effects of cage-free campaigns and AMF estimated by Michael Dickens here (see results).
I suspect disagreements about the ratio between the mean cost-effectiveness of CCCW and MIF are primarily driven by different intuitions respecting[24]:
The badness of the conditions of CS, RS, CC and CFA relative to the goodness of fully healthy chicken life.
The shape and top percentiles of the distribution of the moral weight of chickens relative to humans.
Nonetheless, I believe most informed choices for these factors result in a ratio between the mean cost-effectiveness of CCCW and MIF which is much larger than 1[25]. For example, the mean product between the conditions of laying hens in CC and moral weight of chickens relative to humans does not differ much from those of S&A and Charity Entrepeneurship (CE). It is 2 times the one of S&A, and 9 times the one implied by CE's Weighted Animal Welfare Index (WAWI):
As a consequence, the ratio between the mean cost-effectiveness of CCCW and MIF (12 k) is 1 k times as large as the ratio between the largest and smallest of the values above (5.28/0.399 = 13). This ratio is equal to the product between 4.78 k and the mean moral weight of chickens relative to humans if these are moral patients, which would have to be 2*10^-4 (= 1/(4.78 k)) for the ratio to be 1.
That being said, such ratio being 10 k does not mean donating to CCCW is 10 k times as good as to MIF. The cost-effectiveness estimates do not account for all effects[28], and such large differences in true cost-effectiveness are arguably unusual. On the other hand, the ratio being much larger than 1 suggests CCCW are better than MIF, even if cost-effectiveness estimates can be misleading.
Room for more funding of corporate campaigns for chicken welfare
The annual amount granted by OP to CCCW was 9.68 M$ in 2021, and has decreased 1 M$/year between 2015 and 2021. However, this downwards trend is not significant, given the p-value of 40 % for the null hypothesis of null slope.
In addition, according to Kieran Greig, who surveyed groups working on CCCW globally:
These campaigns have some pretty significant room for more funding. Easily in the millions of dollars per year.[29]
Moreover, Saulius recently estimated that "in 2019-2020 chicken welfare reforms affected 65 years of chicken life per dollar spent". Using this estimate would increase the cost-effectiveness of CCCW by 30 % (= 65/45.6 - 1).
For these reasons, the ratio between the mean cost-effectiveness of CCCW and MIF would hardly decrease to 1 due to considerations regarding room for more funding.
An improvement in the conditions of laying hens of 1 cQALY/cyear is as valuable as 1 year of fully healthy chicken life. As suggested here, fully healthy chicken life could be interpreted "as [a chicken] living with all needs met, no or minimal fear of predation and disease-free (e.g. perhaps the best moments on a very good farm animal sanctuary)".
A moral weight of chickens relative to humans of 1 QALY/cQALY means 1 year of fully healthy human life is as valuable as 1 year of fully healthy chicken life.
According to section "Conventional and Reformed Scenarios" of Chapter 1 of Quantifying pain in broiler chickens, the "conventional scenario" is represented by the use of "fast-growing breeds", and the "reformed scenario" by "a slower-growing strain".
According to Cynthia Schuck-Paim, for the hatchery phase:
- "Evidence indicates that female chicks experience important levels of stress during commercial hatchery processing (beak trimming being possibly the most painful, with pain lasting days) and transport to rearing facilities, which have several behavioral and hormonal effects later in life. Null utility in the first week of life is unlikely (we [Welfare Footprint Project] have not measured it, but my personal guess is that welfare is net negative regardless of the housing system)".
- "Some fraction [of the time may be allocated] to disabling pain to account for beak trimming (e.g. chicks have been observed to be unwilling to eat or drink for over 24 hours after the procedure) and the high levels of stress (and some injury) during transport. Something around 5-15% of this first week".
The time spent awake is set to 16 h/d. According to Chapter 3 of Quantifying Pain in Laying Hens, "only hours spent awake (16 hours per day) are considered (e.g., if pain is estimated to last 1-2 days, this translates into 16-32 hours of pain)".
According to Cynthia Schuck-Paim, for the rearing phase:
- For caged hens:
-- "Restriction of movement and natural behaviors (foraging, exploration, perching) and other forms of agency is already present if chicks are caged during rearing. Utility is possibly not null".
The percentiles were defined based on my intuition and the description of the 4 types of pain. The geometric mean of the defined percentiles implies null median utility for 1 h of fully healthy chicken life plus one of the below experiences:
Note this underestimates the uncertainty of the cost-effectiveness of MIF, as the cost-effectiveness of GiveDirectly is less uncertain than the other GiveWell's top charities.
"Our [Open Philanthropy's] new approach values a DALY averted twice as highly, equal to a 2-unit (rather than 1-unit) increase in the natural log of any individual’s income. (This is equivalent to increasing 200 people’s incomes by 1% – i.e., in our favored units, equal to $100K in units of marginal dollars to individuals making $50K.)".
I tend to believe disagreements about the relative improvement in the conditions of laying hens when these change from CC to CFA have been atenuated by WFP's research.
Calculated from the product between the mean conditions of laying hens in CC and the mean moral weight of chickens relative to humans, as these were modelled as independent.
In terms of CCCW, potential concerns with the estimates for the cost to improve conditions are discussed here. For global health and development, and therefore MIF, there is the meat-eater problem (quantified here) and unclear effects on population size, among others.


A very important factor here is that you give chickens an expected moral weight more than twice that of humans.
This is not just because of your particular model, but is rather intrinsic to Muelhauser's estimate: 10% of being above 10 (and 100% of being positive) necessarily means a mean above 1. Together with his 80% chance that they're moral patients, this gives at least a 0.8 conversion factor.
...which seems extremely high. I don't know anybody who'd agree with this.
Good flag! :)
Fwiw, looks like rerunning the analysis with the relative bounds on chicken moral worth being a ten-billionth to a thousandth of a human, rather than a twenty thousandth to 10 humans, still outputs a mean cost-effectiveness ratio of CCCW to MIF of ~1.3.
So though it is a pretty significant factor, choosing different values there seems unlikely by themselves to directionally change the output.
I also don't think that the expected moral weight of more than twice that of a human is that intrinsic to Muehlhauser numbers. Seems like it is more like something of an artifact that comes from putting a log-normal distribution to that confidence interval.
But I also I think it is all somewhat beside the point that could really be at play:
Note I used a loguniform distribution, not a lognormal (which would result in a mean of 1.50 k). In addition, normal, uniform, and logistic distributions would lead to 4.00.
Assuming total hedonic utilitarianism (classical utilitarisnism) carries most of the weight amongst various possible moral theories, I would say one can compare the experiences of humans with those of non-human animals.
I discussed concerns about calculating expected moral weights at length here.
Here, the moral weight is:
I think the ability to give credences to different views implies that they are somehow comparable with respect to an idealised truth, since the credence is sort of the probability of a view being true. I think about the moral weight as representing the knowledge about both "near-term human-centric" and "near term animal-centric" views. I think one cannot reasonably be confident that the latter has a very low credence, and therefore the 90th percentile of the moral weight distribution will tend to be close to 1, which implies a mean moral weight close to 1.
Yeah, I agree, dividing it by e.g. 1000 would only make a 10,000 ratio into 10.
The particular value is a result of the log-uniform distribution, but any distribution conforming to Muelhauser's confidence interval will give a mean in this neighborhood (i.e. at most ~3 times smaller).
This is a good point, thanks. Note that I have fitted 6 types of distributions to Muehlhauser's guesses for various species here, and concluded that:
I think a value close to 1 is not unreasonable. As described here, CE's Weighted Animal Welfare Index total welfare score and probability of feeling pain imply the conditions of laying hens in CC in -QALY/cyear is about 10 % of what my assumptions imply. 1 order of magnitude is not much considering the large uncertainty involved: the 95th percentile of the moral weight distribution I used is about 1 M times as large as the 5th percentile.
Moreover, I do not think we know enough about consciousness to confidently say that the moral cannot be larger than 1. As a result, for the reasons you mentioned, the mean moral weight will tend to be close to 1.